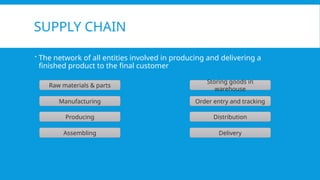
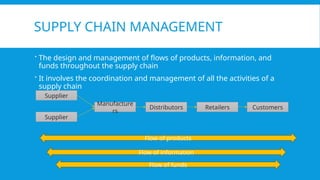
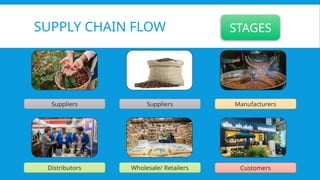
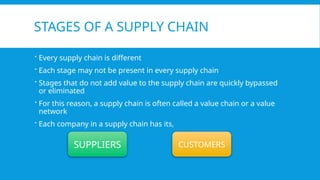
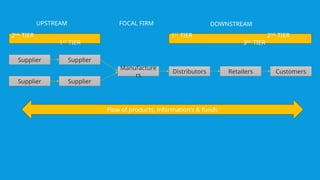
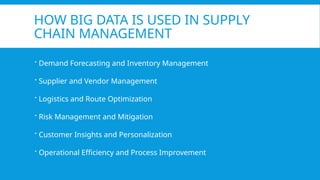
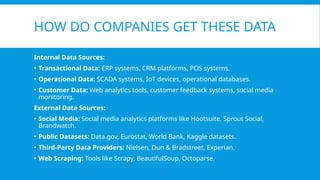
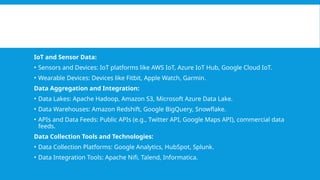
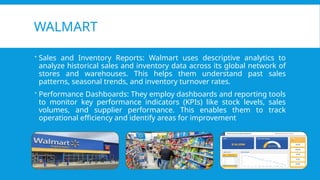
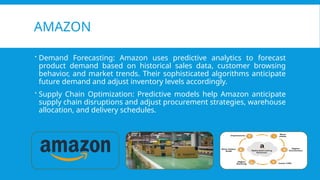
SUPPLY CHAIN MANAGEMENT
INTRODUCTION
POONTHAMIL.V
AP/ECE
Number of locations - 38, 038 (2023) Countries - 83 (2023)
SUPPLY CHAIN
 The network of all entities involved in producing and delivering a
finished product to the final customer
Raw materials & parts
Manufacturing
Producing
Assembling
Storing goods in
warehouse
Order entry and tracking
Distribution
Delivery
SUPPLY CHAIN MANAGEMENT
 The design and management of flows of products, information, and
funds throughout the supply chain
 It involves the coordination and management of all the activities of a
supply chain
Supplier
Supplier
Manufacture
rs
Distributors Retailers Customers
Flow of products
Flow of information
Flow of funds
SUPPLY CHAIN FLOW
Suppliers Suppliers Manufacturers
Distributors Wholesale/ Retailers Customers
STAGES
STAGES OF A SUPPLY CHAIN
 Every supply chain is different
 Each stage may not be present in every supply chain
 Stages that do not add value to the supply chain are quickly bypassed
or eliminated
 For this reason, a supply chain is often called a value chain or a value
network
 Each company in a supply chain has its,
SUPPLIERS CUSTOMERS
7
SUPPLY CHAIN NETWORK DESIGN
Role of Distribution in Supply Chain
Distribution refers to the steps taken to move and store a product from
the Supplier stage to Customer stage.
Eg:
Wal-Mart - High Product Availability & Low Price.
Seven-Eleven, Japan - Nearby Stores and not Low Price.
8
FACTORS INFLUENCING DISTRIBUTION NETWORK DESIGN
 Response Time
 Product Variety
 Product Availability
 Customer Experience
 Time to Market
 Order Visibility
 Returnability
Supplier
Supplier
Manufacture
rs
Distributors Retailers Customers
Supplier
Supplier
2ND
TIER
1ST
TIER
1ST
TIER 2ND
TIER
3RD
TIER
UPSTREAM FOCAL FIRM DOWNSTREAM
Flow of products, information's & funds
BIG DATA
WHAT IS BIG DATA
 Big Data refers to extremely large datasets that are complex and
growing at an exponential rate. These datasets are so vast and intricate
that traditional data processing tools and methods are insufficient for
handling them.
Big Data is characterized by the "Three Vs“
 Volume: The sheer amount of data generated from various sources,
including social media, sensors, transactions, and more.
 Velocity: The speed at which data is generated, processed, and
analyzed. This includes real-time or near-real-time data.
 Variety: The different types of data, including structured (e.g.,
databases), semi-structured (e.g., XML files), and unstructured (e.g.,
text, video).
HOW BIG DATA IS USED IN SUPPLY
CHAIN MANAGEMENT
 Demand Forecasting and Inventory Management
 Supplier and Vendor Management
 Logistics and Route Optimization
 Risk Management and Mitigation
 Customer Insights and Personalization
 Operational Efficiency and Process Improvement
HOW DO COMPANIES GET THESE DATA
Internal Data Sources:
• Transactional Data: ERP systems, CRM platforms, POS systems.
• Operational Data: SCADA systems, IoT devices, operational databases.
• Customer Data: Web analytics tools, customer feedback systems, social media
monitoring.
External Data Sources:
• Social Media: Social media analytics platforms like Hootsuite, Sprout Social,
Brandwatch.
• Public Datasets: Data.gov, Eurostat, World Bank, Kaggle datasets.
• Third-Party Data Providers: Nielsen, Dun & Bradstreet, Experian.
• Web Scraping: Tools like Scrapy, BeautifulSoup, Octoparse.
IoT and Sensor Data:
• Sensors and Devices: IoT platforms like AWS IoT, Azure IoT Hub, Google Cloud IoT.
• Wearable Devices: Devices like Fitbit, Apple Watch, Garmin.
Data Aggregation and Integration:
• Data Lakes: Apache Hadoop, Amazon S3, Microsoft Azure Data Lake.
• Data Warehouses: Amazon Redshift, Google BigQuery, Snowflake.
• APIs and Data Feeds: Public APIs (e.g., Twitter API, Google Maps API), commercial data
feeds.
Data Collection Tools and Technologies:
• Data Collection Platforms: Google Analytics, HubSpot, Splunk.
• Data Integration Tools: Apache Nifi, Talend, Informatica.
SUPPLY CHAIN ANALYTICS
 Supply Chain Analytics involves the use of data and statistical methods
to enhance decision-making and optimize supply chain operations.
 To turn raw data into actionable insights that improve efficiency,
reduce costs, and drive better decision-making.
Types
 Descriptive Analytics
 Predictive Analytics
 Prescriptive Analytics
DESCRIPTIVE ANALYTICS
 Descriptive analytics involves summarizing historical data to understand
what has happened in the past. It focuses on interpreting historical data to
identify trends and patterns
Key Concepts:
• Data Aggregation: Combining data from various sources to get a
comprehensive view of past performance.
• Data Visualization: Using charts, graphs, and dashboards to present
historical data in a meaningful way.
• Reporting: Generating regular reports to track key performance indicators
(KPIs) and metrics.
DESCRIPTIVE ANALYTICS -
APPLICATIONS
Application in Supply Chain:
• Analyzing past sales, inventory levels, and order fulfillment rates.
• Identifying patterns in supplier performance and customer demand.
• Monitoring supply chain operations to detect inefficiencies or issues
WALMART
 Sales and Inventory Reports: Walmart uses descriptive analytics to
analyze historical sales and inventory data across its global network of
stores and warehouses. This helps them understand past sales
patterns, seasonal trends, and inventory turnover rates.
 Performance Dashboards: They employ dashboards and reporting tools
to monitor key performance indicators (KPIs) like stock levels, sales
volumes, and supplier performance. This enables them to track
operational efficiency and identify areas for improvement
PREDICTIVE ANALYTICS
 Predictive analytics uses historical data and statistical algorithms to
forecast future outcomes. It aims to anticipate what might happen in
the future based on past trends.
Key Concepts:
• Statistical Modeling: Creating models to predict future events or
behaviors based on historical data.
• Machine Learning: Applying algorithms that learn from data to make
predictions and improve over time.
• Forecasting: Using time-series analysis and other techniques to project
future demand, inventory needs, and supply chain risks.
PREDICTIVE ANALYTICS - APPLICATION
Application in Supply Chain:
• Forecasting demand to optimize inventory levels and reduce stockouts
or overstock situations.
• Predicting supplier performance and identifying potential risks in the
supply chain.
• Estimating future transportation needs and optimizing routes.
AMAZON
 Demand Forecasting: Amazon uses predictive analytics to forecast
product demand based on historical sales data, customer browsing
behavior, and market trends. Their sophisticated algorithms anticipate
future demand and adjust inventory levels accordingly.
 Supply Chain Optimization: Predictive models help Amazon anticipate
supply chain disruptions and adjust procurement strategies, warehouse
allocation, and delivery schedules.
PRESCRIPTIVE ANALYTICS
 Prescriptive analytics provides recommendations for actions to optimize
outcomes. It not only predicts what might happen but also suggests the best
course of action to achieve desired results.
Key Concepts:
• Statistical Modeling: Creating models to predict future events or behaviors
based on historical data.
• Machine Learning: Applying algorithms that learn from data to make
predictions and improve over time.
• Forecasting: Using time-series analysis and other techniques to project
future demand, inventory needs, and supply chain risks.
UNILEVER
 Using advanced optimization algorithms and simulation models,
Unilever can recommend specific actions to minimize costs and
maximize efficiency. For instance, they use prescriptive analytics to
optimize their production schedules, distribution routes, and inventory
levels across their global supply chain.
• Unilever leverages prescriptive analytics to design efficient supply chain
strategies, optimize production and distribution schedules, and
recommend actions to mitigate risks and improve overall supply chain
performance
THANK YOU

Supply chain management - Introduction.pptx

  • 1.
  • 2.
    Number of locations- 38, 038 (2023) Countries - 83 (2023)
  • 3.
    SUPPLY CHAIN  Thenetwork of all entities involved in producing and delivering a finished product to the final customer Raw materials & parts Manufacturing Producing Assembling Storing goods in warehouse Order entry and tracking Distribution Delivery
  • 4.
    SUPPLY CHAIN MANAGEMENT The design and management of flows of products, information, and funds throughout the supply chain  It involves the coordination and management of all the activities of a supply chain Supplier Supplier Manufacture rs Distributors Retailers Customers Flow of products Flow of information Flow of funds
  • 5.
    SUPPLY CHAIN FLOW SuppliersSuppliers Manufacturers Distributors Wholesale/ Retailers Customers STAGES
  • 6.
    STAGES OF ASUPPLY CHAIN  Every supply chain is different  Each stage may not be present in every supply chain  Stages that do not add value to the supply chain are quickly bypassed or eliminated  For this reason, a supply chain is often called a value chain or a value network  Each company in a supply chain has its, SUPPLIERS CUSTOMERS
  • 7.
    7 SUPPLY CHAIN NETWORKDESIGN Role of Distribution in Supply Chain Distribution refers to the steps taken to move and store a product from the Supplier stage to Customer stage. Eg: Wal-Mart - High Product Availability & Low Price. Seven-Eleven, Japan - Nearby Stores and not Low Price.
  • 8.
    8 FACTORS INFLUENCING DISTRIBUTIONNETWORK DESIGN  Response Time  Product Variety  Product Availability  Customer Experience  Time to Market  Order Visibility  Returnability
  • 9.
    Supplier Supplier Manufacture rs Distributors Retailers Customers Supplier Supplier 2ND TIER 1ST TIER 1ST TIER2ND TIER 3RD TIER UPSTREAM FOCAL FIRM DOWNSTREAM Flow of products, information's & funds
  • 10.
  • 11.
    WHAT IS BIGDATA  Big Data refers to extremely large datasets that are complex and growing at an exponential rate. These datasets are so vast and intricate that traditional data processing tools and methods are insufficient for handling them. Big Data is characterized by the "Three Vs“  Volume: The sheer amount of data generated from various sources, including social media, sensors, transactions, and more.  Velocity: The speed at which data is generated, processed, and analyzed. This includes real-time or near-real-time data.  Variety: The different types of data, including structured (e.g., databases), semi-structured (e.g., XML files), and unstructured (e.g., text, video).
  • 12.
    HOW BIG DATAIS USED IN SUPPLY CHAIN MANAGEMENT  Demand Forecasting and Inventory Management  Supplier and Vendor Management  Logistics and Route Optimization  Risk Management and Mitigation  Customer Insights and Personalization  Operational Efficiency and Process Improvement
  • 13.
    HOW DO COMPANIESGET THESE DATA Internal Data Sources: • Transactional Data: ERP systems, CRM platforms, POS systems. • Operational Data: SCADA systems, IoT devices, operational databases. • Customer Data: Web analytics tools, customer feedback systems, social media monitoring. External Data Sources: • Social Media: Social media analytics platforms like Hootsuite, Sprout Social, Brandwatch. • Public Datasets: Data.gov, Eurostat, World Bank, Kaggle datasets. • Third-Party Data Providers: Nielsen, Dun & Bradstreet, Experian. • Web Scraping: Tools like Scrapy, BeautifulSoup, Octoparse.
  • 14.
    IoT and SensorData: • Sensors and Devices: IoT platforms like AWS IoT, Azure IoT Hub, Google Cloud IoT. • Wearable Devices: Devices like Fitbit, Apple Watch, Garmin. Data Aggregation and Integration: • Data Lakes: Apache Hadoop, Amazon S3, Microsoft Azure Data Lake. • Data Warehouses: Amazon Redshift, Google BigQuery, Snowflake. • APIs and Data Feeds: Public APIs (e.g., Twitter API, Google Maps API), commercial data feeds. Data Collection Tools and Technologies: • Data Collection Platforms: Google Analytics, HubSpot, Splunk. • Data Integration Tools: Apache Nifi, Talend, Informatica.
  • 15.
    SUPPLY CHAIN ANALYTICS Supply Chain Analytics involves the use of data and statistical methods to enhance decision-making and optimize supply chain operations.  To turn raw data into actionable insights that improve efficiency, reduce costs, and drive better decision-making. Types  Descriptive Analytics  Predictive Analytics  Prescriptive Analytics
  • 16.
    DESCRIPTIVE ANALYTICS  Descriptiveanalytics involves summarizing historical data to understand what has happened in the past. It focuses on interpreting historical data to identify trends and patterns Key Concepts: • Data Aggregation: Combining data from various sources to get a comprehensive view of past performance. • Data Visualization: Using charts, graphs, and dashboards to present historical data in a meaningful way. • Reporting: Generating regular reports to track key performance indicators (KPIs) and metrics.
  • 17.
    DESCRIPTIVE ANALYTICS - APPLICATIONS Applicationin Supply Chain: • Analyzing past sales, inventory levels, and order fulfillment rates. • Identifying patterns in supplier performance and customer demand. • Monitoring supply chain operations to detect inefficiencies or issues
  • 18.
    WALMART  Sales andInventory Reports: Walmart uses descriptive analytics to analyze historical sales and inventory data across its global network of stores and warehouses. This helps them understand past sales patterns, seasonal trends, and inventory turnover rates.  Performance Dashboards: They employ dashboards and reporting tools to monitor key performance indicators (KPIs) like stock levels, sales volumes, and supplier performance. This enables them to track operational efficiency and identify areas for improvement
  • 19.
    PREDICTIVE ANALYTICS  Predictiveanalytics uses historical data and statistical algorithms to forecast future outcomes. It aims to anticipate what might happen in the future based on past trends. Key Concepts: • Statistical Modeling: Creating models to predict future events or behaviors based on historical data. • Machine Learning: Applying algorithms that learn from data to make predictions and improve over time. • Forecasting: Using time-series analysis and other techniques to project future demand, inventory needs, and supply chain risks.
  • 20.
    PREDICTIVE ANALYTICS -APPLICATION Application in Supply Chain: • Forecasting demand to optimize inventory levels and reduce stockouts or overstock situations. • Predicting supplier performance and identifying potential risks in the supply chain. • Estimating future transportation needs and optimizing routes.
  • 21.
    AMAZON  Demand Forecasting:Amazon uses predictive analytics to forecast product demand based on historical sales data, customer browsing behavior, and market trends. Their sophisticated algorithms anticipate future demand and adjust inventory levels accordingly.  Supply Chain Optimization: Predictive models help Amazon anticipate supply chain disruptions and adjust procurement strategies, warehouse allocation, and delivery schedules.
  • 22.
    PRESCRIPTIVE ANALYTICS  Prescriptiveanalytics provides recommendations for actions to optimize outcomes. It not only predicts what might happen but also suggests the best course of action to achieve desired results. Key Concepts: • Statistical Modeling: Creating models to predict future events or behaviors based on historical data. • Machine Learning: Applying algorithms that learn from data to make predictions and improve over time. • Forecasting: Using time-series analysis and other techniques to project future demand, inventory needs, and supply chain risks.
  • 23.
    UNILEVER  Using advancedoptimization algorithms and simulation models, Unilever can recommend specific actions to minimize costs and maximize efficiency. For instance, they use prescriptive analytics to optimize their production schedules, distribution routes, and inventory levels across their global supply chain. • Unilever leverages prescriptive analytics to design efficient supply chain strategies, optimize production and distribution schedules, and recommend actions to mitigate risks and improve overall supply chain performance
  • 24.