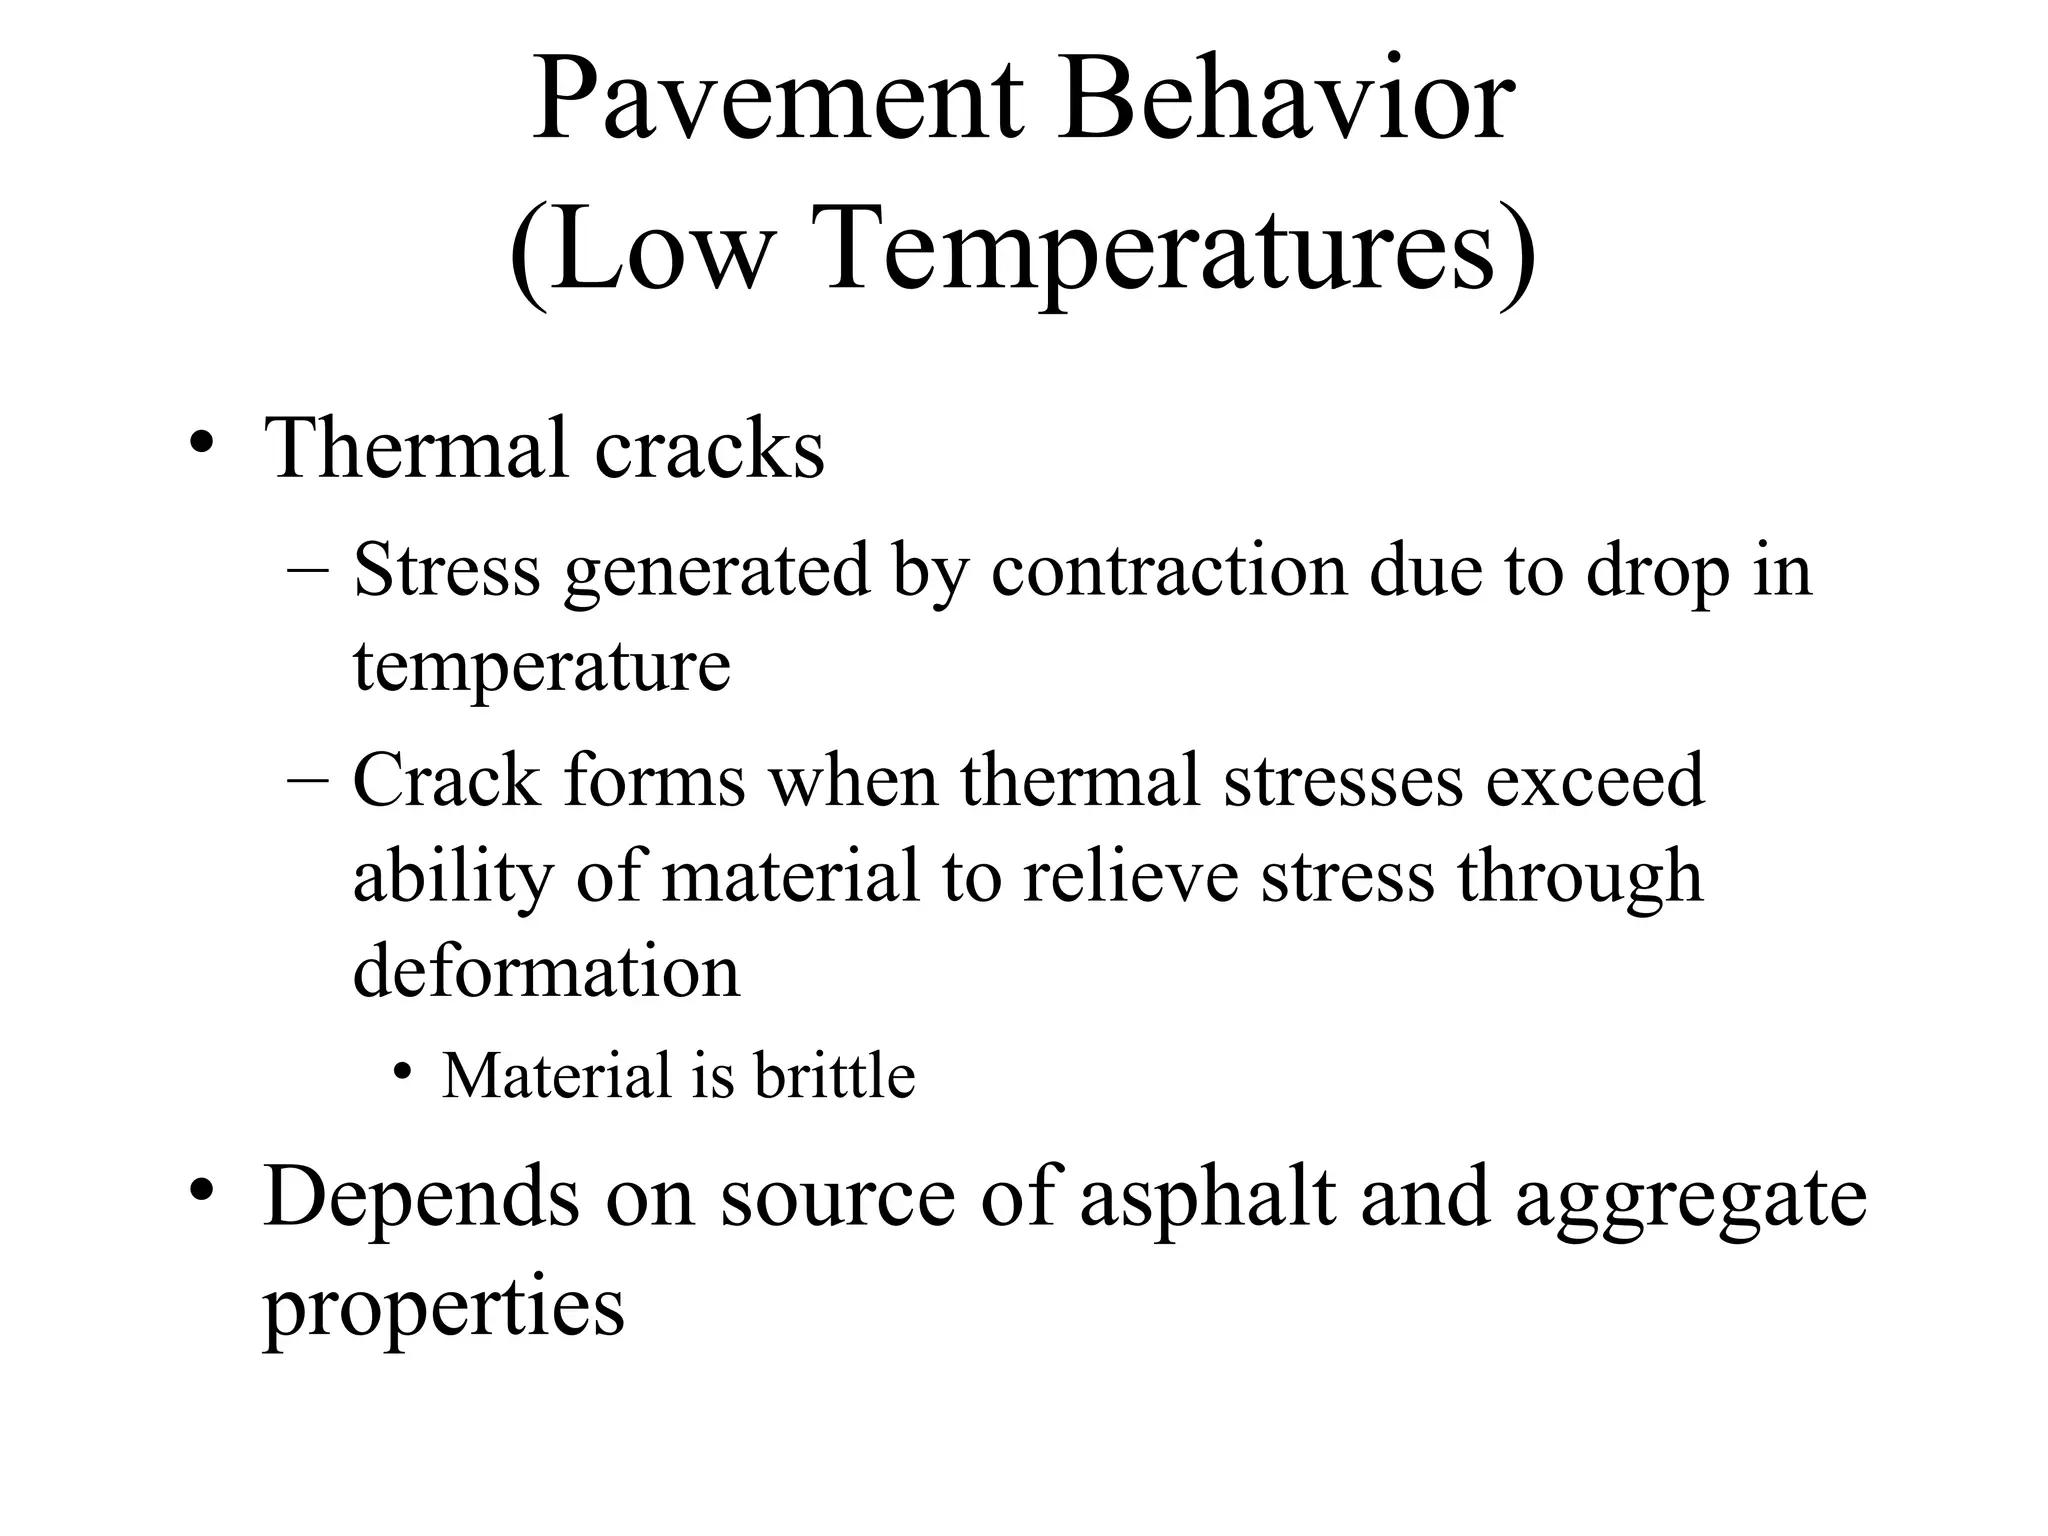
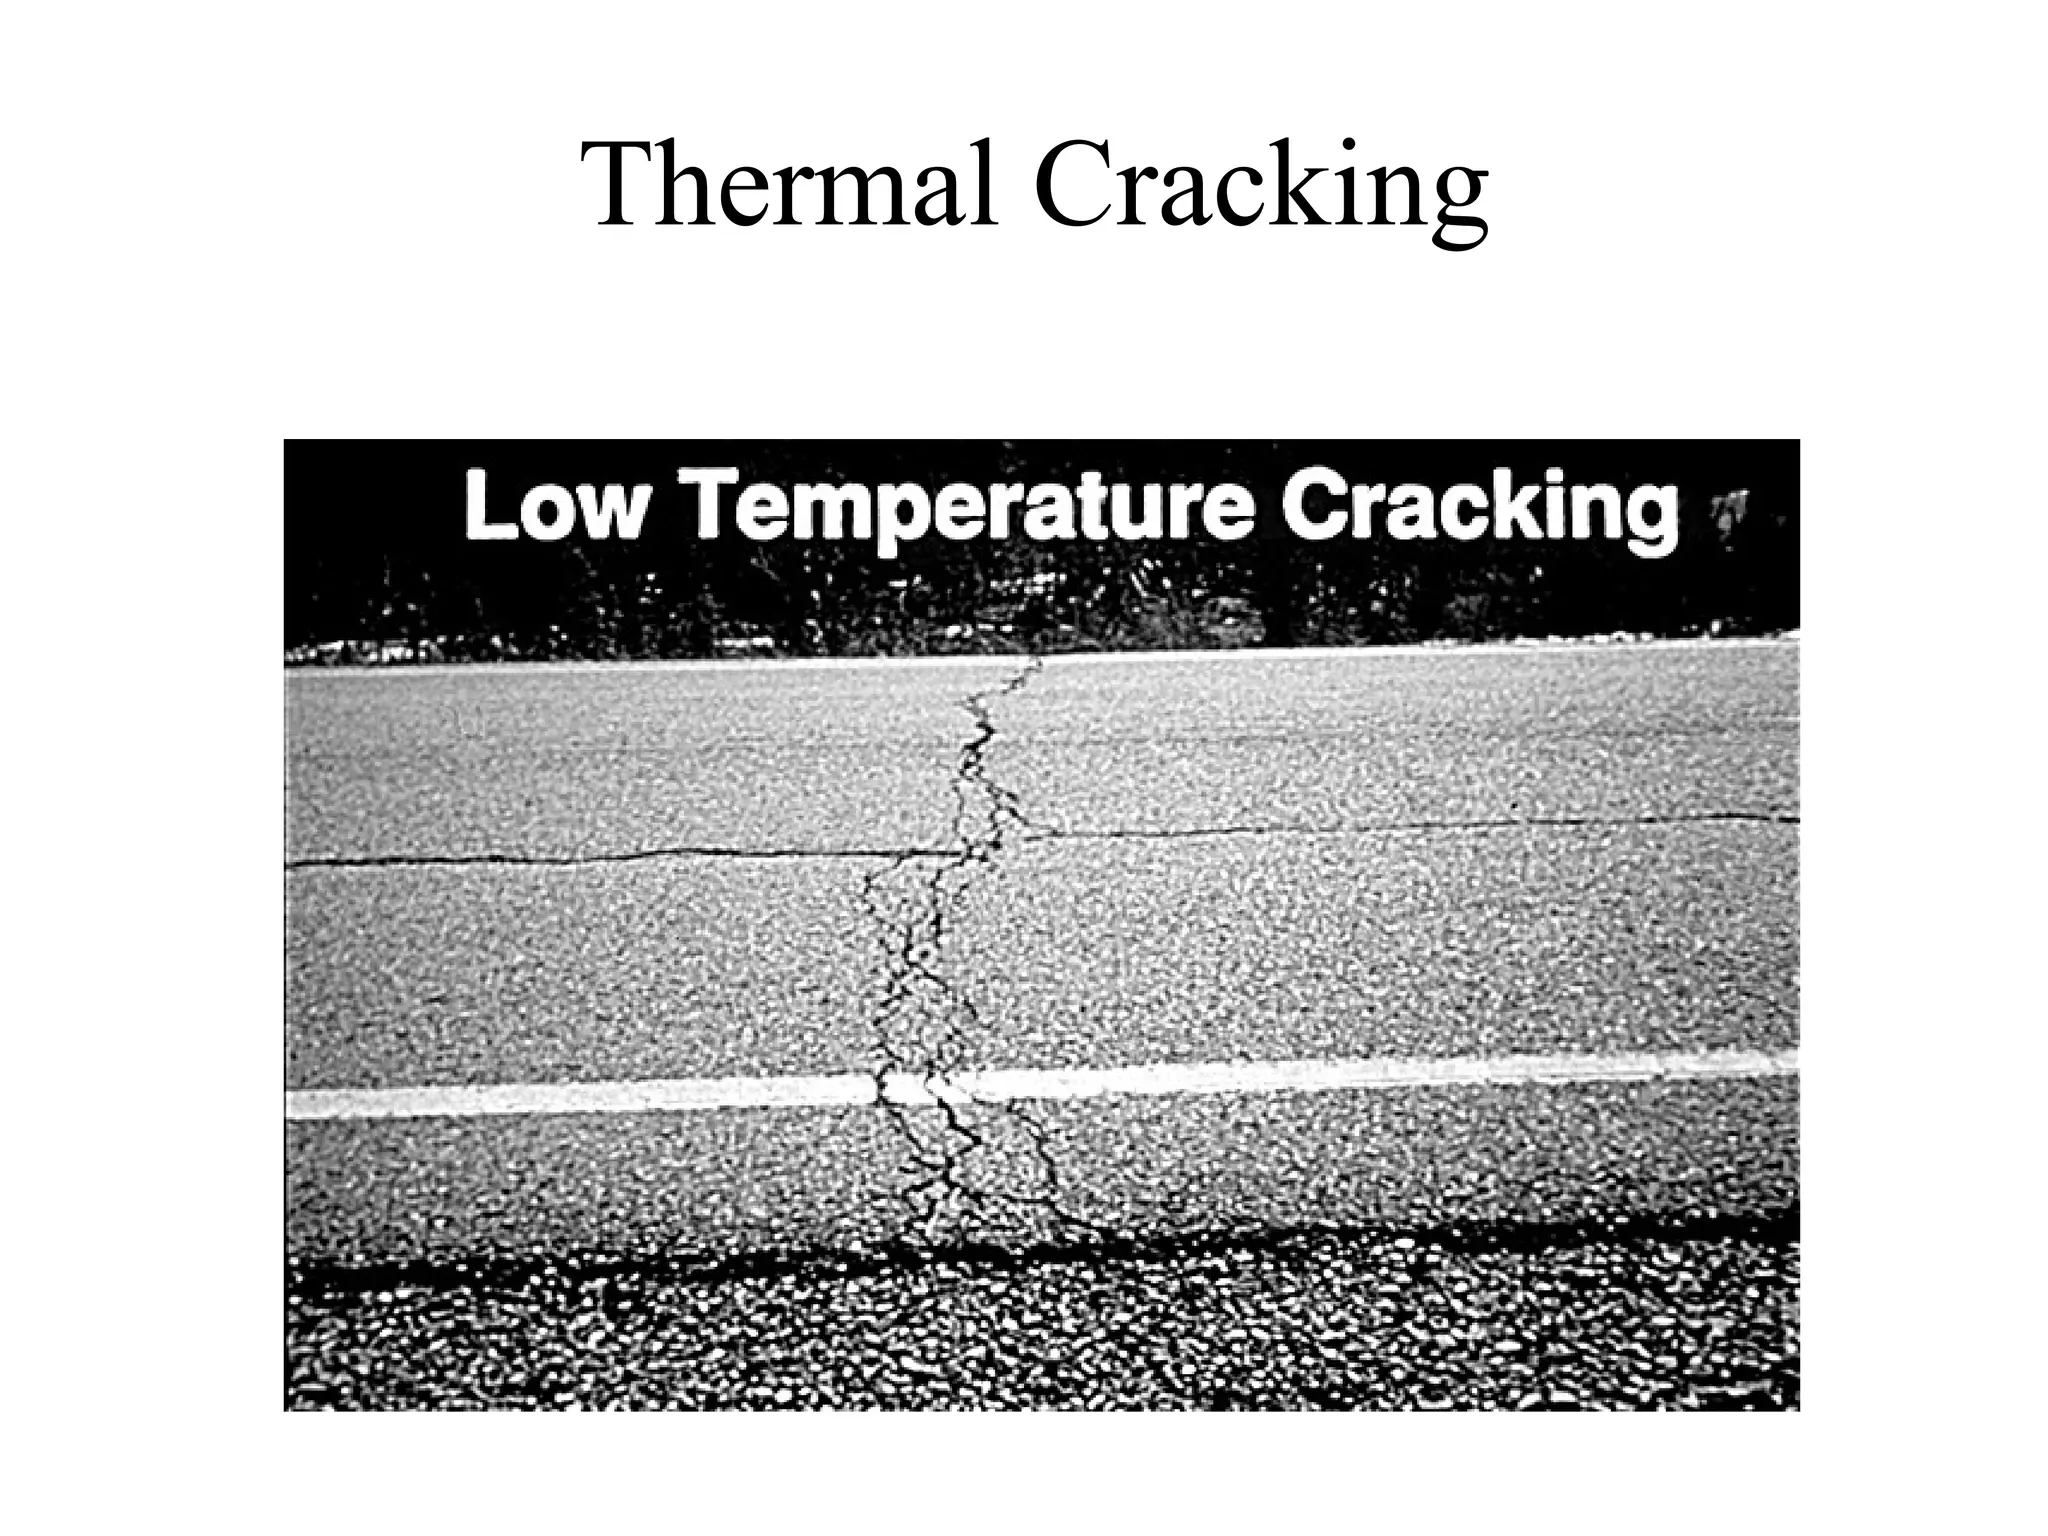
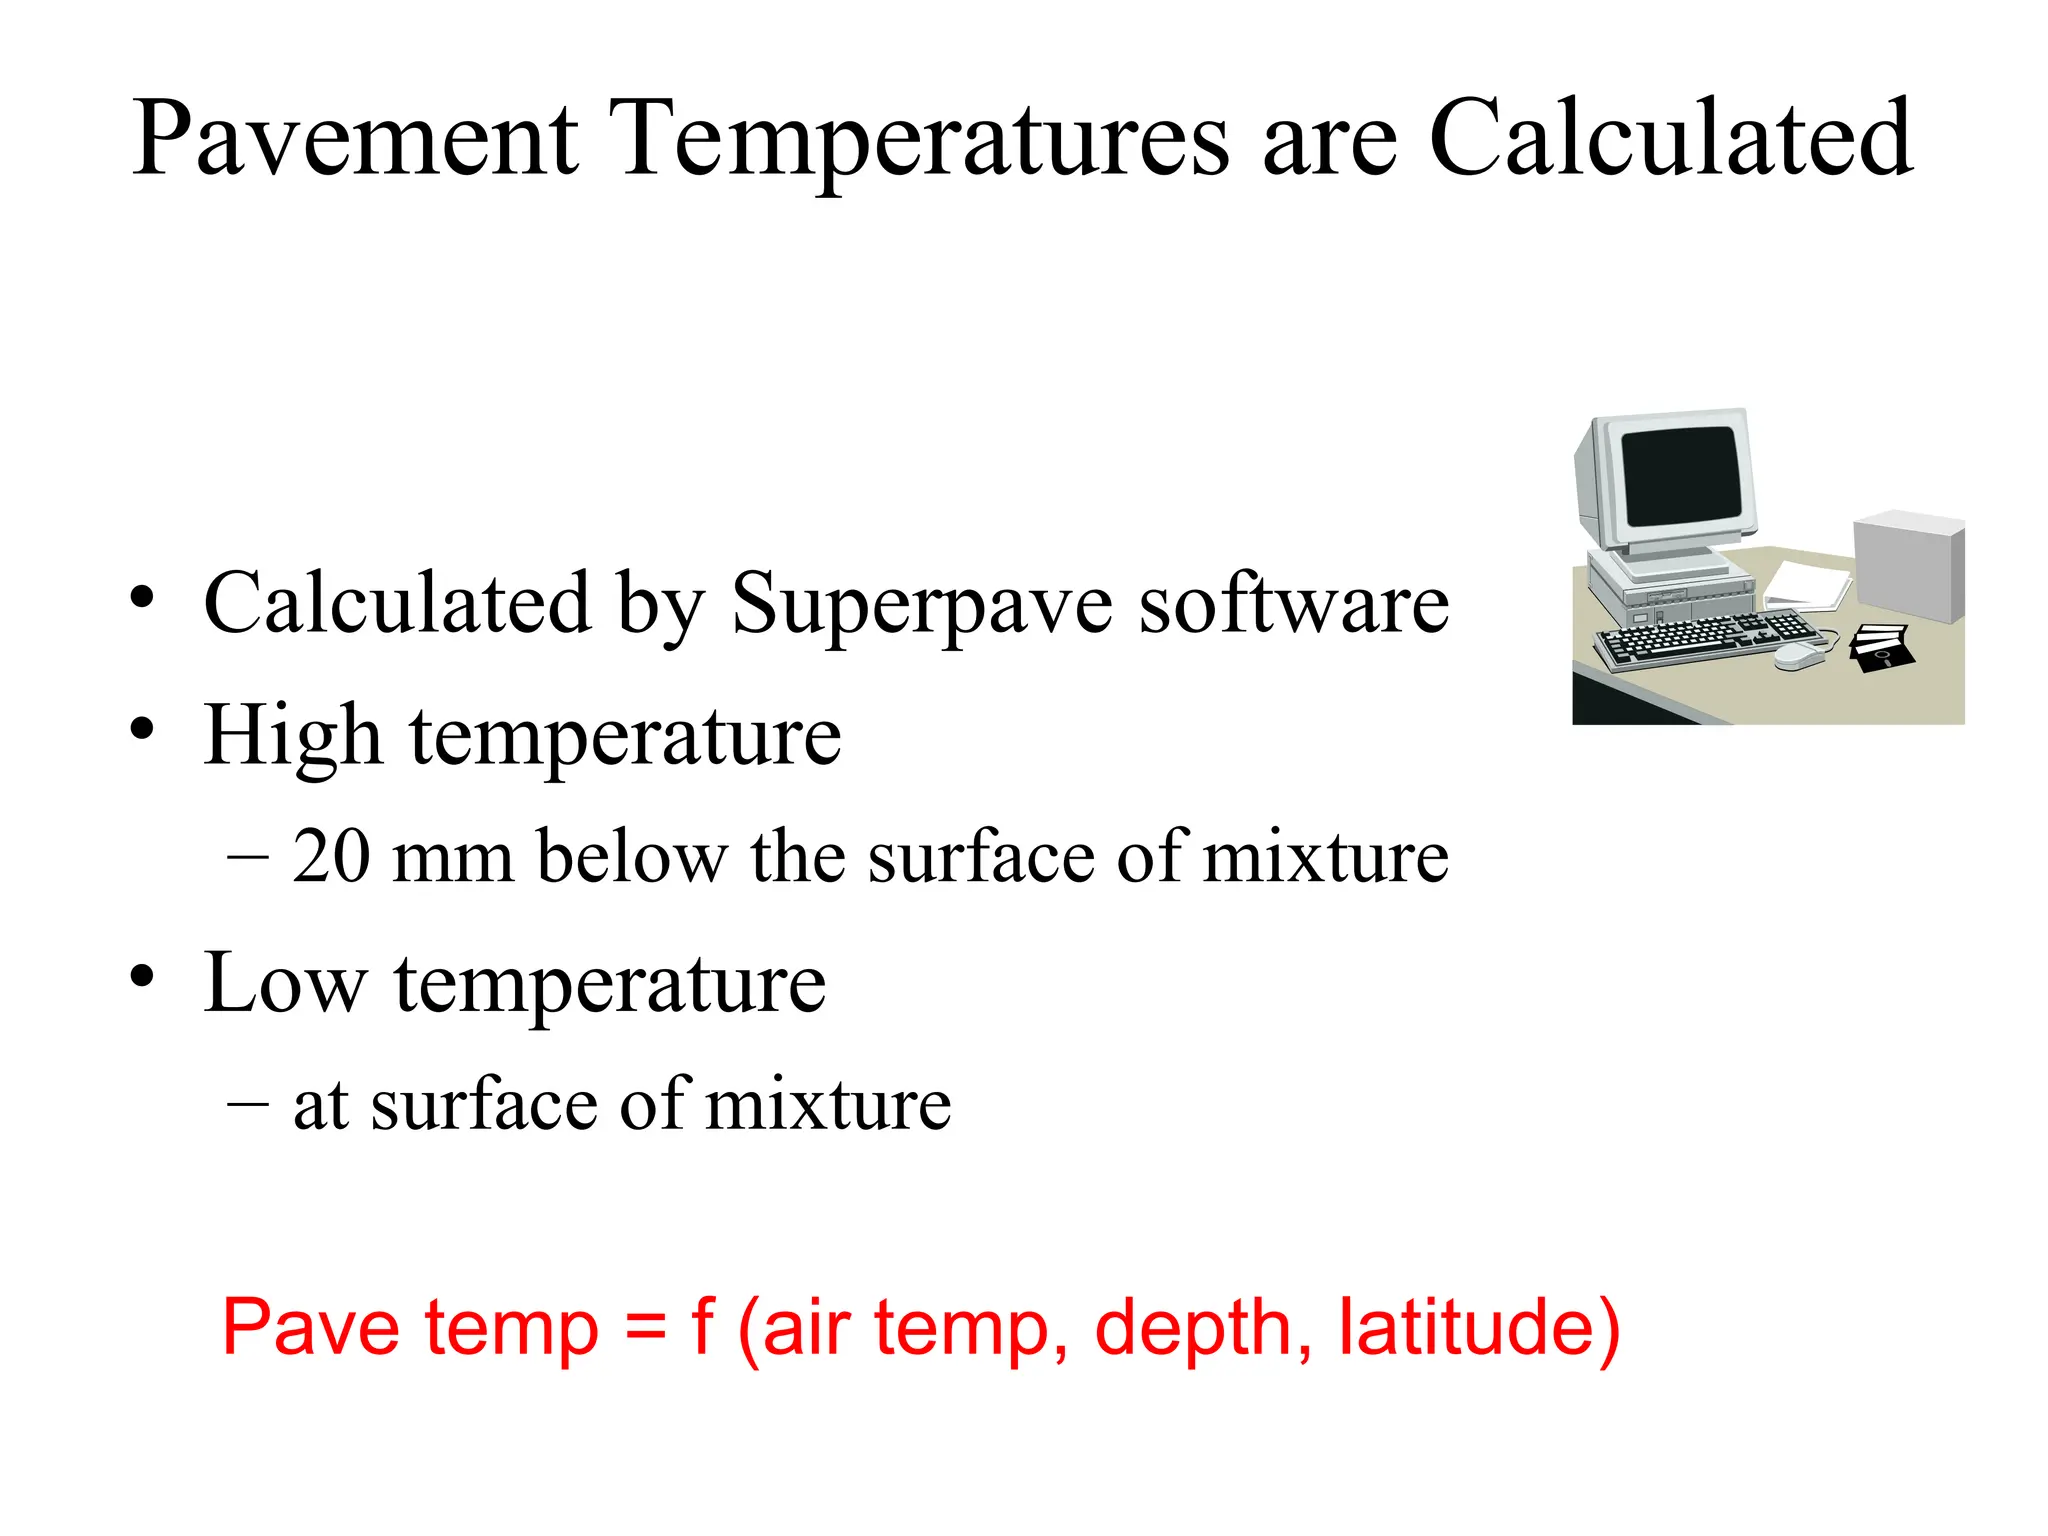
FHWA Condensed Superpave
Asphalt Specifications
Lecture Series
SUPERPAVE
Aggregates
Usually refers to a soil that has in some way
been processed or sorted.
Aggregate Size Definitions
• Nominal Maximum Aggregate Size
– one size larger than the first sieve to retain
more than 10%
• Maximum Aggregate Size
– one size larger than nominal maximum
size
100
100
100
100
90
90
72
72
65
65
48
48
36
36
22
22
15
15
9
9
4
4
100
100
99
99
89
89
72
72
65
65
48
48
36
36
22
22
15
15
9
9
4
4
100
100
0
0
.075
.075 .3
.3 2.36
2.36 4.75
4.75 9.5
9.5 12.5 19.0
12.5 19.0
Percent Passing
Percent Passing
control point
control point
restricted zone
restricted zone
max density line
max density line
max
max
size
size
nom
nom
max
max
size
size
Sieve Size (mm) Raised to 0.45 Power
Superpave Aggregate Gradation
100
100
0
0
.075
.075 .3
.3 2.36
2.36 12.5
12.5 19.0
19.0
Percent Passing
Percent Passing
Design Aggregate Structure
Sieve Size (mm) Raised to 0.45 Power
Superpave Mix Size
Designations
Superpave
Superpave Nom Max Size
Nom Max Size Max Size
Max Size
Designation
Designation (mm)
(mm) (mm)
(mm)
37.5 mm
37.5 mm 37.5
37.5 50
50
25 mm
25 mm 25
25 37.5
37.5
19 mm
19 mm 19
19 25
25
12.5 mm
12.5 mm 12.5
12.5 19
19
9.5 mm
9.5 mm 9.5
9.5 12.5
12.5
Gradations
* Considerations:
- Max. size < 1/2 AC lift thickness
- Larger max size
+ Increases strength
+ Improves skid resistance
+ Increases volume and surface area of agg
which decreases required AC content
+ Improves rut resistance
+ Increases problem with segregation of particles
- Smaller max size
+ Reduces segregation
+ Reduces road noise
+ Decreases tire wear
Percent Crushed Fragments in
Gravels
• Quarried materials always 100% crushed
• Minimum values depended upon traffic
level and layer (lift)
• Defined as % mass with one or more
fractured faces
Percent Crushed Fragments in
Gravels
0% Crushed 100% with 2 or More
Crushed Faces
Coarse Aggregate Angularity
Criteria
Traffic Depth from Surface
Millions of ESALs < 100 mm > 100
mm
< 0.3
< 1
< 3
< 10
< 30
< 100
 100
55/--
65/--
75/--
85/80
95/90
100/100
100/100
--/--
--/--
50/--
60/--
80/75
95/90
100/100
First number denotes % with one or more fractured faces
Second number denotes % with two or more fractured faces
Asphalt Cements
Background
History of Specifications
Background
• Asphalt
– Soluble in petroleum
products
– Generally a by-product of
petroleum distillation
process
– Can be naturally occurring
• Tar
– Resistant to
petroleum products
– Generally by-product
of coke (from coal)
production
Penetration Testing
• Sewing machine needle
• Specified load, time, temperature
100 g
Initial
Penetration in 0.1 mm
After 5 seconds
Penetration Specification
• Five Grades
• 40 - 50
• 60 - 70
• 85 - 100
• 120 - 150
• 200 - 300
Ductility
Typical Penetration Specifications
Penetration
Penetration 40 - 50
40 - 50 200 - 300
200 - 300
Flash Point, C
Flash Point, C 450+
450+ 350+
350+
Ductility, cm
Ductility, cm 100+
100+ 100+
100+
Solubility, %
Solubility, % 99.0+
99.0+ 99.0+
99.0+
Retained Pen., % 55+
Retained Pen., % 55+ 37+
37+
Ductility, cm
Ductility, cm NA
NA 100+
100+
Viscosity Graded Specifications
Types of Viscosity Tubes
Asphalt Institute Tube
Zietfuchs Cross-Arm
Tube
Table 1 Example
AC 2.5
AC 2.5 AC 40
AC 40
Visc, 60C
Visc, 60C 250
250 +
+ 50 4,000
50 4,000 +
+ 800
800
Visc, 135C
Visc, 135C 80+
80+ 300+
300+
Penetration
Penetration 200+
200+ 20+
20+
Visc, 60C
Visc, 60C <1,250
<1,250 <20,000
<20,000
Ductility
Ductility 100+
100+ 10+
10+
40
50
60
70
85
100
120
150
200
300
Penetration Grades
AC 40
AC 20
AC 10
AC 5
AC 2.5
100
50
10
5
Viscosity,
60C
(140F)
Asphalt Cements
New Superpave Performance Graded Specification
PG Specifications
• Fundamental properties related to
pavement performance
• Environmental factors
• In-service & construction temperatures
• Short and long term aging
High Temperature Behavior
• High in-service temperature
– Desert climates
– Summer temperatures
• Sustained loads
– Slow moving trucks
– Intersections
Viscous Liquid
Pavement Behavior
(Warm Temperatures)
• Permanent deformation (rutting)
• Mixture is plastic
• Depends on asphalt source, additives, and
aggregate properties
Permanent Deformation
Function of warm weather and traffic
Courtesy of FHWA
Low Temperature Behavior
• Low Temperature
– Cold climates
– Winter
• Rapid Loads
– Fast moving trucks
Elastic Solid
 E
Hooke’s Law
Pavement Behavior
(Low Temperatures)
• Thermal cracks
– Stress generated by contraction due to drop in
temperature
– Crack forms when thermal stresses exceed
ability of material to relieve stress through
deformation
• Material is brittle
• Depends on source of asphalt and aggregate
properties
Thermal Cracking
Courtesy of FHWA
Superpave Asphalt Binder
Specification
The grading system is based on Climate
PG 64 - 22
Performance
Grade
Average 7-day max
pavement temperature
Min pavement
temperature
Pavement Temperatures are Calculated
• Calculated by Superpave software
• High temperature
– 20 mm below the surface of mixture
• Low temperature
– at surface of mixture
Pave temp = f (air temp, depth, latitude)
 Concentric Cylinder
Concentric Cylinder Rheometers
R
Mi
Ri
2
L

R
Ro - Ri
Dynamic Shear Rheometer (DSR)
• Parallel Plate Shear flow varies with
gap height and radius
Non-homogeneous flow
R =
R 
h
R =
2 M
R3
Short Term Binder Aging
• Rolling Thin Film Oven
– Simulates aging from hot mixing and construction
Pressure Aging Vessel
(Long Term Aging)
• Simulates aging of an asphalt
binder for 7 to 10 years
• 50 gram sample is aged for 20
hours
• Pressure of 2,070 kPa (300 psi)
• At 90, 100 or 110 C
Bending Beam Rheometer
Air Bearing
Load Cell
Deflection Transducer
Fluid Bath
Computer
Direct Tension Test
 Le
 L
Load
Stress = = P / A
Strain
f
f
Summary
Fatigue
Cracking
Rutting
RTFO
Short Term Aging
No aging
Construction
[RV]
[DSR]
Low Temp
Cracking
[BBR]
[DTT]
[DTT]
PAV
Long Term Aging
Superpave Binder
Purchase Specification
Superpave Asphalt Binder
Specification
The grading system is based on Climate
PG 64 - 22
Performance
Grade
Average 7-day max
pavement temperature
Min pavement
temperature
PG 46 PG 52 PG 58 PG 64 PG 70 PG 76 PG 82
(Rotational Viscosity) RV
90 90 100 100 100 (110) 100 (110) 110 (110)
(Flash Point) FP
46 52 58 64 70 76 82
46 52 58 64 70 76 82
(ROLLING THIN FILM OVEN)
(ROLLING THIN FILM OVEN) RTFO
RTFO Mass Loss
Mass Loss <
< 1.00 %
1.00 %
(Direct Tension) DT
(Bending Beam Rheometer) BBR Physical Hardening
28
-34 -40 -46 -10 -16 -22 -28 -34 -40 -46 -16 -22 -28 -34 -40 -10 -16 -22 -28 -34 -40 -10 -16 -22 -28 -34 -40 -10 -16 -22 -28 -34 -10 -16 -22
-28 -34
Avg 7-day Max, o
C
1-day Min, o
C
(PRESSURE AGING VESSEL)
(PRESSURE AGING VESSEL) PAV
PAV
ORIGINAL
ORIGINAL
> 1.00 kPa
< 5000 kPa
> 2.20 kPa
S < 300 MPa m > 0.300
Report Value
> 1.00 %
20 Hours, 2.07 MPa
10 7 4 25 22 19 16 13 10 7 25 22 19 16 13 31 28 25 22 19 16 34 31 28 25 22 19 37 34 31 28 25 40 37 34 31
(Dynamic Shear Rheometer) DSR G* sin 
( Bending Beam Rheometer) BBR “S” Stiffness & “m”- value
-24 -30 -36 0 -6 -12 -18 -24 -30 -36 -6 -12 -18 -24 -30 0 -6 -12 -18 -24 -30 0 -6 -12 -18 -24 -30 0 -6 -12 -18 -24 0 -6 -12
-18 -24
-24 -30 -36 0 -6 -12 -18 -24 -30 -36 -6 -12 -18 -24 -30 0 -6 -12 -18 -24 -30 0 -6 -12 -18 -24 -30 0 -6 -12 -18 -24 0 -6 -12
-18 -24
P
Performance
erformance G
Grades
rades
(Dynamic Shear Rheometer) DSR G*/sin 
< 3 Pa.s @ 135 o
C
> 230 o
C
CEC
PG 46 PG 52 PG 58 PG 64 PG 70 PG 76 PG 82
(Rotational Viscosity) RV
90 90 100 100 100 (110) 100 (110) 110 (110)
(Flash Point) FP
46 52 58 64 70 76 82
46 52 58 64 70 76 82
(ROLLING THIN FILM OVEN)
(ROLLING THIN FILM OVEN) RTFO
RTFO Mass Loss
Mass Loss <
< 1.00 %
1.00 %
(Direct Tension) DT
(Bending Beam Rheometer) BBR Physical Hardening
28
-34 -40 -46 -10 -16 -22 -28 -34 -40 -46 -16 -22 -28 -34 -40 -10 -16 -22 -28 -34 -40 -10 -16 -22 -28 -34 -40 -10 -16 -22 -28 -34 -10 -16 -22
-28 -34
Avg 7-day Max, o
C
1-day Min, o
C
(PRESSURE AGING VESSEL)
(PRESSURE AGING VESSEL) PAV
PAV
ORIGINAL
ORIGINAL
< 5000 kPa
> 2.20 kPa
S < 300 MPa m > 0.300
Report Value
> 1.00 %
20 Hours, 2.07 MPa
10 7 4 25 22 19 16 13 10 7 25 22 19 16 13 31 28 25 22 19 16 34 31 28 25 22 19 37 34 31 28 25 40 37 34 31
(Dynamic Shear Rheometer) DSR G* sin 
( Bending Beam Rheometer) BBR “S” Stiffness & “m”- value
-24 -30 -36 0 -6 -12 -18 -24 -30 -36 -6 -12 -18 -24 -30 0 -6 -12 -18 -24 -30 0 -6 -12 -18 -24 -30 0 -6 -12 -18 -24 0 -6 -12
-18 -24
-24 -30 -36 0 -6 -12 -18 -24 -30 -36 -6 -12 -18 -24 -30 0 -6 -12 -18 -24 -30 0 -6 -12 -18 -24 -30 0 -6 -12 -18 -24 0 -6 -12
-18 -24
How the PG Spec Works
(Dynamic Shear Rheometer) DSR G*/sin 
< 3 Pa.s @ 135 o
C
> 230 o
C
CEC
58 64
Test Temperature
Test Temperature
Changes
Changes
Spec Requirement
Spec Requirement
Remains Constant
Remains Constant
> 1.00 kPa
PG 58-22
PG 58-22
PG 52-28
PG 64-10
PG 64-10
PG 58-16
PG 58-16
> Many agencies have
established zones
PG Binder Selection
Summary of How to Use
PG Specification
• Determine
– 7-day max pavement temperatures
– 1-day minimum pavement temperature
• Use specification tables to select test
temperatures
• Determine asphalt cement properties
and compare to specification limits
Asphalt Concrete Mix
Design
History
Hot Mix Asphalt Concrete
(HMA)
Mix Designs
• Objective:
– Develop an economical blend of aggregates and
asphalt that meet design requirements
• Historical mix design methods
– Marshall
– Hveem
• New
– Superpave gyratory
Requirements in Common
• Sufficient asphalt to ensure a durable pavement
• Sufficient stability under traffic loads
• Sufficient air voids
– Upper limit to prevent excessive environmental
damage
– Lower limit to allow room for initial densification due
to traffic
• Sufficient workability
MARSHALL
MIX
DESIGN
Marshall Mix Design
• Developed by Bruce Marshall for the
Mississippi Highway Department in the late
30’s
• WES began to study it in 1943 for WWII
– Evaluated compaction effort
• No. of blows, foot design, etc.
• Decided on 10 lb.. Hammer, 50 blows/side
• 4% voids after traffic
• Initial criteria were established and upgraded
for increased tire pressures and loads
Marshall Mix Design
• Select and test aggregate
• Select and test asphalt cement
– Establish mixing and compaction
temperatures
• Develop trial blends
– Heat and mix asphalt cement and
aggregates
– Compact specimen (100 mm diameter)
Marshall Design Criteria
Light Traffic Medium Traffic Heavy Traffic
ESAL < 104
10 4
< ESAL< 10 ESAL > 106
Compaction 35 50 75
Stability N (lb.) 3336 (750) 5338 (1200) 8006 (1800)
Flow, 0.25 mm (0.1 in) 8 to 18 8 to 16 8 to 14
Air Voids, % 3 to 5 3 to 5 3 to 5
Voids in Mineral Agg.
(VMA) Varies with aggregate size
Asphalt Concrete Mix
Design
Superpave
Superpave Volumetric Mix
Design
• Goals
– Compaction method which simulates field
– Accommodates large size aggregates
– Measure of compactibility
– Able to use in field labs
– Address durability issues
• Film thickness
• Environmental
reaction
frame
rotating
base
loading
ram
control and data
acquisition panel
mold
height
measurement
tilt bar
Key Components of Gyratory Compactor
Compaction
Compaction
• Gyratory compactor
– Axial and shearing action
– 150 mm diameter molds
• Aggregate size up to 37.5 mm
• Height measurement during compaction
– Allows densification during compaction to be
evaluated
1.25o
Ram pressure
600 kPa
% G
% Gmm
mm
Log Gyrations
Log Gyrations
10
10 100
100 1000
1000
N
Nini
ini
N
Ndes
des
N
Nmax
max
Three Points on SGC
Curve
SGC Critical Point Comparison
%Gmm= Gmb / Gmm
Gmb = Bulk Mix Specific Gravity from compaction at N
cycles
Gmm = Max. Theoretical Specific Gravity
Compare to allowable values at:
NINI : %Gmm < 89%
NDES: %Gmm < 96%
NMAX: %Gmm < 98%
Design Compaction
• Ndes based on
– average design high air temp
– traffic level
• Log Nmax = 1.10 Log Ndes
• Log Nini = 0.45 Log Ndes
% Gmm
Log Gyrations
10 100 1000
Nini
Ndes
Nmax
Superpave Testing
• Specimen heights
• Mixture volumetrics
– Air voids
– Voids in mineral aggregate (VMA)
– Voids filled with asphalt (VFA)
– Mixture density characteristics
• Dust proportion
• Moisture sensitivity
Superpave Mix Design
• Determine mix properties at NDesign and compare to criteria
– Air voids 4% (or 96% Gmm)
– VMA See table
– VFA See table
– %Gmm at Nini < 89%
– %Gmmat Nmax < 98%
– Dust proportion 0.6 to 1.2
Superpave Mix Design
Gyratory Compaction Criteria

Super pave tested and Design for road.ppt

  • 1.
    FHWA Condensed Superpave AsphaltSpecifications Lecture Series SUPERPAVE
  • 2.
    Aggregates Usually refers toa soil that has in some way been processed or sorted.
  • 3.
    Aggregate Size Definitions •Nominal Maximum Aggregate Size – one size larger than the first sieve to retain more than 10% • Maximum Aggregate Size – one size larger than nominal maximum size 100 100 100 100 90 90 72 72 65 65 48 48 36 36 22 22 15 15 9 9 4 4 100 100 99 99 89 89 72 72 65 65 48 48 36 36 22 22 15 15 9 9 4 4
  • 4.
    100 100 0 0 .075 .075 .3 .3 2.36 2.364.75 4.75 9.5 9.5 12.5 19.0 12.5 19.0 Percent Passing Percent Passing control point control point restricted zone restricted zone max density line max density line max max size size nom nom max max size size Sieve Size (mm) Raised to 0.45 Power Sieve Size (mm) Raised to 0.45 Power
  • 5.
    Superpave Aggregate Gradation 100 100 0 0 .075 .075.3 .3 2.36 2.36 12.5 12.5 19.0 19.0 Percent Passing Percent Passing Design Aggregate Structure Design Aggregate Structure Sieve Size (mm) Raised to 0.45 Power Sieve Size (mm) Raised to 0.45 Power
  • 6.
    Superpave Mix Size Designations Superpave SuperpaveNom Max Size Nom Max Size Max Size Max Size Designation Designation (mm) (mm) (mm) (mm) 37.5 mm 37.5 mm 37.5 37.5 50 50 25 mm 25 mm 25 25 37.5 37.5 19 mm 19 mm 19 19 25 25 12.5 mm 12.5 mm 12.5 12.5 19 19 9.5 mm 9.5 mm 9.5 9.5 12.5 12.5
  • 7.
    Gradations * Considerations: - Max.size < 1/2 AC lift thickness - Larger max size + Increases strength + Improves skid resistance + Increases volume and surface area of agg which decreases required AC content + Improves rut resistance + Increases problem with segregation of particles - Smaller max size + Reduces segregation + Reduces road noise + Decreases tire wear
  • 8.
    Percent Crushed Fragmentsin Gravels • Quarried materials always 100% crushed • Minimum values depended upon traffic level and layer (lift) • Defined as % mass with one or more fractured faces
  • 9.
    Percent Crushed Fragmentsin Gravels 0% Crushed 100% with 2 or More Crushed Faces
  • 10.
    Coarse Aggregate Angularity Criteria TrafficDepth from Surface Millions of ESALs < 100 mm > 100 mm < 0.3 < 1 < 3 < 10 < 30 < 100  100 55/-- 65/-- 75/-- 85/80 95/90 100/100 100/100 --/-- --/-- 50/-- 60/-- 80/75 95/90 100/100 First number denotes % with one or more fractured faces Second number denotes % with two or more fractured faces
  • 11.
  • 12.
    Background • Asphalt – Solublein petroleum products – Generally a by-product of petroleum distillation process – Can be naturally occurring • Tar – Resistant to petroleum products – Generally by-product of coke (from coal) production
  • 13.
    Penetration Testing • Sewingmachine needle • Specified load, time, temperature 100 g Initial Penetration in 0.1 mm After 5 seconds
  • 14.
    Penetration Specification • FiveGrades • 40 - 50 • 60 - 70 • 85 - 100 • 120 - 150 • 200 - 300
  • 15.
  • 16.
    Typical Penetration Specifications Penetration Penetration40 - 50 40 - 50 200 - 300 200 - 300 Flash Point, C Flash Point, C 450+ 450+ 350+ 350+ Ductility, cm Ductility, cm 100+ 100+ 100+ 100+ Solubility, % Solubility, % 99.0+ 99.0+ 99.0+ 99.0+ Retained Pen., % 55+ Retained Pen., % 55+ 37+ 37+ Ductility, cm Ductility, cm NA NA 100+ 100+
  • 17.
  • 18.
    Types of ViscosityTubes Asphalt Institute Tube Zietfuchs Cross-Arm Tube
  • 19.
    Table 1 Example AC2.5 AC 2.5 AC 40 AC 40 Visc, 60C Visc, 60C 250 250 + + 50 4,000 50 4,000 + + 800 800 Visc, 135C Visc, 135C 80+ 80+ 300+ 300+ Penetration Penetration 200+ 200+ 20+ 20+ Visc, 60C Visc, 60C <1,250 <1,250 <20,000 <20,000 Ductility Ductility 100+ 100+ 10+ 10+
  • 20.
    40 50 60 70 85 100 120 150 200 300 Penetration Grades AC 40 AC20 AC 10 AC 5 AC 2.5 100 50 10 5 Viscosity, 60C (140F)
  • 21.
    Asphalt Cements New SuperpavePerformance Graded Specification
  • 22.
    PG Specifications • Fundamentalproperties related to pavement performance • Environmental factors • In-service & construction temperatures • Short and long term aging
  • 23.
    High Temperature Behavior •High in-service temperature – Desert climates – Summer temperatures • Sustained loads – Slow moving trucks – Intersections Viscous Liquid
  • 24.
    Pavement Behavior (Warm Temperatures) •Permanent deformation (rutting) • Mixture is plastic • Depends on asphalt source, additives, and aggregate properties
  • 25.
    Permanent Deformation Function ofwarm weather and traffic Courtesy of FHWA
  • 26.
    Low Temperature Behavior •Low Temperature – Cold climates – Winter • Rapid Loads – Fast moving trucks Elastic Solid  E Hooke’s Law
  • 27.
    Pavement Behavior (Low Temperatures) •Thermal cracks – Stress generated by contraction due to drop in temperature – Crack forms when thermal stresses exceed ability of material to relieve stress through deformation • Material is brittle • Depends on source of asphalt and aggregate properties
  • 28.
  • 29.
    Superpave Asphalt Binder Specification Thegrading system is based on Climate PG 64 - 22 Performance Grade Average 7-day max pavement temperature Min pavement temperature
  • 30.
    Pavement Temperatures areCalculated • Calculated by Superpave software • High temperature – 20 mm below the surface of mixture • Low temperature – at surface of mixture Pave temp = f (air temp, depth, latitude)
  • 31.
     Concentric Cylinder ConcentricCylinder Rheometers R Mi Ri 2 L  R Ro - Ri
  • 32.
    Dynamic Shear Rheometer(DSR) • Parallel Plate Shear flow varies with gap height and radius Non-homogeneous flow R = R  h R = 2 M R3
  • 33.
    Short Term BinderAging • Rolling Thin Film Oven – Simulates aging from hot mixing and construction
  • 34.
    Pressure Aging Vessel (LongTerm Aging) • Simulates aging of an asphalt binder for 7 to 10 years • 50 gram sample is aged for 20 hours • Pressure of 2,070 kPa (300 psi) • At 90, 100 or 110 C
  • 35.
    Bending Beam Rheometer AirBearing Load Cell Deflection Transducer Fluid Bath Computer
  • 36.
    Direct Tension Test Le  L Load Stress = = P / A Strain f f
  • 37.
    Summary Fatigue Cracking Rutting RTFO Short Term Aging Noaging Construction [RV] [DSR] Low Temp Cracking [BBR] [DTT] [DTT] PAV Long Term Aging
  • 38.
  • 39.
    Superpave Asphalt Binder Specification Thegrading system is based on Climate PG 64 - 22 Performance Grade Average 7-day max pavement temperature Min pavement temperature
  • 40.
    PG 46 PG52 PG 58 PG 64 PG 70 PG 76 PG 82 (Rotational Viscosity) RV 90 90 100 100 100 (110) 100 (110) 110 (110) (Flash Point) FP 46 52 58 64 70 76 82 46 52 58 64 70 76 82 (ROLLING THIN FILM OVEN) (ROLLING THIN FILM OVEN) RTFO RTFO Mass Loss Mass Loss < < 1.00 % 1.00 % (Direct Tension) DT (Bending Beam Rheometer) BBR Physical Hardening 28 -34 -40 -46 -10 -16 -22 -28 -34 -40 -46 -16 -22 -28 -34 -40 -10 -16 -22 -28 -34 -40 -10 -16 -22 -28 -34 -40 -10 -16 -22 -28 -34 -10 -16 -22 -28 -34 Avg 7-day Max, o C 1-day Min, o C (PRESSURE AGING VESSEL) (PRESSURE AGING VESSEL) PAV PAV ORIGINAL ORIGINAL > 1.00 kPa < 5000 kPa > 2.20 kPa S < 300 MPa m > 0.300 Report Value > 1.00 % 20 Hours, 2.07 MPa 10 7 4 25 22 19 16 13 10 7 25 22 19 16 13 31 28 25 22 19 16 34 31 28 25 22 19 37 34 31 28 25 40 37 34 31 (Dynamic Shear Rheometer) DSR G* sin  ( Bending Beam Rheometer) BBR “S” Stiffness & “m”- value -24 -30 -36 0 -6 -12 -18 -24 -30 -36 -6 -12 -18 -24 -30 0 -6 -12 -18 -24 -30 0 -6 -12 -18 -24 -30 0 -6 -12 -18 -24 0 -6 -12 -18 -24 -24 -30 -36 0 -6 -12 -18 -24 -30 -36 -6 -12 -18 -24 -30 0 -6 -12 -18 -24 -30 0 -6 -12 -18 -24 -30 0 -6 -12 -18 -24 0 -6 -12 -18 -24 P Performance erformance G Grades rades (Dynamic Shear Rheometer) DSR G*/sin  (Dynamic Shear Rheometer) DSR G*/sin  < 3 Pa.s @ 135 o C > 230 o C CEC
  • 41.
    PG 46 PG52 PG 58 PG 64 PG 70 PG 76 PG 82 (Rotational Viscosity) RV 90 90 100 100 100 (110) 100 (110) 110 (110) (Flash Point) FP 46 52 58 64 70 76 82 46 52 58 64 70 76 82 (ROLLING THIN FILM OVEN) (ROLLING THIN FILM OVEN) RTFO RTFO Mass Loss Mass Loss < < 1.00 % 1.00 % (Direct Tension) DT (Bending Beam Rheometer) BBR Physical Hardening 28 -34 -40 -46 -10 -16 -22 -28 -34 -40 -46 -16 -22 -28 -34 -40 -10 -16 -22 -28 -34 -40 -10 -16 -22 -28 -34 -40 -10 -16 -22 -28 -34 -10 -16 -22 -28 -34 Avg 7-day Max, o C 1-day Min, o C (PRESSURE AGING VESSEL) (PRESSURE AGING VESSEL) PAV PAV ORIGINAL ORIGINAL < 5000 kPa > 2.20 kPa S < 300 MPa m > 0.300 Report Value > 1.00 % 20 Hours, 2.07 MPa 10 7 4 25 22 19 16 13 10 7 25 22 19 16 13 31 28 25 22 19 16 34 31 28 25 22 19 37 34 31 28 25 40 37 34 31 (Dynamic Shear Rheometer) DSR G* sin  ( Bending Beam Rheometer) BBR “S” Stiffness & “m”- value -24 -30 -36 0 -6 -12 -18 -24 -30 -36 -6 -12 -18 -24 -30 0 -6 -12 -18 -24 -30 0 -6 -12 -18 -24 -30 0 -6 -12 -18 -24 0 -6 -12 -18 -24 -24 -30 -36 0 -6 -12 -18 -24 -30 -36 -6 -12 -18 -24 -30 0 -6 -12 -18 -24 -30 0 -6 -12 -18 -24 -30 0 -6 -12 -18 -24 0 -6 -12 -18 -24 How the PG Spec Works How the PG Spec Works (Dynamic Shear Rheometer) DSR G*/sin  (Dynamic Shear Rheometer) DSR G*/sin  < 3 Pa.s @ 135 o C > 230 o C CEC 58 64 Test Temperature Test Temperature Changes Changes Spec Requirement Spec Requirement Remains Constant Remains Constant > 1.00 kPa
  • 42.
    PG 58-22 PG 58-22 PG52-28 PG 64-10 PG 64-10 PG 58-16 PG 58-16 > Many agencies have established zones PG Binder Selection
  • 43.
    Summary of Howto Use PG Specification • Determine – 7-day max pavement temperatures – 1-day minimum pavement temperature • Use specification tables to select test temperatures • Determine asphalt cement properties and compare to specification limits
  • 44.
  • 45.
    Hot Mix AsphaltConcrete (HMA) Mix Designs • Objective: – Develop an economical blend of aggregates and asphalt that meet design requirements • Historical mix design methods – Marshall – Hveem • New – Superpave gyratory
  • 46.
    Requirements in Common •Sufficient asphalt to ensure a durable pavement • Sufficient stability under traffic loads • Sufficient air voids – Upper limit to prevent excessive environmental damage – Lower limit to allow room for initial densification due to traffic • Sufficient workability
  • 47.
  • 48.
    Marshall Mix Design •Developed by Bruce Marshall for the Mississippi Highway Department in the late 30’s • WES began to study it in 1943 for WWII – Evaluated compaction effort • No. of blows, foot design, etc. • Decided on 10 lb.. Hammer, 50 blows/side • 4% voids after traffic • Initial criteria were established and upgraded for increased tire pressures and loads
  • 49.
    Marshall Mix Design •Select and test aggregate • Select and test asphalt cement – Establish mixing and compaction temperatures • Develop trial blends – Heat and mix asphalt cement and aggregates – Compact specimen (100 mm diameter)
  • 50.
    Marshall Design Criteria LightTraffic Medium Traffic Heavy Traffic ESAL < 104 10 4 < ESAL< 10 ESAL > 106 Compaction 35 50 75 Stability N (lb.) 3336 (750) 5338 (1200) 8006 (1800) Flow, 0.25 mm (0.1 in) 8 to 18 8 to 16 8 to 14 Air Voids, % 3 to 5 3 to 5 3 to 5 Voids in Mineral Agg. (VMA) Varies with aggregate size
  • 51.
  • 52.
    Superpave Volumetric Mix Design •Goals – Compaction method which simulates field – Accommodates large size aggregates – Measure of compactibility – Able to use in field labs – Address durability issues • Film thickness • Environmental
  • 53.
    reaction frame rotating base loading ram control and data acquisitionpanel mold height measurement tilt bar Key Components of Gyratory Compactor Compaction
  • 54.
    Compaction • Gyratory compactor –Axial and shearing action – 150 mm diameter molds • Aggregate size up to 37.5 mm • Height measurement during compaction – Allows densification during compaction to be evaluated 1.25o Ram pressure 600 kPa
  • 55.
    % G % Gmm mm LogGyrations Log Gyrations 10 10 100 100 1000 1000 N Nini ini N Ndes des N Nmax max Three Points on SGC Curve
  • 56.
    SGC Critical PointComparison %Gmm= Gmb / Gmm Gmb = Bulk Mix Specific Gravity from compaction at N cycles Gmm = Max. Theoretical Specific Gravity Compare to allowable values at: NINI : %Gmm < 89% NDES: %Gmm < 96% NMAX: %Gmm < 98%
  • 57.
    Design Compaction • Ndesbased on – average design high air temp – traffic level • Log Nmax = 1.10 Log Ndes • Log Nini = 0.45 Log Ndes % Gmm Log Gyrations 10 100 1000 Nini Ndes Nmax
  • 58.
    Superpave Testing • Specimenheights • Mixture volumetrics – Air voids – Voids in mineral aggregate (VMA) – Voids filled with asphalt (VFA) – Mixture density characteristics • Dust proportion • Moisture sensitivity
  • 59.
    Superpave Mix Design •Determine mix properties at NDesign and compare to criteria – Air voids 4% (or 96% Gmm) – VMA See table – VFA See table – %Gmm at Nini < 89% – %Gmmat Nmax < 98% – Dust proportion 0.6 to 1.2
  • 60.
    Superpave Mix Design GyratoryCompaction Criteria

Editor's Notes

  • #2 Soils are materials that are used as-is. An example would be a finished subgrade surface. Aggregates are materials that have been specifically sorted or processed to achieve given properties. This block will present general background information about how aggregates are obtained and processed.
  • #3 For HMA pavements these are the definitions for gradations.
  • #4 To specify aggregate gradation, two additional features are added to the 0.45 chart: control points and a restricted zone. Control points function as master ranges through which gradations must pass. They are placed on the nominal maximum size, an intermediate size and the dust size. The restricted zone resides along the maximum density gradation between the intermediate size (either 4.75 or 2.36 mm) and the 0.3 mm size. It forms a band through which gradations should not pass. Gradations that pass through the restricted zone have often been called “humped gradations” because of the characteristic hump in the grading curve that passes through the restricted zone. In most cases, a humped gradation indicates a mixture that possesses too much fine sand in relation to total sand. This gradation practically always results in tender mix behavior, which is manifested by a mixture that is difficult to compact during construction and offers reduced resistance to permanent deformation during its performance life. Gradations that violate the restricted zone possess weak aggregate skeletons that depend too much on asphalt binder stiffness to achieve mixture shear strength. These mixtures are also very sensitive to asphalt content and can easily become plastic.
  • #5 The term used to describe the cumulative frequency distribution of aggregate particle sizes is the design aggregate structure. A design aggregate structure that lies between the control points and avoids the restricted zone meets the requirements of Superpave with respect to gradation. Superpave defines five mixture types as defined by their nominal maximum aggregate size:
  • #6 These are the five gradations developed for Superpave.
  • #7 Several factors need to be considered in selecting a desirable aggregate gradation. The maximum size of the aggregate needs to be at a minimum less than one half of the planned lift thickness. Current construction practices with Superpave gradations indicate that this needs to be changed to less than one-third of the lift thickness. Larger maximum size aggregate gradations have several advantages such as improved aggregate interlock, improved skid resistance and improved rut resistance. Local availability of aggregates will usually dictate the largest size aggregate. Also, the larger maximum size gradations also tend to have more problems with gradation separation (segregation) during construction.
  • #8 The appropriate percentages of each aggregate stockpile are combined and then split on the 4.75 mm screen. The material retained on the 4.75 mm screen are used to determine the percent crushed faces
  • #9 This is a measurement of coarse aggregate angularity. The amount of crushing (angularity) is important because it determines the level of internal shear resistance which can be developed in the aggregate structure. Round, uncrushed aggregates tend to “roll” out from under traffic loads and therefore have a low rutting resistance.
  • #10 Superpave requirements are based on both the traffic level and the depth of the layer below the surface. The crushing requirements for low traffic volumes are low or none, regardless of depth. As traffic levels increase, so do the required percentages of crushed faces. There is a higher level of crushing required in the upper 100 mm of the pavement because this is the region which is subjected to the highest shear due to traffic loads. Higher shear forces require a higher level of resistance to shear.
  • #11 This block of instruction will cover traditional penetration and viscosity grading systems used in the US. While the Superpave binder specification is quickly replacing these specifications in practice, the vast majority of the literature will refer to these standards. People in this industry also commonly ask “So, what AC grade is a PG 64-22?”. These traditional specifications will remain the baseline against which field experience is translated into an understanding of the new Superpave binder specification. At the conclusion of this block the student will understand: * How to use traditional binder specifications * The limitations of these specifications which led to the development of the Superpave binder specification. This material is covered in detail in Chapter 2 “Asphalt Refining, Uses, and Properties” in the recommended text book.
  • #12 Students commonly use the words “asphalt” and “tar” interchangeably. However, asphalt is actually a waste product from the refining of petroleum crude oil while tar is a coal by-product. These chemical distinctions are important in a selecting the appropriate product for a given application. For example, if protection from oil and fuel spills is desired, then a coating which will not be dissolved by these products is needed. Since motor oils, fuel, and asphalt are all derived from petroleum, any spills on this pavement can damage the asphalt-based coating as well as the asphalt concrete. The old chemistry rule-of-thumb applies: Like dissolves like. Because tar is a coal rather than asphalt-based product, sealers from this material will not be damaged by petroleum product spills.
  • #13 The penetration test started out using a No. 2 sewing machine needle mounted on a shaft for a total mass of 100 g. This needle was allowed to sink into (penetrate) a container of asphalt cement at room temperature (25 oC) for 5 seconds. The consistency (stiffness) of a given asphalt was reported as the depth in tenths of a millimeter (dmm) that the needle penetrated the asphalt.
  • #14 This test was used to standardize the penetration grading system approach for specifying asphalt cements. This specification uses the penetration of the original asphalt cement in the grade names. That is, a 120-150 penetration grade asphalt will have a penetration value for the original asphalt of between 120 and 150 tenths of a millimeter.
  • #15 This test evaluates the ability of an asphalt sample to stretch at a rate of 5 cm/min at 25oC. The distance the samples can be pulled is measured directly from the centimeter scale mounted to the top of the tank. The significance of the ductility test to indicate performance-related properties has been debated for a number of years due to its empirical nature and poor reproducibility of test results. In general, asphalts with lower ductility have a greater tendency to produce pavements which have excessive cracking
  • #16 There are five penetration grades of asphalt cements with discrete ranges. That is, there is no overlap in penetration values between grades. It is possible to have an asphalt which will not meet any penetration grading requirement. This table presents two of these grades. Note the flash point decreases with increasing penetration. This is because softer asphalts usually have a higher percentage of lighter ends which will “flash” at lower temperatures. The specification allows for this difference. Since these fractions of the asphalt are also easily removed by heating, this means that there will be a higher percentage mass loss on aging. This greater loss of the softer asphalt components is reflected in the differences in requirements on the percent of the original penetration retained after aging. That is, the more light ends lost during aging, the greater the stiffening affect due to aging. This loss of the softer asphalt components is also reflected the ductility requirements.
  • #17 These disadvantages led to the development of the viscosity grading system in the 1970's which is detailed in ASTM D3381. This one ASTM standard actually contains three separate specifications designated as: Table 1, Table 2, and Table 3. The first two specifications are based on the original properties of the asphalt while the last table is based on the properties of the asphalt after rolling thin film oven aging. Each of these tables and differences between them will be discussed in the following slides.
  • #18 Two viscosity measurements are used in this specification: Absolute viscosity (60 oC) and kinematic viscosity (135 oC). Both use the principle of the rate of flow through a known area to measure viscosity. Because asphalt is still very thick (stiff) at 60 oC, a vacuum is needed to move the asphalt through the tube in a reasonable time. At 135 oC, gravity and a falling head pressure is sufficient to get the asphalt to flow.
  • #19 This table compares two of the viscosity graded Table 1 specifications. The viscosity grading system provides immediate information as to the mean anticipated viscosity at 60 oC. For example, an AC 25 will have a mean viscosity of 250 Poise (2.5 times 100). Because of the limited allowable range (coefficient of variance of 20 percent), there is no overlap between the AC grades.
  • #20 This figure provides a general comparison of the various traditional specifications. While there is no direct relationship between the specifications, there is a general relationship between stiffness and viscosity. Higher penetration numbers correspond with lower viscosities.
  • #21 This block of instruction will cover the tests, concepts and use of the new Superpave binder specifications. At the end of this block the student will be familiar with the : * Concepts behind the PG binder grading system. * Tests used for determining performance-related binder properties. * Selection of an appropriate PG binder grade.
  • #22 The PG grading system was developed to address the short comings seen in the traditional asphalt cement specifications. This specification is referred to as a binder rather than an asphalt cement specification. The difference is that a binder can be either a neat (unmodified) or modified asphalt cement. The term “asphalt cement” usually refers to an unmodified asphalt cement.
  • #23 The viscous component of the binder response dominates its warm temperature behavior and is seen as permanent deformation. The magnitude of this deformation is increased with the time that the load is applied.
  • #24 Permanent deformation or rutting of the pavement is the result of non-recoverable or plastic deformation due to traffic loads. At the warmer temperatures, the aggregate structure carries a major portion of the loads. Stiffer binders help to keep the aggregate structure intact as well as help resist deformation in the binder matrix.
  • #25 Ruts can be very visible in extreme cases such as the one shown in this photo. Other places where rutting can be observed are at stop lights. In many cases, the crosswalk lines can highlight this type of distress.
  • #26 At cold temperatures, or under very quick loads, the binder response is predominately elastic.
  • #27 A length of pavement can be considered to be a semi-infinite constrained beam. As the temperature drops the asphalt concrete wants to contract but is restrained. This results in internal stresses building up as the temperature drops. Thermal cracks occur when the contraction-induced stresses exceed the tensile strength of the mixture. A number of researchers have shown that the low temperature behavior of the asphalt concrete pavement is highly dependent upon the properties of the binder.
  • #28 Thermal cracks are transverse cracks, usually at relatively evenly spaced intervals. The spacing gets closer together with increasing binder stiffness the colder the temperatures.
  • #29 The binder designation is based on expected extremes of hot and cold pavement temperatures.
  • #31 The rotational viscosmeter (also referred to at a Brookfield viscometer) is a concentric cylinder rheometer. This means that one cylinder rotates inside of another. Viscosity is determined from the amount of torque needed to rotate a cylinder (called a spindle) with a known geometry. Viscosity, as defined earlier, is the ratio of the shear stress to the strain rate. This viscometer uses information about the torque, speed, and geometry to obtain these measurements.
  • #32 This type of rheometer has a parallel plate configuration. The stress and strain measurements are based on the assumption of a cylindrical geometry. This is why a great deal of effort is expended in preparing and trimming the specimen prior to starting the test.
  • #33 Short term aging is accomplished using the same RTFO oven as has been traditionally used in the AR viscosity graded specification.
  • #34 A pressure aging vessel (PAV) treatment of the RTFO binder is used to further age the binder. This simulates long term aging changes.
  • #35 This test applies a static load to a simply supported beam of asphalt cement. Temperature is held constant using a liquid bath. A computer provides both equipment control and data acquisition.
  • #36 Regardless of the type of equipment used, a sample of binder is molded into a “dog bone” shape with a uniform center cross section. The sample is pulled until the it breaks in the middle. The stress and strain at failure are recorded. This test requires a minimum strain before the sample fails.
  • #37 This figure summarizes the testing required for the PG binder specification.
  • #38 One of the primary purposes of the Superpave binder testing is to use that data for the development of a purchase specification for asphalt binders.
  • #39 The binder designation is based on expected extremes of hot and cold pavement temperatures.
  • #40 This is the binder specification - it is defined by AASHTO MP -1.
  • #41 The approach to the PG system represents a change in philosophy. The specification requirement does not change; the temperature which the value has to meet changes with grade.
  • #42 Many states have divided their territory into different regions. How many regions depends on the variation of climates.
  • #43 This provides a brief summary of the steps needed to determine if an asphalt meets a particular PG specification.
  • #44 This block will present background information on the traditional Marshall and Hveem mix design methods. At the conclusion of this block the student will have a general understanding of: The principal procedures and concepts used in Marshall and Hveem mix design techniques This material is covered in detail in Chapter 4 “Hot Mix Asphalt Mixture Design Methodology” of the recommended textbook.
  • #45 The objective of HMA mix design is to develop an economical blend of aggregates and asphalt. In the developing of this blend the designer needs to consider both the first cost and the life cycle cost of the project. Considering only the first cost may result in a higher life cycle cost. Historically asphalt mix design has been accomplished using either the Marshall or the Hveem design method. The most common method was the Marshall. It had been used in about 75% of the DOTs throughout the US and by the FAA for the design of airfields. In 1995 the Superpave mix design procedure was introduced into use. It builds on the knowledge from Marshall and Hveem procedures. The primary differences between the three procedures is the machine used to compact the specimens and strength tests used to evaluate the mixes. The current plan is to implement the Superpave procedures throughout the US for the design and quality control of HMA highway projects early in the next century. It appears that the Marshall method will continue to be used for airfield design for many years and that the Hveem procedure will continue to be used in California.
  • #46 No matter which design procedure is going to be used the HMA mixture that is placed on the roadway must meet certain requirements. The mix must have sufficient asphalt to ensure a durable, compacted pavement by thoroughly coating, bonding and waterproofing the aggregate. Enough stability to satisfy the demands of traffic without displacement or distortion (rutting). Sufficient voids to allow a slight amount of added compaction under traffic loading without bleeding and loss of stability. However, the volume of voids should be low enough to keep out harmful air and moisture. To accomplish this the mixes are usually designed by 4% VTM in the lab and compacted to less than 7% VTM in the field. Enough workability to permit placement and proper compaction without segregation.
  • #48 Point out that the criteria has been modified since initial development; but, the basic process is the same as it was when it was initially developed.
  • #49 This slide outlines the major steps in the development of a Marshall mix design.
  • #50 The criteria on this slide is that recommended by The Asphalt Institute. Most DOTs have their own requirements and they may vary some from that noted here.
  • #51 This block of instruction will cover the Superpave procedures. At the conclusion of this block the student will have a general understanding of: The principal procedures involved in the Superpave mix design. The relationship between these procedures and paving specifications. This material is covered in detail in Chapter 4 “Hot Mix Asphalt Mixture Design Methodology” of the recommended textbook.
  • #52 The goals of the first new mix design procedure for HMA pavements in over 50 years were to have a procedure that would simulate the real world. In the past we may have “allowed the mold to design road”. The Marshall and Hveem procedures used 4 inch (100 mm) molds with Superpave using 150 mm molds to use larger aggregates. By monitoring compaction throughout the process, may provide a measure of how the mix will compact during construction. It was also desired to have equipment that could be used to for field quality control purposes.
  • #53 These are the components of the machine.
  • #54 The compactor puts 600 kPa of pressure on the specimen and operates at 30 rpm.
  • #55 There are three critical points on the SGC compactor curve that are evaluated in Superpave. Ninital is of importance because it is desirable not to have mixes that compact too easily. Nmaximum is of importance to prevent having mixes that continue to compact under traffic loading.
  • #57 The level of Ndesign is based on the climate and traffic levels.
  • #58 This data is available or must be calculated to complete the development of the Superpave mix design.
  • #59 These properties are determined and compared to the specification criteria.
  • #60 These properties are determined and compared to the specification criteria.