Downloaded 54 times


The document provides an extensive overview of fundamental analysis, primarily used for long-term investments, highlighting the importance of analyzing economic, industry, and company-specific factors. It emphasizes understanding macroeconomic conditions, industry dynamics, and assessing a company's financial health through various ratios. The report also specifically analyzes Nestlé India, detailing its commitment to quality products and its role in the Indian economy.


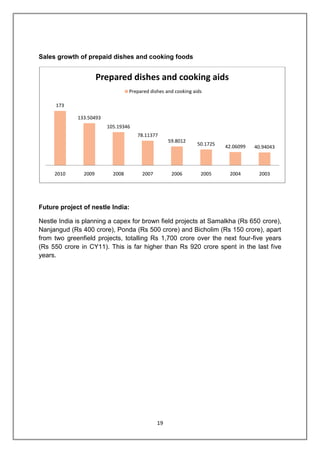
![Unit 2 [recovered]](https://cdn.slidesharecdn.com/ss_thumbnails/unit-2recovered-170115140526-thumbnail.jpg?width=640&height=640&fit=bounds)