SlideShare a Scribd company logo
1 of 15
Download to read offline
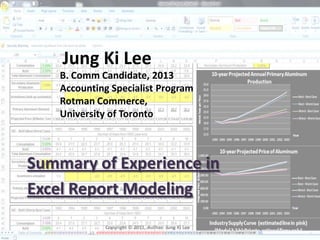
Jung Ki Lee
    B. Comm Candidate, 2013
    Accounting Specialist Program
    Rotman Commerce,
    University of Toronto


Summary of Experience in
Excel Report Modeling
             Copyright © 2011, Author: Jung Ki Lee
Agenda
• The Spreadsheet: the model in general

• Part One: Graphing, Forecasting, Macros

• Part Two: Sensitivity Analyses

• Key Takeaways

                  Copyright © 2011, Author: Jung Ki Lee
The Spreadsheet
• Constructed an economic and financial model for
  the aluminum industry

• Disclaimer: The spreadsheet photos that follow
  are solely intended for a demonstration of my
  Microsoft Excel skills. None of the screen
  captures that follow are to be used for future
  academic assignments.

• Credit goes to my group members in helping me
  construct this model: Alana Stewart, Eva Fok
                 Copyright © 2011, Author: Jung Ki Lee
This model consisted of
numerous sub-models which
we applied a variety of
microeconomic principles into
Excel.
Due to my superior knowledge
of Excel, I lead the
construction of 17 out of the
18 models in this assignment.


                                Copyright © 2011, Author: Jung Ki Lee
Part 1:
Constructing Supply Models

 Step-Charts and Macros

     Price Forecasting

       Copyright © 2011, Author: Jung Ki Lee
For this model, we were required to
                                  draw out a supply curve for the
                                  aluminum industry. Using concepts
                                  learned in class, we drew a step
                                  chart.

                                  The hard thing about step charts is
                                  that there are no Excel functions that
                                  automatically draw one out for you.

                                  Therefore, we had to manually lay
                                  out the data points for 156 smelters’
                                  capacities across 12 different supply
                                  models.


Copyright © 2011, Author: Jung Ki Lee
Four more
                                                                              models off
                                                                              screen
One supply
model
                                                                  Solution: I Came up with a
      To make the step chart,                                     macro that can cut the
      take raw data and insert a                                  laborious steps of inserting a
      row between every other                                     row between each line.
      line and copy the formula
      that is the same x above                                    And, with a clever bit of
      and the same y below.                                       filtering, you can copy the
      No choice but to do it                                      formula needed to implement
      manually                                                    the step chart in minutes!
 Doing this would have meant
 inserting and copying the                                        With teamwork and our
 formula 157 times per                                            shortcut, this saved us not
 model! And we had twelve                                         hours, but DAYS worth of time
 of them.                                                         in graphing these models.

                               Copyright © 2011, Author: Jung Ki Lee
With the aid of our instructor, we
constructed a model for
predicting prices. The notable
thing here is that I constructed
this with all calculations
referencing back to the
parameters indicated. Changing
the parameters changed the
entire calculations and the
resulting graphs.


                                 Copyright © 2011, Author: Jung Ki Lee
Part 2:
 Profit Sensitivity Analysis

    Portfolio Allocation

Portfolio Sensitivity Analysis


        Copyright © 2011, Author: Jung Ki Lee
Using economic principles learned in class, we
                                      applied a sensitivity analysis on profits.


The beauty of this model is
that the user can play
around with the scroll bar
to see different results for
the 157 smelters.
This also updates the graph
on the right as the scroll bar
moves.


                                                     The formula used to derive values in these columns
                                                     uses a complex double-if-statement in order to be
                                                     consistent with the economic assumptions we made
                                                     (and to save ourselves time from tailoring each
                                                     formula to the firm’s attributes).
                                 Copyright © 2011, Author: Jung Ki Lee
Eight of these models were constructed
testing the sensitivity of each
parameter in the maximization problem.
Each parameter had its own intrinsic
calculations that made it challenging.


        Copyright © 2011, Author: Jung Ki Lee
With some clever series adjustments, I
                                                           made it so that the optimal allocation
                                                           is highlighted against the possible
Here I applied basic                                       allocations.
portfolio allocation                                       This is so the investor can know where
learned in class. Using                                    he or she is relative to the possible
the scroll bar again, the                                  allocations.
user can play around with
how risk-loving or risk-
averse the investor is.


                            Copyright © 2011, Author: Jung Ki Lee
In terms of calculations, this involves
                          copious amounts of algebra and of all
                          models, this was the most difficult
                          one I constructed. Here, I perform
                          another sensitivity analysis and,
                          again, the user may play with the
                          scroll bars to get an understanding of
                          how sensitive their portfolios are.
Copyright © 2011, Author: Jung Ki Lee
Key Takeaways of my Achievements
• I have demonstrated teamwork in delegating
  tough, conceptual Excel jobs
• I showed my problem solving skills in finding
  shortcuts to do work faster and more efficiently
• While the models are complex, I always prioritize
  communication of the models to the audience
• I am a hard worker: over 80 hours went into this
  model alone in 3 weeks (with lectures,
  commuting, homework and conferences in
  between).
                  Copyright © 2011, Author: Jung Ki Lee
Thank you for your time!
Jung Ki Lee
B. Comm. Candidate, 2013
Accounting Specialist Program
Rotman Commerce,
University of Toronto


               Copyright © 2011, Author: Jung Ki Lee

More Related Content

Similar to Summary of Excel Skills

Interpretable ML
Interpretable MLInterpretable ML
Interpretable MLMayur Sand
 
Week 4 Assignment - Software Development PlanScenario-Your team has be.docx
Week 4 Assignment - Software Development PlanScenario-Your team has be.docxWeek 4 Assignment - Software Development PlanScenario-Your team has be.docx
Week 4 Assignment - Software Development PlanScenario-Your team has be.docxestefana2345678
 
Building Forio Web Simulations - Introduction to Interface Design
Building Forio Web Simulations - Introduction to Interface DesignBuilding Forio Web Simulations - Introduction to Interface Design
Building Forio Web Simulations - Introduction to Interface Designforiocorp
 
EclipseCon EU 2015 : EMF compare + EGit = Seamless Collaborative Modeling
EclipseCon EU 2015 : EMF compare + EGit = Seamless Collaborative ModelingEclipseCon EU 2015 : EMF compare + EGit = Seamless Collaborative Modeling
EclipseCon EU 2015 : EMF compare + EGit = Seamless Collaborative ModelingObeo
 
Wondeland Of Modelling
Wondeland Of ModellingWondeland Of Modelling
Wondeland Of ModellingKaniska Mandal
 
Introduction to Unit Testing
Introduction to Unit TestingIntroduction to Unit Testing
Introduction to Unit TestingSwanky Hsiao
 
Breathe Life Into Your IDE
Breathe Life Into Your IDEBreathe Life Into Your IDE
Breathe Life Into Your IDEBenoit Combemale
 
AEM Clean Code - Miklos Csere
AEM Clean Code - Miklos Csere AEM Clean Code - Miklos Csere
AEM Clean Code - Miklos Csere Miklos Csere
 
Fundamental Design Patterns.pptx
Fundamental Design Patterns.pptxFundamental Design Patterns.pptx
Fundamental Design Patterns.pptxJUNSHIN8
 
Lively Applications Examples
Lively Applications ExamplesLively Applications Examples
Lively Applications ExamplesReva Narasimhan
 
Testing Hourglass at Jira Frontend - by Alexey Shpakov, Sr. Developer @ Atlas...
Testing Hourglass at Jira Frontend - by Alexey Shpakov, Sr. Developer @ Atlas...Testing Hourglass at Jira Frontend - by Alexey Shpakov, Sr. Developer @ Atlas...
Testing Hourglass at Jira Frontend - by Alexey Shpakov, Sr. Developer @ Atlas...Applitools
 
NetworkTeamofRockDamageModelingandEnergyGeostorageSimulation
NetworkTeamofRockDamageModelingandEnergyGeostorageSimulationNetworkTeamofRockDamageModelingandEnergyGeostorageSimulation
NetworkTeamofRockDamageModelingandEnergyGeostorageSimulationJianming Zeng
 
Model-Based Systems Engineering Tool How To Use Innoslate Pt. 2
Model-Based Systems Engineering Tool How To Use Innoslate Pt. 2Model-Based Systems Engineering Tool How To Use Innoslate Pt. 2
Model-Based Systems Engineering Tool How To Use Innoslate Pt. 2Elizabeth Steiner
 
Introduction to modeling_and_simulation
Introduction to modeling_and_simulationIntroduction to modeling_and_simulation
Introduction to modeling_and_simulationAysun Duran
 
Introduction to modeling_and_simulation
Introduction to modeling_and_simulationIntroduction to modeling_and_simulation
Introduction to modeling_and_simulationmukmin91
 

Similar to Summary of Excel Skills (20)

Sbi simulation
Sbi simulationSbi simulation
Sbi simulation
 
Interpretable ML
Interpretable MLInterpretable ML
Interpretable ML
 
Week 4 Assignment - Software Development PlanScenario-Your team has be.docx
Week 4 Assignment - Software Development PlanScenario-Your team has be.docxWeek 4 Assignment - Software Development PlanScenario-Your team has be.docx
Week 4 Assignment - Software Development PlanScenario-Your team has be.docx
 
Building Forio Web Simulations - Introduction to Interface Design
Building Forio Web Simulations - Introduction to Interface DesignBuilding Forio Web Simulations - Introduction to Interface Design
Building Forio Web Simulations - Introduction to Interface Design
 
Neural network
Neural networkNeural network
Neural network
 
OOM Unit I - III.pdf
OOM Unit I - III.pdfOOM Unit I - III.pdf
OOM Unit I - III.pdf
 
EclipseCon EU 2015 : EMF compare + EGit = Seamless Collaborative Modeling
EclipseCon EU 2015 : EMF compare + EGit = Seamless Collaborative ModelingEclipseCon EU 2015 : EMF compare + EGit = Seamless Collaborative Modeling
EclipseCon EU 2015 : EMF compare + EGit = Seamless Collaborative Modeling
 
Wondeland Of Modelling
Wondeland Of ModellingWondeland Of Modelling
Wondeland Of Modelling
 
Introduction to Unit Testing
Introduction to Unit TestingIntroduction to Unit Testing
Introduction to Unit Testing
 
Breathe Life Into Your IDE
Breathe Life Into Your IDEBreathe Life Into Your IDE
Breathe Life Into Your IDE
 
Assign3
Assign3Assign3
Assign3
 
AEM Clean Code - Miklos Csere
AEM Clean Code - Miklos Csere AEM Clean Code - Miklos Csere
AEM Clean Code - Miklos Csere
 
Fundamental Design Patterns.pptx
Fundamental Design Patterns.pptxFundamental Design Patterns.pptx
Fundamental Design Patterns.pptx
 
Lively Applications Examples
Lively Applications ExamplesLively Applications Examples
Lively Applications Examples
 
Testing Hourglass at Jira Frontend - by Alexey Shpakov, Sr. Developer @ Atlas...
Testing Hourglass at Jira Frontend - by Alexey Shpakov, Sr. Developer @ Atlas...Testing Hourglass at Jira Frontend - by Alexey Shpakov, Sr. Developer @ Atlas...
Testing Hourglass at Jira Frontend - by Alexey Shpakov, Sr. Developer @ Atlas...
 
NetworkTeamofRockDamageModelingandEnergyGeostorageSimulation
NetworkTeamofRockDamageModelingandEnergyGeostorageSimulationNetworkTeamofRockDamageModelingandEnergyGeostorageSimulation
NetworkTeamofRockDamageModelingandEnergyGeostorageSimulation
 
Model-Based Systems Engineering Tool How To Use Innoslate Pt. 2
Model-Based Systems Engineering Tool How To Use Innoslate Pt. 2Model-Based Systems Engineering Tool How To Use Innoslate Pt. 2
Model-Based Systems Engineering Tool How To Use Innoslate Pt. 2
 
Introduction to modeling_and_simulation
Introduction to modeling_and_simulationIntroduction to modeling_and_simulation
Introduction to modeling_and_simulation
 
Introduction to modeling_and_simulation
Introduction to modeling_and_simulationIntroduction to modeling_and_simulation
Introduction to modeling_and_simulation
 
Lecture11
Lecture11Lecture11
Lecture11
 

Summary of Excel Skills

  • 1. Jung Ki Lee B. Comm Candidate, 2013 Accounting Specialist Program Rotman Commerce, University of Toronto Summary of Experience in Excel Report Modeling Copyright © 2011, Author: Jung Ki Lee
  • 2. Agenda • The Spreadsheet: the model in general • Part One: Graphing, Forecasting, Macros • Part Two: Sensitivity Analyses • Key Takeaways Copyright © 2011, Author: Jung Ki Lee
  • 3. The Spreadsheet • Constructed an economic and financial model for the aluminum industry • Disclaimer: The spreadsheet photos that follow are solely intended for a demonstration of my Microsoft Excel skills. None of the screen captures that follow are to be used for future academic assignments. • Credit goes to my group members in helping me construct this model: Alana Stewart, Eva Fok Copyright © 2011, Author: Jung Ki Lee
  • 4. This model consisted of numerous sub-models which we applied a variety of microeconomic principles into Excel. Due to my superior knowledge of Excel, I lead the construction of 17 out of the 18 models in this assignment. Copyright © 2011, Author: Jung Ki Lee
  • 5. Part 1: Constructing Supply Models Step-Charts and Macros Price Forecasting Copyright © 2011, Author: Jung Ki Lee
  • 6. For this model, we were required to draw out a supply curve for the aluminum industry. Using concepts learned in class, we drew a step chart. The hard thing about step charts is that there are no Excel functions that automatically draw one out for you. Therefore, we had to manually lay out the data points for 156 smelters’ capacities across 12 different supply models. Copyright © 2011, Author: Jung Ki Lee
  • 7. Four more models off screen One supply model Solution: I Came up with a To make the step chart, macro that can cut the take raw data and insert a laborious steps of inserting a row between every other row between each line. line and copy the formula that is the same x above And, with a clever bit of and the same y below. filtering, you can copy the No choice but to do it formula needed to implement manually the step chart in minutes! Doing this would have meant inserting and copying the With teamwork and our formula 157 times per shortcut, this saved us not model! And we had twelve hours, but DAYS worth of time of them. in graphing these models. Copyright © 2011, Author: Jung Ki Lee
  • 8. With the aid of our instructor, we constructed a model for predicting prices. The notable thing here is that I constructed this with all calculations referencing back to the parameters indicated. Changing the parameters changed the entire calculations and the resulting graphs. Copyright © 2011, Author: Jung Ki Lee
  • 9. Part 2: Profit Sensitivity Analysis Portfolio Allocation Portfolio Sensitivity Analysis Copyright © 2011, Author: Jung Ki Lee
  • 10. Using economic principles learned in class, we applied a sensitivity analysis on profits. The beauty of this model is that the user can play around with the scroll bar to see different results for the 157 smelters. This also updates the graph on the right as the scroll bar moves. The formula used to derive values in these columns uses a complex double-if-statement in order to be consistent with the economic assumptions we made (and to save ourselves time from tailoring each formula to the firm’s attributes). Copyright © 2011, Author: Jung Ki Lee
  • 11. Eight of these models were constructed testing the sensitivity of each parameter in the maximization problem. Each parameter had its own intrinsic calculations that made it challenging. Copyright © 2011, Author: Jung Ki Lee
  • 12. With some clever series adjustments, I made it so that the optimal allocation is highlighted against the possible Here I applied basic allocations. portfolio allocation This is so the investor can know where learned in class. Using he or she is relative to the possible the scroll bar again, the allocations. user can play around with how risk-loving or risk- averse the investor is. Copyright © 2011, Author: Jung Ki Lee
  • 13. In terms of calculations, this involves copious amounts of algebra and of all models, this was the most difficult one I constructed. Here, I perform another sensitivity analysis and, again, the user may play with the scroll bars to get an understanding of how sensitive their portfolios are. Copyright © 2011, Author: Jung Ki Lee
  • 14. Key Takeaways of my Achievements • I have demonstrated teamwork in delegating tough, conceptual Excel jobs • I showed my problem solving skills in finding shortcuts to do work faster and more efficiently • While the models are complex, I always prioritize communication of the models to the audience • I am a hard worker: over 80 hours went into this model alone in 3 weeks (with lectures, commuting, homework and conferences in between). Copyright © 2011, Author: Jung Ki Lee
  • 15. Thank you for your time! Jung Ki Lee B. Comm. Candidate, 2013 Accounting Specialist Program Rotman Commerce, University of Toronto Copyright © 2011, Author: Jung Ki Lee