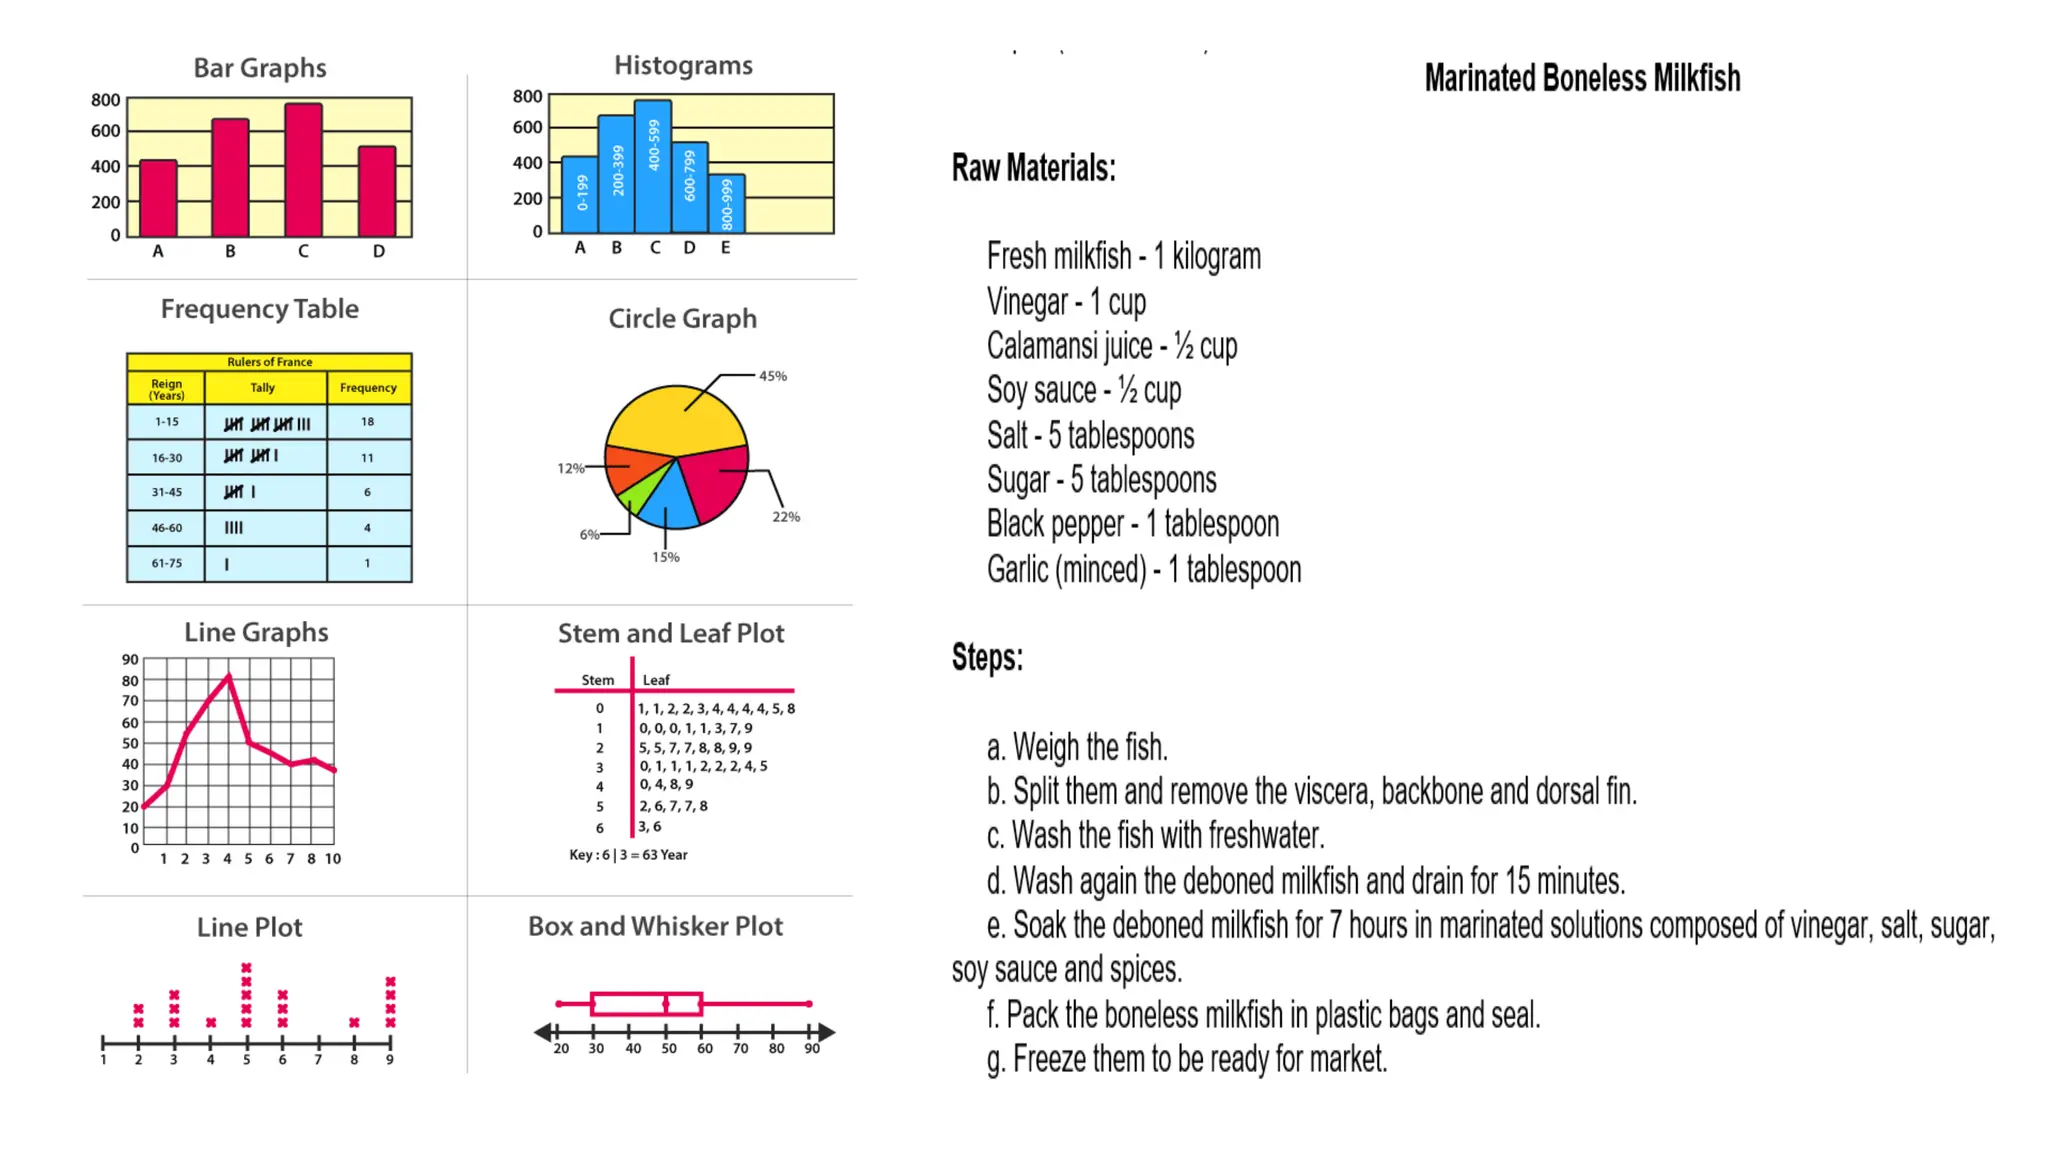
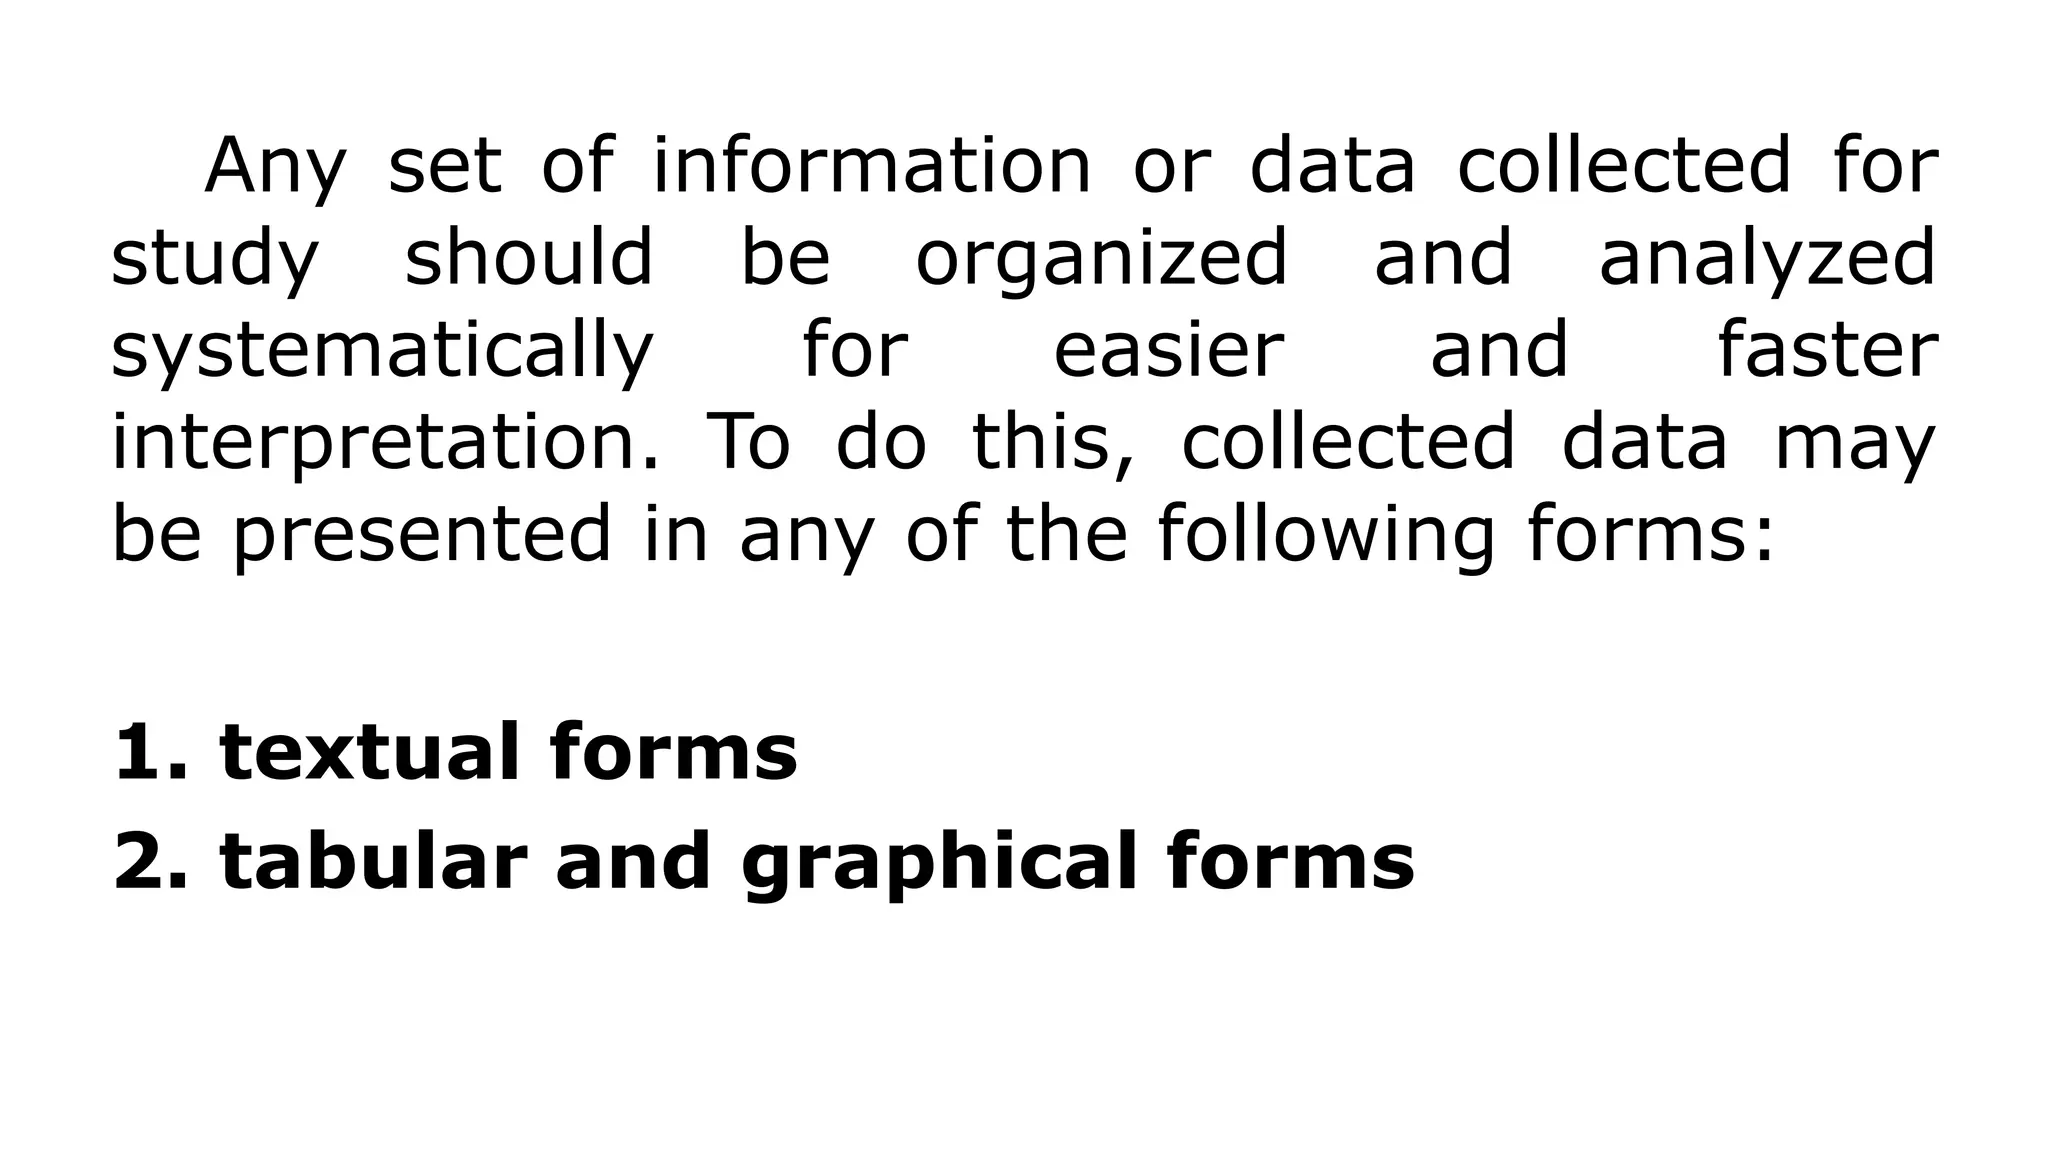
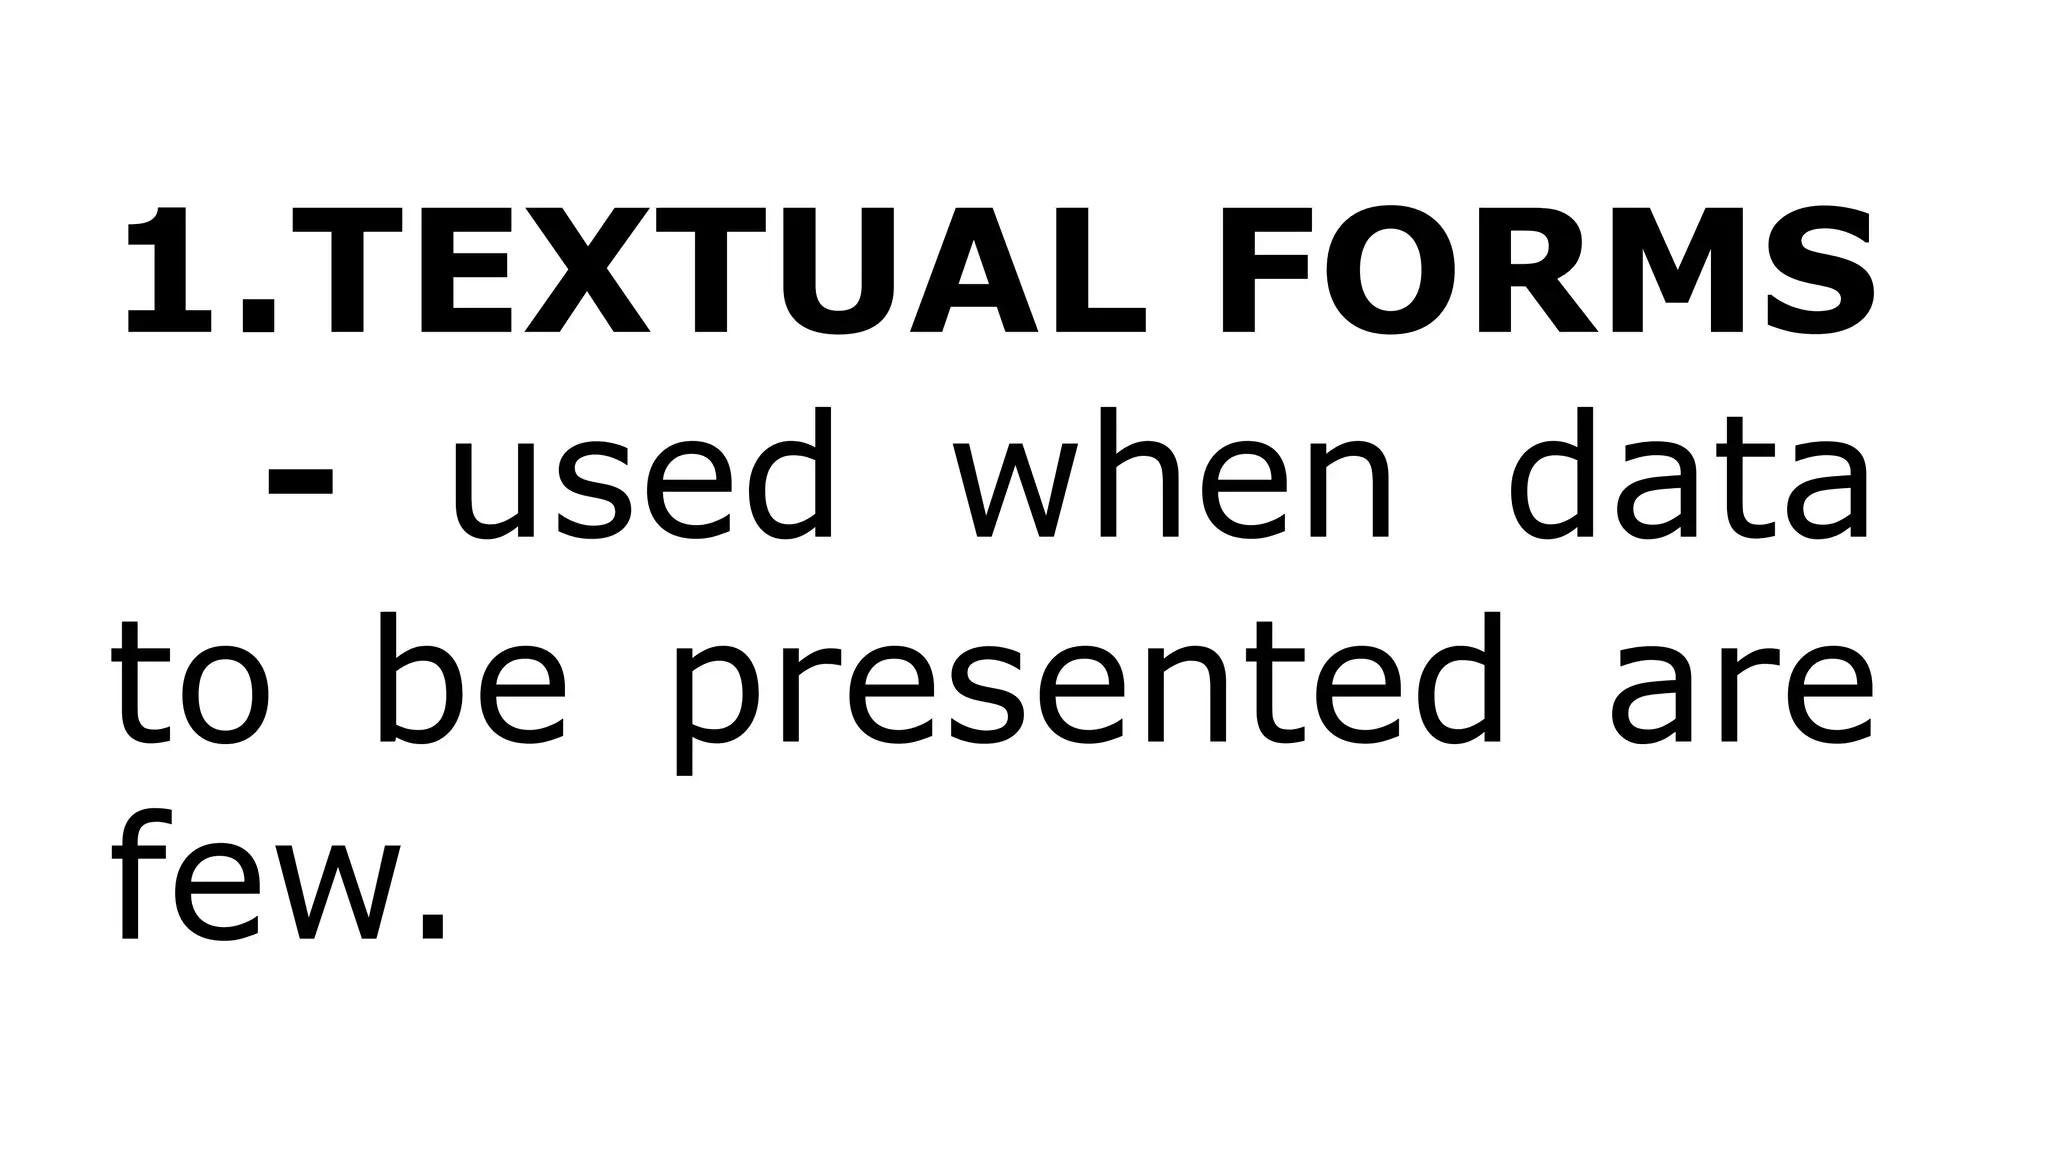
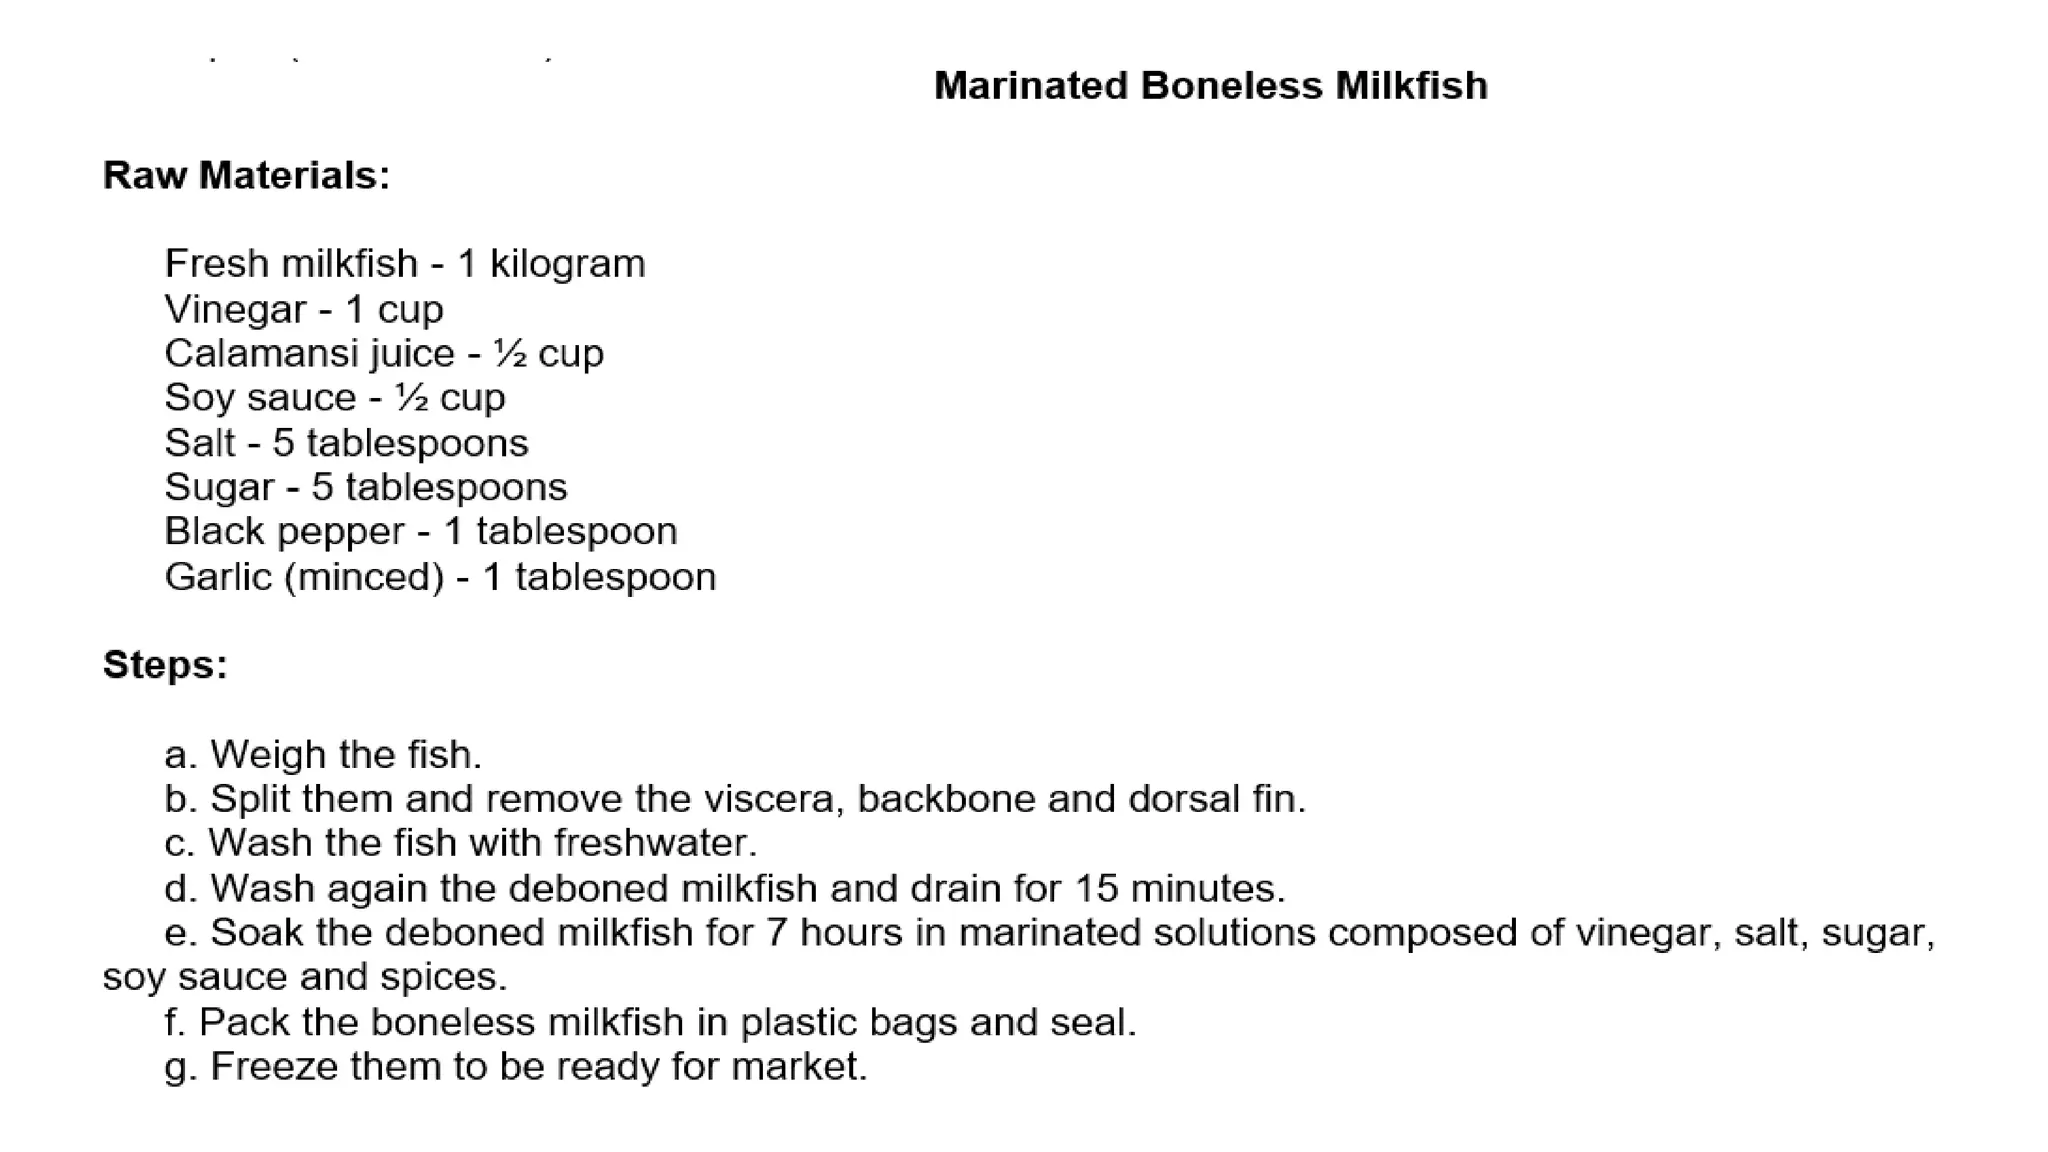
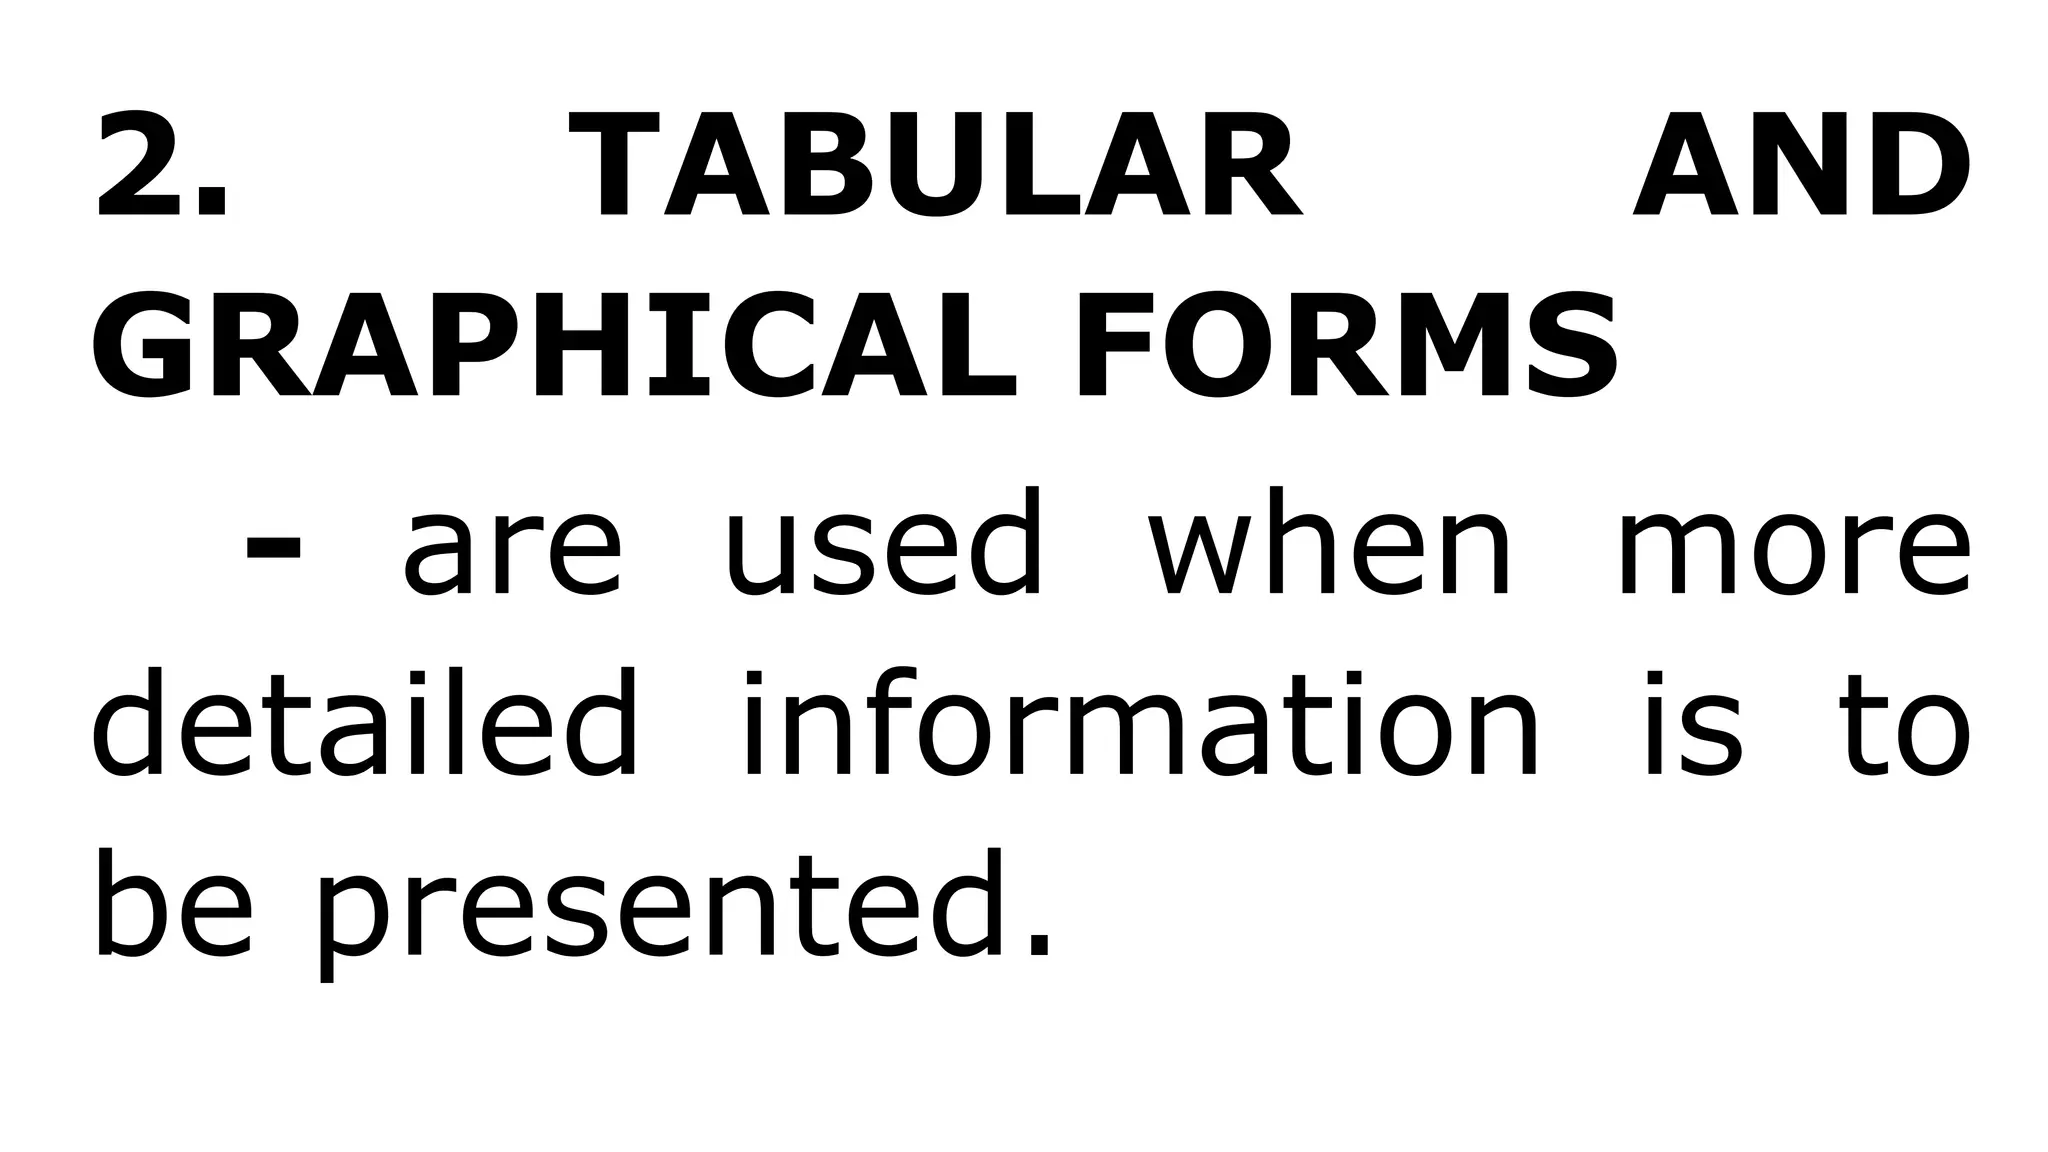
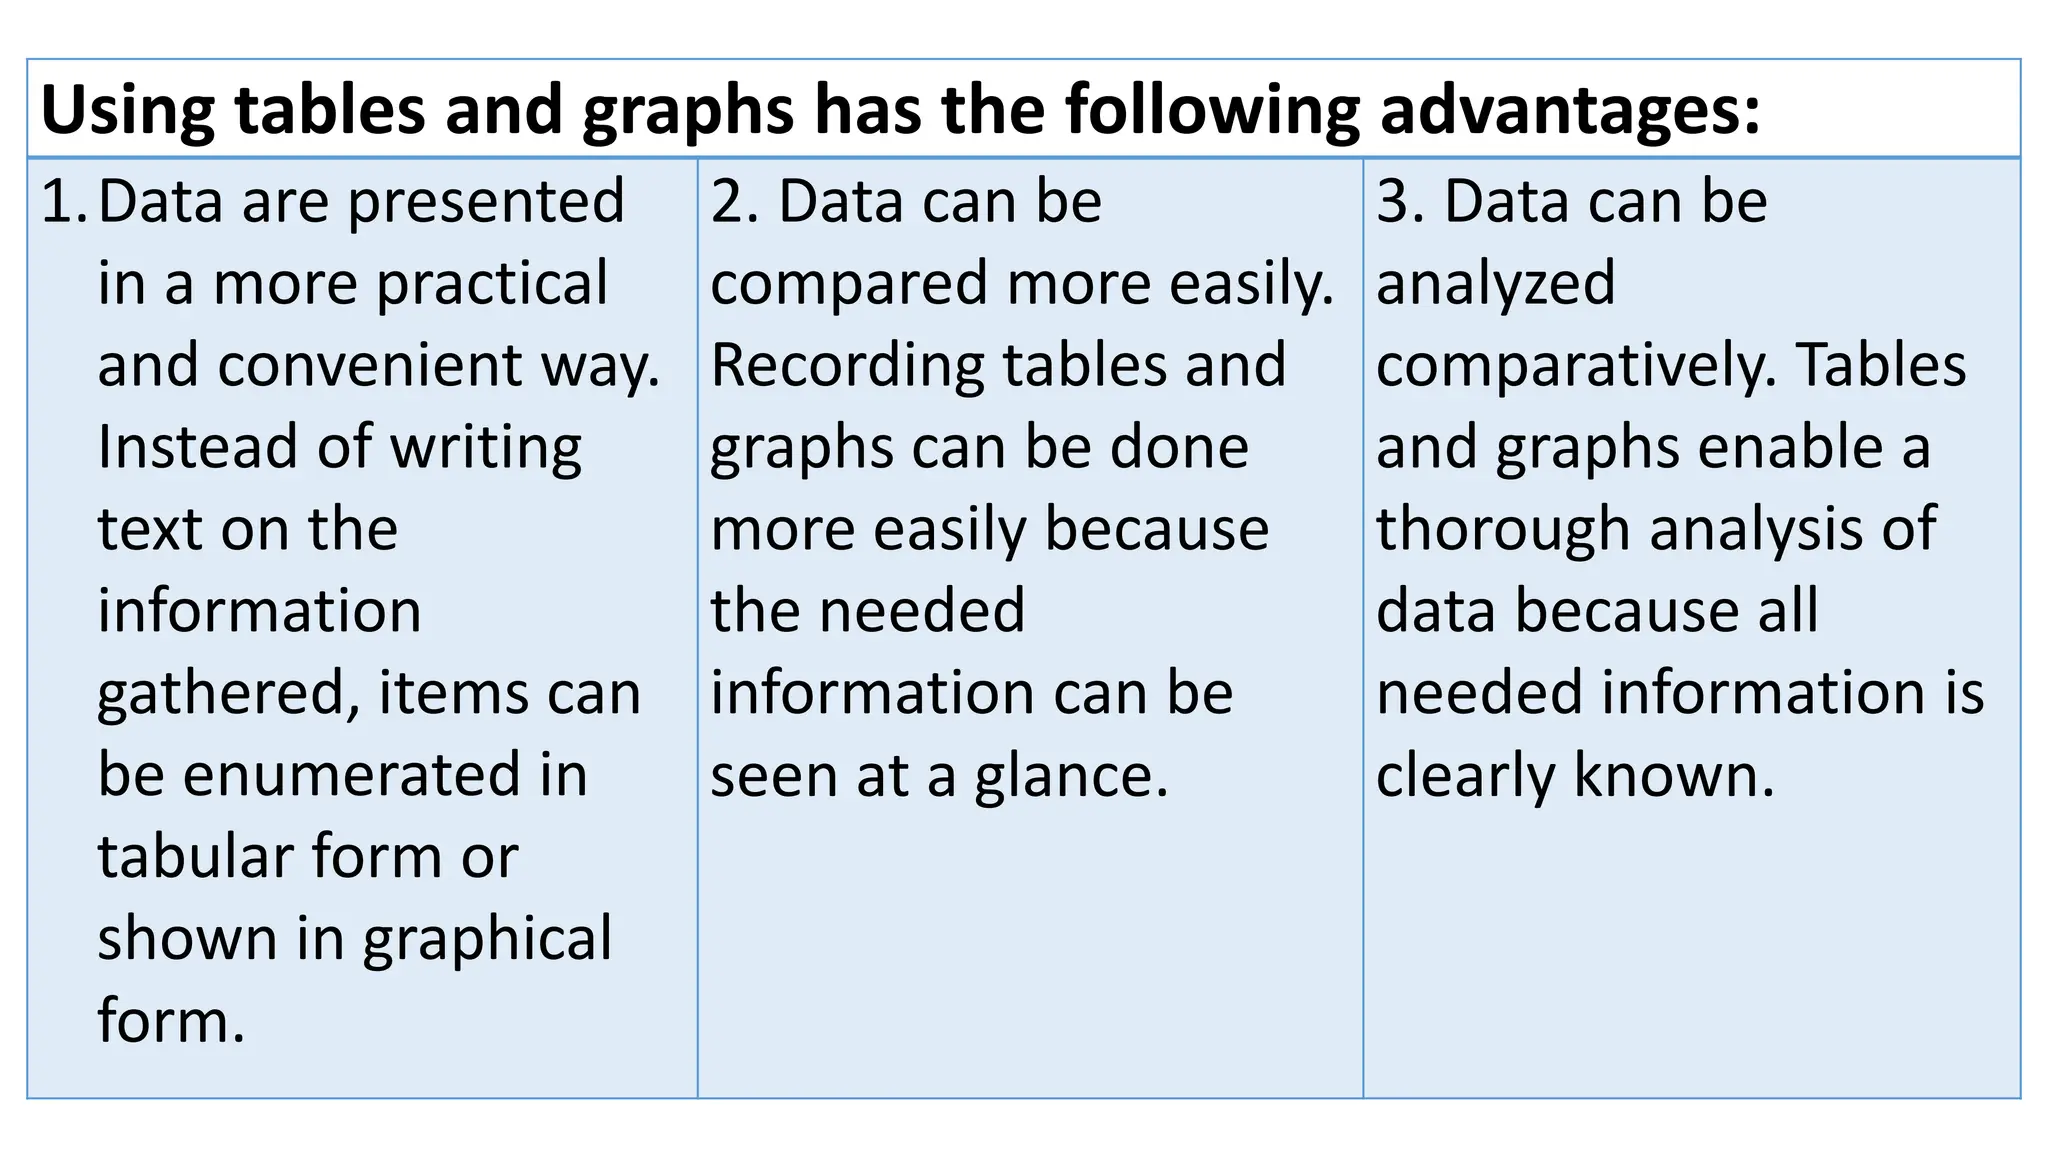
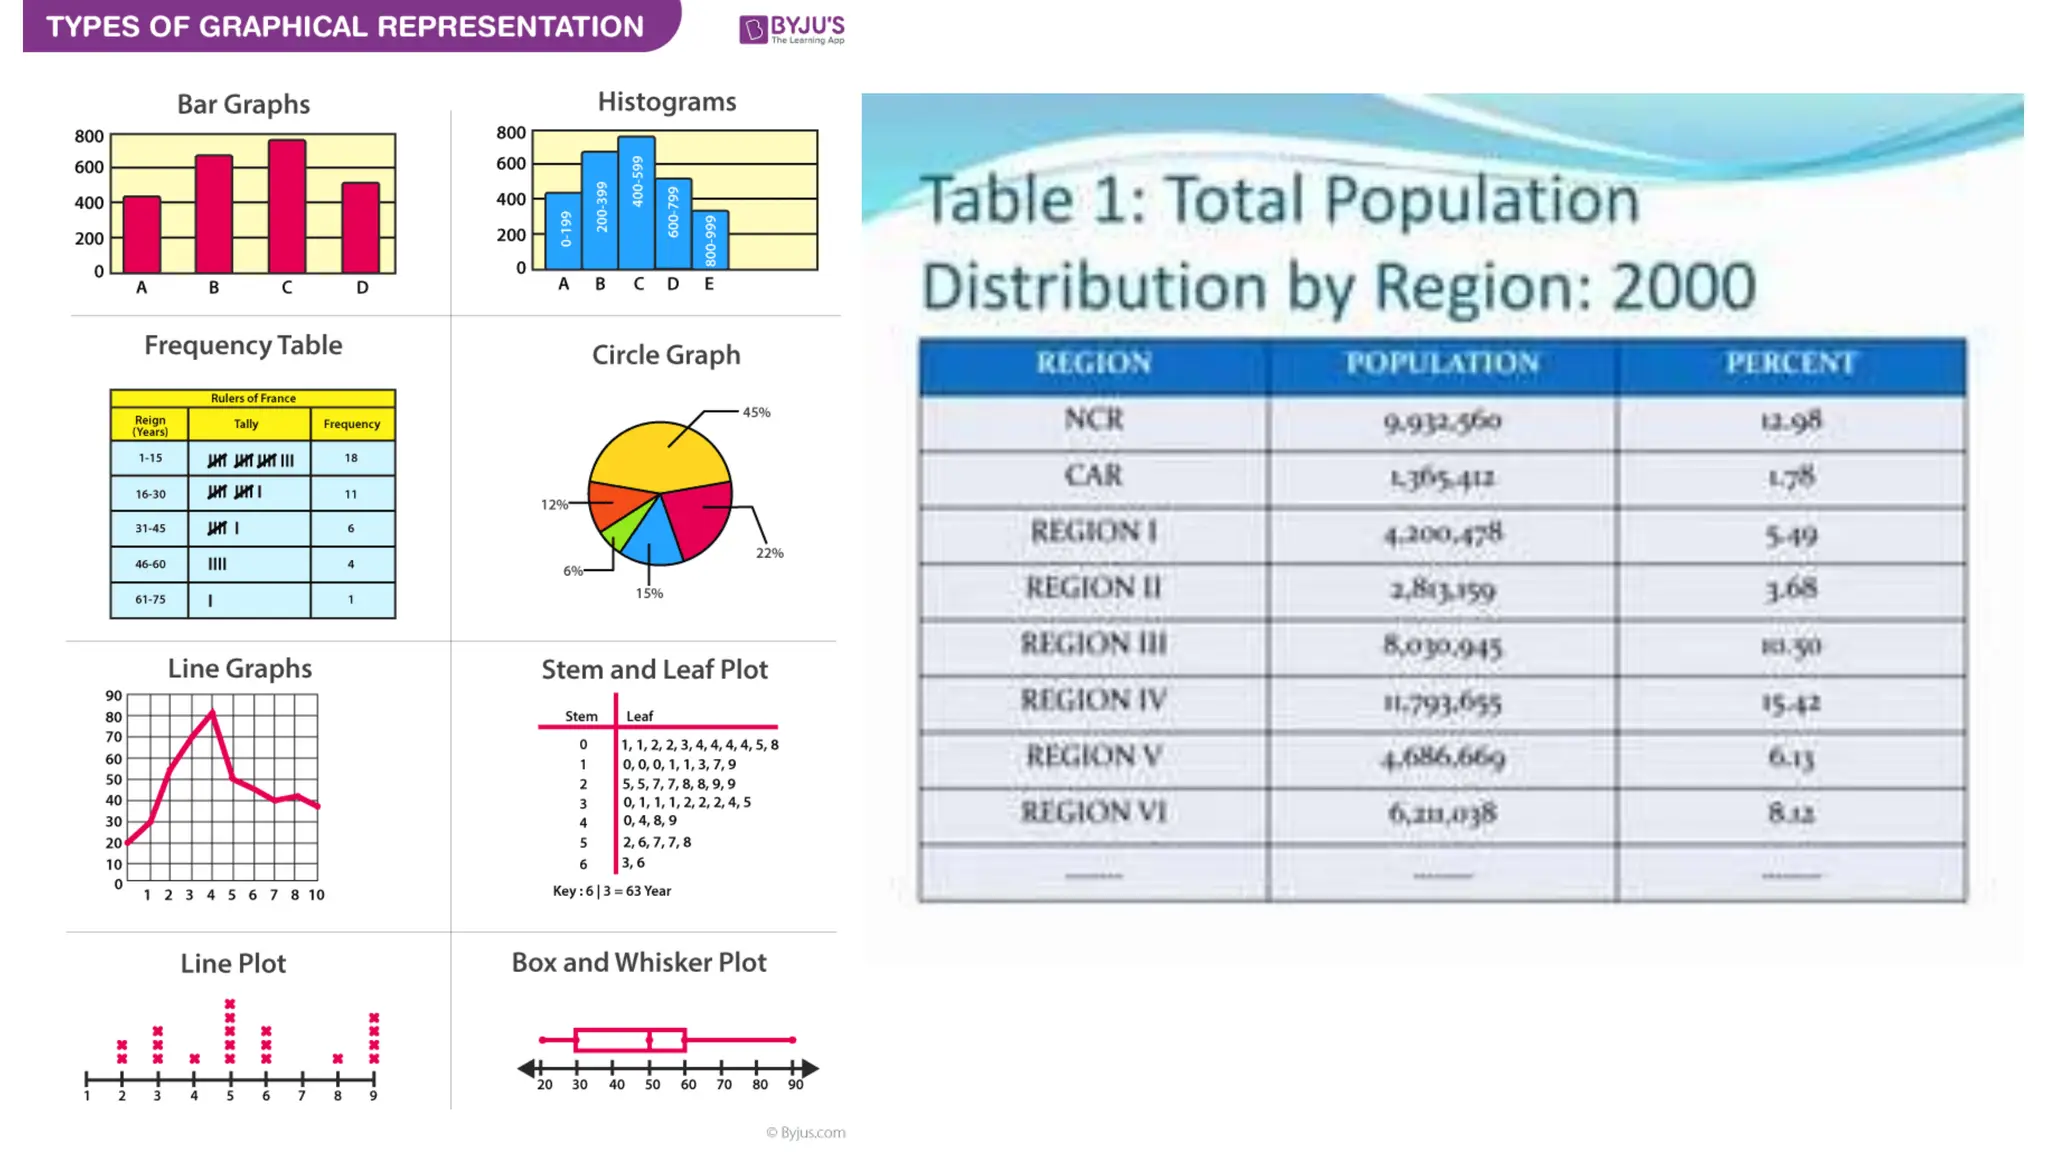
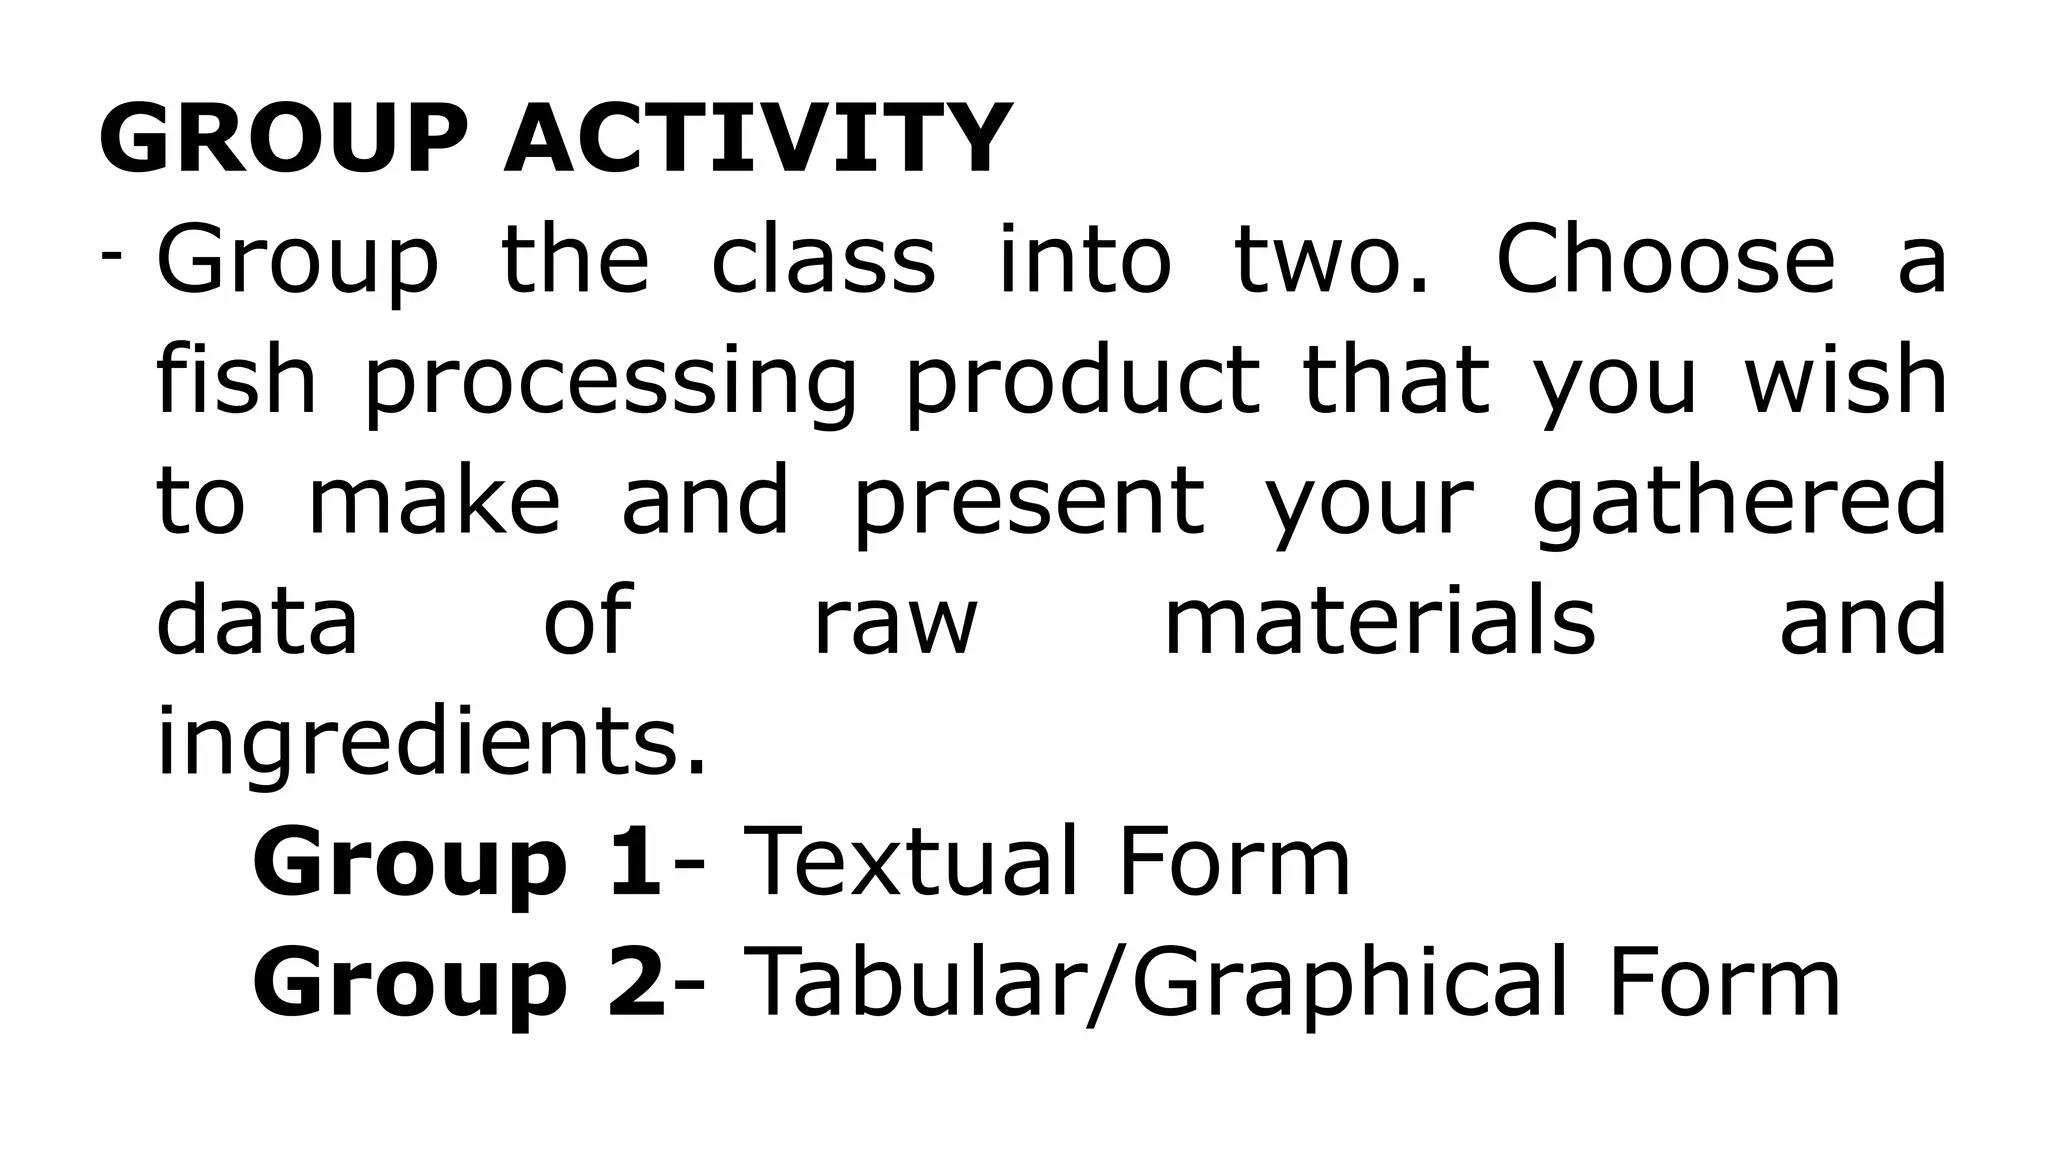
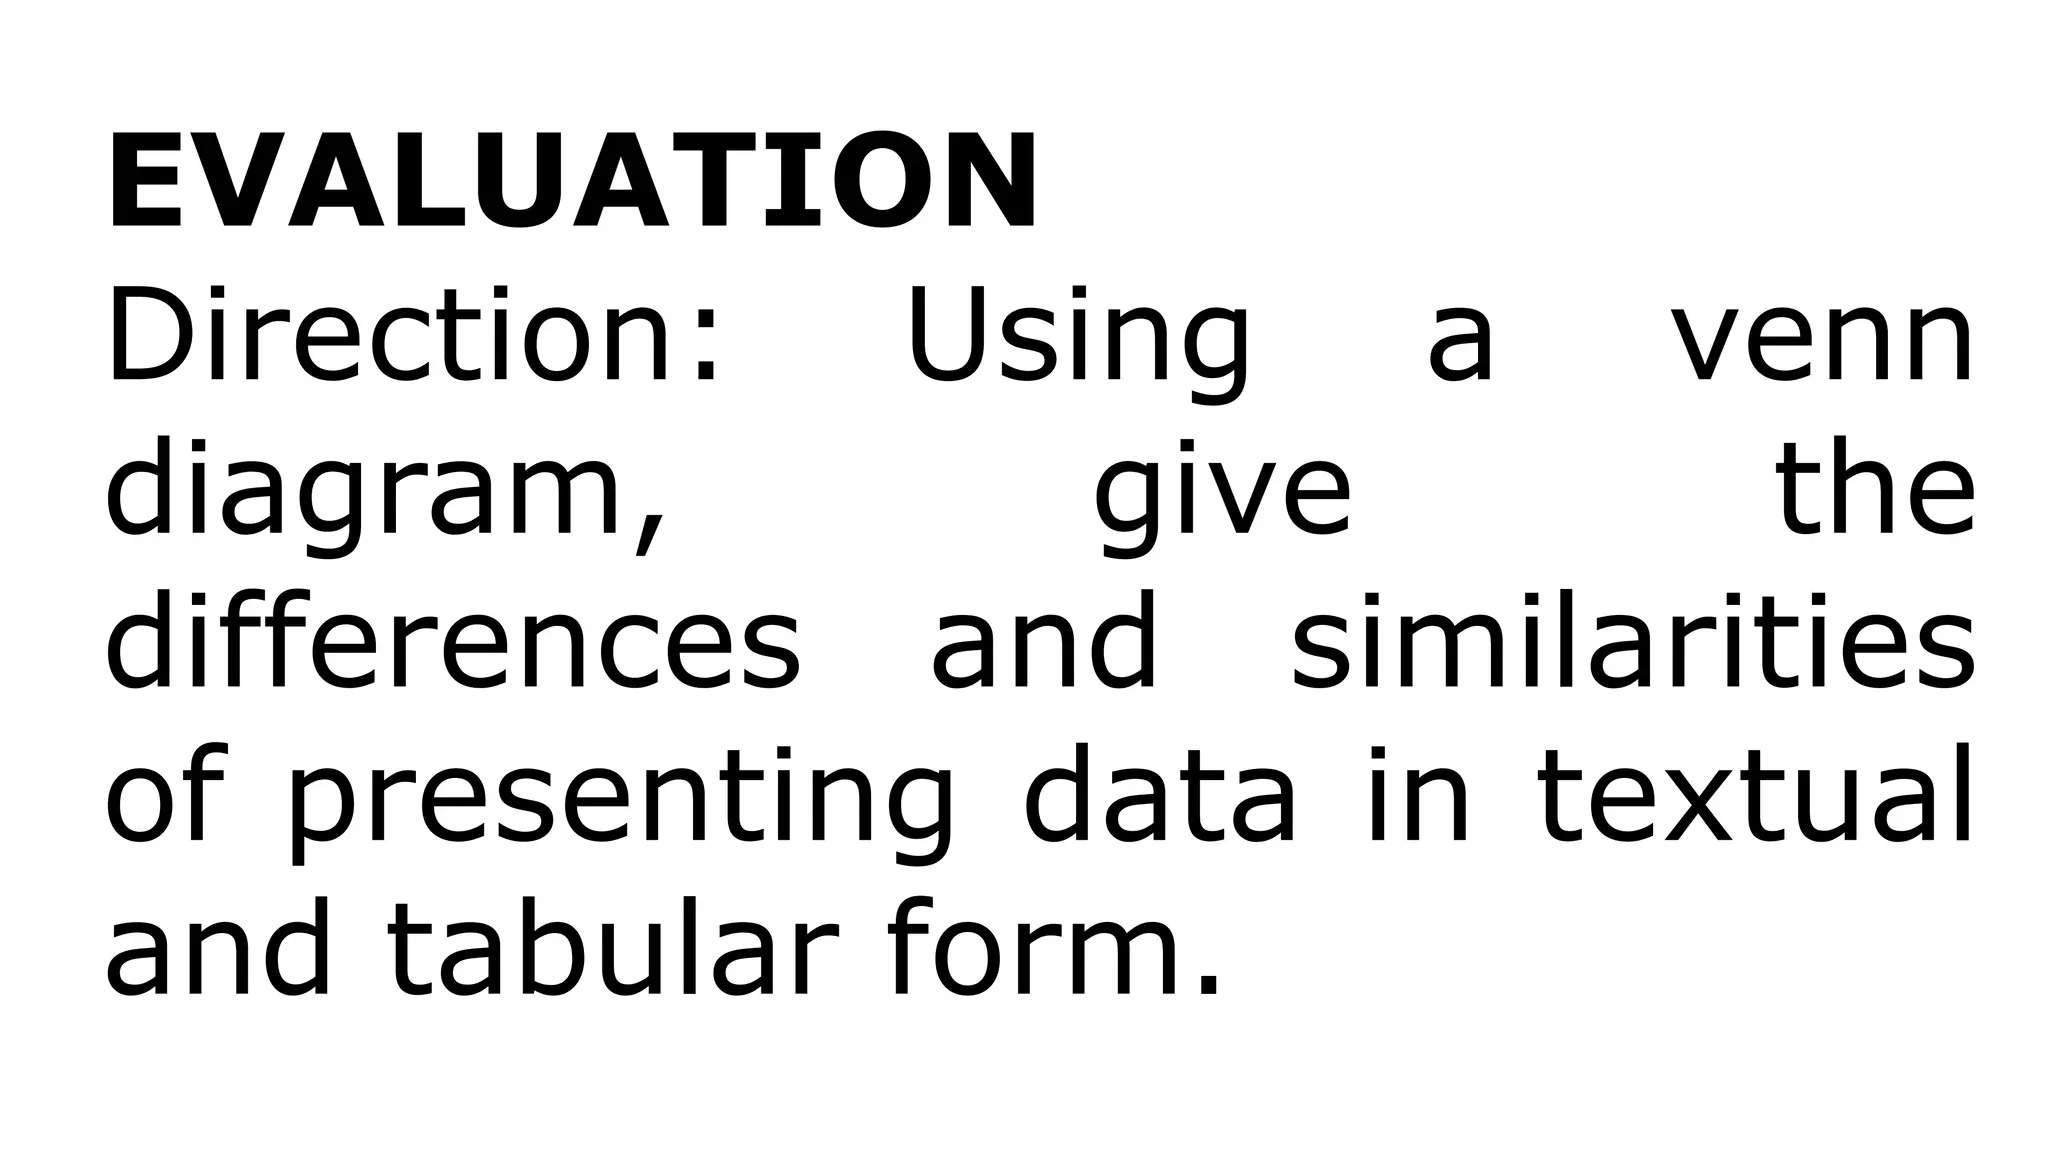
At the end of the lesson, the
learners are expected to:
a. Present gathered and
recorded data in food
processing
Summarizing and
Tabulating All Raw
Data Gathered
Any set of information or data collected for
study should be organized and analyzed
systematically for easier and faster
interpretation. To do this, collected data may
be presented in any of the following forms:
1. textual forms
2. tabular and graphical forms
1.TEXTUAL FORMS
- used when data
to be presented are
few.
2. TABULAR AND
GRAPHICAL FORMS
- are used when more
detailed information is to
be presented.
Using tables and graphs has the following advantages:
1.Data are presented
in a more practical
and convenient way.
Instead of writing
text on the
information
gathered, items can
be enumerated in
tabular form or
shown in graphical
form.
2. Data can be
compared more easily.
Recording tables and
graphs can be done
more easily because
the needed
information can be
seen at a glance.
3. Data can be
analyzed
comparatively. Tables
and graphs enable a
thorough analysis of
data because all
needed information is
clearly known.
GROUP ACTIVITY
- Group the class into two. Choose a
fish processing product that you wish
to make and present your gathered
data of raw materials and
ingredients.
Group 1- Textual Form
Group 2- Tabular/Graphical Form
EVALUATION
Direction: Using a venn
diagram, give the
differences and similarities
of presenting data in textual
and tabular form.

Summarizing and Tabulating Data.pptx.....

  • 2.
    At the endof the lesson, the learners are expected to: a. Present gathered and recorded data in food processing
  • 4.
  • 5.
    Any set ofinformation or data collected for study should be organized and analyzed systematically for easier and faster interpretation. To do this, collected data may be presented in any of the following forms: 1. textual forms 2. tabular and graphical forms
  • 6.
    1.TEXTUAL FORMS - usedwhen data to be presented are few.
  • 8.
    2. TABULAR AND GRAPHICALFORMS - are used when more detailed information is to be presented.
  • 9.
    Using tables andgraphs has the following advantages: 1.Data are presented in a more practical and convenient way. Instead of writing text on the information gathered, items can be enumerated in tabular form or shown in graphical form. 2. Data can be compared more easily. Recording tables and graphs can be done more easily because the needed information can be seen at a glance. 3. Data can be analyzed comparatively. Tables and graphs enable a thorough analysis of data because all needed information is clearly known.
  • 11.
    GROUP ACTIVITY - Groupthe class into two. Choose a fish processing product that you wish to make and present your gathered data of raw materials and ingredients. Group 1- Textual Form Group 2- Tabular/Graphical Form
  • 12.
    EVALUATION Direction: Using avenn diagram, give the differences and similarities of presenting data in textual and tabular form.