
Recommended
Recommended
More Related Content
Similar to STEM Images from refs(2).pptx
Similar to STEM Images from refs(2).pptx (20)
More from ssuser08e7481
Recently uploaded
Recently uploaded (20)
STEM Images from refs(2).pptx
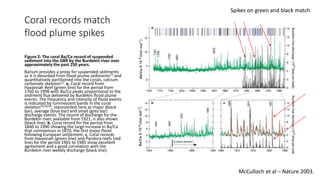
- 1. Coral records match flood plume spikes Figure 2: The coral Ba/Ca record of suspended sediment into the GBR by the Burdekin river over approximately the past 250 years. Barium provides a proxy for suspended sediments as it is desorbed from flood plume sediments21 and quantitatively partitioned into the corals, calcium carbonate skeleton22. a, Coral record from Havannah Reef (green line) for the period from 1760 to 1998 with Ba/Ca peaks proportional to the sediment flux delivered by Burdekin flood plume events. The frequency and intensity of flood events is indicated by luminescent bands in the coral skeleton19,20,28, represented here as major (black bar), average (blue bar) and small (grey bar) discharge events. The record of discharge for the Burdekin river, available from 1921, is also shown (black line). b, Coral record for the period from 1840 to 1990 showing the large increase in Ba/Ca that commences in 1870, the first major flood following European settlement. c, Coral records from Havannah (green line) and Pandora reefs (red line) for the period 1965 to 1985 show excellent agreement and a good correlation with the Burdekin river weekly discharge (black line). Spikes on green and black match McCulloch et al – Nature 2003.
- 2. Burdekin river discharge in 2010/2011 wet season – w. sediment type Fig. 2. (a) Time-series of Burdekin River discharge at Clare (120006B) during the 2010–2011 wet season. River water sample collection dates at Inkerman are overlayed as grey vertical lines grouped into three flood events. (b) Graph of TSS concentrations for the Burdekin River (Inkerman) surface water samples grouped into the three separate flood events as displayed in A. The sediment particle size composition of each sample is also represented using four particle size classes: clay (<3.9 μm), fine silt (3.9– 15.6 μm), coarse silt (15.6–63 μm) and sand (>63 μm) Bainbridge et al 2012, Marine Pollution Bulletin Sediment by flood event
- 3. Marine Snow – sediment aggregrates by depth. Microscope images captured from surface (a and b), 2 (c) and 5 m depth (d) in the plume water collected at Orchard Rocks on 06/01/11. Images show individual fine-grained sediment (i.e. clay and silt <15 μm) particles (b and c), large flocs (a) and large floc aggregates of fine particles and plankton remains encased by TEP (d) are still being carried in plume waters as far as Magnetic Island in the weeks after peak discharge. + microscope image of a large floc aggregate captured in surface waters off Acheron Island along Plume Transect 2. The fine-grained sediment particles bound in mucus have formed a large floc aggregate likely including zooplankton (e.g. copepod; see arrow) in the bottom-left corner of the image. fine-grained sediment (i.e. clay and silt <15 μm) particles large floc aggregates of fine particles and plankton at 5m and in surface water. Scale bars represent 100 μm length Bainbridge et al 2012, Marine Pollution Bulletin
- 4. Suspended sediment impairs fish growth and survival Wenger et al 2012 – JEMBE Fig. 2. Differences in growth rate and survival through time. Differences over time in (a) growth rate and (b) survival of juvenile Acanthochromis polyacanthus in the control (closed circle), low (open circle), medium (closed triangle), and high (open triangle) sediment treatments. Error bars are SE. Growth decreases as sediment load increases 1) Control (0 mg l− 1); (2) Low (45 mg l− 1; 7.5 NTU), (3) Medium (90 mg l− 1; 15 NTU), and (4) High (180 mg l− 1; 30 NTU)
- 5. Fig 4. Representative photos of the 5 damage levels used in the impact assessment and analysis. Beeden R, Maynard J, Puotinen M, Marshall P, Dryden J, et al. (2015) Impacts and Recovery from Severe Tropical Cyclone Yasi on the Great Barrier Reef. PLOS ONE 10(4): e0121272. https://doi.org/10.1371/journal.pone.0121272 https://journals.plos.org/plosone/article?id=10.1 371/journal.pone.0121272
- 6. Number of fish species in each family associating with live coral habitat as juveniles and adults. [Number in parenthesis = number of species globally (Fishbase), black bar = Juveniles, white bar = Adults] Proportion of fish associating with live coral habitat from different trophic groups Coker et al 2014
- 7. Fig. 5 a Number of coral species that each fish species is found to associate with, b top 13 fish species that associate with the highest number of coral species Coker et al 2014 Corals matter to fish