Learning Objectives
• •Understand data and its representation
• • Construct and interpret bar graphs and pie
charts
• • Calculate mean, median, and mode
• • Understand and calculate probability
through real-life examples
3.
Introduction to Dataand Statistics
• Statistics helps us collect, organize, and
interpret data.
• Examples: Survey of students’ favorite sport,
temperature records, test marks.
4.
Types of Data
•• Raw Data – Unorganized data collected from
source
• • Grouped Data – Data organized in a
frequency table
• • Frequency – Number of times a value occurs
5.
Steps in DataHandling
• 1. Collection of data
• 2. Organization of data
• 3. Representation using tables and graphs
• 4. Interpretation and analysis
6.
Pictograph
• • Usespictures or symbols to represent data.
• Example (from DAV Book):
• Number of books read by students in a week.
• 1 symbol = 2 books.
7.
Bar Graph
• •Shows data using rectangular bars.
• Example: Marks scored by 5 students in a test.
• • Can be vertical or horizontal.
8.
Double Bar Graph
•• Compares two related sets of data.
• Example: Marks of boys and girls in
Mathematics and Science.
9.
Pie Chart (CircleGraph)
• • Represents data as parts of a circle.
• Example: Time spent in daily activities – study,
play, sleep.
10.
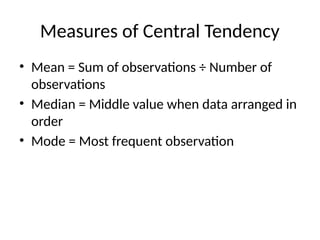
Measures of CentralTendency
• Mean = Sum of observations ÷ Number of
observations
• Median = Middle value when data arranged in
order
• Mode = Most frequent observation
11.
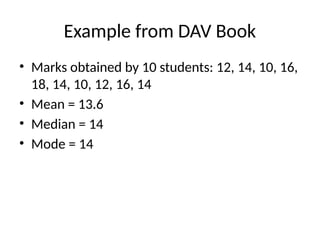
Example from DAVBook
• Marks obtained by 10 students: 12, 14, 10, 16,
18, 14, 10, 12, 16, 14
• Mean = 13.6
• Median = 14
• Mode = 14
12.
Real-Life Applications
• •Weather forecasting uses statistics
• • Sports records and averages
• • Business sales analysis
13.
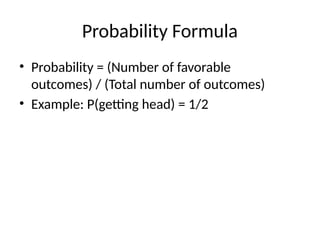
Introduction to Probability
•Probability means the chance of an event
happening.
• Example: Getting a head on tossing a coin.
14.
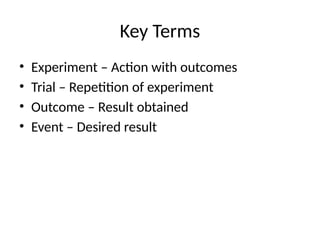
Key Terms
• Experiment– Action with outcomes
• Trial – Repetition of experiment
• Outcome – Result obtained
• Event – Desired result
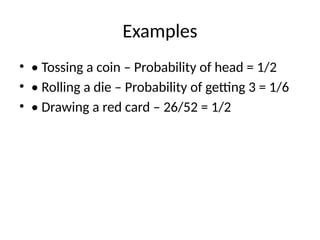
Examples
• • Tossinga coin – Probability of head = 1/2
• • Rolling a die – Probability of getting 3 = 1/6
• • Drawing a red card – 26/52 = 1/2
17.
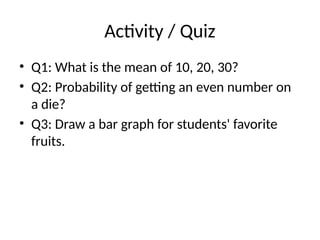
Activity / Quiz
•Q1: What is the mean of 10, 20, 30?
• Q2: Probability of getting an even number on
a die?
• Q3: Draw a bar graph for students' favorite
fruits.
18.
Summary
• • Datacan be represented through graphs and
charts.
• • Mean, median, and mode describe data.
• • Probability measures chance.
• • Both topics are used in daily life decisions.
19.
Assessment
• 1. Constructa double bar graph using your
class data.
• 2. Find mean, median, and mode of marks in
Mathematics.
• 3. Find probability of getting tails when a coin
is tossed.
20.
Thank You
• Reflect:Where do you see statistics and
probability in real life?
• (Weather, games, reports, etc.)
![Statistics and Probability
• Class 8 Mathematics (CBSE/DAV)
• Prepared by: [Your Name]
• Subject: Mathematics](https://image.slidesharecdn.com/statisticsandprobabilityclass8dav-251008031921-70f6fe78/85/Statistics_and_Probability_Class8_DAV-pptx-1-320.jpg)
![Statistics and Probability
• Class 8 Mathematics (CBSE/DAV)
• Prepared by: [Your Name]
• Subject: Mathematics](https://image.slidesharecdn.com/statisticsandprobabilityclass8dav-251008031921-70f6fe78/75/Statistics_and_Probability_Class8_DAV-pptx-1-2048.jpg)


![Lesson3 lpart one - Measures mean [Autosaved].pptx](https://cdn.slidesharecdn.com/ss_thumbnails/lesson2-measuresmeanautosaved-241011173812-613e1e66-thumbnail.jpg?width=640&height=640&fit=bounds)


