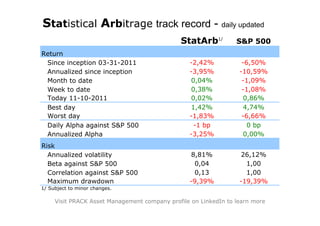
The statistical arbitrage strategy has underperformed the S&P 500 since inception in March 2011, with lower annualized returns and higher volatility. However, it has experienced smaller drawdowns than the market and has a near-zero correlation and beta to the S&P 500, demonstrating its ability to act as a hedge against general market moves.
1. Statistical Arbitrage track record - daily updated
StatArb1/ S&P 500
Return
Since inception 03-31-2011 -2,42% -6,50%
Annualized since inception -3,95% -10,59%
Month to date 0,04% -1,09%
Week to date 0,38% -1,08%
Today 11-10-2011 0,02% 0,86%
Best day 1,42% 4,74%
Worst day -1,83% -6,66%
Daily Alpha against S&P 500 -1 bp 0 bp
Annualized Alpha -3,25% 0,00%
Risk
Annualized volatility 8,81% 26,12%
Beta against S&P 500 0,04 1,00
Correlation against S&P 500 0,13 1,00
Maximum drawdown -9,39% -19,39%
1/ Subject to minor changes.
Visit PRACK Asset Management company profile on LinkedIn to learn more