
Recommended
Recommended
More Related Content
What's hot
What's hot (10)
Similar to SSS_Vol_II_HHRA_Appendix_J_b_GolderBioaccessibilityRound1
Similar to SSS_Vol_II_HHRA_Appendix_J_b_GolderBioaccessibilityRound1 (20)
More from Guy Gilron
More from Guy Gilron (16)
SSS_Vol_II_HHRA_Appendix_J_b_GolderBioaccessibilityRound1
- 1. FINAL DRAFT REPORT FOR PEER REVIEW BIOACCESSIBILITY TESTING OF SOIL AND HOUSE DUST SAMPLES FROM THE SUDBURY SOILS STUDY Submitted to: The SARA Group c/o Cantox Environmental Inc. 1900 Minnesota Court, Suite 130 Mississauga, Ontario L5N 3C9 DISTRIBUTION: 2 Copies - The SARA Group 2 Copies - Golder Associates Ltd. June 2006 04-1112-069 Golder Associates Ltd. 2390 Argentia Road Mississauga, Ontario, Canada L5N 5Z7 Telephone: (905) 567-4444 Fax: (905) 567-6561 OFFICES ACROSS NORTH AMERICA, SOUTH AMERICA, EUROPE, AFRICA, ASIA AND AUSTRALIA
- 2. June 2006 - i - 04-1112-069 Golder Associates EXECUTIVE SUMMARY Golder Associates Ltd. (Golder) was retained by The SARA Group to conduct in vitro bioaccessibility testing using soil and house dust samples from the Sudbury area, in support of the Human Health Risk Assessment (HHRA) currently being conducted as part of the Sudbury Soils Study (SSS). The bioaccessibility assay applied involves chemically mimicking two phases of the human digestion process, namely, the gastric and the intestinal phases. Soil (n=86) and house dust (n=10) samples collected from the Sudbury area were dried and sieved to represent the <250 μm or <60 μm size fractions, respectively. The 250 μm fraction is deemed the most important soil fraction for incidental ingestion via skin and hand-to-mouth behaviour. Using a mass balance approach, the bioaccessibility was calculated using the ratio of the concentration of metal (or metalloid) found in the extraction fluid to the concentration of metal (or metalloid) present in soil or dust. This bioaccessibility fraction can then be used in exposure assessments to more accurately assess the risk of exposure to metals via ingestion of contaminated soil or dust particles. The Student’s-t 95% upper confidence limit of the mean (95UCL) statistic for arsenic, cobalt, copper, lead, nickel and selenium in Sudbury soil was estimated to be 36.8%, 26.4%, 64.4%, 16.0%, 37.6% and 20.3% (values based on all analytical data; see comment below for selenium), respectively. However, because the data for arsenic, nickel and selenium were not normally distributed, the recommended 95UCL statistic, as determined using the US EPA program ProUCL (U.S. EPA, 2004) was the Chebyshev 95UCL of 41.1%, 42.0% and 27.2%, respectively. For house dust, the Student’s-t 95UCL statistic was 3.7%, 2.4%, 4.6%, 3.4% and 1.2% for arsenic, cobalt, copper, lead and nickel, respectively. The data for nickel was not normally distributed, and therefore, as outlined above, the recommended 95UCL statistic was the Chebyshev 95UCL which was estimated to be 2.0%. Selenium in house dust was below the method detection limit (MDL) for all samples and 95UCL statistics were not calculated for this metal. The maximum values for house dust were 5.4%, 3.3%, 6.0%, 6.8% and 3.3% for arsenic, cobalt, copper, lead and nickel, respectively. Maximum values were not calculated for selenium because the concentrations were below the MDL. Based on the results of the bioaccessibility testing conducted with Sudbury soils and house dust, Golder provides the following recommendations for consideration: • That point estimates of the 95UCL be used in all exposure assessments for soil, and the point estimates of the 95UCL or the maximum be used in all exposure assessments for dust. When data are not normally distributed, the Chebyshev 95UCL statistic should be used. When data are normally distributed the Students-t 95UCL statistic should be used; • Bioaccessibility estimates for selenium in soil are provided in three (3) ways. The bioaccessibility estimates of 20.3% and 27.2%, based on the Student’s-t 95UCL and the
- 3. June 2006 - ii - 04-1112-069 Golder Associates Chebyshev 95UCL, respectively, are based on all data (n=86); samples at or below the MDL were assumed to have values of one-half the MDL for the calculations. In addition, the bioaccessibility estimates were calculated using only data where selenium was above the MDL in the sieved soil (n=54), and when selenium was above the MDL in both the sieved soil and the extraction fluid (n=24). The bioaccessibility point estimates using the 95UCL for data with selenium above the MDL in the sieved soil and with selenium above the MDL in both sieved soil and extraction fluid, respectively were 19.6% and 26.3%, and 33.9% and 41.2% based on the Student’s-t 95UCL and Chebyshev 95UCL, respectively. The data have been presented in three (3) ways to reflect the uncertainty in the analytical data when an element is reported near the MDL. Golder recommends use of the Chebyshev 95UCL calculated using the data with selenium above the MDL in both the sieved soil and extraction fluid of 41.2% for this metal; and, • The bioaccessibility of soil-bound lead was much higher (~60%) following gastric extraction, compared with the bioaccessibility following gastric and intestinal extraction (~20%). The difference in bioaccessibility between extractions can probably be attributed to complexation of the lead with bile added during the gastric and intestinal extraction, making lead less bioaccessible. This binding would also likely occur in the human intestine. Still, it is recommended that the bioaccessibility values determined from the gastric extractions be used in the HHRA, despite the small sample size (i.e., n=10).
- 4. June 2006 - iii - 04-1112-069 Golder Associates TABLE OF CONTENTS SECTION PAGE 1.0 INTRODUCTION......................................................................................... 1 1.1 Overview of Bioaccessibility Testing .......................................................1 1.2 Objective of this Report ...........................................................................3 2.0 METHODS .................................................................................................. 3 2.1 Overview of Golder’s Method for Bioaccessibility Testing.......................3 2.1.1 Use of Bioaccessibility Testing in Human Health Risk Assessments ...........................................................................................4 2.2 Extraction Procedures .............................................................................5 2.2.1 Preparation of Soil Samples ........................................................5 2.2.2 Preparation of Dust Samples.......................................................6 2.2.3 Preparation of Gastric Fluids .......................................................6 2.2.4 Gastric Phase Extraction Technique ...........................................6 2.2.5 Intestinal Phase Extraction Technique ........................................6 2.3 Determining the Bioaccessibility of Nickel in Rat Chow ..........................7 2.4 Quality Assurance/Quality Control Measures..........................................8 2.5 Preliminary Testing..................................................................................8 2.6 Bioaccessibility Calculations....................................................................8 3.0 RESULTS.................................................................................................... 9 3.1 Preliminary Testing..................................................................................9 3.2 Bioaccessibility in Soil Samples ..............................................................9 3.3 Bioaccessibility in Dust Samples...........................................................11 3.4 Quality Assurance/Quality Control.........................................................12 3.5 Glycine and Nickel.................................................................................14 4.0 RECOMMENDATIONS............................................................................. 15 5.0 LIMITATIONS AND USE .......................................................................... 16 6.0 CLOSURE................................................................................................. 17 REFERENCES..................................................................................................... 18 LIST OF TABLES Table 1 Mean and 95% upper confidence limit for estimating the bioaccessible fraction of each of the 6 elements present in soil samples and dust collected from houses in the Sudbury area. Table 2 The quantity of arsenic, cobalt, copper, lead, nickel and selenium detected in the extraction fluid and blank samples. Table 3 Quantity of arsenic, cobalt, copper, lead, nickel and selenium detected in pancreatin and bile used for the extraction procedure.
- 5. June 2006 - iv - 04-1112-069 Golder Associates Table 4 Analysis of distilled water used in the extraction procedure. Table 5A Percent relative differences in metal concentrations of the extraction fluids following gastric and intestinal extractions of duplicate soil samples, and summary statistics. Table 5B Percent relative differences in metal concentrations of the extraction fluids following gastric and intestinal extractions of duplicate samples of NIST SRM 2711 (Montana Soil). Table 5C Percent relative differences in metal concentrations of the extraction fluids following gastric and intestinal extractions of replicate samples of NIST SRM 2583 (Trace Elements in Indoor Dust). Table 6 Ratio of blank spiked samples and blank spiked samples undergoing the full gastric and intestinal extraction for each metal analyzed, used to determine the recovery of the extraction procedure. LIST OF FIGURES Figure 1 Comparison of Bioaccessibility of Arsenic under Gastric Extraction (GE) or Gastric and Intestinal Extraction (GIE) Figure 2 Comparison of Bioaccessibility of Cobalt under Gastric Extraction (GE) or Gastric and Intestinal Extraction (GIE) Figure 3 Comparison of Bioaccessibility of Copper under Gastric Extraction (GE) or Gastric and Intestinal Extraction (GIE) Figure 4 Comparison of Bioaccessibility of Lead under Gastric Extraction (GE) or Gastric and Intestinal Extraction (GIE) Figure 5 Comparison of Bioaccessibility of Nickel under Gastric Extraction (GE) or Gastric and Intestinal Extraction (GIE) Figure 6 Comparison of Bioaccessibility of Selenium under Gastric Extraction (GE) or Gastric and Intestinal Extraction (GIE) Figure 7 Bioaccessibility of Arsenic in Soils Figure 8 Bioaccessibility of Cobalt in Soils Figure 9 Bioaccessibility of Copper in Soils Figure 10 Bioaccessibility of Lead in Soils Figure 11 Bioaccessibility of Nickel in Soils Figure 12A Bioaccessibility of Selenium in Soils-All data Figure 12B Bioaccessibility of Selenium in Soil-Excluding Data with below MDL in Sieved Soil Figure 12C Bioaccessibility of Selenium-excluding data below MDL in either the extraction fluid or the sieved soil fraction Figure 13 Bioaccessibility of Arsenic in Dust Figure 14 Bioaccessibility of Cobalt in Dust Figure 15 Bioaccessibility of Copper in Dust
- 6. June 2006 - v - 04-1112-069 Golder Associates Figure 16 Bioaccessibility of Lead in Dust Figure 17 Bioaccessibility of Nickel in Dust LIST OF APPENDICES Appendix A Chain of Custody Forms Appendix B Laboratory Analytical Data Appendix C Golder’s Method Development Rationale Appendix D Soil, Dust and Extraction Fluid Analytical Results and Bioaccessibility Estimates Appendix E ProUCL Outputs for Metals in Soil and Dust Appendix F Sample Calculations
- 7. June 2006 - 1 - 04-1112-069 Golder Associates 1.0 INTRODUCTION 1.1 Overview of Bioaccessibility Testing Human health impacts resulting from exposure to metal-contaminated soil is assumed to result primarily from the oral soil ingestion pathway. This is especially true for children who ingest relatively large quantities of soil as a result of typical hand-to-mouth behaviour (Oomen et al., 2004). However, when determining human health risks associated with metal-impacted soil, toxicity has generally been evaluated by means of ingestion of metals contained in food or dissolved in drinking water. Metals present in soil are generally less bioavailable than metals contained in food or water matrices (Casteel et al., 1997; Ruby et al., 1999; Oomen et al., 2003). The implications of this phenomenon to human health risk assessments (HHRA) is that a considerable overestimation of the exposure and risk associated with ingestion of metal-impacted soil is likely; therefore, an accurate prediction of human health risks is problematic. For example, the United States Environmental Protection Agency (U.S. EPA) has derived toxicity reference values (TRVs) for cancer and non-cancer effects of arsenic based on epidemiological studies of arsenic in drinking water (U.S.EPA, 2006). Typically, close to 100% of arsenic ingested in this form is available to be taken up across human intestinal epithelial cells; hence, it has the potential to cause adverse health effects. However, a substantially smaller proportion of ingested arsenic bound to soil becomes available during transit through the human gastrointestinal tract and is, therefore, less is available to be taken up across the intestines (Ruby et al., 1996). The need to accurately predict the quantity of metal available to exert toxicity in different matrices (i.e., food, water, soil) was identified more than a decade ago (Ruby et al., 1993; U.S. EPA, 1989). Accounting for matrix effects will reduce some of the uncertainty surrounding the TRVs used in risk assessments (RA) (Maddaloni, 2004). Many countries now allow for an adjustment for the bioavailability of soil-borne contaminants by their relative availability in soil in comparison with the medium (i.e., food or water) used in the toxicity study upon which the TRV is based (U.S. EPA, 1989). This is defined as the relative bioavailability and the exposure is adjusted using a relative absorption factor (or RAF). Soil contaminant bioavailability can be influenced by a number of abiotic and biotic factors. Abiotic factors include: contaminant speciation, soil properties (such as organic matter and clay content), contaminant source, and age of contaminant. Biotic factors include organisms that can alter contaminant availability in soil (such as microorganisms and plants through the release of chelators or enzymes), as well as physiological properties of the organism ingesting the soil. For instance, the physiologies of children and adults differ (e.g., stomach and intestinal pHs and residence times, etc.), and therefore the contaminant bioavailability can differ accordingly. Since using humans to determine contaminant bioavailability is not an option, test animals with similar physiological characteristics to humans can be used to conduct in vivo site-specific bioavailability testing. However, due to the relative infeasibility of conducting suitable animal studies (from both an ethical and economic point of view), alternative methods that are easy-to-use, humane,
- 8. June 2006 - 2 - 04-1112-069 Golder Associates and relatively inexpensive are preferred. In vitro bioaccessibility testing is one of the alternative methods developed for this purpose. In vitro bioaccessibility testing involves chemically mimicking the human gastrointestinal tract, thereby providing an estimate of the concentration of soil-borne contaminants potentially available for uptake during transit through the gastrointestinal tract. This type of testing does not take into account absorption or metabolism once taken up by the organism. It is therefore a highly conservative estimate of the amount of a contaminant potentially reaching systemic circulation and resulting in a toxic effect on an organism. Since these tests are designed to mimic the human gastrointestinal system, they may be the most accurate and practical approach to estimating contaminant bioavailability in humans, and may provide better predictive capabilities than the rat or swine studies typically used for this purpose (Ruby, 2004). They are also more economically feasible, allowing for better characterization of the heterogeneous conditions in soil, and do not have the associated ethical limitations that animal studies carry (Ruby, 2004). To date, a number of bioaccessibility testing protocols have been developed, and/or tested in government-funded projects. A critical review of the literature by the United Kingdom Environment Agency and the British Geological Survey in 2002 (Environment Agency and British Geological Society, 2002) identified the following methods as the most suitable for use to date: 1. The PBET (modified Physiologically-Based Extraction Test) method modified from Miller et al. (Miller et al., 1981) by Ruby et al. (1993). The original method of Miller et al. (1981) was a nutritional study developed to determine the bioavailability of iron in food. The modified method of Ruby et al. (1993) uses 1 g of soil and 100 mL of extraction fluid and contains both a gastric and intestinal phase extraction procedure; 2. SBET method (Simplified Bioaccessibility Extraction Test). This method is similar to the PBET method, but uses only a gastric phase, and was originally designed for use with lead only (British Geological Survey); 3. The RIVM method (In Vitro Digestion Model, National Institute of Public Health and the Environment, the Netherlands). This method is a 3-phase method, with saliva, gastric and intestinal phases, and uses 0.6 g of soil and 13.5 mL of gastric fluid; and, 4. The DIN method (Method E DIN 19738, Ruhr-Universitat Bochum (RUB, Germany), comprises both gastric and intestinal phases, and can simulate a fed state by the addition of milk powder. The ratio of soil to extraction fluid is 1:50 (2.0 g of soil and 100 mL of gastric fluid). There are advantages and disadvantages to each of the methods described above, but consideration should be given to the validation status, ease of use and comparability to an animal
- 9. June 2006 - 3 - 04-1112-069 Golder Associates model (Environment Agency, 2005). The U.S. EPA and U.S. EPA Region VIII have been involved in conducting swine and monkey bioavailability studies for use in the validation of bioaccessibility tests for just under a decade (Ruby et al., 1999). The U.S. EPA are also in the final stages of publishing a guidance document relating to the use of bioavailability adjustments in RAs; it is expected that bioaccessibility testing will be endorsed, at least for some elements, for use in HHRA. It has also been suggested that the U.S. EPA, rather than endorsing one method for bioaccessibility testing, will instead be outlining criteria for each test (Environment Agency, 2005; Maddaloni, 2004). Other regulatory jurisdictions are following this approach and are reviewing or awaiting in vitro/in vivo study results prior to releasing their final position (Environment Agency, 2005). For example, the UK’s Environment Agency recognizes the usefulness of bioaccessibility testing and requests that submissions of this type of method in support of RA provide supporting evidence that the method is scientific and robust, and that uncertainties have been addressed in any conclusions made regarding the bioaccessibility testing (Environment Agency, 2005). The use of bioaccessibility testing in HHRA will reduce some uncertainty surrounding the TRVs by adjusting for exposure medium (Maddaloni, 2004), and therefore will strengthen the RA making the results more accurate, realistic, and scientifically defensible. 1.2 Objective of this Report Golder Associates Ltd. (Golder) was retained by The SARA Group (SARA) to conduct in vitro bioaccessibility testing with soil and house dust samples collected from the Sudbury area, in support of the Human Health Risk Assessment (HHRA) being conducted as part of the Sudbury Soils Study (SSS). The original Request for Proposals (RFP) issued by The SARA Group, and dated August 27, 2004 (SARA, 2004) included a draft Standard Operating Procedure (SOP) for a bioaccessibility assay methodology. Golder’s proposal to conduct the testing indicated that some issues of incompatibility existed between the bioaccessibility approach outlined in the RFP and the methodology developed by Golder. Furthermore, Golder’s previous experience with bioaccessibility testing had already addressed a number of issues identified in the RFP (SARA, 2004). In consultation with The SARA Group, a phased approach was developed to evaluate whether gastric or gastric and intestinal extraction would be more appropriate for the bioaccessibility program for the SSS. This report outlines the methodology, results, conclusions, and recommendations from the study. 2.0 METHODS 2.1 Overview of Golder’s Method for Bioaccessibility Testing An overview of the rationale for Golder’s bioaccessibility testing method development is provided in Appendix C.
- 10. June 2006 - 4 - 04-1112-069 Golder Associates Golder has been conducting research and development in support of bioaccessibility testing evaluations since the spring of 2003. Golder’s methods were developed with the intention of supplementing HHRAs with more realistic estimates of risks to receptors based on the site- specific availability of compounds bound to the soil matrix. The following definitions (Ruby et al., 1999) are provided for clarification of terminology: • Oral bioavailability is defined as the fraction of a dose that reaches the central (blood) compartment from the gastrointestinal tract. Oral bioavailability is synonymous with absolute bioavailability; • Relative bioavailability refers to the comparative bioavailabilities of substances present in different forms (i.e., complexed with other substances) or from different exposure media (i.e., food, water and soil). This is expressed as the relative absorption factor (RAF), and is calculated using the following equation: mediumtestingfromfractionileBioavailab soilfromfractionleBioavailab RAF = RAFs can be used in RAs to adjust for contaminant exposure in different media, that is, if the study used to derive the TRV exposes the test organisms to the contaminant in water, then the ratio of the bioavailability of the contaminant in soil and the bioavailability of the contaminant in water, the RAF, can be used to adjust the exposure. The term relative bioavailability adjustment (RBA) is also used in this context; and, • Oral bioaccessibility is defined as the fraction of a substance that is soluble in the gastrointestinal environment, and is therefore available for absorption. 2.1.1 Use of Bioaccessibility Testing in Human Health Risk Assessments Bioaccessibility evaluations provide values which more accurately represent the actual fraction of contaminant readily available from site soils (i.e., potentially digestible by humans) via the oral exposure route. Specifically, bioaccessibility evaluations allow for corrections to be made for differences in bioaccessibility of contaminants in soil relative to the bioavailability in exposure media used by regulatory agencies to develop reference doses (RfDs). Since RfDs are derived from studies in which contaminants are provided to test organisms in readily-bioavailable media (e.g., contaminant-spiked food or water), it is scientifically defensible to adjust for bioavailability when considering real-world exposure media relative to those used in generating toxicity data. Since it is not feasible to conduct animal studies at every site, a Relative Absorption Factor (RAF) can be derived using the results of bioaccessibility evaluations. The most appropriate way to adjust for exposure media using bioaccessibility is to determine the RAF using the bioaccessibility from the environmental medium as a conservative measure of bioavailability and the bioavailability from the environmental medium measured in the study used to derive the TRV. However, it is also feasible to determine the bioaccessibility of the chemical from the dosing medium of the TRV study, so that the numerator and denominator of the RAF are consistent (i.e., bioaccessibility/bioaccessibility, rather than bioaccessibility/bioavailability). A
- 11. June 2006 - 5 - 04-1112-069 Golder Associates RAF based on a bioaccessibility evaluation is a simple quotient comparing the solubility of contaminants in soil and spiked food sources in simulated digestive fluids, and makes no assumptions about digestive differences between humans and other mammalian species, and is calculated as follows: RfDtheDeveloptousedMediumExposureinChemicalofbilityBioaccessi SoilinChemicalofbilityBioaccessi RAF= For example, with respect to nickel, the bioaccessibility (i.e., primarily the HCl-soluble fraction) in soils (i.e., the numerator) will be site-specific and dependant upon a number of factors, such as: weathering, oxidation state, speciation, among other factors. For the RAF to be based on bioaccessibility, rather than bioavailability, the denominator must contain the bioaccessibility estimate (using exactly the same method as was used to determine the bioaccessibility estimate in the numerator) for the exposure medium used as the key reference study that is the basis for the RfD. In this case, the key reference study supporting the RfD for nickel salts is that of Ambrose et al. (1976). In that study, rats were fed laboratory chow spiked with nickel sulphate. The no- observable effect level (NOEL) was 100 mg/kg nickel in chow. Therefore, the bioaccessibility of NiSO4-spiked rat chow can be determined and serve as the denominator in the equation to properly correct for the differences in bioaccessibility of nickel from exposure media. By determining the RAF using bioaccessibility for both numerator and denominator, a level of conservatism is being added to the study (i.e., bioaccessibility being typically higher than bioavailability). However, this also contributes to increased uncertainty. It is therefore recommended that the RAF be based on the conservative assumption that the bioaccessibility from soil is a “worse-case” bioavailability estimate, and that the denominator not be adjusted using bioaccessibility. Once applied to the exposure assessment within an RA, the exposure rate due to incidental ingestion of site soils (often the driving exposure route for risks, particularly for metals) is more realistic than if bioaccessibility had not been used. The Ontario Ministry of Environment (MOE) recently applied this approach in the recent Port Colborne RA; this work is outlined in “Soil Investigation and Human Health Risk Assessment for the Rodney Street Community” (MOE, 2002). 2.2 Extraction Procedures 2.2.1 Preparation of Soil Samples Soil samples were received by Golder from the SARA Group in plastic Ziploc bags (chain-of- custody forms for all samples are provided in Appendix A). All samples were dried at 40ºC to a constant weight and sieved through a #60 sieve (soil particles passing the #60 sieve represent the <250 µm fraction). As indicated in MOE (2002), the <250 µm soil particles are thought to be the
- 12. June 2006 - 6 - 04-1112-069 Golder Associates most important soil fraction for incidental ingestion via skin contact and hand-to-mouth behaviour. 2.2.2 Preparation of Dust Samples Dust samples were also received by Golder from the SARA Group in plastic Ziploc bags (chain- of-custody forms are provided in Appendix A). All samples were dried at 40ºC to a constant weight and sieved through a 60 µm sieve. In contrast to the soil samples, this smaller sieve size was used to exclude fine material, such as hair, clothing fibers and carpet particles, from dust samples. 2.2.3 Preparation of Gastric Fluids The general composition of the gastric extraction fluid (analogous to stomach acid) was adapted from the standard operating procedure (SOP) developed by the Solubility/Bioavailability Research Consortium (SBRC) (Ruby et al. 1999; Exponent, 2001) and differed by the incubation time and the addition of pepsin to the gastric fluid. In brief, gastric extraction fluid was prepared by adding 60.06 g of glycine to 1.9 L of distilled water. Concentrated trace metal-grade hydrochloric acid (HCl) was added to the solution until a pH of 1.5 was achieved. The solution was then filled to a final volume of 2 L with distilled water, yielding a 0.4 M glycine solution. 2.2.4 Gastric Phase Extraction Technique The gastric phase extraction technique is described briefly as follows. One gram of soil or up to one gram of dust was weighed on an analytical balance and placed in a labelled, pre-weighted 18 oz. WhirlPak bag. One hundred mL of heated (37 ºC) gastric extraction fluid was added to the WhirlPak bag. In the case of dust samples, when 1 gram of sample was not available, all extraction fluid volumes were scaled down accordingly. For instance, if 0.5 g of dust was obtained, 50 mL of extraction fluid was used. One gram of pepsin (EM Science) for every 100 mL extraction fluid was added to the WhirlPak bag. The WhirlPak bag was placed in the shaking incubator at 37 ºC for 2 hours at a maximum shaking setting of 25 strokes min-1 (Boekel Scientific Shake n’ Bake DNA Hybridization Oven, Model 136400). 2.2.5 Intestinal Phase Extraction Technique Upon completion of the gastric phase of extraction (described above), the WhirlPak bag was removed from the oven and saturated sodium hydroxide (NaOH) was added until the pH of the solution was between 7 and 8. Bile (0.35 g; Bovine Bile, Sigma) was added for every 100 mL extraction fluid. Pancreatin (0.035 g; Sigma; pancreatin consists primarily of lipase, amylase and
- 13. June 2006 - 7 - 04-1112-069 Golder Associates proteinase (specifically, trypsin, chymotrypsin and elastase I and II)) was added for every 100 mL extraction fluid. The WhirlPak bag was placed in the shaking incubator at 37 ºC for 2 hours at a maximum shaking setting of 25 cycles min-1 . Following completion of the intestinal phase of extraction, the WhirlPak bag was removed from the incubator and gently placed in a 1000 mL beaker for support. Fifteen mL of the leachate was drawn with a disposable pipette into a disposable centrifuge tube. The sample was then centrifuged (Eppendorf, Model 5804) at 10,000g for 10 minutes. The supernatant was carefully decanted into an appropriately clean sample jar, stabilized using nitric acid and stored at 4°C until submission to AGAT Laboratories (AGAT) for analysis of metals using Inductively Coupled Plasma – Mass Spectroscopy (ICP-MS), typically within 48 h of extraction. 2.3 Determining the Bioaccessibility of Nickel in Rat Chow The bioaccessibility of nickel in rat chow spiked with nickel was determined in the event that the RAF based on the ratio of bioaccessibilities in soil to rat chow was to be used (see Section 2.1.1 for the recommended approach). The nickel-spiked rat chow was prepared as follows: Rat chow, purchased from a pet-food store (Living World Hamster Food), was ground manually. Particles greater than 6.35 mm, and less than 2.36 mm, were excluded. 2.5 mL of a 1000 mg/L nickel nitrate hexahydrate solution (CertiPUR, Nickel AA Standard, EMD) was added to 5 mL of acetone and mixed well. The solution (7.5 mL in total) was added to 10 g of the ground rat chow, mixed well, and left in a fume hood at room temperature for 24 hours to allow for the evaporation of the acetone, yielding a nominal concentration of nickel of 100 µg/g in the rat chow. Two replicate samples were extracted following the procedures for soil outlined above in Sections 2.2.4 and 2.2.5. The duplicate extractions as well as un-extracted spiked and un-spiked chow were sent to AGAT for the analytical determination of nickel (using ICP-MS). Ideally, the method of addition used in this study would have been the same as that used by Ambrose et al. (1976) in the study upon which the RfD of nickel of 20 μg/kg/day is based. In that study, nickel sulfate hexahydrate fines were mixed with finely-ground meal. However, because this is the extent of the detail provided by these researchers on the method of rat chow preparation and nickel addition to the rat chow, Golder used the method outlined above, which has been used in other metal feeding studies. Regardless, the RAF calculated for nickel is a conservative value. For example, the RAF calculated based on the bioaccessibility of nickel in soil of 42.0% (95% Chebyshev UCL) and the bioaccessibility of nickel in food of 94.7% is 0.44, while the RAF calculated assuming a bioaccessibility of nickel in food of 100% is 0.42. So, regardless of the method of addition, use of nickel bioaccessibilities of less than 100% in rat chow will provide a more conservative RAF.
- 14. June 2006 - 8 - 04-1112-069 Golder Associates 2.4 Quality Assurance/Quality Control Measures Five sample measures were used to assure data quality, as specified by the SARA Group (2004), as described below: • Reagent Blanks – extraction fluid (analyzed at a rate of 5% of the total number of samples); • Bottle Blanks – extraction fluid run through the complete gastric and intestinal extraction (analyzed at a rate of 5% of the total number of samples); • Blank Spike – extraction fluid spiked with 10 mg/L (Co, Cu, Ni, Pb) and 1 mg/L (As, Se). Blank spikes were prepared in pairs, one being run through the extraction procedure and analyzed, the other being analyzed for metals without being subjected to the extraction (analyzed at a rate of 5% of the total number of samples); • Duplicates – duplicate extractions of soil were conducted (analyzed at a rate of 10% of the total number of samples); and, • Standard Reference Material – extractions of NIST SRM 2711 (“Montana II Soil”) and NIST SRM 2583 (“Trace Elements in Indoor Dust”) were conducted (analyzed at a rate of 2% of the total number of samples). 2.5 Preliminary Testing Due to uncertainties associated with previous nickel studies, specifically complexation of nickel with glycine at high pH values typical of the intestinal phase of extraction (as stated in the RFP for this work), Golder and The SARA Group agreed to conduct preliminary tests using both the “gastric” extraction (GE) and “gastric and intestinal” extraction (GIE) test for each of ten (10) sieved soil samples to determine if glycine could be a confounding factor in the estimation of nickel bioaccessibilities. In brief, gastric extractions were conducted as outlined in Section 2.2.4. Following the completion of the gastric phase of extraction, the sample bag was removed from the oven and placed in a 1 L beaker for support. Fifteen milliliters of the extractant was transferred into a disposable centrifuge tube using a disposable pipette. The sample was centrifuged at 10 000g for 10 minutes, and the supernatant was carefully decanted into a sample jar, acidified with nitric acid, and stored at 4°C prior to submission to AGAT for analysis of metals by ICP-MS, typically within 48 h of extraction. Following sampling of the gastric phase extractant, the intestinal phase of extraction was performed as outlined in Section 2.2.5. 2.6 Bioaccessibility Calculations Bioaccessibility estimates were calculated as a mass balance of the total amount of metal in the extract and the total amount in the <250 μm soil fraction or <60 µm dust fraction as follows:
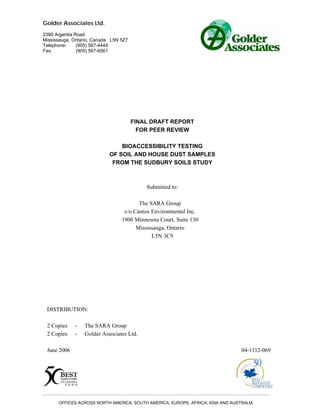
- 15. June 2006 - 9 - 04-1112-069 Golder Associates 100(%) ×= dustorsoilinmetalmass extractinmetalmass bilityBioaccessi = 100 ][ ]([ × × × dustorsoilofmass dustorsoil metal extractofvolume extract metal Examples of the calculation used for the estimation of nickel bioaccessibility in soil and dust are provided for soil sample 05-334 and dust sample 05-1290 in Appendix F. Note that the metal concentrations in the extraction fluids were corrected by subtracting the metal concentrations in the bottle blank. 3.0 RESULTS The chain of custody forms and laboratory analytical results are provided in Appendices A and B, respectively for both soils and dust. The bioaccessibility estimates for the metals in soil and dust are provided graphically in Figures 1-12 and in tabular format in Appendix D. 3.1 Preliminary Testing As evident in Figures 1, 2, 3, 5, and 6, there was no clearly defined difference between the GE and GIE with respect to arsenic, cobalt, copper, nickel and selenium bioaccessibilities. In fact, there were no significant differences between the gastric and gastric and intestinal bioaccessibilities for these metals (ANOVA, p<0.05). However, for lead (Figure 4), there was a significant decrease in bioaccessibility to approximately 17 percent following GIE (from approximately 61 percent following GE, which is almost four times lower; ANOVA, p<0.05). Since most metals are absorbed through the small intestine, and with the exception of lead, no substantial differences existed between the gastric and the gastric and intestinal extractions, the full gastric and intestinal extraction was used for the balance of the study. While for lead this appears to be less conservative, this is potentially a more realistic estimate of bioaccessibility. Animal studies using rats revealed that lead is primarily absorbed through the duodenum, and therefore supports our rationale for using the gastric and intestinal extraction for bioaccessibility estimates (Ellickson et al., 2001). In addition to the previously mentioned Figures, Tables of the bioaccessibility results of the GE and GIE are provided in Appendix D. 3.2 Bioaccessibility in Soil Samples Metal bioaccessibilities in soil are presented in Figures 7 to 12. The bioaccessibility was calculated as the mass-balance quotient of the respective metal (or metalloid) concentration in the extract after gastric and intestinal extraction divided by the mass present in the extracted soil. It should be noted that the post-extraction mass (i.e., the numerator) is ‘background-corrected’ by subtracting the average mass of metal present in the “bottle blanks”. This adjustment was necessary to account for metals added during the extraction from reagents, water, proteins and
- 16. June 2006 - 10 - 04-1112-069 Golder Associates enzymes. Bioaccessibility is presented herein as a function of 250 μm fraction-soil analyte concentration. The statistical treatment of the data is described as follows: 95% upper confidence limits of the mean (95UCL) were calculated using the U.S. EPA program ProUCL (U.S. EPA Version 3.0; available at http://www.epa.gov/esd/tsc/software.htm). All data were entered according to the specifications required by the program, and the program determined the best fit of the data. Specifically, the program recommended a specific method for determining the 95UCL based on the distribution, sample size and skewness of the data, and calculated the recommended, as well as other, 95UCL statistics. For a comprehensive rationale related to the program, more information is available in the U.S. EPA guidance document on this program (U.S. EPA, 2004). For arsenic, nickel and selenium, the program determined that the data were not normally distributed and recommended use of the Chebyshev 95UCL. For cobalt, copper and lead, the program determined that the data were normally distributed and recommended use of the Student’s-t 95UCL. Although the ProUCL program recommends the appropriate statistic, both the Student’s-t 95UCLand the Chebyshev 95UCL statistics have been provided for all metals for soil, and the recommended statistic has been indicated in bold face (Table 1). The program outputs for each of the metals have been provided in Appendix D. The mean bioaccessibilities for the six metals are also presented in Table 1, and were calculated using the mathematical functions in Microsoft Excel.
- 17. June 2006 - 11 - 04-1112-069 Golder Associates Table 1: Mean and 95% upper confidence limit for estimating the bioaccessibility of each of the 6 elements present in soil samples and dust collected from houses in the Sudbury area. n=86 for soil and n=10 for house dust. N/A- unable to be calculated. a- all data (n=86 for soil and n=10 for dust), b excluding samples at MDL in sieved soil (n=54), c-excluding samples at MDL in sieved soil and/or extraction fluid (n=24), d – mean and 95%UCL could not be calculated because metal below MDL in all extraction samples. Bolded values are the recommended statistic based on ProUCL (US EPA, 2004). The relative absorption factor (RAF) was calculated for nickel based on bioaccessibility to account for the differences in media used to derive the reference dose (see discussion in Section 2.1.1 and 2.3). Nickel was the only element used in this study upon which the reference dose was based on a study using food as an exposure medium; therefore, it was the only appropriate element for which to determine a RAF based on bioaccessibility. The bioacessibility of Ni in rat chow determined in this study was 94.7 ± 7.7%. The RAF for nickel was calculated to be 0.37, 0.40 or 0.44, using the mean bioaccessibility value (i.e., 34.9%), the Student’s–t 95UCL (i.e., 37.6%) or the Chebyshev 95UCL (i.e., 42.0%), respectively, in Sudbury soils. The RAF, based on bioaccessibility, was calculated as follows: RfDtheDeveloptousedMediumExposureinChemicalofbilityBioaccessi SoilinChemicalofbilityBioaccessi RAF= 3.3 Bioaccessibility in Dust Samples Metal bioaccessibilities in dust are provided in Figures 13-17. The levels of selenium detected in household dust were below the method detection limit (MDL) used, and therefore are not presented graphically. It should be noted that the bioaccessibility of each element in house dust is low (less than 10%) relative to soil. The bioaccessibility in these Figures was calculated in the Bioaccessibility in Soil Bioaccessibility in House Dust Element Mean (µg/L) 95UCL (Student’s-t) 95UCL (Chebyshev) Mean (µg/L) 95UCL (Student’s -t) 95UCL (Chebyshev) Arsenic 34.2 36.8 41.1 2.6 3.7 5.2 Cobalt 24.7 26.4 32.0 1.3 2.4 3.5 Copper 61.5 64.4 81.1 3.4 4.6 6.1 Lead 14.4 16.0 18.6 2.2 3.4 5.1 Nickel 34.9 37.6 42.0 0.7 1.2 2.0 Selenium 15.9a , 15.1b , 26.4c 20.3a , 19.6b , 33.9c 27.2a , 26.3b , 41.2c N/Ad N/Ad N/Ad Prepared by:__________ Verified by:__________
- 18. June 2006 - 12 - 04-1112-069 Golder Associates same way as for soil (refer to Section 3.2). The point estimates (i.e., 95UCL) should be used in the RA for arsenic, cobalt, copper, lead and nickel. The means and all 95UCLs for the 6 elements in house dust are presented in Table 1. As for soils (Section 3.2), the U.S. EPA program ProUCL (U.S. EPA, 2004) was used to determine the distribution of the data and the recommended 95UCL statistic for dust. For all elements evaluated, with the exception of nickel, data were normally distributed and the Student’s-t 95UCL was recommended. For nickel, the Chebyshev 95UCL was recommended. Although the ProUCL program recommends the appropriate statistic, both the Student’s-t and the Chebyshev 95UCL statistics have been provided for all metals for dust, and the recommended statistic has been indicated in bold face (Table 1). The program outputs for each of the metals in dust have been provided in Appendix D. Again as with soils, the mean bioaccessibilities for the six metals in dust are also presented in Table 1 and were calculated using mathematical functions in Microsoft Excel. 3.4 Quality Assurance/Quality Control Background levels of arsenic and selenium in the reagents blanks (i.e., extraction fluid) were below the detection limit of the analytical method used (Table 2). Cobalt, copper, lead and nickel were all present in trace amounts in reagents. The extraction procedure increased the level of arsenic, cobalt, copper, lead, nickel and selenium by approximately 3-, 4-, 1-, 2-, 6- and 1-fold, respectively, over the reagent blanks. Although these numbers look significant, upon further examination, this can be accounted for. Arsenic and selenium are near their method detection limits, so this apparent increase is probably not real. Cobalt had an increase of 2.4 μg/L or 0.24 μg, which is close to background levels and the method detection limit. The increase in copper during the extraction procedure is likely a result of the presence of copper in bile, and can be accounted for quantitatively. Nevertheless, all soils assessed for metal bioaccessibility were corrected for the mean bottle blank value for each element (Table 2), thereby correcting for any background levels of metals present. Pancreatin and bile were assessed to determine if they contributed to the background detection of metals. Arsenic, cobalt, lead, nickel and selenium in both of these chemicals were all below the MDL. Copper was detected at concentrations of 1, 0.9, 1 and 0.9 µg/g in pancreatin, and at 5.1 μg/g for both samples of bile analyzed (Table 3). Five distilled water samples were also analyzed for metals to determine if this was the source of background metal levels. Of the relevant metals for this study, copper and nickel were detectable at concentrations of about 36 and 1.5 µg/L, respectively (Table 4). Despite this contribution of copper and nickel to the extraction from these sources, all samples were corrected for bottle blanks which accounted for any background levels of metals present. The QA/QC program also involved the submission of 10 duplicate samples, each pair originating from the same soil sample, but extracted and analyzed independently for metals. In addition, two independently-extracted samples of the NIST SRM 2711 (“Montana II Soil”) were submitted for
- 19. June 2006 - 13 - 04-1112-069 Golder Associates metals analysis. These samples were used to determine the repeatability of the extraction and analytical procedures using soil. This was done by calculating the Relative Percent Difference (RPD) in metal concentrations in the extraction fluids following extraction, between duplicate soil samples, and was calculated as follows; [ ] [ ] ( )2,1 21 100 duplicateduplicate duplicateduplicate mean metalmetal RPD − ×= Given the heterogeneity of soil in natural conditions (i.e., weathered soil), between-sample variability (i.e., RPD) of up to 35 % is deemed acceptable, based on professional experience with analytical data, and scientific judgment. Greater variability is, however, possible, and does occur. Variability in the analysis of the 6 elements between duplicate samples was generally within acceptable and expected ranges as determined by the RPD (Table 5A). It should be noted that the detection of selenium in the soil extractions was at or below the MDL of 0.8 μg/L. The difference between 1 and 2 μg/L represents a small difference of 0.1 and 0.2 μg. When samples are close to the MDL relative percent differences between QA/QC duplicates is really not a practical measure of reproducibility. Based on this assumption, the results for selenium in the duplicate samples should therefore be interpreted with caution. There were 2 duplicate pairs whose results were more variable than expected for arsenic, lead, and nickel; these are samples 05-415 and 05-389. The laboratory responsible for the analysis (AGAT Laboratories) verified the results, and offered a technical explanation for the variability, as follows: “the samples contained high concentrations of compounds that can produce interference with the analytical method; these include high organic matter content and high concentrations of chloride. Chlorine binds easily to argon gas used in the ICP-MS. Therefore, samples with high chlorine content or those that have similar mass to ArCl (77), may produce more variability in the results than expected” (O. Beckman, AGAT Laboratories, personal communication, June 23, 2005). Based on this information, Golder has provided summary statistics both containing and omitting these two samples. RPDs for these elements (not including selenium) between duplicate samples ranged from 7.23% to 50.83%, including the two uncertain samples (i.e., 05-415 and 05-389), and 4.64% to 28.53% not including these samples. The RPD in the metal concentrations in the extraction fluids for the duplicate samples of NIST SRM 2711 (“Montana II Soil”) analyzed were between 4.5% and 55.7% (Table 5B). None of the dust samples were extracted in duplicate. However, three (3) replicates of the NIST SRM 2583 (“Trace Elements in Indoor Dust”) were extracted, and the RPDs in metal concentrations in the extraction fluids following extraction were determined between the samples with the highest and lowest concentrations measured to determine the repeatability of the extraction and analytical procedures using dust. RPDs were 14.5%, 6.6%, 5.4%, 19.4% and 7.0% for arsenic, cobalt, copper, lead and nickel, respectively. The RPD for selenium was not calculated because the concentration of selenium in the extraction fluids was below the MDL for this metal. These values are within established control limits; typically, RPDs of up to 20% are
- 20. June 2006 - 14 - 04-1112-069 Golder Associates considered acceptable, indicating reproducibility and reliability of the dust results. The RPDs are provided in Table 5C. The measured concentrations of arsenic and lead in the NIST SRM 2583 (“Trace Elements in Indoor Dust”) were 5.1 and 79.2 mg/kg, respectively, and were within the acceptable ranges outlined in the NIST Certificate of Analysis. (The certified concentrations provided by NIST are 7 ±1.6 and 85.9 ±7.2 mg/kg for arsenic and lead, respectively.) The bioaccessibilities of each of the metals was also determined for the NIST SRM 2583 (n=3). The following results were obtained: arsenic = 54.1 ± 3.9; cobalt = 45.6 ± 1.7; copper = 56.9 ± 1.6; lead = 26.1 ± 2.5; and, nickel = 78.2 ± 2.8. Finally, the percent recovery of spiked extraction fluid undergoing the extraction procedure was also evaluated. Extraction fluid was ‘spiked’ with a known amount of each metal, half of which went through the extraction process, while the other half was analyzed directly (i.e., no extraction). The spikes allow for an evaluation of whether the extraction procedure itself binds or interferes with the availability of the metal being analyzed, although the concentrations used in the spikes (i.e., 1 mg/L for As and Se; 10 mg/L for Co, Cu, Ni and Pb) are generally higher than the concentrations observed in the bioaccessibility extracts. The resulting data were reported as a ratio of the spiked samples to the spiked and tested samples. A value of 1, therefore, indicates 100% recovery of the spiked metal (Table 6 provides the results for the recovery of each metal from the extraction procedure). All metals, with the exception of lead, had a recovery of between 87-92%. The recovery of lead was approximately 54%. This result, together with the results comparing the gastric extraction to the gastric and intestinal extraction (Figure 4) supports the suggestion that lead may be forming complexes with the bile added during the intestinal extraction phase (through carboxylate and sulfonate groups on bile salts), reducing the bioaccessibility of lead following GIE versus GE. These interactions are also likely occurring in the human intestine. 3.5 Glycine and Nickel The SARA Group (2004) indicated that there had been controversy regarding the impact of glycine in the extraction fluid on nickel bioaccessibility estimates when both gastric and intestinal extractions are employed. It is difficult to draw conclusions regarding the effects of glycine on the bioaccessibilities of metals through a comparison of the gastric and gastric and intestinal bioaccessibilities in the presence of glycine as was conducted in this study. Ideally, a comparison of the gastric metal bioaccessibilities in the presence and absence of glycine, and the gastric and intestinal metal bioaccessibilities in the presence and absence of glycine, would have been conducted. Regardless, because the 0.4 M glycine solution may enhance the bioaccessibilites of metals, particularly cobalt, copper and nickel, use of the glycine solution in the testing conducted by Golder provides “worst-case” estimates of metal bioaccessibilities.
- 21. June 2006 - 15 - 04-1112-069 Golder Associates 4.0 RECOMMENDATIONS Based on the results of this study, Golder provides the following recommendations related to the potential use of bioaccessibility data in the Sudbury HHRA: 1. The concentration of selenium detected from soil and dust samples was near or below the MDL, making the results highly variable and unpredictable. The results for soil are presented in three (3) ways to account for data detected at the MDL. Figure 12A illustrates the bioaccessibility using all selenium data (n=86). Samples reported at the MDL are presented as one-half of the MDL. Figure 12B has excluded all data where selenium was detected at or below the MDL in the sieved soil (n=54), and Figure 12C has excluded all data with either selenium at the MDL in the extraction fluid and/or in the sieved soil (n=24). The following Student’s-t 95UCL for bioaccessibility were obtained for selenium for the following three (3) scenarios: i) 20.3% for all data; ii) 19.6% for data excluding selenium not detected in sieved soil; and, iii) 33.9% for data excluding selenium not detected in sieved soil and/or extraction fluid. When considering all of the data for selenium, the distribution is not normal, and therefore, the Chebyshev 95UCL is recommended and was calculated at 27.2%, 26.3% and 41.2% using the three methods outlined above. Golder recommends the use of 41.2% as a point estimate for the bioaccessibility of selenium. This value is the most conservative estimate and is considered appropriate given that many samples are close to the MDL and data variability is uncertain. 2. The bioaccessibilities of all soil-bound metals, with the exception of lead, are comparable between the gastric and gastric and intestinal extractions, and tend not to be influenced by the pH change or the presence of bile in the intestinal phase (this is supported by the data presented in Figures 1-6 and the spiked/spiked tested QA/QC results). Lead, however, appears to have reduced bioaccessibility following the gastric and intestinal extraction relative to the gastric extraction, and only has a 54% recovery from spiked samples. Lead is potentially complexing with bile added during the intestinal extraction procedure, and is therefore less bioaccessible during the gastric and intestinal extraction than during the gastric extraction only (Ellickson et al., 2001). This is also likely to occur in the human intestine. However, researchers have observed a stronger correlation between in vivo relative bioavilability estimated from swine studies and in vitro bioaccessibility estimated from the gastric phase of extraction only (e.g., r=0.89 for gastric phase, r=0.38 for gastric and intestinal phase; Schroder et al., 2004). Therefore, despite the small sample size (n=10), it is recommended that the bioaccessibility value determined from the gastric phase extraction be used in the RA. Still, it should be noted that the evidence of a stronger correlation between in vivo relative bioavailability and in vitro bioaccessibility estimated from the gastric phase is based on studies conducted with pigs and rats. Although there are similarities between pig and human gastrointestinal physiologies, it is possible that for humans, correlations with in
- 22. June 2006 - 16 - 04-1112-069 Golder Associates vivo relative bioavailability would be higher using the bioaccessibility determined from the gastric and intestinal phase of extraction. 3. Given the sample size, it is recommended that the appropriate 95UCL (either the Student’s-t 95UCL or the Chebyshev 95UCL) be used as the point estimate for the bioaccessibilities of all metals with the exception of selenium in Sudbury soils. Since many of the samples had concentrations of selenium at or below the MDL, it is recommended that only samples with detectable limits be used to derive site-specific bioaccessibility values for Sudbury soils. Furthermore, the Student’s-t 95UCL and the Chebyshev 95UCL statistics should be used for metals with normal and non-normal data distributions, respectively. Based on this approach, the recommended statistics are 41.1%, 26.4%, 64.4%, 16.0%, 42.0% and 41.2% for arsenic, cobalt, copper, lead, nickel and selenium, respectively. 4. It is recommended that the 95UCL or the maximum value of bioaccessibility of all metals, with the exception of selenium, be used for house dust samples in the Sudbury HHRA. Selenium in house dust was below the MDL. Further to this, the Student’s-t and the Chebyshev 95UCL statistics should be used for metals with normal and non-normal data distributions, respectively. Based on this approach, the recommended statistics are 3.7%, 2.4%, 4.6%, 3.4% and 2.0% for arsenic, cobalt, copper, lead and nickel, respectively. The maximum values are 5.4%, 3.3%, 6.0%, 6.8% and 3.3% for arsenic, cobalt, copper, lead and nickel, respectively. 5. In order to use the bioaccessibility results effectively in the exposure assessment of a RA, the relative absorption factor (RAF) should be used, where appropriate. The RAF corrects for the differential media/matrix to which the samples for the bioaccessibility evaluations are conducted (i.e. soil), to the media used in the study that was used to derive the RfD. For example, the originating study for the reference dose of nickel soluble salts is based on the ingestion of rat chow by rats. Therefore, a correction for the bioaccessibility of nickel in rat chow could be applied to all bioaccessibility data gathered for nickel in soil samples. Alternatively, the bioaccessibility of nickel can be conservatively assumed equal to the bioavailability of nickel, and can be used in the numerator of the traditional RAF calculation. The RAF can be determined and applied to the exposure estimates for potential human exposure scenarios. Of the metals tested in this study, the only appropriate conversion factor is for nickel, based on the study used to derive the TRV selected. 5.0 LIMITATIONS AND USE This report is for the sole use of Cantox Environmental and The SARA Group as it is the result of a specific scope of work. Any use of the findings provided in this report by parties other than Cantox Environmental or The SARA Group is prohibited and is at the sole risk of such party, without responsibility to Golder.
- 23. June 2006 - 17 - 04-1112-069 Golder Associates This report presents only factual results of tests that were carried out on samples which were provided to Golder by Cantox, and Golder does not offer any interpretation based upon such factual results. Golder has no knowledge as to how the samples were collected or selected. Golder confirms that the scheduled tests were carried out in accordance with Golder’s proprietary laboratory procedures for these tests and to a professional standard of care. As Golder was not involved in the collection or monitoring of any sampling activity, Golder shall not be responsible and makes no comment on whether the samples provided and factual information are representative of the actual site conditions, nor does Golder provide any interpretation of the factual information as it relates to the use or application of the factual information contained in this report. 6.0 CLOSURE We trust that you find this report satisfactory. If you have any questions or concerns please do not hesitate to contact us at your convenience. Yours truly, GOLDER ASSOCIATES LTD. Guy Gilron, M.Sc., R.P.Bio., QPRA (ON) Tammie Morgan, M.Sc. Senior Toxicologist/Risk Assessor Environmental Risk Analyst Jennifer Kirk, Ph.D. Ed Rodrigues, Ph.D., P.Geo. Environmental-Risk Assessment Scientist Senior Regulatory Affairs Specialist GG/TM/JK/ER/wlm N:ACTIVE2004111204-1112-069 cantox environ-bioaccess-sudburyreportsfinal reportrevised final report 06apr25.doc DRAFT DRAFT DRAFT DRAFT
- 24. June 2006 - 18 - 04-1112-069 Golder Associates REFERENCES Ambrose, A.M., Larson, P.S., Borzelleca, J.F. and Hennigar Jr., G.R. 1976. Long Term Toxicologic Assessment of Nickel in Rats and Dogs. Journal of Food Science and Technology 13: 181-187. Anderson, B.J., Rees, S.G., Liley, A., Stewart, A.W., and Wardill, M.J. 1999. Effect of preoperative paracetamol on gastric volumes and pH in children. Paediatric Anaesthesia 9: 203-207. ATSDR, 1999. Toxicological Profile of Lead. Agency for Toxic Substances and Disease Registry Division of Toxicology/Toxicology Information Branch, Atlanta Georgia. Casteel, S.W., Cowart, R.P., Weis, C.P., Henningsen, .M., Hoffman, E., Brattin, W.J. et al. 1997. Bioavailability of Lead to Juvenile Swine Dosed with Soil from the Smuggler Mountain NPL Site of Aspen, Colorado. Fund. Appl. Toxicol. 36: 177-187. CCME. A Protocol for the Derivation of Environmental and Human Health Soil Quality Guidelines. CCME-EPC-101E. 1996. Winnipeg, MB. Daston, G., Faustman, E., Ginsberg, G., Fenner-Crisp, P., Olin, S., Sonawane, B. et al. 2004. A Framework for Assessing Risks to Children from Exposure to Environmental Agents. Environ. Health Perspect 112: 238-256. Daugherty, A.L., and Mrsny, R.J. 1999. Transcellular uptake mechanisms of the intestinal epithelial barrier. Part one. Pharm. Sci Technol. Today 2: 144-151. Diamond, G.L., Goodrum, P.E., Felter, S.P., and Ruoff, W.L. 1997. Gastrointestinal absorption of metals. Drug Chem Toxicol. 39: 345-368. Driver, J.H., Konz, J.J., and and Whitmyre, G.K. 1989. Soil Adherence to Human Skin. Environ. Contam. Toxicol. 43: 814-820. Ellickson, K.M., Meeker, R.J., Gallo, M.A., Buckley, B.T. and Lioy, P.J. 2001. Oral bioavailability of lead and arsenic from a NIST standard reference soil material. Arch. Environ. Contam. Toxicol., 40: 128-135. Environment Agency. Environment Agency's Science Update on the Use of Bioaccessibility Testing in Risk Assessment of Land Contamination. 2005. Environment Agency and British Geological Society. 2002. In-vitro Methods for the Measurement of the Oral Bioaccessibility of Selected Metals and Metalloids in Soils: A Critical Review. R&D Technical Report P5-062/TR/01. Exponent. 2001. Bioaccessibility of metals from soils. Prepared for MOE by Exponent; Boulder, CO, USA. June 2001 (and Cadmium Addendum, July, 2001). Hamel, S.C., B. Buckley, and P.J. Lioy. 1998. Bioaccessibility of metals in soils for different liquid to solid ratios in synthetic gastric fluid. Environ. Sci. Technol. 32: 358-362. Kientz, K., Jiménez, B.D., Pérez, L., and Rodríguez-Sierra, C.J. 2003. In Vitro Bioaccessibility of Metals in Soils from a Superfund Site in Puerto Rico. Bull. Environ. Contam. Toxicol. 70: 927-934. Lentner, C. 1981. Geigy Scientific Tables: Unites of Measurement, Body Fluids, Composition of the Body, Nutrition West Caldwell, N.J.: CIBA-GEIGY. Maddaloni, M.A. 2004. Bioavailability of Soil-Borne Chemicals: A Regulatory Perspective. Human Ecol. Risk Assess. 10: 657-663.
- 25. June 2006 - 19 - 04-1112-069 Golder Associates Miller, D.D., Schricker, B.R., Rasmussen, R.R., and Van Campen, D. 1981. An in vitro Method for Estimation of Iron Availability From Meals. Amer. J. Clinical Nutrit. 34: 2248-2256. MOE, 2002. Soil Investigation and Human Health Risk Assessment for the Rodney Street Community, Port Colborne. Murphy, M.S., Nelson, K., and Eastham, E.J. 1988. Measurement of Small Intestinal Transit Time in Children. Acta Paediatrica Scandinavica 77: 802-806. Oomen, A.G., Hack, A., Minekus, M., Zeijdner, E., Cornelis, C., Schoeters, G., Verstraete, W., van de Wiele, T., Wragg, J., Rompelberg, C.J.M., Sips, A.J.A.M., van Wijnen, J.H. 2002. Comparison of five in vitro digestion models to study the bioaccessibility of soil contaminants. Environ. Sci. Technol. 36:3326-3334. Oomen, A.G., Rompelberg, C.J.M., Bruil, M.A., Dobbe, C.J.G., Pereboom, D.P.K.H., and Sips, A.J.A.M. 2003. Development of an In Vitro Digestion Model for Estimating the Bioaccessibility of Soil Contaminants. Arch Environ Contam Toxicol 44: 281-287. Oomen, A.G., Rompelberg, C.J.M., Van de Kamp, E., Pereboom, D.P.K.H., De Zwat, L.L., and Sips, A.J.A.M. 2004. Effect of Bile Type on the Bioaccessibility of Soil Contaminants in an In Vitro Digestion Model. Arch. Environ. Contam. Toxicol. 46: 183-188. Rodriguez, R.R., Basta, N.T., Casteel, S.W., and Pace, L.W. 1999a. An In Vitro Gastrointestinal Method to Estimate Bioavailable Arsenic in Contaminated Soils and Solid Media. Environ. Sci. Technol. 33: 642-649. Rodriguez, R.R., Basta, N.T., Casteel, S.W., and Pace, L.W. 1999b. An In Vitro Gastrointestinal Method to Estimate Bioavailable Arsenic in Contaminated Soils and Solid Media. Environ. Sci. Technol. 33: 642-649. Ruby, M.V., Davis, A., Link, T.E., Schoof, R., Chaney, R.L., Freeman, G.B., and Bergstrom, P.D. 1993. Development of an In Vitro Screening Test to Evaluate the In Vivo Bioaccessibility of Ingested Mine-Waste Lead. Environ. Sci.Technol. 27: 2870-2877. Ruby, M.V., Schoof, R., Brattin, W., Goldade, M., Post,G., Harnois, M. et al. 1999 Advances in Evaluating the Oral Bioavailability of Inorganics in Soil for Use in Human Health Risk Assessment. Environ. Sci. Technol. 33: 3697-3705. Ruby, M.V., Davis, A., Schoof, R., Eberle, S., and Sellstone, C.M. 1996. Estimation of Lead and Arsenic Bioavailability Using a Physiologically Based Extraction Test. Environ. Sci. Technol 30: 422-430. Ruby, M.V. 2004. Bioavailability of Soil-Borne Chemicals: Abiotic Assessment Tools. Human Ecol Risk Assess. 10: 647-656. SARA Group, The (SARA). 2004. A proposed standard operating procedure to conduct site- specific bioaccessibility testing on Sudbury soil samples. Schroder, J.L., Basta, N.T., Casteel, S.W., Evans, T.J., Payton, M.E., and Si, J. 2004. Validation of the In Vitro Gastrointestinal (IVG) method to Estimate Relative Bioavailable Lead in Contaminated Soils. J. Environ. Qual. 33: 513-521. Schroder, J.L., Basta, N.T., Si, J., Casteel, S.W., Evans, T., and Payton, M. 2003. In Vitro Gastrointestinal Method to Estimate Relative Bioavailable Cadmium in Contaminated Soil. Environ. Sci.Technol. 37: 1365-1370. Smith, H.L., Hollins, G.W., and Booth, I.W. 1993. Epigastric Impedence Recording for Measuring Gastric Emptying in Children: How Useful is it? J Ped. Gastroenterology Nutrition 17: 201-206.
- 26. June 2006 - 20 - 04-1112-069 Golder Associates U.S.EPA. Risk Assessment Guidance for Superfund Volume I Human Health Evaluation Manual (Part A). EPA/540/1-89/002. 1989. Washington, D.C., Office of Emergency and Remedial Response, U.S. Environmental Protection Agency. U.S.EPA. Exposure Factors Handbook Volume III. Office of Research and Development. EPA/600/P-95/002Fc. 1997. U.S. EPA Pro UCL Version 3.0 User Guide. EPA/600/R04/079. April 2004. U.S.EPA. IRIS Database. 2006. Vajro, P., Silano, G., Longo, D., Staiano, A., and Fontanella, A. 1988. Orocoecal Transit Time in Healthy and Constipated Children. Acta Paediatrica Scandinavica 77: 583-586.
- 27. June 2006 - 21 - 04-1112-069 Golder Associates Table 1: Mean and 95% upper confidence limit for estimating the bioaccessibility of each of the 6 elements present in soil samples and dust collected from houses in the Sudbury area. n=86 for soil and n=10 for house dust. N/A- unable to be calculated. a- all data (n=86 for soil and n=10 for dust), b excluding samples at MDL in sieved soil (n=54), c-excluding samples at MDL in sieved soil and/or extraction fluid (n=24), d – mean and 95%UCL could not be calculated because metal below MDL in all extraction samples. Bolded values are the recommended statistic based on ProUCL (US EPA, 2004) . Bioaccessibility in Soil Bioaccessibility in House Dust Element Mean (µg/L) 95UCL (Student’s-t) 95UCL (Chebyshev) Mean (µg/L) 95UCL (Student’s -t) 95UCL (Chebyshev) Arsenic 34.2 36.8 41.1 2.6 3.7 5.2 Cobalt 24.7 26.4 32.0 1.3 2.4 3.5 Copper 61.5 64.4 81.1 3.4 4.6 6.1 Lead 14.4 16.0 18.6 2.2 3.4 5.1 Nickel 34.9 37.6 42.0 0.7 1.2 2.0 Selenium 15.9a , 15.1b , 26.4c 20.3a , 19.6b , 33.9c 27.2a , 26.3b , 41.2c N/Ad N/Ad N/Ad Prepared by:__________ Verified by:__________
- 28. June 2006 - 22 - 04-1112-069 Golder Associates Table 2: The quantity of arsenic, cobalt, copper, lead, nickel and selenium detected in the extraction fluid and blank samples. Reagent blanks include only chemicals used in the extraction, bottle blanks include chemicals, bile, pancreatin and enzymes and have undergone the full extraction procedure. Numbers in italics represent one half of the detection limit. Arsenic (µg/L) Cobalt (µg/L) Copper (µg/L) Lead (µg/L) Nickel (µg/L) Selenium (µg/L) Reagent Blank Bottle Blank Reagent Blank Bottle Blank Reagent Blank Bottle Blank Reagent Blank Bottle Blank Reagent Blank Bottle Blank Reagent Blank Bottle Blank 0.5 0.5 0.25 0.25 23.7 41.6 2.61 1 2.36 119 1 1 0.5 2.4 0.25 2.9 31.2 45.2 2.1 2.3 9.3 165 1 1 0.5 0.5 0.25 3.97 24.8 50.4 3.49 7.63 28.2 223 1 1 0.5 1.3 0.55 3.5 107 61.4 7.6 10.4 53.1 146 1 1 0.5 2.3 3.3 5.9 49.5 121 8 28.5 34 178 1 2.3 Mean 0.5 1.4 0.92 3.3 47.24 63.92 4.76 9.97 25.39 166.20 1.0 1.26 Std 0 0.93 1.34 2.04 34.97 32.77 2.82 11.05 20.24 38.74 0 0.58 Prepared by:__________ Verified by:__________
- 29. June 2006 - 23 - 04-1112-069 Golder Associates Table 3: Quantity of arsenic, cobalt, copper, lead, nickel and selenium detected in pancreatin and bile used for the extraction procedure. Parameter Units Detection Limit Pancreatin 1 Pancreatin 2 Pancreatin 3 Pancreatin 4 Bile 1 Bile 2 Arsenic µg/g 0.6 <0.6 <0.6 <0.6 <0.6 <0.6 <0.6 Cobalt µg/g 0.3 <0.3 <0.3 <0.3 <0.3 <0.3 <0.3 Copper µg/g 0.3 1 0.9 1 0.9 5.1 5.1 Lead µg/g 0.5 <0.5 <0.5 <0.5 <0.5 <0.5 <0.5 Nickel µg/g 0.6 <0.6 <0.6 <0.6 <0.6 <0.6 <0.6 Selenium µg/g 0.8 <0.8 <0.8 <0.8 <0.8 <0.8 <0.8 Prepared by:__________ Verified by:__________
- 30. June 2006 - 24 - 04-1112-069 Golder Associates Table 4: Analysis of Distilled Water Used in the Extraction Procedure. Five samples from water storage containers were analysed. Parameter Detection Limit dH20 1 dH2O 2 dH2O 3 dH20 4 dH20 5 Mean STD Arsenic μg/L 0.57 <0.57 <0.57 <0.57 <0.57 <0.57 N/A N/A Cobalt μg/L 0.96 <0.96 <0.96 <0.96 <0.96 <0.96 N/A N/A Copper μg/L 0.78 16.8 78.2 33.1 16.6 36.4 36.22 25.17 Lead μg/L 0.44 <0.44 0.63 <0.44 <0.44 <0.44 N/A N/A Nickel μg/L 0.63 <0.63 1.15 <0.63 2.67 0.75 1.52 1.01 Selenium μg/L 0.81 <0.81 <0.81 <0.81 <0.81 <0.81 N/A N/A Prepared by:__________ Verified by:__________
- 31. June 2006 - 25 - 04-1112-069 Golder Associates Table 5A: Percent relative differences in metal concentrations of the extraction fluids following gastric and intestinal extraction of duplicate soil samples, and summary statistics. Duplicate Samples Arsenic (μg/L) Cobalt(μg/L) Copper (μg/L) Lead (μg/L) Nickel (μg/L) Selenium (μg/L) Mass of Soil (g) 05-334 154.60 158.70 5666.08 115.03 4673.80 MDL 1.00 05-334R 248.60 167.70 5746.08 146.03 5093.80 2.04 1.00 % Relative Difference 46.63 5.51 1.40 23.75 8.60 200.00 - 05-393 13.70 12.90 426.08 7.93 231.80 MDL 1.00 05-393R 13.20 13.10 461.08 5.73 261.80 MDL 1.00 % Relative Difference 3.72 1.54 7.89 32.21 12.16 N/A - 05-377 11.70 10.40 279.08 10.13 162.80 MDL 1.00 05-377R 8.07 9.60 246.08 5.33 122.80 MDL 1.00 % Relative Difference 36.72 8.00 12.57 62.10 28.01 N/A - 05-349 51.70 46.90 1676.08 55.43 1593.80 3.74 1.00 05-349R 47.00 51.80 1516.08 48.13 1493.80 2.53 1.00 % Relative Difference 9.52 9.93 10.02 14.10 6.48 38.60 - 05-382 20.40 35.00 1436.08 86.73 537.80 3.94 1.00 05-382R 12.10 35.40 1546.08 73.03 569.80 MDL 1.00 % Relative Difference 51.08 1.14 7.38 17.15 5.78 200.00 - 05-350 96.10 77.40 2186.08 14.63 1253.80 12.94 1.00 05-350R 104.60 69.80 1866.08 17.13 1123.80 MDL 1.00 % Relative Difference 8.47 10.33 15.79 15.74 10.94 200.00 - 05-412 2.60 4.30 208.08 0.00 26.80 MDL 1.00 05-412R 5.10 4.50 160.08 0.00 3.80 MDL 1.00 % Relative Difference 64.94 4.55 26.08 N/A 150.33 N/A - 05-415 10.50 6.40 301.08 21.03 169.80 MDL 1.00 05-415R 6.60 4.80 204.08 0.43 70.80 MDL 1.00 % Relative Difference 45.61 28.57 38.40 191.99 82.29 NA - 05-357 11.50 13.40 372.08 28.63 238.80 1.24 1.00 05-357R 16.50 13.30 392.08 17.43 235.80 3.04 1.00 % Relative Difference 35.71 0.75 5.23 48.63 1.26 84.11 - 05-389 11.00 5.00 168.08 6.43 5.80 5.64 1.00 05-389R 5.80 5.10 201.08 10.93 43.80 MDL 1.00 % Relative Difference 61.90 1.98 17.88 51.84 153.23 200.00 -
- 32. June 2006 - 26 - 04-1112-069 Golder Associates Duplicate Samples Arsenic (μg/L) Cobalt(μg/L) Copper (μg/L) Lead (μg/L) Nickel (μg/L) Selenium (μg/L) Mass of Soil (g) Stats Summary Statistics for Table 2- All data Mean 36.43 7.23 14.26 50.83 45.91 153.78 - Median 36.22 5.03 11.30 32.21 11.55 200.00 - Maximum 64.94 28.57 38.40 191.99 153.23 200.00 - Minimum 3.72 0.75 1.40 14.10 1.26 38.60 - Stats Summary Statistics for Table 2- With samples 05-415 and 05-389 Removed Mean 28.53 4.64 9.60 26.71 24.84 120.45 - Median 36.22 5.03 8.96 23.75 9.77 200.00 - Maximum 64.94 10.33 26.08 62.10 150.33 200.00 - Minimum 3.72 0.75 1.40 14.10 1.26 38.60 - N/A- not able to calculate; MDL- Method Detection Limit Prepared by:__________ Verified by:__________
- 33. June 2006 - 27 - 04-1112-069 Golder Associates Table 5B: Percent relative differences in metal concentrations of the extraction fluids following gastric and intestinal extraction of duplicate samples of NIST SRM 2711 (soil). Duplicate Samples Arsenic (μg/L) Cobalt (μg/L) Copper (μg/L) Lead (μg/L) Nickel (μg/L) Selenium (μg/L) Montana Sample 1 426.6 28 494.08 1950.03 81.8 1.24 Montana Sample 2 408 31.9 574 1770 145 1.24 % Relative Difference 4.46 13.02 14.97 9.68 55.73 0.00 Prepared by:__________ Verified by:__________
- 34. June 2006 - 28 - 04-1112-069 Golder Associates Table 5C: Percent relative differences in metal concentrations of the extraction fluids following gastric and intestinal extraction of replicate samples of NIST SRM 2538 (dust). ND = non-detectable. NC = not calculated because parameter non-detectable in the extraction fluids. Percent relative difference was calculated between the replicates with the highest and lowest extraction fluid metal concentrations to obtain the maximum percent relative difference between replicates. Replicates Arsenic (mg/L) Cobalt (mg/L) Copper (mg/L) Lead (mg/L) Nickel (mg/L) Selenium (mg/L) SRM 2538 Replicate 1 27.6 15.7 1116.08 186.03 424.8 ND SRM 2538 Replicate 2 25.6 14.7 1076.08 209.03 442.8 ND SRM 2538 Replicate 3 29.6 14.7 1136.08 226.03 412.8 ND % Relative Difference 14.49 6.58 5.42 19.41 7.01 NC Prepared by:__________ Verified by:__________
- 35. June 2006 - 29 - 04-1112-069 Golder Associates Table 6: Ratio of blank spiked samples and blank spiked samples undergoing the full gastric and intestinal extraction for each metal analyzed, used to determine the recovery of the extraction procedure. Arsenic and Selenium were each spiked with 1 mg/L and Cobalt, Copper, Lead and Nickel each with 10 mg/L. Ratio of spiked/spiked tested Average Standard Deviation Arsenic μg/L 0.80 0.81 0.98 0.98 1.06 0.92 0.12 Cobalt μg/L 0.85 0.92 0.86 0.84 0.88 0.87 0.03 Copper μg/L 0.91 0.83 0.95 0.90 0.88 0.89 0.04 Lead μg/L 0.11 0.24 0.75 0.77 0.84 0.54 0.34 Nickel μg/L 0.85 0.91 0.88 N/T 0.89 0.88 0.03 Selenium μg/L 0.86 0.95 0.96 0.98 1.03 0.92 0.05 N/T = not tested, since sample was not available as a result of laboratory error. Prepared by:__________ Verified by:__________
- 36. Figure 1: Comparison of Bioaccessibility of Arsenic Under Gastric Extraction (GE) or Gastric and Intestinal Extraction (GIE) 0 20 40 60 80 100 0 50 100 150 200 250 300 [Arsenic] in 250 µm soil fraction (mg/kg) %Bioaccessibility Gastric & Intestinal Extraction Gastric Extraction Only
- 37. 0 20 40 60 80 100 0 20 40 60 80 100 120 140 160 180 [Cobalt] in 250 µm soil fraction (mg/kg) %Bioaccessibility Gastric & Intestional Extraction Gastric Extraction Only Figure 2: Comparison of Bioaccessibility of Cobalt Under Gastric Extraction (GE) or Gastric and Intestinal Extraction (GIE)
- 38. Figure 3: Comparison of Bioaccessibility of Copper Under Gastric Extraction (GE) or Gastric and Intestinal Extraction (GIE) 0 20 40 60 80 100 0 500 1000 1500 2000 2500 3000 3500 [Copper] in 250 µm soil fraction (mg/kg) %Bioaccessibility Gastric & Intestional Extraction Gastric Extraction Only
- 39. Figure 4: Comparison of Bioaccessibility of Lead Under Gastric Extraction (GE) or Gastric and Intestinal Extraction (GIE) 0 20 40 60 80 100 0 50 100 150 200 250 300 350 [Lead] in 250 µm soil fraction (mg/kg) %Bioaccessibility Gastric & Intestinal Extraction Gastric Extraction Only
- 40. Figure 5: Comparison of Bioaccessibility of Nickel Under Gastric Extraction (GE) or Gastric and Intestinal Extraction (GIE) 0 20 40 60 80 100 0 500 1000 1500 2000 2500 3000 3500 4000 4500 [Nickel] in 250 µm soil fraction (mg/kg) %Bioaccessibility Gastric & Intestional Extraction Gastric Extraction Only
- 41. Figure 6: Comparison of Bioaccessibility of Selenium Under Gastric Extraction (GE) or Gastric and Intestinal Extraction (GIE) 0 20 40 60 80 100 120 0 2 4 6 8 10 12 14 [Selenium] in 250 µm soil fraction (mg/kg) %Bioaccessibility Gastric & Intestional Extraction Gastric Extraction Only
- 42. Figure 7: Bioaccessibility of Arsenic in Soils 0 20 40 60 80 100 120 0 50 100 150 200 250 300 [As] in 250 µm soil fraction (mg/kg) %Bioaccessibility
- 43. Figure 8: Bioaccessibility of Cobalt in Soils 0 10 20 30 40 50 60 70 80 90 100 0 20 40 60 80 100 120 140 160 180 [Co] in 250 µm soil fraction (mg/kg) %Bioaccessibility
- 44. Figure 9: Bioaccessibility of Copper in Soils 0 10 20 30 40 50 60 70 80 90 100 0 500 1000 1500 2000 2500 3000 3500 [Cu] in 250 µm soil fraction (mg/kg) %Bioaccessibility
- 45. Figure 10: Bioaccessibility of Lead in Soils 0 10 20 30 40 50 60 70 80 90 100 0 50 100 150 200 250 300 350 [Pb] in 250 µm soil fraction (mg/kg) %Bioaccessibility
- 46. Figure 11: Bioaccessibility of Nickel in Soils 0 10 20 30 40 50 60 70 80 90 100 0 500 1000 1500 2000 2500 3000 3500 4000 4500 [Ni] in 250 µm soil fraction (mg/kg) %Bioaccessibility
- 47. Figure 12A: Bioaccessibility of Selenium in Soils-All Data 0 20 40 60 80 100 120 140 160 0 2 4 6 8 10 12 14 [Se] in 250 µm soil fraction (mg/kg) %Bioaccessibility
- 48. Figure 12B: Bioaccessibility of Selenium in Soil-Excluding Data with below MDL in Sieved Soil 0 20 40 60 80 100 120 0 2 4 6 8 10 12 14 [Se] in 250 µm soil fraction (mg/kg) %Bioaccessibility
- 49. Figure 12C: Bioaccessibilityof Selenium-excluding data below MDL in either the extraction fluid or the sieved soil fraction 0 20 40 60 80 100 120 0 2 4 6 8 10 12 14 [Se] in 250 µm soil fraction (mg/kg) %Bioaccessibility
- 50. Figure 13: Bioaccessibility of Arsenic in Dust 0 1 2 3 4 5 6 0 10 20 30 40 50 60 [As] in Dust (mg/kg) Bioaccessibility(%)
- 51. Figure 14: Bioaccessibility of Cobalt in Dust 0 0.5 1 1.5 2 2.5 3 3.5 4 0 10 20 30 40 50 60 70 80 90 [Co] in Dust (mg/kg) Bioaccessibility(%)
- 52. Figure 15: Bioaccessibility of Copper in Dust 0 1 2 3 4 5 6 7 0 500 1,000 1,500 [Cu] in Dust (mg/kg) Bioaccessibility(%)
- 53. Figure 16: Bioaccessibility of Lead in Dust 0 1 2 3 4 5 6 7 8 0 50 100 150 200 250 300 350 400 [Pb] in Dust (mg/kg) Bioaccessibility(%)
- 54. Figure 17: Bioaccessibility of Nickel in Dust 0 0.5 1 1.5 2 2.5 3 3.5 0 100 200 300 400 500 600 700 800 900 [Ni] in Dust (mg/kg) Bioaccessibility(%)
- 55. June 2006 04-1112-069 Golder Associates APPENDIX A CHAIN OF CUSTODY FORMS
- 176. June 2006 04-1112-069 Golder Associates APPENDIX B LABORATORY ANALYTICAL DATA
- 383. June 2006 04-1112-069 Golder Associates APPENDIX C GOLDER’S METHOD DEVELOPMENT RATIONALE
- 384. June 2006 - C-1 - 04-1112-069 Golder Associates C.0 GOLDER’S METHOD DEVELOPMENT RATIONALE C.1 Literature Review As the first step in the development of an in vitro digestion method to investigate bioaccessibility of soil contaminants, Golder conducted a comprehensive literature review to access the work completed to date on in vitro bioaccessibility testing. The majority of the in vitro methods developed are sequential extractions with two major phases: (i) a gastric phase extraction to simulate the acidic environment of the stomach; and, (ii) an intestinal phase extraction to simulate the environment of the small intestine. Of the methods published to date, differences among the various methods include the following experimental parameters: • composition of the extraction fluids; • residence time (in the gastric and intestinal compartments); • pH (of the gastric and intestinal compartments); • fluid volume-to-soil ratios; • soil fraction size; and, • method of mixing. Despite these differences, bioaccessibility measurements among methods, particularly for lead and arsenic, have been shown to compare favourably, indicating that these methods can be used to accurately predict bioavailability. It should be noted that bioaccessibility is an overestimation of bioavailability as it takes into account only what is solubilized from the soil matrix. Only a portion of the metal that is solubilized will pass through the intestinal epithelium, and only a portion of that amount will escape metabolism and/or excretion and exert toxicity. Therefore, by assuming that bioaccessibility is equal to bioavailability in a HHRA, an extra conservative measure is taken. C.2 Parameters Used in Golder’s Methodology Golder’s method was developed to represent a worst-case scenario of oral exposure to metal- contaminated soil, but also to be realistic and technically feasible. As such, it was designed to mimic the gastrointestinal physiology of a human under fasting conditions. Children are believed to be at the greatest risk for metal exposure due to incidental soil ingestion from frequent hand-to- mouth behaviour and fasting conditions tend to produce the highest concentrations of dissolved metals, and hence, the highest estimates of bioaccessibility. However, the residence time in the gut of a child is much shorter and the pH is higher than in an adult, suggesting that the bioaccessibility of metal-contaminated soils would be less in children. However, for some metals tested, children tend to absorb much more than an adult due to differences in the physiology of the intestinal membrane (non-selective uptake of metals in children)(Daston et al., 2004).
- 385. June 2006 - C-2 - 04-1112-069 Golder Associates However, to predict the worst-case scenario for bioaccessibility, Golder’s method uses lower pH values and longer residence times, as measured in adults C.2.1 Compartments of the Gastrointestinal Tract The human gastrointestinal tract is comprised of the mouth, esophagus, stomach, small intestine, large intestine and rectum. Since food digestion and absorption, and metal mobilization and absorption (Diamond et al., 1997) mainly occur in the stomach and small intestine, only these compartments were considered in this model. In addition, temperature throughout the procedure was maintained at 37°C to mimic normal human body temperature. C.2.2 Soil Fraction Size Although there continues to be some controversy surrounding the issue of soil fraction size the ≤250 μm fraction is the soil fraction thought to most likely adhere to hands and be ingested from hand-to-mouth behaviour (Driver et al., 1989). In addition, it is the soil fraction size that has been used to validate the in vitro methods to in vivo animal studies (Ruby et al., 1996;Rodriguez et al., 1999a);(Schroder et al., 2004). For these reasons, Golder uses this soil fraction in its bioaccessibility testing. However, research is currently being conducted to determine if smaller fractions could potentially be more representative. C.2.3 Fluid Volume-to-Soil Ratio The fluid volume-to-soil ratio is another aspect of bioaccessibility testing that is currently the focus of research, including the method validation research being conducted at Golder. Approximately, 2 L of gastric juice is released to the stomach of a child or an adult in a 24-hour period under fed conditions (Lentner, 1981), yielding a throughput of approximately 80 mL per hour. However, the volume of gastric juice released is likely to be less under fasting conditions. A child, typically ingest more soil than an adult, typically anywhere from 80 (CCME, 1996) to 400 mg (U.S.EPA, 1997)(US EPA, 2000) of soil per day, yielding a fluid volume-to-soil ratio of 1000:1 and 200:1 in the stomach, respectively, if all of the soil is consumed within 1 hour. Given that the average toddler is outdoors for 175 min/day (U.S.EPA, 1997), and assuming the daily volume of soil is consumed over a 3-hour period, then the ratios could be as high as 3000:1 and 601:1, for ingestion of 80 and 100 mg of soil, respectively. Golder has selected a fluid volume- to-soil ratio of 100:1 for its method for a number of reasons, despite the view that a higher fluid volume-to-soil ratio would be more physiologically representative. The rationale for this is as follows: • the 100:1 fluid volume-to-soil ratio is used in other in vitro methods that have been validated with in vivo studies, that is, results of the in vitro methods were able to accurately predict bioavailability in the animal studies, and Golder’s method is similar to these validated in vitro methods;
- 386. June 2006 - C-3 - 04-1112-069 Golder Associates • a 100:1 fluid volume-to-soil ratio does not result in any solubility limitations on metal bioaccessibility for the metals studied (i.e., as the concentration of the metal increased, the bioaccessibility increased). If solubility limitations were an issue, bioaccessibility may have decreased as the metal concentration increased); and, • the use of a 100:1 fluid volume-to-soil ratio alleviates some of the issues related to analytical detection of the metals. If higher dilution ratios are used, there is a risk of diluting the contaminant to below method detection limits (MDLs) thereby underestimating potential bioavailability. Golder’s review of these various bioaccessibility methods in the literature suggested that the primary source of variability for extraction would be the ratio of soil to extraction fluid, as the digestive process is essentially a hydrochloric acid digestion of ingested particles (i.e., food, soil, etc.). In order for a metal or metalloid to be entirely released from the soil matrix, there must be an excess of acid, as soils have a general capacity to buffer strong acid. This buffering capacity of soils can be quite variable, and as a general principle for the development of a soil bioaccessibility method, a large ratio of extraction fluid (e.g., simulated stomach acid) to soil is required to provide sufficient acidity to maximize the leaching process and provide a conservative assessment of bioaccessibility. To test this, a series of extractant : soil ratios were examined for a certified reference soil (Montana Standard 2711; NIST (U.S. National Institute of Standards and Technology)) in order to determine the appropriate conditions for leaching. Figure C-1 illustrates isotherms for the extraction of four metals (i.e. bioaccessibility estimates) for the range of extractant : soil ratios examined. Clear trends in increased extraction were observed with increasing ratios of acid relative to soil. These findings are similar to those of Oomen et al. (2002), who observed the highest degree of extraction in the methods with the highest ratio of extraction fluid to soil. Other researchers (Hamel et al. 1998) have demonstrated that extractant : soil ratios between 100 and 5000 did not appreciably increase bioaccessibility from a certified reference soil. C.2.4 Residence Time and pH Golder’s bioaccessibility testing method utilizes a residence time of 2 hours in the stomach and 2 hours in the small intestine. The residence time in the stomach is longer and in the small intestine shorter than times reported in the literature of 1 hour (Smith et al., 1993) and 3.5 hours (Murphy et al., 1988;Vajro et al., 1988), respectively, in children, in a fed state. However, the residence times in the unfed state, the state simulated in Golder’s method, are expected to be much shorter. Regardless, the longer residence times used by Golder are more representative of the residence times in adults (Daugherty and Mrsny, 1999) and will overestimate metal bioaccessibility, keeping with the overall conservative nature of the method. The pH of the gastric compartment will vary depending on the proximity to a feeding event. The lowest pH values are detected during an unfed state, and result in the highest solubilization of
- 387. June 2006 - C-4 - 04-1112-069 Golder Associates metals from soil. Mean gastric pH values of 1.8 and 2.0 have been recorded in children (Anderson et al., 1999). However, given the sample size (n=81) and the method used to obtain the pH values in that study, Golder chose to remain conservative and use a pH value of 1.5 for the gastric phase. The pH value of the small intestine changes from 4-5.5 in the duodenum to 7-7.5 in the ileum (Daugherty and Mrsny, 1999). A pH value of 7 was used for the intestinal phase. Figure C-1: Bioaccessibility of Elements from NIST Montana II Soil Using Different Extractant- to-Soil Ratios. C.2.5 Mixing and Extraction Apparatus Mixing in the stomach and small intestine occurs by peristalsis, whereby smooth muscle contractions mix and propel food through the gastrointestinal system. To simulate gastric and intestinal mixing, published in vitro models have utilized end-over-end mixing in a water bath (Oomen et al., 2003), paddle stirring in a water bath (Schroder et al., 2003) (Rodriguez et al., 1999b), wrist-action shaking in a water bath (Ruby et al., 1993), and rotary-shaking in a water bath (Kientz et al., 2003). Golder’s methodology utilizes a back-and-forth rocking motion (at an angle of 11°) in an incubation oven (Boekel “Shake ‘N Bake” DNA hybridization oven) maintained at a temperature of 37°C (Figure C-2). This oven is equipped with a rotating rotor hinged to one side of the incubator. This allows for a back-and-forth/up-and-down rocking motion at a speed of 25 strokes per minute; this is thought to be more representative of conditions 0 10 20 30 40 50 60 0 20 40 60 80 100 120 Ratio (g leachate / g soil) %Leached Arsenic Cobalt Copper Nickel
- 388. June 2006 - C-5 - 04-1112-069 Golder Associates most likely to exist in humans during the digestive process. This apparatus also allows for the use of disposable incubation vessels (WhirlPak Bags, Nasco) that reduce the potential for cross- contamination among samples. Testing conducted to date using this method indicates that the extraction of a certified standard reference soil (NIST SRM 2711) is comparable with that reported in the literature. Therefore, this extraction apparatus is appropriate and has been adopted by Golder for routine bioaccessibility testing. . Figure C-2: Bioaccessibility Incubator Apparatus (Boekel Scientific Shake N’ Bake DNA Hybridization Oven, Model 136400). For a summary of the Golder method please refer to section 2.2 of the Report.
- 389. June 2006 04-1112-069 Golder Associates APPENDIX D SOIL, DUST AND EXTRACTION FLUID ANAYLTICAL RESULTS AND BIOACCESSIBILITY ESTIMATES
- 390. June 2006 TABLE D1 Soil and Extraction Fluid Analytical Results and Bioaccessibility Estimates 04-1112-069 05-334 05-335 05-336 05-337 05-338 05-339 05-340 05-341 05-342 05-343 05-344 05-345 05-346 05-347 05-348 05-349 05-350 05-351 05-352 05-353 05-354 05-355 05-356 05-357 05-358 05-359 05-361 501 502 504 505 506 507 509 510 511 512 513 514 515 516 517 518 519 520 521 522 523 524 525 526 528 529 530 Parameter Units Detection Limit Arsenic µg/L 1 154.6 405.6 39.2 41.1 103.6 140.6 30.1 54.6 16.7 95.4 7.8 181.6 8.1 36.9 117.6 51.7 96.1 30.4 92 390.6 427.6 38.4 28.8 11.5 136.6 34.9 48 Cobalt µg/L 0.5 158.7 91.3 52.7 63.5 163.7 182.7 34.2 51.4 15.6 128.7 10.9 194.7 10.3 84 72 46.9 77.4 23.8 99.7 259.7 304.7 43.4 26.4 13.4 163.7 23.4 45.2 Copper µg/L 1 5666.08 6706.08 5466.08 7986.08 22236.08 5366.08 2966.08 5636.08 1286.08 10436.08 302.08 6766.08 314.08 3666.08 2366.08 1676.08 2186.08 1496.08 9436.08 13636.08 12136.08 1686.08 1096.08 372.08 5316.08 532.08 4246.08 Lead µg/L 2 115.03 231.03 150.03 312.03 210.03 114.03 20.43 41.93 31.63 502.03 60.33 124.03 33.33 229.03 36.93 55.43 14.63 98.03 168.03 119.03 203.03 66.13 40.03 28.63 129.03 32.83 88.73 Nickel µg/L 1 4673.8 3393.8 1673.8 2903.8 6793.8 4453.8 1693.8 2513.8 378.8 4873.8 47.8 6653.8 106.8 3953.8 1873.8 1593.8 1253.8 725.8 4223.8 9793.8 9933.8 1213.8 536.8 238.8 3343.8 482.8 2533.8 Selenium µg/L 2 -0.26 7.84 14.44 5.48 40.74 1.24 1.24 1.24 1.24 19.64 0 1.24 0 1.24 1.24 0 12.94 1.24 19.44 7.6 6.55 1.24 1.24 1.24 1.24 1.24 1.24 Parameter Units Detection Limit Arsenic µg/g 0.6 112 196 15.5 17.6 25.7 78.4 6 14.3 5.7 27.7 4 29.7 3.8 18.6 71.8 15.7 37.6 8 23.6 285 255 10.3 9.3 4 50 9.7 10.3 Cobalt µg/g 0.3 60.1 37.2 18.5 24.1 47.8 82.5 11.8 16.9 8.4 38.4 10.2 39.8 6.9 21.5 26.3 15.4 25.9 12.2 28.5 135 163 15.4 10 6 65 8.8 14.1 Copper µg/g 0.3 1040 982 754 1140 2670 1230 405 760 190 1620 67 1480 60 487 395 272 330 230 1260 2680 3060 266 170 61 1240 84.6 540 Lead µg/g 0.5 94.1 150 105 154 83.9 97.7 14.1 32 20.3 195 74 189 23 131 50.4 30.5 29.6 63 85.5 201 206 35.3 22.6 14.5 81 19.7 40.2 Nickel µg/g 0.6 1030 672 481 685 1500 1480 359 546 132 1320 67.3 1230 57.1 742 503 376 370 199 872 2890 4080 338 210 85.6 1160 118 429 Selenium µg/g 0.8 4.1 4.3 4.3 8.8 13.2 3.3 2.6 4.2 2 6.4 0.4 6.6 0.4 1.8 1.7 1.3 1.2 1.8 9.5 8 6.9 1 0.9 0.4 2.7 0.4 5.1 Parameter Units Detection Limit Arsenic µg/g 0.6 93 164 13.50 15 25.80 66.8 5 13.7 5.1 31.5 4 83.6 3.5 18.7 53.5 14.1 39.50 7.7 20.4 262 231 9.8 8.2 4.1 37.5 9.5 10.1 Cobalt µg/g 0.3 65.5 37.4 19.50 26.2 46.30 78.1 10.9 15.7 8.1 38.3 9.6 112 6.7 23.4 33.1 16.8 26.90 9.3 25.3 135 159 14.8 10.3 6.7 55.1 8.2 150 Copper µg/g 0.3 1180 1130 819.00 1400 2750.00 1160 377 674 168 1850 62 1560 56.7 555 412 285 301.00 204 1370 2440 2830 249 163 62 809 81.9 553 Lead µg/g 0.5 76.3 118 102.00 145 84.80 84.3 11.9 27.7 24.7 235 88.8 105 17.7 150 121 29.9 31.20 59.5 79.4 179 207 30.8 23 15.1 57.9 19 45.1 Nickel µg/g 0.6 1050 682 485.00 753 1470.00 1310 332 490 121 1320 60.6 1810 54.3 772 499 397 343.00 156 794 2460 3390 323 204 85.2 754 111 421 Selenium µg/g 0.8 3.6 4.4 4.90 9.6 13.20 3.1 2.3 3.6 1.6 7.6 0.40 4.3 0.40 1.9 1.9 1.2 1.20 1.5 8.9 8.2 6.5 1 0.40 0.40 2.4 0.40 4.7 Total volume of extraction fluid (L) 0.1025 0.1026 0.1022 0.1025 0.1026 0.1022 0.1023 0.1022 0.1029 0.1023 0.1022 0.1022 0.1022 0.1026 0.1025 0.1026 0.1021 0.1026 0.1028 0.1022 0.1022 0.1024 0.1027 0.1026 0.1024 0.1024 0.1026 1.00 1.00 1.00 1.00 1.00 1.00 1.00 1.00 1.00 1.00 1.00 1.00 1.00 1.00 1.00 1.00 1.00 1.00 1.00 1.00 1.00 1.00 1.00 1.00 1.00 1.00 1.00 Parameter Units Detection Limit Arsenic % na 14.1 21.2 25.8 23.9 41.4 18.3 51.3 39.0 30.1 35.2 19.9 62.5 21.8 20.4 16.8 33.8 26.1 39.0 40.1 14.0 17.1 38.2 31.8 29.5 28.0 36.8 47.8 Cobalt % na 27.1 25.2 29.1 27.0 35.1 22.6 29.6 31.1 19.1 34.3 10.9 50.0 15.3 40.1 28.1 31.2 30.5 20.0 36.0 19.7 19.1 28.9 27.1 22.9 25.8 27.2 32.9 Copper % na 55.8 70.1 74.1 71.8 85.4 44.6 74.9 75.8 69.7 65.9 46.1 46.7 53.5 77.2 61.4 63.2 67.6 66.7 77.0 52.0 40.5 64.9 66.2 62.6 43.9 64.4 80.7 Lead % na 12.5 15.8 14.6 20.8 25.7 11.9 14.8 13.4 16.0 26.3 8.3 6.7 14.8 17.9 7.5 18.6 5.0 16.0 20.2 6.1 10.1 19.2 18.2 20.3 16.3 17.1 22.6 Nickel % na 46.5 51.8 35.6 43.5 46.5 30.8 48.3 47.1 29.5 37.8 7.3 55.3 19.1 54.7 38.2 43.5 34.6 37.4 49.8 34.6 24.9 36.8 26.3 28.6 29.5 41.9 60.6 Selenium % na 0.0 18.7 34.3 6.4 31.7 3.8 4.9 3.0 6.4 31.4 0.0 1.9 0.0 7.1 7.5 0.0 110.1 7.1 21.0 9.7 9.7 12.7 14.1 31.8 4.7 31.7 2.5 Notes: Concentrations in italics represent concentrations that were below method detection limits. Extraction fluid metal concentrations were corrected for the mean bottle blanks of 1.4, 3.3, 63.92, 9.97, 166.2 and 1.26 µg/L for arsenic, cobalt, copper, lead, nickel and selenium, respectively. Metal soil bioaccessibilities were calculated based on the metal concentrations in the <250 µm fraction. na = not applicable. Data for sample 05-420 was not included on any Figures or in the calculations of the means and 95UCLs for all metals because of an analytical issue with the laboratory that could not be resolved. Golder ID CANTOX ID Total mass of soil (g) Golder Associates