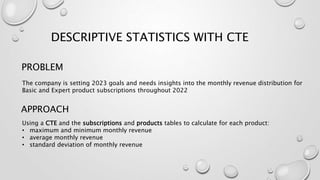
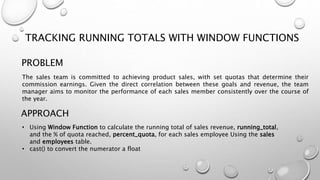
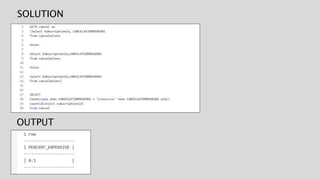
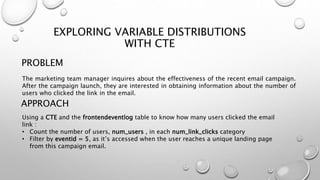
SQL
for Business Problems
PROBLEM
Using a CTE and the subscriptions and products tables to calculate for each product:
• maximum and minimum monthly revenue
• average monthly revenue
• standard deviation of monthly revenue
APPROACH
DESCRIPTIVE STATISTICS WITH CTE
The company is setting 2023 goals and needs insights into the monthly revenue distribution for
Basic and Expert product subscriptions throughout 2022
SOLUTION
OUTPUT
PROBLEM
• Using Window Function to calculate the running total of sales revenue, running_total,
and the % of quota reached, percent_quota, for each sales employee Using the sales
and employees table.
• cast() to convert the numerator a float
APPROACH
TRACKING RUNNING TOTALS WITH WINDOW FUNCTIONS
The sales team is committed to achieving product sales, with set quotas that determine their
commission earnings. Given the direct correlation between these goals and revenue, the team
manager aims to monitor the performance of each sales member consistently over the course of
the year.
SOLUTION
OUTPUT
PROBLEM
As users can go through statuses (fig1) we will use two CTEs and
three tables:
• Generate a CTE to compute the maxstatus reached for each
subscriptionid within the paymentstatuslog table.
• Next, form a CTE by combining the subscriptions table with the
previously created CTE. This enables the utilization of the
provided paymentfunnelstage code to classify each
subscriptionid based on its maxstatus and currentstatus.
• In a separate select statement below, count the number of
subscriptionid per paymentfunnelstage .
APPROACH
PAYMENT FUNNEL ANALYSIS WITH
CTE
The product manager requested a payment funnel analysis from the analytics team to identify
where users drop out in the payment process and gain full visibility into each stage from the
user's perspective
fig1
SOLUTION
OUTPUT
PROBLEM
• Using UNION and the cancelations table, calculate the percent of canceled
subscriptions that reported 'Expensive' as one of their cancelation reasons.
• Create cancel CTE
• Calculate the percent of canceled subscriptions that reported 'Expensive' as one of
their cancelation reasons. percent_expensive
APPROACH
UNPIVOTING COLUMNS INTO ROWS USING
UNION
Considering the challenging economic conditions, the initial focus is on extracting the percentage
of canceled subscriptions attributed to the product being deemed too expensive. People have the
option to choose up to three reasons from a predefined list. It's not possible for users to pick the
same reason more than once, and some users may choose fewer than three reasons, resulting in
null values for certain cancellation reason columns.
SOLUTION
OUTPUT
PROBLEM
Using a CTE and the frontendeventlog table to know how many users clicked the email
link :
• Count the number of users, num_users , in each num_link_clicks category
• Filter by eventid = 5, as it’s accessed when the user reaches a unique landing page
from this campaign email.
APPROACH
EXPLORING VARIABLE DISTRIBUTIONS
WITH CTE
The marketing team manager inquires about the effectiveness of the recent email campaign.
After the campaign launch, they are interested in obtaining information about the number of
users who clicked the link in the email.
SOLUTION
OUTPUT

SQL for Business Problems.pptx

  • 1.
  • 2.
    PROBLEM Using a CTEand the subscriptions and products tables to calculate for each product: • maximum and minimum monthly revenue • average monthly revenue • standard deviation of monthly revenue APPROACH DESCRIPTIVE STATISTICS WITH CTE The company is setting 2023 goals and needs insights into the monthly revenue distribution for Basic and Expert product subscriptions throughout 2022
  • 3.
  • 4.
    PROBLEM • Using WindowFunction to calculate the running total of sales revenue, running_total, and the % of quota reached, percent_quota, for each sales employee Using the sales and employees table. • cast() to convert the numerator a float APPROACH TRACKING RUNNING TOTALS WITH WINDOW FUNCTIONS The sales team is committed to achieving product sales, with set quotas that determine their commission earnings. Given the direct correlation between these goals and revenue, the team manager aims to monitor the performance of each sales member consistently over the course of the year.
  • 5.
  • 6.
    PROBLEM As users cango through statuses (fig1) we will use two CTEs and three tables: • Generate a CTE to compute the maxstatus reached for each subscriptionid within the paymentstatuslog table. • Next, form a CTE by combining the subscriptions table with the previously created CTE. This enables the utilization of the provided paymentfunnelstage code to classify each subscriptionid based on its maxstatus and currentstatus. • In a separate select statement below, count the number of subscriptionid per paymentfunnelstage . APPROACH PAYMENT FUNNEL ANALYSIS WITH CTE The product manager requested a payment funnel analysis from the analytics team to identify where users drop out in the payment process and gain full visibility into each stage from the user's perspective fig1
  • 7.
  • 8.
    PROBLEM • Using UNIONand the cancelations table, calculate the percent of canceled subscriptions that reported 'Expensive' as one of their cancelation reasons. • Create cancel CTE • Calculate the percent of canceled subscriptions that reported 'Expensive' as one of their cancelation reasons. percent_expensive APPROACH UNPIVOTING COLUMNS INTO ROWS USING UNION Considering the challenging economic conditions, the initial focus is on extracting the percentage of canceled subscriptions attributed to the product being deemed too expensive. People have the option to choose up to three reasons from a predefined list. It's not possible for users to pick the same reason more than once, and some users may choose fewer than three reasons, resulting in null values for certain cancellation reason columns.
  • 9.
  • 10.
    PROBLEM Using a CTEand the frontendeventlog table to know how many users clicked the email link : • Count the number of users, num_users , in each num_link_clicks category • Filter by eventid = 5, as it’s accessed when the user reaches a unique landing page from this campaign email. APPROACH EXPLORING VARIABLE DISTRIBUTIONS WITH CTE The marketing team manager inquires about the effectiveness of the recent email campaign. After the campaign launch, they are interested in obtaining information about the number of users who clicked the link in the email.
  • 11.