Downloaded 325 times


![Command Reference
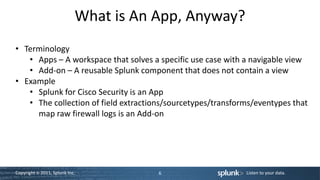
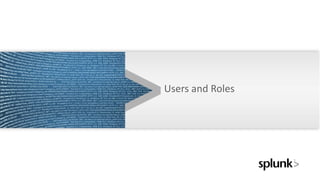
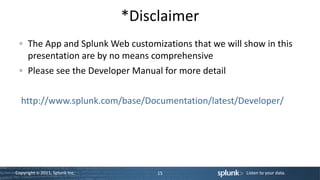
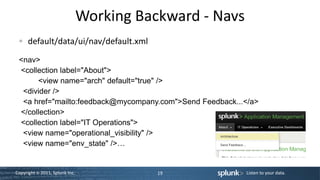
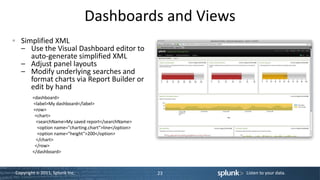
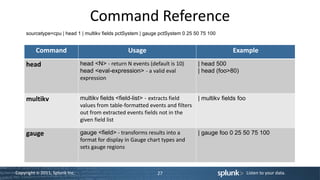
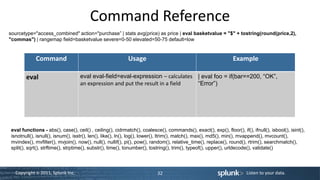
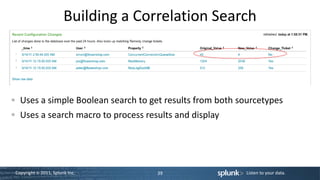
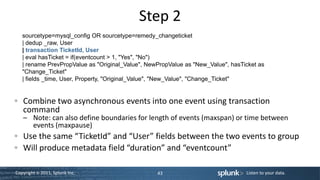
sourcetype="access_combined" action="purchase” | stats avg(price) as price | eval basketvalue = "$" + tostring(round(price,2),
"commas") | rangemap field=basketvalue severe=0-50 elevated=50-75 default=low
Command Usage Example
stats stats (stats-function(field) [as field]) + [by | stats avg(foo) as foobar by bar
field-list] – provides statistics grouped
optionally by field
stats functions - avg() , c() , count() , dc() , distinct_count() , first() , last() , list() , max() , median() , min() , mode() , p<in>() , perc<int>() ,
per_day() , per_hour() , per_minute() , per_second() , range() , stdev() , stdevp() , sum() , sumsq() , values() , var() , varp()
Copyright © 2011, Splunk Inc. 31 Listen to your data.](https://image.slidesharecdn.com/splunklive2011advancedsession-111031231455-phpapp02/85/SplunkLive-2011-Advanced-Session-31-320.jpg)
![Command Reference
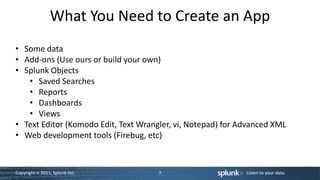
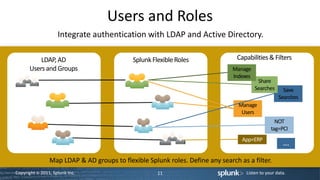
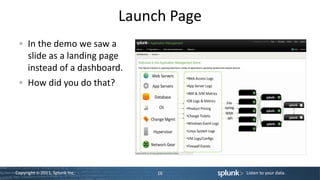
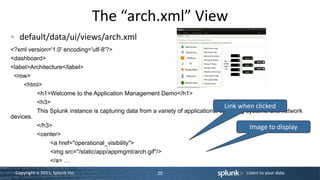
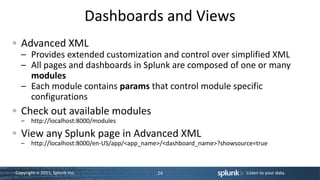
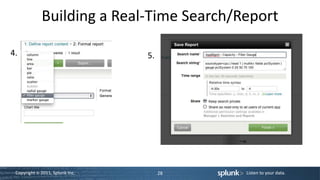
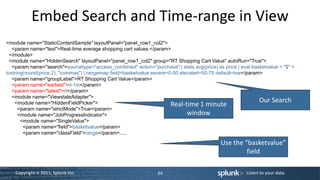
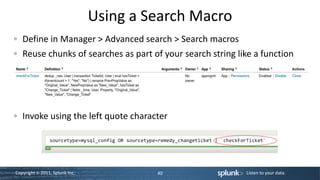
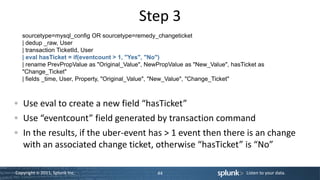
sourcetype="access_combined" action="purchase” | stats avg(price) as price | eval basketvalue = "$" + tostring(round(price,2),
"commas") | rangemap field=basketvalue severe=0-50 elevated=50-75 default=low
Command Usage Example
rangemap rangemap field=<string> | rangemap field=foo low=0-10
(<attrn>=<number>-<number>) + elevated=11-20 severe=21-30
[default=<string>] – sets range field to the default=low
name of the ranges that match
Note: Splunk ships with CSS that defines colors for low, elevated, and severe. You can customize CSS for
these values.
Copyright © 2011, Splunk Inc. 33 Listen to your data.](https://image.slidesharecdn.com/splunklive2011advancedsession-111031231455-phpapp02/85/SplunkLive-2011-Advanced-Session-33-320.jpg)
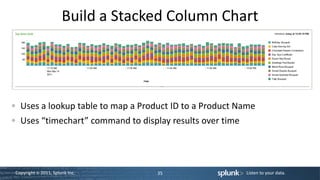
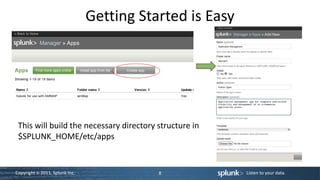
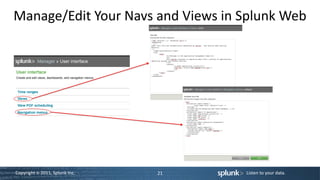
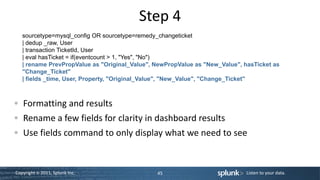
![Use a Lookup Table
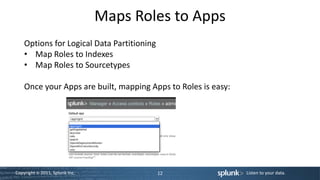
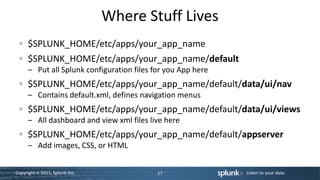
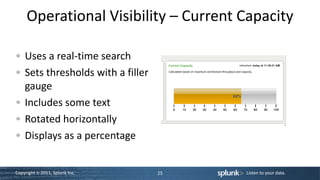
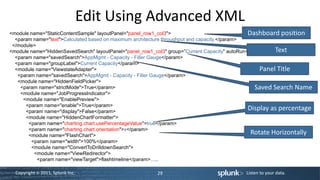
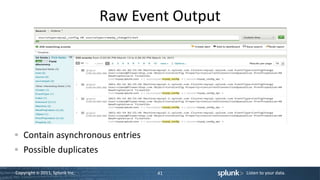
• In props.conf • In lookup directory, prod_lookup.csv
[access_combined] product_id,product_name,price,tdf_price,call_
LOOKUP-prod = prod_id_lookup flwrs_price
product_id OUTPUT product_name, RP-LI-02,Chocolate Dreams
price, tdf_price, call_flwrs_price Confections,379,299,319
• In transforms.conf
[prod_id_lookup]
filename = prod_lookup.csv
Copyright © 2011, Splunk Inc. 36 Listen to your data.](https://image.slidesharecdn.com/splunklive2011advancedsession-111031231455-phpapp02/85/SplunkLive-2011-Advanced-Session-36-320.jpg)
![Command Reference
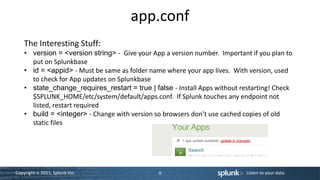
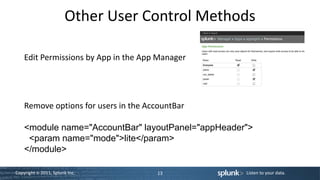
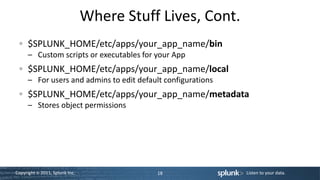
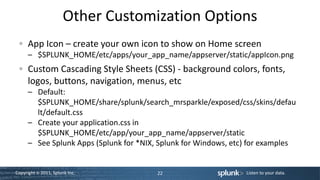
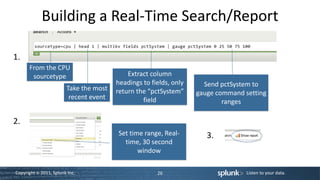
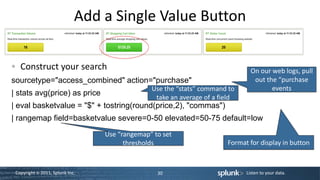
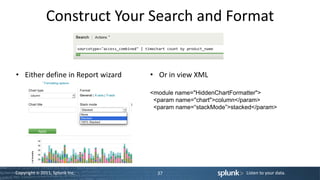
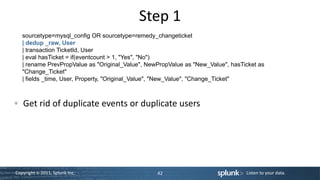
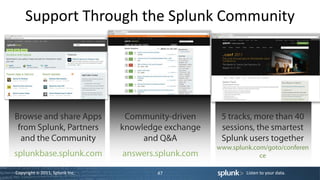
sourcetype="access_combined” | timechart count by product_name
Command Usage Example
timechart timechart [agg=<stats-agg-term>] | timechart span=1m avg(foo) by
[<bucketing-option> ]* (<single-agg> [by bar
<split-by-clause>] )
timechart functions (same as stats) - avg() , c() , count() , dc() , distinct_count() , first() , last() , list() , max() , median() , min() , mode() ,
p<in>() , perc<int>() , per_day() , per_hour() , per_minute() , per_second() , range() , stdev() , stdevp() , sum() , sumsq() , values() , var() ,
varp()
Copyright © 2011, Splunk Inc. 38 Listen to your data.](https://image.slidesharecdn.com/splunklive2011advancedsession-111031231455-phpapp02/85/SplunkLive-2011-Advanced-Session-38-320.jpg)


This document is a technical workshop presentation by Jeff Blake, focusing on advanced user training with Splunk, specifically in app development, user roles, and data visualization. It covers essential concepts such as app architecture, directory structures, customization options, and various command references for building searches and dashboards. The content aims to equip experienced users to enhance their proficiency in utilizing Splunk for data manipulation and reporting.