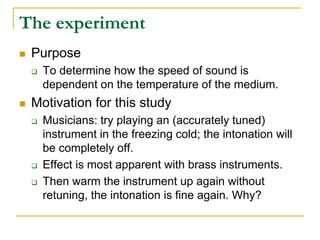
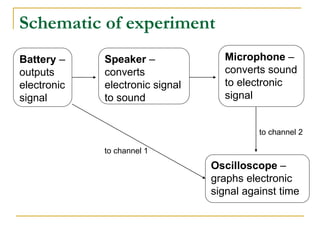
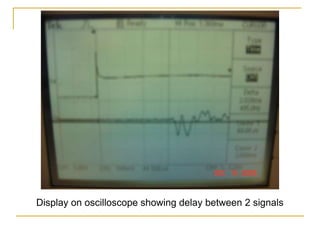
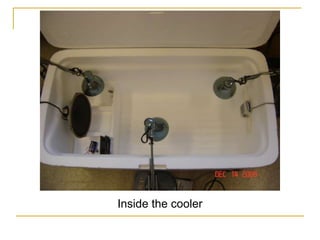
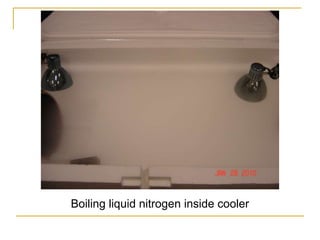
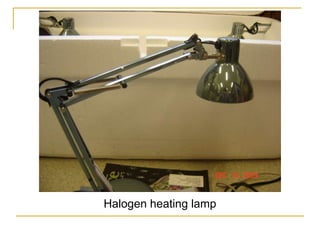
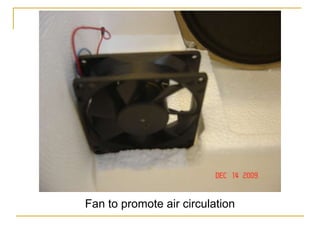
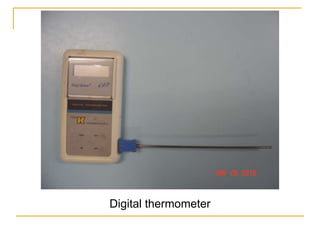
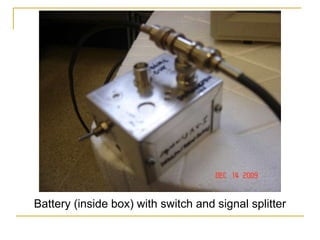
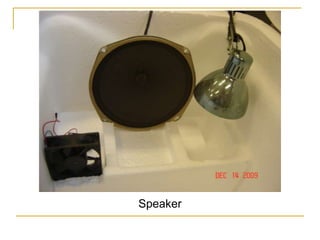
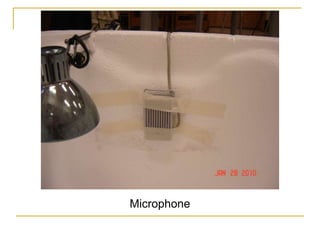
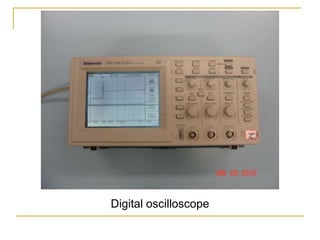
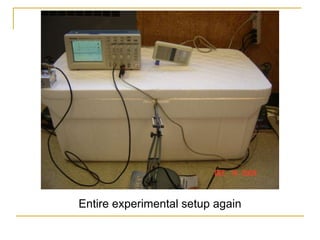
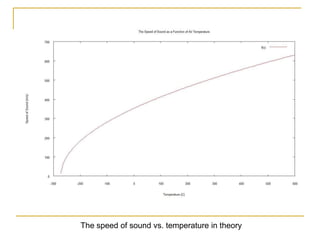
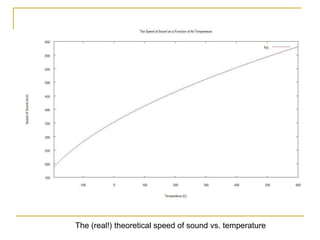
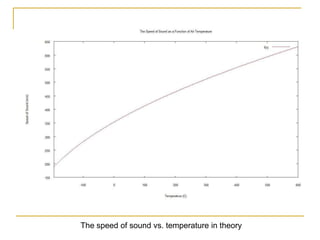
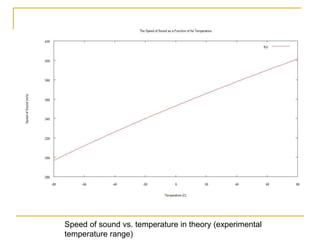
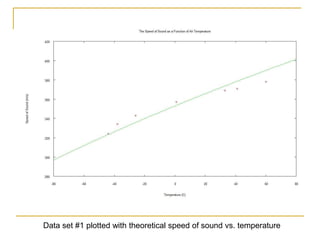
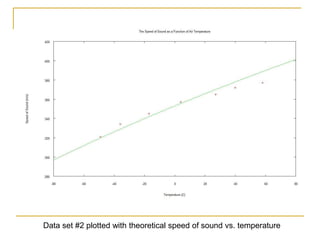
Investigating the
Properties of Sound
Demonstrating the temperature
dependence of the speed of sound in air
Outline
 Introduction to sound waves
 The experiment – measuring the temperature
dependence of the speed of sound
 The theory of sound propagation
 Data analysis and discussion of
experimental results
 Conclusion
What is sound in physics terms?
 A longitudinal travelling wave.
 Caused by an oscillation of pressure (the
compression and dilation of particles) in matter.
 Other names for sound are pressure waves,
compression waves, and density waves.
 Names derived from the motion of particles that carry
sound.
Sound wave animation:
http://paws.kettering.edu/~drussell/Demos/waves/wavemotion.html
Notice that each individual particle merely oscillates.
How do we perceive sound?
 Pressure waves causes the eardrum to vibrate accordingly.
 That vibration is transferred to the brain and then interpreted
as sound.
Some properties of sound
 Volume
 Amplitude of sound wave – how large are the
particle displacements?
 Pitch
 Frequency of oscillations.
 Speed of propagation
 How fast does a sound wave travel?
 What factors affect the speed of sound?
The experiment
 Purpose
 To determine how the speed of sound is
dependent on the temperature of the medium.
 Motivation for this study
 Musicians: try playing an (accurately tuned)
instrument in the freezing cold; the intonation will
be completely off.
 Effect is most apparent with brass instruments.
 Then warm the instrument up again without
retuning, the intonation is fine again. Why?
Schematic of experiment
Speaker –
converts
electronic signal
to sound
Microphone –
converts sound
to electronic
signal
Oscilloscope –
graphs electronic
signal against time
Battery –
outputs
electronic
signal
to channel 1
to channel 2
Display on oscilloscope showing delay between 2 signals
Apparatus
 Large Styrofoam cooler
 Liquid nitrogen
 Heating lamps (60W)
 Digital thermometer
 Two-channel digital oscilloscope
 Speaker
 Microphone
 Battery (9V) with switch
Entire experimental setup (outside view)
Inside the cooler
Boiling liquid nitrogen inside cooler
Halogen heating lamp
Fan to promote air circulation
Digital thermometer
Battery (inside box) with switch and signal splitter
Speaker
Microphone
Digital oscilloscope
Entire experimental setup again
Collecting the data
 Cooler has already been cooled with liquid
nitrogen to approx. -60˚C.
 We will periodically pause the lecture and
take a data point.
 Turn on battery to send a voltage pulse.
 This pulse triggers the oscilloscope to (1) start
reading and (2) freeze graph on screen (pre-set
oscilloscope functions).
 Immediately record the temperature.
 Use oscilloscope cursors to measure the time
delay between the signals on channels 1 and 2.
How is sound modeled mathematically?
 Sound is a somewhat abstract concept
 A sound wave isn’t an object – it’s a type of
particle motion.
 That motion can be understood as travelling
compressions and rarefactions in a medium.
 Most straight-forward method to describe
sound is to keep track of the positions of
every particle that mediates the sound wave.
 Number of particles is on the order of 1023 –
impossible to calculate the movement of
every single particle!
 Real method:
 Same idea, but no need to keep track of every
particle individually.
 Use probability and statistics to “guess” the
collective behaviour of particles.
 The branch of physics that uses statistics to
model very large systems is called
thermodynamics, or statistical mechanics.
 Sound is a statistical mechanical
phenomenon.
Important Definitions
 Bulk modulus (K)
 A measure of the elasticity of a gas; ie. how easily is the
gas compressed?
 Analogous to the spring constant in Hooke’s law
V
P
V
K



x
k
F 


V
V
K
P



Just as a high spring constant
corresponds to a stiffer spring, a
high bulk modulus corresponds to a
less compressible gas – a “stiffer”
gas.
P
K 
 
For diatomic gases
 Adiabatic process
 A physical process in which heat does not enter or
leave the system.
 The compression and dilation of air to form a
sound wave is an adiabatic process.
 Adiabatic index (γ)
 A thermodynamic quantity related to the specific
heat capacities of substances.
 Here γ accounts for the heat energy associated
with compression, which adds to the gas
pressure.
 γ ≈ 1.4 for diatomic gases.
The speed of sound in theory
 A rigorous derivation of the speed of sound from first
principles in statistical mechanics is much too
complicated.
 We need to start somewhere though, so lets begin
with a more easily accessible equation.

K
c 


P

The speed of sound is denoted as c by
convention; p is pressure and ρ is density.
So where’s the dependence on temperature?
Recall from chemistry class the ideal gas law:
T
Nk
PV B
 where P is pressure, V is volume,
N is the number of particles, kB is
the Boltzmann constant, and T is
temperature in Kelvin.
V
T
k
N
c B







Substituting for P in our previous expression:
Now realize:
M
V 


m
N
V



Therefore where m is the mass of a
single molecule.
m
T
k
c B 



Substituting in m gives us:
15
.
273
1
15
.
273

 




m
kB
 is temperature in Celsius.
Now realize T = + 273.15, where 
15
.
273


 

m
k
c B
Therefore
15
.
273
1
353



nitrogen
c ms-1
Notice that the first term is equal to the speed of sound at 0˚C.
Lastly, substitute in the correct numerical values and simplify to get:
Why do we want the expression specifically for nitrogen gas?
The speed of sound vs. temperature in theory
The (real!) theoretical speed of sound vs. temperature
Analyzing our data
 Our raw data gives us, at each temperature,
the travel time Δt of the sound wave.
 To extract speed, divide the distance
between the speaker and microphone by Δt.
 Distance measured to be 73cm.
 Now we can graph the speed of sound
against temperature.
 See how closely our data matches up with
theoretical predictions.
The speed of sound vs. temperature in theory
Speed of sound vs. temperature in theory (experimental
temperature range)
Data set #1 plotted with theoretical speed of sound vs. temperature
Data set #2 plotted with theoretical speed of sound vs. temperature
Discussion of experimental errors
 Many sources of measurement uncertainty.
 Distance between speaker and microphone.
 Uneven temperature distribution inside cooler.
 Air leakage – escaping nitrogen replaced by normal air.
 Oscilloscope screen does not clearly define the beginning
of the microphone signal.
 Acoustic noise from sounds inside room.
 Electronic noise from battery, microphone, etc.
 The approximations made in the derivation of the speed of
sound:
P
K 
  and 4
.
1


In summary
 What we perceive as sound is actually oscillations
of air particles.
 These oscillations are caused by pressure waves
travelling through the air.
 Sound waves are mathematically described by
statistical mechanics.
 The speed of sound is dependent on the
temperature of the medium carrying it, and obeys
the equation:
T
m
k
K
c B







Speed of Sound presentation.ppt

  • 1.
    Investigating the Properties ofSound Demonstrating the temperature dependence of the speed of sound in air
  • 2.
    Outline  Introduction tosound waves  The experiment – measuring the temperature dependence of the speed of sound  The theory of sound propagation  Data analysis and discussion of experimental results  Conclusion
  • 3.
    What is soundin physics terms?  A longitudinal travelling wave.  Caused by an oscillation of pressure (the compression and dilation of particles) in matter.  Other names for sound are pressure waves, compression waves, and density waves.  Names derived from the motion of particles that carry sound. Sound wave animation: http://paws.kettering.edu/~drussell/Demos/waves/wavemotion.html Notice that each individual particle merely oscillates.
  • 4.
    How do weperceive sound?  Pressure waves causes the eardrum to vibrate accordingly.  That vibration is transferred to the brain and then interpreted as sound.
  • 5.
    Some properties ofsound  Volume  Amplitude of sound wave – how large are the particle displacements?  Pitch  Frequency of oscillations.  Speed of propagation  How fast does a sound wave travel?  What factors affect the speed of sound?
  • 6.
    The experiment  Purpose To determine how the speed of sound is dependent on the temperature of the medium.  Motivation for this study  Musicians: try playing an (accurately tuned) instrument in the freezing cold; the intonation will be completely off.  Effect is most apparent with brass instruments.  Then warm the instrument up again without retuning, the intonation is fine again. Why?
  • 7.
    Schematic of experiment Speaker– converts electronic signal to sound Microphone – converts sound to electronic signal Oscilloscope – graphs electronic signal against time Battery – outputs electronic signal to channel 1 to channel 2
  • 8.
    Display on oscilloscopeshowing delay between 2 signals
  • 9.
    Apparatus  Large Styrofoamcooler  Liquid nitrogen  Heating lamps (60W)  Digital thermometer  Two-channel digital oscilloscope  Speaker  Microphone  Battery (9V) with switch
  • 10.
  • 11.
  • 12.
  • 13.
  • 14.
    Fan to promoteair circulation
  • 15.
  • 16.
    Battery (inside box)with switch and signal splitter
  • 17.
  • 18.
  • 19.
  • 20.
  • 21.
    Collecting the data Cooler has already been cooled with liquid nitrogen to approx. -60˚C.  We will periodically pause the lecture and take a data point.  Turn on battery to send a voltage pulse.  This pulse triggers the oscilloscope to (1) start reading and (2) freeze graph on screen (pre-set oscilloscope functions).  Immediately record the temperature.  Use oscilloscope cursors to measure the time delay between the signals on channels 1 and 2.
  • 22.
    How is soundmodeled mathematically?  Sound is a somewhat abstract concept  A sound wave isn’t an object – it’s a type of particle motion.  That motion can be understood as travelling compressions and rarefactions in a medium.  Most straight-forward method to describe sound is to keep track of the positions of every particle that mediates the sound wave.  Number of particles is on the order of 1023 – impossible to calculate the movement of every single particle!
  • 23.
     Real method: Same idea, but no need to keep track of every particle individually.  Use probability and statistics to “guess” the collective behaviour of particles.  The branch of physics that uses statistics to model very large systems is called thermodynamics, or statistical mechanics.  Sound is a statistical mechanical phenomenon.
  • 24.
    Important Definitions  Bulkmodulus (K)  A measure of the elasticity of a gas; ie. how easily is the gas compressed?  Analogous to the spring constant in Hooke’s law V P V K    x k F    V V K P    Just as a high spring constant corresponds to a stiffer spring, a high bulk modulus corresponds to a less compressible gas – a “stiffer” gas. P K    For diatomic gases
  • 25.
     Adiabatic process A physical process in which heat does not enter or leave the system.  The compression and dilation of air to form a sound wave is an adiabatic process.  Adiabatic index (γ)  A thermodynamic quantity related to the specific heat capacities of substances.  Here γ accounts for the heat energy associated with compression, which adds to the gas pressure.  γ ≈ 1.4 for diatomic gases.
  • 26.
    The speed ofsound in theory  A rigorous derivation of the speed of sound from first principles in statistical mechanics is much too complicated.  We need to start somewhere though, so lets begin with a more easily accessible equation.  K c    P  The speed of sound is denoted as c by convention; p is pressure and ρ is density. So where’s the dependence on temperature?
  • 27.
    Recall from chemistryclass the ideal gas law: T Nk PV B  where P is pressure, V is volume, N is the number of particles, kB is the Boltzmann constant, and T is temperature in Kelvin. V T k N c B        Substituting for P in our previous expression: Now realize: M V    m N V    Therefore where m is the mass of a single molecule.
  • 28.
    m T k c B     Substitutingin m gives us: 15 . 273 1 15 . 273        m kB  is temperature in Celsius. Now realize T = + 273.15, where  15 . 273      m k c B Therefore 15 . 273 1 353    nitrogen c ms-1 Notice that the first term is equal to the speed of sound at 0˚C. Lastly, substitute in the correct numerical values and simplify to get: Why do we want the expression specifically for nitrogen gas?
  • 29.
    The speed ofsound vs. temperature in theory
  • 30.
    The (real!) theoreticalspeed of sound vs. temperature
  • 31.
    Analyzing our data Our raw data gives us, at each temperature, the travel time Δt of the sound wave.  To extract speed, divide the distance between the speaker and microphone by Δt.  Distance measured to be 73cm.  Now we can graph the speed of sound against temperature.  See how closely our data matches up with theoretical predictions.
  • 32.
    The speed ofsound vs. temperature in theory
  • 33.
    Speed of soundvs. temperature in theory (experimental temperature range)
  • 34.
    Data set #1plotted with theoretical speed of sound vs. temperature
  • 35.
    Data set #2plotted with theoretical speed of sound vs. temperature
  • 36.
    Discussion of experimentalerrors  Many sources of measurement uncertainty.  Distance between speaker and microphone.  Uneven temperature distribution inside cooler.  Air leakage – escaping nitrogen replaced by normal air.  Oscilloscope screen does not clearly define the beginning of the microphone signal.  Acoustic noise from sounds inside room.  Electronic noise from battery, microphone, etc.  The approximations made in the derivation of the speed of sound: P K    and 4 . 1  
  • 37.
    In summary  Whatwe perceive as sound is actually oscillations of air particles.  These oscillations are caused by pressure waves travelling through the air.  Sound waves are mathematically described by statistical mechanics.  The speed of sound is dependent on the temperature of the medium carrying it, and obeys the equation: T m k K c B      