Sources recent publications conference proceedings_icap-isap_icap2006, 10th, quebec, canada_performance of the fhwa’s alf modified-binder pavements
•
1 like•50 views

técnico

Recommended
Recommended
More Related Content
What's hot
What's hot (20)
Similar to Sources recent publications conference proceedings_icap-isap_icap2006, 10th, quebec, canada_performance of the fhwa’s alf modified-binder pavements
Similar to Sources recent publications conference proceedings_icap-isap_icap2006, 10th, quebec, canada_performance of the fhwa’s alf modified-binder pavements (20)
Recently uploaded
Recently uploaded (20)
Sources recent publications conference proceedings_icap-isap_icap2006, 10th, quebec, canada_performance of the fhwa’s alf modified-binder pavements
- 1. Qi, Al-Khateeb, and Shenoy Proceedings of the 10th International Conference on Asphalt Pavements (ICAP), Quebec, Canada, August 12-17, 2006 Performance of the FHWA’s ALF Modified-Binder Pavements Xicheng Qi, Ghazi Al-Khateeb, and Aroon Shenoy Turner-Fairbank Highway Research Center / SaLUT 6300 Georgetown Pike, McLean, VA 22101-2296, USA Terry Mitchell, Nelson Gibson, Jack Youtcheff, Tom Harman Federal Highway Administration 6300 Georgetown Pike, McLean, VA 22101-2296, USA Theme: Pavement Performance/topic number: 3.2 Full-scale and accelerated pavement testing ABSTRACT: In the summer of 2002, twelve (12) full-scale lanes of pavements with various modified asphalts were constructed at the Federal Highway Administration’s (FHWA) Pavement Testing Facility (PTF) in Virginia. The primary goal of the study is to use FHWA’s two Accelerated Loading Facility (ALF) machines to validate and refine changes being proposed in the Superpave binder specification to properly grade modified binders. In December 2002, ALF loading began on the pavements to induce two primary modes of failure: rutting and fatigue cracking. Currently, rut testing has been completed at 64 °C on all 12 lanes. Fatigue testing at 19 °C is underway and scheduled to be complete by early 2006. The pavement performance is being compared to both binder and mixture parameters. This paper presents an overview of the pooled fund study, rutting and fatigue cracking performance and correlation analyses with the laboratory testing results obtained to date. KEY WORDS: Superpave, modified-binders, APT, rutting, fatigue. 1. INTRODUCTION With the growing use of polymer-modified asphalts, improvement in Superpave’s asphalt binder specification is needed to better predict the relative performance of modified and unmodified binder pavements. Under current specifications, the rankings of many polymer- modified asphalts by standardized laboratory test procedures do not agree with those by pavement performance. The FHWA recent multiyear effort is to study the performance of Superpave mixtures containing polymer-modified asphalt binders. This research is supported by 16 State highway agencies and more than 30 industry sponsors through a transportation pooled fund study TPF-5 (019) titled, “Full-Scale Accelerated Performance Testing for Superpave and Structural Validation.” In the summer of 2002, twelve (12) full-scale lanes of pavements with various modified asphalts were constructed at the FHWA’s PTF in Virginia. In December 2002, loading began on the pavements using two ALF machines to induce two primary modes of failure: rutting and fatigue cracking. The field rutting performance data has been correlated with binder parameters and performance of the asphalt mixtures in laboratory tests, e.g., the Superpave shear tester, simple performance tests (SPT), and the French and Hamburg Wheel Tracking Devices. The field fatigue cracking data are being compared to both binder parameters and the mixture lab testing data from the Beam fatigue test, the SPT, and the indirect tensile test (IDT). This paper presents an overview of the pooled fund study,
- 2. Qi, Al-Khateeb, and Shenoy Proceedings of the 10th International Conference on Asphalt Pavements (ICAP), Quebec, Canada, August 12-17, 2006 2 the pavement rutting and fatigue cracking performance and correlation analyses with the laboratory testing results obtained to date. 2. FHWA PAVEMENT TESTING FACILITY 2.1 ALF FHWA’s PTF consists of two ALF machines (Figure 1), to simulate traffic loading at controlled loading and pavement temperatures, and about 3420 m2 (0.83 acres) of grounds that provide space for 12 pavement test lanes. The ALF machines are 29-m (95-ft) long frames with rails to direct rolling wheel loads. Each ALF machine is capable of applying an average of 35,000 wheel passes per week from a half-axle load ranging from 33 to 84 kN (7,500 to 19,000 lbf). The load is applied unidirectionally at 18 km/hr (11 mi/hr) to a 14-m (45-ft) length of pavement. The machines allow testing with conventional dual truck tires or wide-based, “super-single” tires and simulation of the real-world, lateral distribution of truck loadings using programmed transverse wheel wander. In the current experiment, both machines are equipped with super- single (425/65R22.5 wide base) tires. Figure 1: The FHWA two ALF machines loading pavements at PTF site. 2.2 Pavement Test Lanes The current layout of the 12 as-built pavement lanes is presented in Figure 2. Each pavement lane is 4 m (13 ft) wide and 50 m (165 ft) long, and is divided into four test sites. All lanes consist of a hot-mix asphalt (HMA) layer and a dense-graded, crushed aggregate base (CAB) course over a uniformly prepared, AASHTO A-4 subgrade soil. The total thickness of the HMA and CAB layers is 660 mm (26 in.). Lanes 1 through 7 were constructed with a 100- mm (4-in.) thick layer of HMA, while lanes 8 though 12 were constructed with 150 mm (6 in.) of HMA. The binders used in each lane are also listed in Figure 2. Note that the control binder (PG 70-22) and three modified binders (Air-Blown, SBS-LG, and Terpolymer) are used in both 100-mm and 150-mm thick lanes to see the effect of thickness of HMA layer. 2.3 Binder Selection Most of the binders chosen for this field study had the same base asphalt (a Venezuelan blend) and were modified to have the same high temperature Superpave performance grade (PG 74-xx) so that the observed performance could be attributed only to the mode of
- 3. Qi, Al-Khateeb, and Shenoy Proceedings of the 10th International Conference on Asphalt Pavements (ICAP), Quebec, Canada, August 12-17, 2006 3 modification. Testing of binder samples collected during construction showed that the binders had the following continuous PG values: PG 70-22 control (continuous PG 72-23); air-blown (PG 74-28); SBS LG (PG 74-28); CR-TB (PG 79-28); Terpolymer (PG 74-31); and SBS 64- 40 (PG 71-28). The CR-TB missed the PG target of 74-xx, and the SBS 64-40 was purposely designed have a PG different from the rest in order to check out whether the performance of binders with high polymer content and soft bases can be captured by the Superpave specification. The intermediate grade temperatures for |G*|sinδ = 5MPa, which are shown in the legend of Figure 2, differ significantly and should provide a good test for checking the ability of the current intermediate binder specification to rate asphalt binders according to the fatigue cracking performance. Lane Number 1 2 3 4 5 6 7 8 9 10 11 12 AR-AZ PG 70-22 PG 70-22 Air- Blown SBS LG CR- TB Ter- polymer Fiber Removed 100 mm PG 70-22 SBS 64-40 Air- Blown SBS LG Ter- polymer Of Existing CAB 100 mm of New No. 21A CAB Under All 12 Lanes Removed 50 mm of Existing CAB Existing VDOT No. 21A Crushed Aggregate Base (CAB) (25-mm Nominal Maximum Aggregate Size) Bottom of CAB to Pavement Surface is 660 mm Re-compacted AASHTO A-4 Subgrade Soil PG 70-22 = Unmodified Asphalt Binder Control (Intermediate Grade Temperature TIS = 26.1°C) CR-AZ = Crumb Rubber Asphalt Binder, Arizona DOT Wet Process CR-TB = Crumb Rubber Asphalt Binder, Terminal Blend (TIS =17.9°C) Terpolymer = Ethylene Terpolymer Modified Asphalt Binder (TIS = 14.3°C) SBS LG = Styrene-Butadiene-Styrene Modified Asphalt Binder with Linear Grafting (TIS = 18.1°C) SBS 64-40 = Styrene-Butadiene-Styrene Modified Asphalt Binder Graded PG 64-40 (TIS =8.6°C) Air-Blown = Air-Blown Asphalt Binder (TIS = 22.6°C) Fiber = Unmodified PG 70-22 Asphalt Binder with 0.2 Percent Polyester Fiber by Mass of the Aggregate. Figure 2: Layout of the 12 as-built pavement lanes (not to scale) 2.4 Pavement Construction The test lanes were constructed in the summer and fall of 2002. The mixtures were produced in a counter flow drum plant located in Sterling, Virginia, 27 km (17 mi) from the PTF site. After transport, trucks unloaded the HMA into a material transfer device (MTD), which fed a Blaw-Knox PF3200 rubber tire paver. Use of an infrared camera during construction indicated the MTD was very effective in eliminating temperature and aggregate segregation. All of the test lanes were constructed in two lifts, each 50-mm (2-in.) or 75-mm (3-in.) thick, as appropriate. A 12.3-Mg (13.5-ton) vibratory roller was used for the breakdown, followed by a 9.1-Mg (10-ton) static steel roller for the finish rolling. 12 x 4 m = 48 m 50 m 4 Test Sites for Each Lane
- 4. Qi, Al-Khateeb, and Shenoy Proceedings of the 10th International Conference on Asphalt Pavements (ICAP), Quebec, Canada, August 12-17, 2006 4 An extensive quality control/quality assurance (QA/QC) test program was conducted during the construction of both the crushed aggregate base and the HMA. The detailed testing results have been reported elsewhere (Mitchell et al 2004). 3. ALF AND LABORATORY TESTS 3.1 ALF tests Since each pavement lane has four test sites available, the full-scale pavement testing is being conducted at two failure modes, rutting tests (sites 1 and 2) at 64 and 74 o C (selected lanes), and fatigue cracking tests (sites 3 and 4) at 19 and 28 o C. According to the results of “shakedown” rutting and fatigue cracking tests early in 2003, it was decided that all rutting tests use a wheel load of 44 kN (10,000 lb) without transverse wander while all fatigue tests use a wheel load of 74 kN (16,600 lb) with transverse wander. This will fit the project schedule and provides results in a reasonable length of time. An infrared heating system and thermocouples in the pavements provide the required pavement temperature. During loading, pavement layer rutting data are collected through differential rod and level surveys on eight sets of reference plates installed at the time of construction along the centerline of the test section. The plates are located at the surface of the pavement and on top of the aggregate base in order to measure permanent displacement at these two locations at predetermined ALF loading passes. The difference between these two measurements yields the permanent vertical deformation (rutting) in the asphalt layer. For fatigue test sections, cracks were manually traced onto clear plastic Mylar sheets as they formed at the surface of the pavements. Different color pens were used to correspond to the number of load repetitions. Two approaches were used to process the data. One was to measure the total crack length and the other was to measure the percentage of area cracked in the loaded area. 3.2 Mixture Tests Laboratory performance rutting tests were conducted in the bituminous mixture laboratory (BML) on specimens fabricated from plant-produced loose mix sampled from trucks and then lab-compacted or field cores taken from the ALF pavements. Table 1 summarizes the different laboratory rutting tests conducted in the BML. Laboratory performance fatigue tests were also conducted in the BML. Table 2 describes the different laboratory fatigue tests performed in the BML. 3.3 Binder Tests Binders were sampled from the plant tanks on the day of construction. The type of binder tests and the testing conditions in the Binder Rheology Laboratory (BRL) used in this study are shown in Table 3. 4. ALF TESTING RESULTS 4.1 Rutting Tests The ALF rutting tests conducted at 64 o C and 44 kN load were complete for all 12 lanes. Figure 3 graphically presents the fairly wide range of rutting results in the HMA layer in two
- 5. Qi, Al-Khateeb, and Shenoy Proceedings of the 10th International Conference on Asphalt Pavements (ICAP), Quebec, Canada, August 12-17, 2006 5 groups for the two levels of HMA thickness: 100-mm for Lanes 1 to 7 and 150-mm for Lanes 8 to 12. A statistical analysis was conducted to identify any significant differences among the mean values of rutting at 25,000 ALF passes for each thickness, respectively. This specific Table 1: Summary of Laboratory Mixture Rutting Tests. Type of Rutting Tests Source of Specimens Test Temperature (°C) Testing Mode Loading Frequency (Hz) Material Property Measured Standard(1) French Permanent Rut Plant-Produced Lab-Compacted 74 Reciprocating pneumatic tire 1.1 Hz (speed = 1.1 m/s) Rut Depth NA(2) Hamburg Wheel Tracking Plant-Produced Lab-Compacted 64 Vertical moving load and steel wheel 0.5 Hz (speed = 0.3 m/s) Rut Depth NA Plant-Produced Lab-Compacted 74Repeated Shear at Constant Height Field Cores 64 Haversine shear stress with rest period applied 1.4 Hz (0.1-sec loading and 0.6-sec rest period) Cycles to 2 percent Strain AASHTO TP7 Frequency Sweep at Constant Height Plant-Produced Lab-Compacted 74 Sinusoidal shear strain applied Sweep of 10, 5, 2, 1, 0.5, 0.2, 0.1, 0.05, 0.02, and 0.01 Hz Shear Modulus AASHTO TP7 Flow Number Plant-Produced Lab-Compacted 64 Haversine load with rest period applied 1 Hz (0.1-sec loading followed by a 0.9-sec rest period) Flow Number (Cycles at Tertiary Flow), and Cycles to 2% Strain NCHRP Report 465 Plant-Produced Lab-CompactedDynamic Modulus Field Cores 58 Haversine load applied Sweep of 20, 10, 5, 1, 0.5, and 0.1 Hz Dynamic Modulus and Phase Angle NCHRP Report 465 Resilient Modulus Field Cores 40 Haversine load with rest period applied 1 Hz (0.1-sec loading and 0.9-sec rest period) Resilient Modulus AASHTO TP9 (1) Slight deviations from standards such as temperature were followed. (2) NA = Not Applicable. Table 2: Summary of Laboratory Mixture Fatigue Tests. Type of Fatigue Test Source of Specimens Test Temperature (°C) Testing Mode Loading Frequency (Hz) Material Property Measured Standard Plant- Produced Lab- Compacted Dynamic Modulus Field Cores 19 Haversine load applied Sweep of 20, 10, 5, 1, 0.5, and 0.1 Hz Dynamic Modulus and Phase Angle NCHRP Report 465 Tensile Strength Field Cores 19 Constant ram rate applied NA Tensile Strength and Strain at Failure AASHTO TP9 Bending Beam Fatigue Lab-Produced Lab- Compacted 19 Sinusoidal Strain applied 10 Hz Cycles to 50 percent Stiffness AASHTO TP8 Table 3 Summary of Laboratory Binder Tests Type of Test Experimental Conditions Standard Frequency Sweep, 7°C, 19°C, 25°C, 64°C, 70°C, 76°C AASHTO T315-02Dynamic Shear Rheometer (DSR) Multi-Stress Creep Recovery Test, 64°C NA
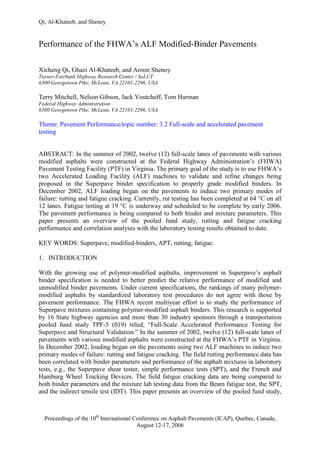
- 6. Qi, Al-Khateeb, and Shenoy Proceedings of the 10th International Conference on Asphalt Pavements (ICAP), Quebec, Canada, August 12-17, 2006 6 number of ALF passes was selected because the rutting measurements at this pass number were available for most of test lanes. The analysis results showed that four significant different groups of rutting exist within 100-mm HMA pavements while only two significantly different groups of rutting within 150-mm HMA pavements. Note that replicate rutting tests were conducted in Lane 9, Site1 and Site 2, with binder SBS 64-40 to see the variation between the replicate tests. Statistical tests on means of rutting from replicate tests showed no significant difference at all ALF load passes. Another interesting finding is that the rutting rankings of Terpolymer binder are just opposite in the two thickness pavements (lanes 6 and 12). These conflicting data are still under investigation. The current hypothesis attributes the poorer performance of Lane 6 to an adverse chemical interaction between the Terpolymer and the hydrated lime added during the mix production to reduce the moisture damage. 0.0 5.0 10.0 15.0 20.0 0 10,000 20,000 30,000 40,000 50,000 60,000 ALF Wheel Loading Pass HMALayerRutting,mm L6S1(Terpolymer) L3S1(Air-Blown) L2S1(70-22) L1S1(AZ-CRM) L4S1(SBS LG) L7S1(Fibers) L5S1(CR-TB) 0.0 5.0 10.0 15.0 20.0 25.0 0 10,000 20,000 30,000 40,000 50,000 60,000 ALF Wheel Loading Pass HMALayerRutting,mm L9S2(SBS 64-40) L9Avg(SBS 64-40) L9S1(SBS 64-40) L8S1(PG 70-22) L10S1(Air-Blown) L11S1(SBS LG) L12S1(Terpolymer) (a) Lanes 1 to 7 with 100-mm Pavements (b) Lanes 9 to 12 with 150-mm Pavements Figure 3: HMA layer rutting data at 64 o C and 44 kN load 4.2 Fatigue Tests The ALF fatigue tests at 19 o C and 74 kN have been completed for all 100-mm HMA pavements and are being conducted for 150-mm HMA pavements. The cumulative crack lengths at various ALF passes are presented in Figure 4 for all 100-mm HMA pavements. The percentage of area cracked was also counted for each lane; the fatigue performance ranking is identical by both crack length and crack area. Since the crack length is more sensitive to the ALF loading passes, it is selected for the following correlation analyses. As expected, a wide range of fatigue performance can be observed from Figure 4. To normalize the data, both the ALF pass at 20 m crack length and the crack length at 100,000 ALF passes were used in correlation analyses. 5. MIXTURE TEST RESULTS AND CORRELATIONS The laboratory rutting and fatigue test results were compared with the ALF test results and are shown in Figure 5. Correlation between the ALF pavement rut depth and the different lab rutting parameters were established. The correlation analysis between ALF rutting and lab French / Hamburg Wheel Tracking devices rutting was also performed although it is not
- 7. Qi, Al-Khateeb, and Shenoy Proceedings of the 10th International Conference on Asphalt Pavements (ICAP), Quebec, Canada, August 12-17, 2006 7 shown in the figure. The French PRT rutting only showed a R2 of 0.47 with ALF rutting for 100-mm HMA pavements and no correlation with 150-mm pavements while Hamburg rutting showed no correlation at all with ALF rutting for each thickness of pavements. Also the ALF wheel passes at 20 m crack length (corresponding to some 20 percent area cracked) as well as the crack length at 100,000 wheel passes were correlated with the lab fatigue 0 20 40 60 80 100 120 0 50,000 100,000 150,000 200,000 250,000 300,000 ALF Wheel Loading Pass CumulativeCrackLength(m) L3S3 (Air Blown) L2S3 (Control) L5S3 (CR-TB) L6S3 (Terpolymer) L4S3 (SBS LG) L7S3 (Fibers) L1S2 (CR-AZ) Figure 4: Fatigue cracking data at 19 o C and 74 kN load for 100-mm HMA pavements parameters. The best lab rutting and fatigue parameters that provide the highest coefficient of determination (R2 ) were selected. 6. BINDER TEST RESULTS AND CORRELATIONS 6.1 Rutting In seeking a correlation of ALF rutting performance to binder data, four parameters were evaluated – (1) The conventional |G*|/sinδ (Bahia and Anderson, 1995), which is the inverse of the loss compliance obtained from the time or frequency sweep, (2) |G*|/(1-1/tanδsinδ) (Shenoy, 2004), which is the inverse of the non-recovered compliance obtained from DSR time or frequency sweep, (3) JNR (D’Angelo and Dongré, 2004), which is the non-recovered compliance obtained from DSR multi-stress creep recovery tests (MSCR), and (4) MVR (Shenoy, 2001), which is the material’s volumetric-flow rate obtained from the flow measuring device (FMD). The comparisons were made with rut depth after 20,000 ALF passes, and the results of the coefficient of determination R2 obtained for a linear fit are shown in Table 4. Table 4 Coefficients of correlation between ALF rutting and binder parameters (a) R2 values |G*|/sinδ at 64°C & ω=10 rads/ |G*|/(1-1/tanδsinδ) at 64°C & ω=0.25 rads/s JNR at 64°C & MSCR 1s/9s, for 25-3200Pa MVR at 64°C & L=1.225kg All Pavements 0.28 0.06 0.03 0.30 Thin Pavements 0.52 0.33 0.09 0.05 Thick Pavements 0.003 0.19 0.0004 0.81 (b)
- 8. Qi, Al-Khateeb, and Shenoy Proceedings of the 10th International Conference on Asphalt Pavements (ICAP), Quebec, Canada, August 12-17, 2006 8 R2 values THS when |G*|/sinδ = 2200 Pa at ω=10 rads/s THS when |G*|/(1-1/tanδsinδ) = 50 Pa at ω=0.25 rads/s THS when MVR = 50 cc/10min at L=1.225kg All Pavements 0.55 0.05 0.04 Thin Pavements 0.47 0.01 0.01 Thick Pavements 0.84 0.17 0.40 y = -0.346 x + 59.2 R2 = 0.86 0.0 5.0 10.0 15.0 20.0 0 50 100 150 200 E*/sinδδδδ at 0.1 Hz and 58°C (MPa) PavementRutDepthat 40,000Passesand64°C(mm) y = - 0.027 x + 19.5 R2 = 0.81 0.0 5.0 10.0 15.0 20.0 0 100 200 300 400 500 FN Cycles to 2% Strain at 64°C PavementRutDepthat 40,000Passesand64°C (mm) y = - 0.001 x + 18.6 R2 = 0.74 0.0 2.0 4.0 6.0 8.0 10.0 12.0 14.0 16.0 18.0 20.0 0 2500 5000 Flow Number at 64°C PavementRutDepthat 40,000Passesand64°C (mm) y = - 0.001 x + 51.0 R2 = 0.84 0.0 5.0 10.0 15.0 20.0 0 20000 40000 60000 FSCH G* (MPa) at 74o C PavementRutDepthat 40,000Passesand64°C (mm) y = -0.004 x + 18.99 R2 = 0.76 0.0 5.0 10.0 15.0 20.0 0 500 1000 1500 2000 RSCH Cycles to Failure at 74°C PavementRutDepthat 40,000Passesand64°C (mm) y = 528 x - 356123 R2 = 0.92 0 100,000 200,000 300,000 400,000 0 500 1000 1500 IDT Tensile Strength at 19°C (kPa) ALFPassesat20m CrackLengthand19°C
- 9. Qi, Al-Khateeb, and Shenoy Proceedings of the 10th International Conference on Asphalt Pavements (ICAP), Quebec, Canada, August 12-17, 2006 9 y = 0.185 x - 84.20 R2 = 0.87 0.0 50.0 100.0 150.0 0 500 1000 1500 E* sinδδδδ at 0.1 Hz and 19°C CrackLengthat100,000ALF Passesand19°C y = -223.47 x + 255539 R2 = 0.72 0 100,000 200,000 300,000 400,000 0 500 1000 1500 E* sinδδδδ at 0.1 Hz and 19°C ALFPassesat20mCrack Lengthand19°C Figure 5: Mixture Rutting and Fatigue Correlations to ALF Rut Depth and Fatigue Cracking 6.2 Fatigue Cracking In seeking a correlation of ALF fatigue cracking performance to binder data, three parameters were evaluated – (1) The conventional |G*|sinδ (Bahia and Anderson, 1995) obtained from the time or frequency sweep at low strains, (2) |G*S|sinδS (Shenoy, 2002) obtained from DSR strain sweep at high strains, (3) EWF (Andriescu et al., 2004), which is the essential work of fracture. EWF is still under investigation as how the tests were performed on PAV binder while RTFOT is more appropriate given the young age of the ALF sections. The comparisons were made with crack lengths (m) at 100K loads and ALF passes at 50m and 20m crack lengths, and the results of the coefficient of determination R2 obtained for a linear fit are shown in Table 5. Table 5 Coefficients of correlation between ALF fatigue cracking and binder parameters (a) R2 values Thin Pavements |G*|sinδ at 19°C, ω=10 rads/s, 0.4% strain, PAV |G*S|sinδ S at 19°C, ω=10 rads/s, 25% strain, RTFOT EWF (kJ/m2 ) at 25°C, RTFOT Crack Length (m) at 100K Loads 0.56 0.61 0.01 ALF Passes at 50m Crack Length 0.47 0.50 0.06 ALF Passes at 20m Crack Length 0.43 0.44 0.09 (b) R2 values Thin Pavements TIS when |G*|sinδ = 5 MPa at ω=10 rads/s, 0.4% strain, PAV TIS = TEsinδ where TE is when |G*S| = 1 MPa at ω=10 rads/s, 25% strain, RTFOT Crack Length (m) at 100K Loads 0.71 0.78 ALF Passes at 50m Crack Length 0.50 0.59 ALF Passes at 20m Crack Length 0.47 0.54 7. SUMMARY AND CONCLUSIONS ● ALF loading on 12 full-scale lanes of pavements has generated a bank of field performance data on a series of modified asphalt binders. Although the as-built PG grades at high temperature are very close for all binders (except for the CR-TB binder), a wide range of rutting performance has been found for the 100-mm HMA pavements. The intermediate temperature binder properties were significantly different and the pavement fatigue performance also showed wide variations. These
- 10. Qi, Al-Khateeb, and Shenoy Proceedings of the 10th International Conference on Asphalt Pavements (ICAP), Quebec, Canada, August 12-17, 2006 10 performance data provide a good test for checking the ability of the laboratory mix testing and binder specifications to rate the binders according to the rutting and fatigue performances. ● ALF performance and laboratory mixture test results were compared. An analysis reveals that several laboratory mix tests are very promising to highly correlate to the ALF pavement performance. The shear modulus from the SST frequency sweep at constant height test provides a high correlation with the ALF pavement rutting. The strength from indirect tensile tests was highly correlated to the ALF pavement fatigue cracking. The mixture parameters from the dynamic modulus tests were correlated to both the ALF rutting and fatigue performance. From these findings, both the SST shear modulus test and dynamic modulus test have been selected to further evaluate a much wider range of high temperature PG grade of modified binders, which will provide extensive data to develop the refined binder specifications. ● A comprehensive correlation analysis was also conducted between the ALF testing results and the selected binder parameters. The correlations for the high temperature binder parameters were strongly dependent on the HMA thickness. Moderate correlations were found between ALF fatigue cracking and the intermediate temperature binder parameters. These binder parameters will be fully evaluated when the extensive laboratory mixture characterizations are completed. ACKNOWLEDGMENTS The work presented here was conducted as part of national pooled fund study TPF-5(019), which is partially funded by 15 State highway agencies (CT, FL, IL, IN, KS, MD, MI, MS, MT, NE, NV, NJ, NM, NY, and TX) with materials provided by the asphalt industry; funds are also provided by the FHWA, and the study is staffed by FHWA and its contractors. REFERENCES AASHTO TP7-01, 2001. Standard Test Method for Determining the Permanent Shear Strain and Stiffness of Asphalt Mixtures Using the Superpave Shear Tester (SST). AASHTO Provisional Standards, Interim Edition, American Association of State Highway and Transportation Officials, Washington D. C. AASHTO TP8-94, 2002. Method for Determining the Fatigue Life of Compacted Hot-Mix Asphalt (HMA) Subjected to Repeated Flexural Bending, AASHTO Provisional Standards, American Association of State Highway and Transportation Officials, Washington D. C. AASHTO TP9-96, 2002. Method for Determining the Creep Compliance and Strength of Hot Mix Asphalt (HMA) Using the Indirect Tensile Test Device, AASHTO Provisional Standards, American Association of State Highway and Transportation Officials, Washington D. C. AASHTO T315-02, 2002. Determining the Rheological Properties of Asphalt Binder Using A Dynamic Shear Rheometer (DSR). American Association of State Highway and Transportation Officials, Washington, D. C. Andriescu, A., Hesp, S. A. M. and Youtcheff, J. S., 2004. Essential and Plastic Works of Ductile Fracture in Asphalt Binders. Transportation Research Record 1875, pp. 1-8. Bahia, H. U. and Anderson, D. A., 1995. The New Proposed Rheological Properties: Why Are They Required and How Do They Compare to Conventional Properties, Physical Properties of Asphalt Cement Binder, American Society for Testing and Materials, Hardin, J. C. (Ed.), pp. 1-27.
- 11. Qi, Al-Khateeb, and Shenoy Proceedings of the 10th International Conference on Asphalt Pavements (ICAP), Quebec, Canada, August 12-17, 2006 11 D’Angelo, John and Dongré, Raj, 2004. Multi-Stress Creep Recovery: A New Approach to the Refinement of High Temperature Binder Specification. 41st Annual Meeting of the Petersen Asphalt Research Conference, Cheyenne, WY. Mitchell, T., Stuart, K., Qi, X., Al-Khateeb, G., Youtcheff, J., and Harman, T., 2004. ALF Testing for Development of Improved Superpave Binder Specification. Proceedings of the 2nd International Conference on Accelerated Pavement Testing, Minnesota, USA Shenoy, Aroon, 2001. High Temperature Performance Grade Specification of Asphalt Binder from the Material’s Volumetric-flow Rate. Materials and Structures, Vol. 34, pp. 629-635. Shenoy, Aroon, 2002. Fatigue Testing and Evaluation of Asphalt Binders using the Dynamic Shear Rheometer. ASTM Journal of Testing and Evaluation, Vol. 30(4), pp. 303-312. Shenoy, Aroon, 2004. A Comprehensive Treatise of The High Temperature Specification Parameter |G*|/(1-(1/tanδsinδ)) for Performance Grading of Asphalts, Applied Rheology, Vol. 14(6), pp. 303-314. Witczak, M., Kaloush, K., Pellinen, T., El-Basyouny, M. and Quintus, H. V., 2002. Simple Performance Test for Superpave Mix Design, NCHRP Report 465, National Research Council, Washington, D.C.