Download as PDF, PPTX

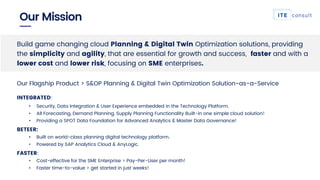
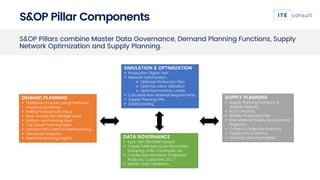
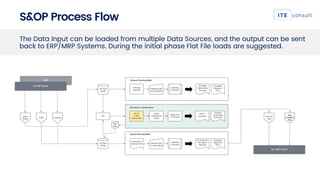
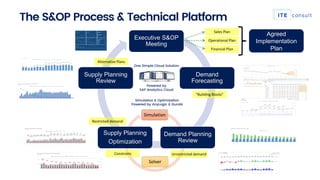


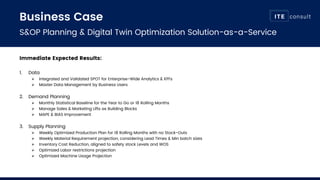
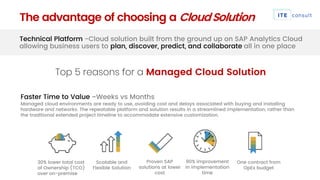


The document outlines a cloud-based solution for Sales and Operations Planning (S&OP) and digital twin optimization, emphasizing its simplicity and agility for small to medium enterprises. It highlights key features such as integrated forecasting, demand and supply planning, and advanced analytics through a subscription-based model. The solution aims to reduce costs and risks while providing faster implementation and enhanced user experience in enterprise planning.


