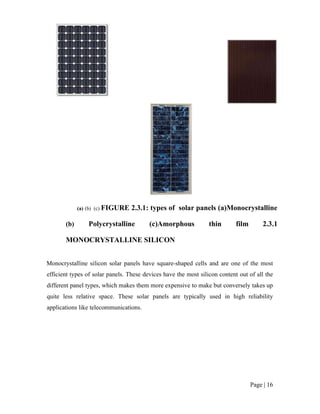
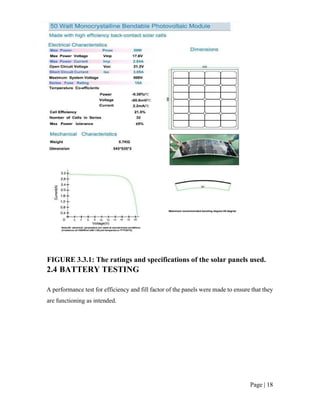
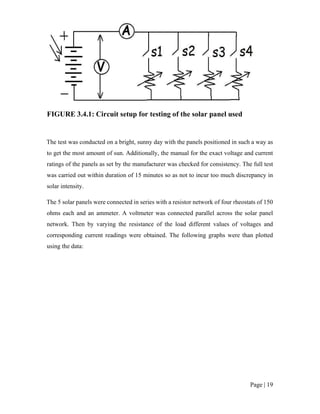
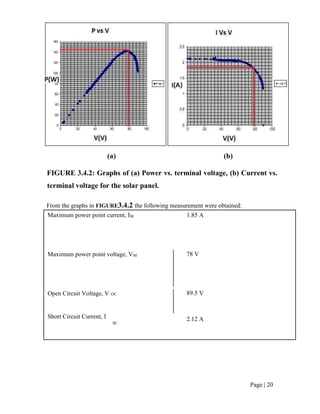
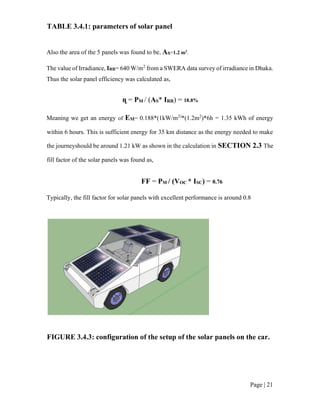
This document provides details about testing a solar panel that will power an electric vehicle. It begins with an introduction to solar panels and how they work, then describes different types of solar panels. It shows the specific 50W flexible solar panel used for testing and provides its specifications. The document outlines how the panel was tested by measuring its output power and current at different terminal voltages. Finally, it displays the results of the testing in graphs and discusses how multiple panels will be configured on the vehicle.

![Page | 10
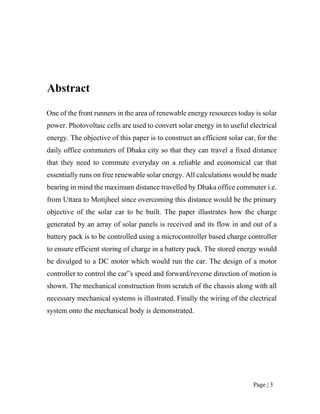
FIGURE 2.2.1: Coefficient of drag of different vehicle shapes
The drag force becomes increasingly noticeable at speeds of above 40 km/h due to it being
proportional to the square of the speed. Because batteries provide only 1% as much power
per weight as gasoline, optimizing for either high-speed or long-range performance goals,
requires that one keeps this critical performance factor foremost in mind. As it is noticeable
from FIGURE 2.2.1 the more streamlined the shape of the car the lower is cD. It is
estimated that for conventional car designs, the body‟s rear area contributes more than 33%
of cD by itself, followed by the wheel wells at 2%, the underbody area at 14%, the front
body area at 12%, projections(minors, drip rails, window recesses etc.) at 7%, and engine
compartment and skin friction at 6% each.
1.4.3 FORCE OF ACCELERATION
The force of acceleration should be only accounted for when the car is accelerating and is
given by newton‟s 2nd
law of motion
FACCELERATION= [m*a]](https://image.slidesharecdn.com/solarcarreport-211229163646/85/Solar-car-report-10-320.jpg)
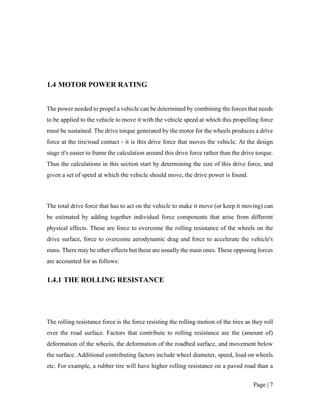
![Page | 11
Where m is the mass of the car and a is the acceleration.
The total driving force thus required to overcome the sum of these opposing forces to move
the car is,
FT= FROLLING + FDRAG + FAC
= [µR*W] + [(1/2)*cD*Across*ρ*(V)2
] + [m*a]
Weight, W= mg 500 kg * 9.81 ms-2
Top speed, VMAX
Coefficient of rolling resistance, µR
Coefficient of drag, cD
Frontal area, ACROSS
Mass density of air, ρ
60 km/h = 16.7 ms-1
0.01
0.35
1 m *1.1 m
1.2 kgm-3
Table 2.2.2: parameters for calculation of motor power
At the design stage the following necessary assumptions of what the most probable values
of the above parameters might be was made as given below in Table 2.2.2
The power needed to be supplied by the motor in order to provide the current speed and
acceleration will therefore be,
PT = FT* V](https://image.slidesharecdn.com/solarcarreport-211229163646/85/Solar-car-report-11-320.jpg)
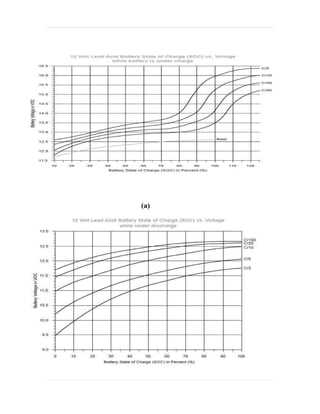
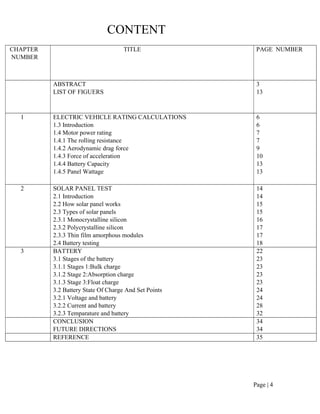
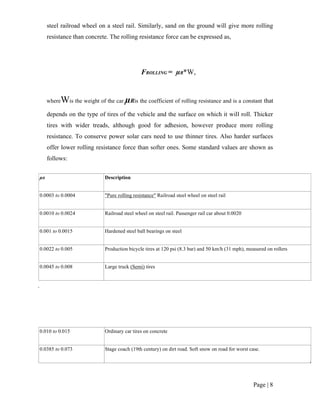
![Page | 32
(b) FIGURE 4.2.4: Standardized [(a) Charging &
(b) Discharging] voltage vs. SOC graphs of a typical
12 Volt lead-acid battery displaying characteristic
changes with different charging/discharging rates
C/XX (where C= battery capacity)
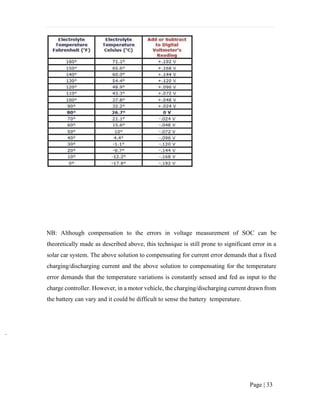
3.2.3 TEMPARATURE AND BATTERY:
The lead-acid cell reaction is sensitive to temperature as well. Cooling the cell changes its
voltage vs. SOC profile. This is due to its decrease in internal resistance with temperature.
This means that voltage elevation under recharging is increased in cold cells. Similarly, an
increased voltage depression in cold cells when discharged is also observed. FIGURE
4.4.5 illustrates a table depicting the dependency of standard 12 V lead-acid batteries on
temperature. Knowing the standard characteristic would allow for compensation in voltage
measurement of SOC.](https://image.slidesharecdn.com/solarcarreport-211229163646/85/Solar-car-report-32-320.jpg)


![74676371-Coagulation-and-Flocculation[1].ppt](https://cdn.slidesharecdn.com/ss_thumbnails/74676371-coagulation-and-flocculation1-260116154109-a3cbf55e-thumbnail.jpg?width=640&height=640&fit=bounds)


