soil erosion MODEL for computing soil erosion.pptx
1.
DEPARTMENT OF FARMENGINEEERING
INSTITUTE OFAGRICULTURAL SCIENCES
BANARAS HINDU UNIVERSITY
VARANASI
PRESENTED BY
SNEHIL
ID. PF-24011
WATER EROSION PREDICTION PROJECT
2.
WEPP MODEL
TheWEPP watershed model is a process-based, continuous simulation erosion prediction model built as an
extension of the WEPP hillslope model.
Developed by USDA as a next-generation process-based soil erosion prediction model.
Based on fundamentals of infiltration theory,hydrology,soil physics,plant science, hydraulics and erosion
mechanics.
The WEPP erosion model computes soil loss along a slope and sediment yield at the end of a hill slope.
Estimates spatial and temporal distribution of soil loss (daily, monthly, or annual)
Applicable for Conservation planning,Project-level design and evaluation,Soil erosion inventory and
assessment
3.
Continuation
Simulates keyprocesses such as:
i. Rill and interrill erosion.
ii. Sediment transport and deposition.
iii. Infiltration, runoff, and soil consolidation.
iv. Plant growth, residue effects, tillage operations, and soil roughness.
v. Snowmelt, frozen soil processes, and surface sealing.
Allows routing of water and sediment through channels and impoundments.
Supports evaluation of sediment control structures (ponds, terraces, check dams, etc.)
Useful for soil conservation planning, erosion assessment, and land management
decisions.
Interrill and rill erosion processes are considered,and it uses a steady-state sediment
continuity equation as a basis for the erosion computations.
4.
WEPP Model scopeand limitations:
Applicable in areas dominated by overland flow.
Does not simulate classical gully erosion.
Applicability depends on topography and land use influencing channel
density.
SOFTWARE CHARACTERISTICS:-
Designed to run on personal computers.
Allows quick evaluation of alternative management scenarios
WEPP predicts:
Soil loss along a hillslope
Sediment yield at the hillslope outlet
Continuation
5.
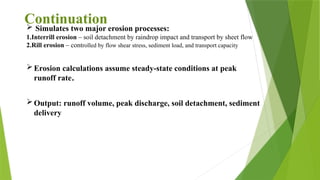
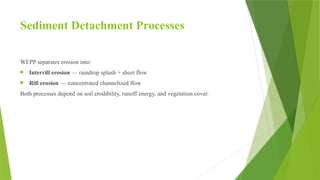
Simulates twomajor erosion processes:
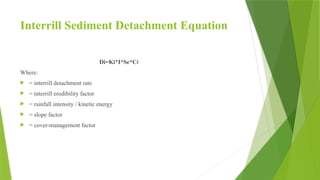
1.Interrill erosion – soil detachment by raindrop impact and transport by sheet flow
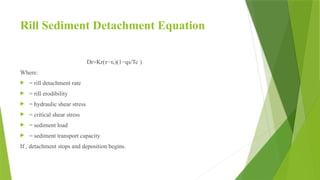
2.Rill erosion – controlled by flow shear stress, sediment load, and transport capacity
Erosion calculations assume steady-state conditions at peak
runoff rate.
Output: runoff volume, peak discharge, soil detachment, sediment
delivery
Continuation
6.
Continuation
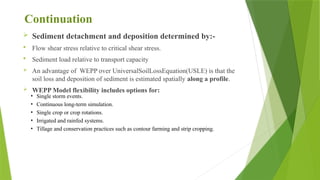
Sediment detachmentand deposition determined by:-
Flow shear stress relative to critical shear stress.
Sediment load relative to transport capacity
An advantage of WEPP over UniversalSoilLossEquation(USLE) is that the
soil loss and deposition of sediment is estimated spatially along a profile.
WEPP Model flexibility includes options for:
• Single storm events.
• Continuous long-term simulation.
• Single crop or crop rotations.
• Irrigated and rainfed systems.
• Tillage and conservation practices such as contour farming and strip cropping.
7.
WEPP Model Components
WEPPconsists of 9 integrated simulation components, including:-
Climate generation
Winter processes (Frozen soil processes, Snow accumulation and melt)
Irrigation simulation
Infiltration and overland flow hydraulics.
Water balance and hydrology
Plant growth modelling
Residue decomposition
Soil disturbance from tillage (Soil consolidation)
Erosion and deposition processes
8.
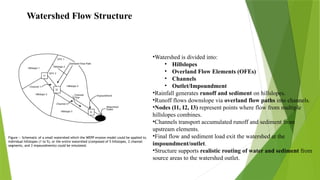
•Watershed is dividedinto:
• Hillslopes
• Overland Flow Elements (OFEs)
• Channels
• Outlet/Impoundment
•Rainfall generates runoff and sediment on hillslopes.
•Runoff flows downslope via overland flow paths into channels.
•Nodes (I1, I2, I3) represent points where flow from multiple
hillslopes combines.
•Channels transport accumulated runoff and sediment from
upstream elements.
•Final flow and sediment load exit the watershed at the
impoundment/outlet.
•Structure supports realistic routing of water and sediment from
source areas to the watershed outlet.
Watershed Flow Structure
Figure :- Schematic of a small watershed which the WEPP erosion model could be applied to.
Individual hillslopes (1 to 5), or the entire watershed (composed of 5 hillslopes, 2 channel
segments, and 3 impoundments) could be simulated.
9.
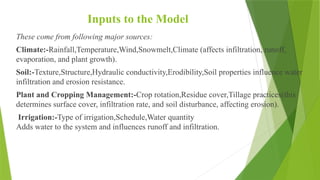
Inputs to theModel
These come from following major sources:
Climate:-Rainfall,Temperature,Wind,Snowmelt,Climate (affects infiltration, runoff,
evaporation, and plant growth).
Soil:-Texture,Structure,Hydraulic conductivity,Erodibility,Soil properties influence water
infiltration and erosion resistance.
Plant and Cropping Management:-Crop rotation,Residue cover,Tillage practices(this
determines surface cover, infiltration rate, and soil disturbance, affecting erosion).
Irrigation:-Type of irrigation,Schedule,Water quantity
Adds water to the system and influences runoff and infiltration.
10.
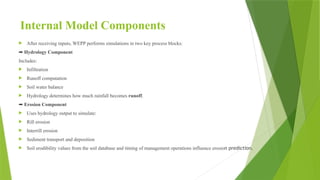
Internal Model Components
After receiving inputs, WEPP performs simulations in two key process blocks:
➡ Hydrology Component
Includes:
Infiltration
Runoff computation
Soil water balance
Hydrology determines how much rainfall becomes runoff.
➡ Erosion Component
Uses hydrology output to simulate:
Rill erosion
Interrill erosion
Sediment transport and deposition
Soil erodibility values from the soil database and timing of management operations influence erosion prediction.
11.
Model Feedback Loops
Soil and plant management change over time → modifies infiltration and erodibility
Hydrology outputs → influence erosion rate
Erosion processes → depend on sediment supply and transport capacity
This allows WEPP to simulate erosion dynamically over time, not just event-based.
12.
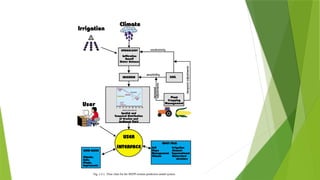
User Interaction System
•Usersenter input files (soil, slope, climate, management, irrigation, channel, watershed
structure).
•WEPP retrieves additional info from internal databases.
•Model processes data and generates spatial and temporal erosion and sediment yield
outputs.
13.
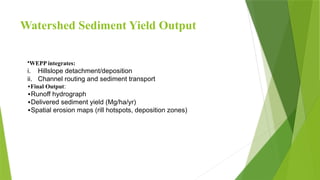
Final Output
Spatialand temporal distribution of erosion and sediment yield
The model provides:
Maps of erosion hotspots
Sediment yield at watershed outlet
Runoff pattern over time
15.
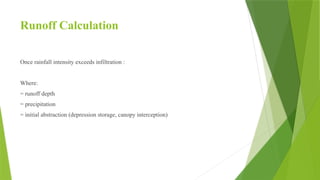
Runoff Framework
Runoffoccurs when precipitation exceeds infiltration.
Uses modified Green–Ampt Mein-Larson infiltration equation.
Accounts for land cover, soil moisture, slope & management practice.
Runoff is based on:
Rainfall intensity distribution
Infiltration
Soil hydraulic properties
WEPP uses a continuous simulation approach.