Ride the Storm: Navigating Through Unstable Periods / Katerina Rudko (Belka G...
SMP COMBINED MAPS-lowres
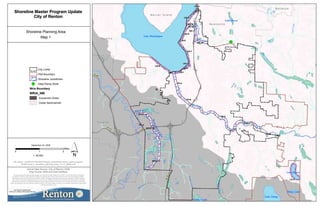
1. M
ayCreek
Black R iver
SpringbrookCreek
CR-C
CR-A
BRSC-C
MC-D
LD-A
BRSC-A
CR-B
LW-K
LW-C
MC-C
LW-F
LW-I
MC-A
LW-D
LW-G
LW-E
MC-B
LW-B
LW-A
BRSC-B
LW-H
CR-D
LW-J
GR-A
CR-D
CedarRiver
GreenRiver
May Creek
T u k w i l aT u k w i l a
S e a t t l eS e a t t l e
K e n tK e n t
N e w c a s t l eN e w c a s t l e
M e r c e r I s l a n dM e r c e r I s l a n d
B e l l e v u eB e l l e v u e
Lake Washington
Lake Young
Lake Desire
Shady Lake
Panther Lake
Lake Boren
Cedar River
M
ayCreek
PantherCreek
BigSoosCreek
Mill Creek
CoalCreek
0276A
0276B
I-405
SR167
I-5
SR 599
SR 518
I-405
File Name: :HCEDPLANNINGGISgis_projectsshoreline_mgmt_program
6SMPmxds1_shoreline_planning_area_11x17_0909.mxd
Shoreline Planning Area
Map 1
Actual Data Source: City of Renton 2009,
King County 2009 and ESA Adolfson.
City Limits
PAA Boundary
Shoreline Jurisdiction
Data Points 20cfs
Wria Boundary
WRIA_NM
Duwamish-Green
Cedar-Sammamish
Shoreline Master Program Update
City of Renton
0 21
Miles
September 24, 2009
1: 50,000
This map depicts the approximate location and extent of areas subject to the SMP. The actual extent of shoreline
jurisdiction requires a site-specific valuation to indentify the ordinary high water line and any associated wetlands.
The location of the 20 cfs limit is from USGS (1998). Floodplain and floodway extent are based on FEMA mapping
and Lower Green River Mapping Study by King County. Wetland locations are approximate and based on existing
city/regional inventories; additional wetlands may be present that are not shown on the maps and some of the areas
shown as wetlands may not meet the wetland criteria. This map makes no claim as to whether wetlands are associated
with the shoreline or not.
2. M
ayCreek
Black R iver
SpringbrookCreek
CR-C
CR-D
CR-A
BRSC-C
MC-D
LD-A
BRSC-A
CR-B
LW-K
LW-C
MC-C
LW-F
LW-I
MC-A
LW-D
LW-G
LW-E
MC-B
LW-B
LW-A
BRSC-B
LW-H
CR-D
LW-J
GR-A
CR-D
CedarRiver
GreenRiver
PantherCreek
MillCreek
MadsenCreek
CoalCreek
SpringbrookCreek
BigSoosCreek
MayCreek
GypsyCreek
Maplewood Creek
Honey Creek
KennydaleCreek
MolassesCreek
GingerCreek
Coal Creek Tributary
RollingHillsCreek
JohnsCreek
RollingHillsCreek
MolassesCreek
RollingHillsCreek
MadsenCreek
CoalCreek
MolassesCreek
HoneyCreek
PantherCreek
MadsenCreek
Lake Washington
Lake Young
Lake Desire
Shady Lake
Panther Lake
Lake Boren
May Creek
Lower Cedar River
Black River
Duwamish River
Soos Creek
Lower Green River - West
West Lake Washington - Seattle South
Coal Creek (Cedar)Mercer Island
East Lake Washington - Renton
Water - Lake Washington
Des Moines Creek
East Lake Washington - Bellevue South
Tibbetts Creek
Tibbetts Creek
West Lake Sammamish
File Name: :HCEDPLANNINGGISgis_projectsshoreline_mgmt_program
6SMPmxds3A_hydrology_11x17_0909.mxd
Water Bodies and Wetlands
Map 3-A
Actual Data Source: City of Renton 2009,
King County 2009 and ESA Adolfson.
Black River/Springbrook Creek Reaches
Cedar River Reaches
Green River Reaches
Lake Desire Reaches
Lake Washington Reaches
May Creek Reaches
City Limits
PAA Boundary
Flood Control Facility
Wetlands Inventory
Hydrobasin Name
BASIN_NAME
Black River
Coal Creek (Cedar)
Duwamish River
East Lake Washington - Bellevue South
East Lake Washington - Renton
Lower Cedar River
Lower Green River - East
Lower Green River - West
May Creek
Mercer Island
Middle Green River
Soos Creek
Water - Lake Washington
Water - Lake Young
West Lake Sammamish
West Lake Washington - Seattle South
Shoreline Master Program Update
City of Renton
0 21
Miles
September 24, 2009
1: 50,000
This map depicts the approximate location and extent of areas subject to the SMP. The actual extent of shoreline
jurisdiction requires a site-specific valuation to indentify the ordinary high water line and any associated wetlands. The
location of the 20 cfs limit is from USGS (1998). Floodplain and floodway extent are based on FEMA mapping and
Lower Green River Mapping Study by King County. Wetland locations are approximate and based on existing city/
regional inventories; additional wetlands may be present that are not shown on the maps and some of the areas shown
as wetlands may not meet the wetland criteria. This map makes no claim as to whether wetlands are associated with
the shoreline or not.
3. M
ayCreek
Black R iver
SpringbrookCreek
CR-C
CR-D
CR-A
BRSC-C
MC-D
LD-A
BRSC-A
CR-B
LW-K
LW-C
MC-C
LW-F
LW-I
MC-A
LW-D
LW-G
LW-E
MC-B
LW-B
BRSC-B
LW-A
LW-H
CR-D
LW-J
GR-A
CR-D
GreenRiver
CedarRiver
May Creek
PantherCreek
MillCreek
MadsenCreek
CoalCreek
SpringbrookCreek
BigSoosCreek
GypsyCreek
Maplewood Creek
Honey Creek
KennydaleCreek
MolassesCreek
GingerCreek
Coal Creek Tributary
RollingHillsCreek
JohnsCreek
RollingHillsCreek
CoalCreek
PantherCreek
MadsenCreek
RollingHillsCreek
MolassesCreek
HoneyCreek
MadsenCreek
T u k w i l aT u k w i l a
K e n tK e n t
S e a t t l eS e a t t l e
N e w c a s t l eN e w c a s t l e
M e r c e r I s l a n dM e r c e r I s l a n d
B e l l e v u eB e l l e v u e
Lake Washington
Lake Young
Lake Desire
Shady Lake
Panther Lake
Lake Boren
Cedar River
File Name: :HCEDPLANNINGGISgis_projectsshoreline_mgmt_program
6SMPmxds3B_topography_water_bodies_and_wetlands_11x17_0909.mxd
Topography, Water Bodies and Wetlands
Map 3-B
Actual Data Source: City of Renton 2009,
King County 2009 and ESA Adolfson.
City Limits
PAA Boundary
Wetlands Inventory
Hillshade
Value
High :500
Low :0
Black River/Springbrook Creek Reaches
Cedar River Reaches
Green River Reaches
Lake Desire Reaches
Lake Washington Reaches
May Creek Reaches
Shoreline Master Program Update
City of Renton
0 21
Miles
September 15, 2009
1: 50,000
This map depicts the approximate location and extent of areas subject to the SMP. The actual extent of shoreline
jurisdiction requires a site-specific valuation to indentify the ordinary high water line and any associated wetlands.
The location of the 20 cfs limit is from USGS (1998). Floodplain and floodway extent are based on FEMA mapping
and Lower Green River Mapping Study by King County. Wetland locations are approximate and based on existing
city/regional inventories; additional wetlands may be present that are not shown on the maps and some of the areas
shown as wetlands may not meet the wetland criteria. This map makes no claim as to whether wetlands are associated
with the shoreline or not.
4. M
ayCreek
Black R iver
SpringbrookCreek
CR-C
CR-D
CR-A
BRSC-C
MC-D
LD-A
BRSC-A
CR-B
LW-K
LW-C
MC-C
LW-F
LW-I
MC-A
LW-D
LW-G
LW-E
MC-B
LW-B
BRSC-B
LW-A
LW-H
CR-D
LW-J
GR-A
CR-D
I-5
I-405
SR167
SR 518 I-405
T u k w i l aT u k w i l a
K e n tK e n t
S e a t t l eS e a t t l e
N e w c a s t l eN e w c a s t l e
M e r c e r I s l a n dM e r c e r I s l a n d
B e l l e v u eB e l l e v u e
Lake Washington
Lake Young
Lake Desire
Shady Lake
Panther Lake
Lake Boren
Cedar River
File Name: :HCEDPLANNINGGISgis_projectsshoreline_mgmt_program
6SMPmxds4A_landslide_erosion_and_seismic_hazard_areas_11x17_0909.mxd
Landslide, Erosion and Seismic Hazard Areas
Map 4-A
Actual Data Source: City of Renton 2009,
King County 2009 and ESA Adolfson.
Black River/Springbrook Creek Reaches
Cedar River Reaches
Green River Reaches
Lake Desire Reaches
Lake Washington Reaches
May Creek Reaches
Landslide Area
Severity
VERY_HIGH
HIGH
MODERATE
UNCLASSIFED
Erosion
Severity
HIGH
Seismic Hazard
City Limits
PAA Boundary
Shoreline Master Program Update
City of Renton
0 21
Miles
September 15, 2009
1: 50,000
This map depicts the approximate location and extent of areas subject to the SMP. The actual extent of shoreline
jurisdiction requires a site-specific valuation to indentify the ordinary high water line and any associated wetlands.
The location of the 20 cfs limit is from USGS (1998). Floodplain and floodway extent are based on FEMA mapping
and Lower Green River Mapping Study by King County. Wetland locations are approximate and based on existing
city/regional inventories; additional wetlands may be present that are not shown on the maps and some of the areas
shown as wetlands may not meet the wetland criteria. This map makes no claim as to whether wetlands are associated
with the shoreline or not.
5. M
ayCreek
Black R iver
SpringbrookCreek
CR-C
CR-D
CR-A
BRSC-C
MC-D
LD-A
BRSC-A
CR-B
LW-K
LW-C
MC-C
LW-F
LW-I
MC-A
LW-D
LW-G
LW-E
MC-B
LW-B
LW-A
BRSC-B
LW-H
CR-D
LW-J
GR-A
CR-D
Qa
Qgt
wtr
Evc(t)
Qgo
Qp
Qgpc
Qga
Qc
Ec(2r)
Qgl
OEn
Qf
Qgp
Oian
Qls
Qgd
Qgu
Qb
OEm
Ec(2t)
Qgp(s)
Em(2)
GreenRiver
CedarRiver
MayCreek
PantherCreek
MillCreek
CoalCreek
MadsenCreek
BigSoosCreek
SpringbrookCreek
GypsyCreek
GarrisonCreek
Maplewood Creek
Honey Creek
KennydaleCreek
MolassesCreek
GingerCreek
Coal Creek Tributary
RollingHillsCreek
JohnsCreek
RollingHillsCreek
MolassesCreek
RollingHillsCreek
PantherCreek
CoalCreek
MolassesCreek
MadsenCreek
HoneyCreek
MadsenCreek
I-5
I-405
SR167
SR
599
SR 518
I-405
Lake Washington
Lake Young
Lake Desire
Panther Lake
Shady Lake
Lake Boren
Cedar River
File Name: :HCEDPLANNINGGISgis_projectsshoreline_mgmt_program
6SMPmxds4B_surficial_geology_11x17_0909.mxd
Surficial Geology
Map 4-B
Actual Data Source: City of Renton 2009,
King County 2009 and ESA Adolfson.
City Limits
PAA Boundary
Black River/Springbrook Creek Reaches
Cedar River Reaches
Green River Reaches
Lake Desire Reaches
Lake Washington Reaches
May Creek Reaches
Lithology - Geologoy Units - Ages
GUNIT_TXT, AGE1, LITHOLOGY1
Ec(2pg), ,
Ec(2r), Eocene, continental sedimentary deposits or rocks
Ec(2t), Eocene, continental sedimentary deposits or rocks
Eian, ,
Em(2), ,
Evc(t), Eocene, volcaniclastic deposits or rocks
Mvc(2), ,
OEm, Oligocene-Eocene, marine sedimentary rocks
OEn, ,
OEva, ,
Oian, Oligocene, intrusive andesite
Qa, Quaternary, alluvium
Qb, ,
Qc, ,
Qf, Holocene, artificial fill, including modified land
Qga, Pleistocene, advance continental glacial outwash, Fraser-age
Qgd, ,
Qgl, ,
Qgo, Pleistocene, continental glacial outwash, Fraser-age
Qgp(s), ,
Qgp, ,
Qgpc, Pleistocene, continental glacial drift, pre-Fraser, and nonglacial deposits
Qgt, Pleistocene, continental glacial till, Fraser-age
Qgu, ,
Qls, Holocene-Pleistocene, mass-wasting deposits, mostly landslides
Qp, Holocene, peat deposits
wtr, Water
Shoreline Master Program Update
City of Renton
0 21
Miles
September 16, 2009
1: 50,000
This map depicts the approximate location and extent of areas subject to the SMP. The actual extent of shoreline
jurisdiction requires a site-specific valuation to indentify the ordinary high water line and any associated wetlands.
The location of the 20 cfs limit is from USGS (1998). Floodplain and floodway extent are based on FEMA mapping
and Lower Green River Mapping Study by King County. Wetland locations are approximate and based on existing
city/regional inventories; additional wetlands may be present that are not shown on the maps and some of the areas
shown as wetlands may not meet the wetland criteria. This map makes no claim as to whether wetlands are associated
with the shoreline or not.
6. M
ayCreek
Black R iver
SpringbrookCreek
CR-C
CR-D
CR-A
BRSC-C
MC-D
LD-A
BRSC-A
CR-B
LW-K
LW-C
MC-C
LW-F
LW-I
MC-A
LW-D
LW-G
LW-E
MC-B
LW-B
BRSC-B
LW-A
LW-H
CR-D
LW-J
GR-A
CR-D
CedarRiver
GreenRiver
May Creek
PantherCreek
MillCreek
MadsenCreek
CoalCreek
SpringbrookCreek
BigSoosCreek
GypsyCreek
Maplewood Creek
Honey Creek
KennydaleCreek
MolassesCreek
GingerCreek
Coal Creek Tributary
RollingHillsCreek
JohnsCreek
RollingHillsCreek
MolassesCreek
JohnsCreek
CoalCreek
MadsenCreek
MolassesCreek
MadsenCreek
HoneyCreek
RollingHillsCreek
PantherCreek
I-405
SR167
SR
599
SR 518 SR
518
T u k w i l aT u k w i l a
K e n tK e n t
S e a t t l eS e a t t l e
N e w c a s t l eN e w c a s t l e
M e r c e r I s l a n dM e r c e r I s l a n d
B e l l e v u eB e l l e v u e
Lake Washington
Lake Young
Lake Desire
Shady Lake
Panther Lake
Lake Boren
Cedar River
File Name: :HCEDPLANNINGGISgis_projectsshoreline_mgmt_program
6SMPmxds4C_critical_aquifier_recharge_area_11x17_0909.mxd
Critical Aquifer Recharge Area
Map 4-C
Actual Data Source: City of Renton 2009,
King County 2009 and ESA Adolfson.
City Limits
PAA Boundary
Black River/Springbrook Creek Reaches
Cedar River Reaches
Green River Reaches
Lake Desire Reaches
Lake Washington Reaches
May Creek Reaches
Critical Aquifer Recharge Area
CAT_CODE
1
2
3
Wria Boundary
Duwamish-Green
Cedar-Sammamish
Shoreline Master Program Update
City of Renton
0 21
Miles
September 16, 2009
1: 50,000
This map depicts the approximate location and extent of areas subject to the SMP. The actual extent of shoreline
jurisdiction requires a site-specific valuation to indentify the ordinary high water line and any associated wetlands.
The location of the 20 cfs limit is from USGS (1998). Floodplain and floodway extent are based on FEMA mapping
and Lower Green River Mapping Study by King County. Wetland locations are approximate and based on existing
city/regional inventories; additional wetlands may be present that are not shown on the maps and some of the areas
shown as wetlands may not meet the wetland criteria. This map makes no claim as to whether wetlands are associated
with the shoreline or not.
7. M
ayCreek
Black R iver
SpringbrookCreek
CR-C
CR-D
CR-A
BRSC-C
MC-D
LD-A
BRSC-A
CR-B
LW-K
LW-C
MC-C
LW-F
LW-I
MC-A
LW-D
LW-G
LW-E
MC-B
LW-B
BRSC-B
LW-A
LW-H
CR-D
LW-J
GR-A
CR-D
Ced
a
r Rive r
Gre
en Riv er
M
ay C
reek
PantherCreek
MillCreek
MadsenCreek
CoalCreek
SpringbrookCreek
ish Rive
r
BigSoos
Creek
GypsyCreek
Maplewood Cre
ek
Honey Creek
KennydaleCreek
M
olass
esCreek
GingerCreek
Coal Creek Tributary
RollingHillsCreek
JohnsCreek
RollingHillsCreek
MolassesCreek
Coal Creek
Maple wood Creek
Madse
n Cr
eek
M
olassesCr
ee
k
Hon
eyCreek
Molasses Creek
M
adsenCreek
RollingH
ills Creek
PantherCreek
GingerCreek
I-5
I-405
SR167
SR
599
SR 518 I-405
I-5
T u k w i l aT u k w i l a
K e n tK e n t
S e a t t l eS e a t t l e
N e w c a s t l eN e w c a s t l e
M e r c e r I s l a n dM e r c e r I s l a n d
B e l l e v u eB e l l e v u e
Lake Washington
Lake Young
Lake Desire
Shady Lake
Panther Lake
Lake Boren
Cedar River
File Name: :HCEDPLANNINGGISgis_projectsshoreline_mgmt_program
6SMPmxds4D_city_wide_fema_flood_hazard_11x17_0909.mxd
Fema Floodplain
Map 4-D
Actual Data Source: City of Renton 2009,
King County 2009 and ESA Adolfson.
City Limits
PAA Boundary
Black River/Springbrook Creek Reaches
Cedar River Reaches
Green River Reaches
Lake Desire Reaches
Lake Washington Reaches
May Creek Reaches
Floodplain
Shoreline Master Program Update
City of Renton
0 21
Miles
September 24, 2009
1: 50,000
This map depicts the approximate location and extent of areas subject to the SMP. The actual extent of shoreline
jurisdiction requires a site-specific valuation to indentify the ordinary high water line and any associated wetlands.
The location of the 20 cfs limit is from USGS (1998). Floodplain and floodway extent are based on FEMA mapping
and Lower Green River Mapping Study by King County. Wetland locations are approximate and based on existing
city/regional inventories; additional wetlands may be present that are not shown on the maps and some of the areas
shown as wetlands may not meet the wetland criteria. This map makes no claim as to whether wetlands are associated
with the shoreline or not.
8. CR-C
CR-D
CR-A
CR-B
LW-I
LW-G
LW-F
LW-H
CR-D
LW-J
CR-D
Cedar
River
MadsenCre
ek
M
a
y
C
re
ek
Maple
wood Creek
H
oney Creek
PantherCreek
Mola
ss
e
sCreek
Ging
er C
reek
RollingHillsCreek
Joh
ns
Creek
BigSoosCreek
RollingHillsCreek
Molasses Creek
GingerCreek
MolassesCreek
M
aplew ood Creek
Honey Creek
Rolling
H
illsCreek
Ho
neyCreek
RollingHil
ls Creek
Lake Washington
I-405Fwy
Cedar River Trl Walk
NE 4th St
SR167
NE 12th St
NE 7th St
DuvallAveNE
ParkAveN
SE 116th St
SE 168th St
Maple Valley Hwy
NESunsetBlvd
Renton Maple Valley Rd
SE Jones Rd
BensonDrS
EdmondsAveNE
160thAveSE
SE 164th St
KirklandAveNE
NE 3rd St
N 3rd St
UnionAveNE
GrantAveS
116thAveSE
S 3rd St
SE 128th St
SE Re
ntonIssa
quah Rd
N 4th St
BensonRdS
RainierAveS
164thAveSE
HarringtonAveNE
N 6th St
144thAveSE
SE Fairwood
Blvd
SE 144th St
LoganAveN
I-405Ramp
NE 6th St
154t
h P
lSE
140thAveSE
TalbotRdS
SE 136th St
WellsAveS
S Grady Way
Pedest
rian Walk
S 4th St
SE 5th St
AberdeenAveNE 140th W
ay SE
PugetDrSE
NE 20th St
SunsetBlvdNE
RainierAveN
S 7th St
Perim
ete r Rd NW
N 8th St
132ndPlSE
S 5th St
WellsAveN
RentonAveS
N
E Par k Dr
156thAveSE
SE
M
ay Valley Rd
S 15th St
126thAveSE
N
1stSt
SE 160th St
S 14th St
136thAveSE
SE 141st St
S 2nd St
S Tobin St
SE 165th St
NE 9th St
NE 8th St
NE 5th St
S 19th St
HouserWayN
NRiversideDr
N 5th St
158thAveSE
166thAveSE
SE 4th St
NE 6th Pl
142ndAveSE
120thAveSE
SE 145th Pl
NE 2nd St
SE 112th St
SE 8th P l
SE 149th St
BeaconW
ayS
HighAveS
SE 158th St
727 Ave
RosarioPlNE
SE 135th St
757 Ave
SE 138th Pl
OlympiaAveNE
JonesAveNE
S
E
Royal Hills Dr
Easement
LynnwoodAveNE
S 23rd St
SE 2nd Pl
AccessRd
HoquiamAveNE
SE 145th St
Br
onsonWayNE
IlwacoAveNE
SE 16th Pl
SE 1st St
NE 16th St
GardenAveN
SE
151s t St
SE 162nd Pl
SE 8th Dr
IndexAveSE
SE 159 th Pl
S 27th St
EdmondsAveSE
SE 142nd St
PierceAveSE
NE 17th St
138thAveSE
SE 161st St
NE 10th St
N Park Dr
SE 113th St
SE 160th Pl
111thAveSE
SE 161st Pl
MorrisA
ve
S
106thAveSE
FerndaleAveS
E
SE 132nd St
FieldAveNE
160thPlSE
Lake Youngs Wa
ySE
156thPlSE
Cedar Ri
dgeDrSE
NE 19th St
137thAveSE
146thAveSE
NE 1 0th Pl
162ndAveSE
104thAveSE
NE 2nd Ct
PascoDrNE
SE 156th St
SE 169th St
S
2
6th St
ASt
NE 9th Pl
PineRd
NE 17th Pl
S 17th St
SE 167th Pl
148thAveSE
NE 3rd Ct
SE 120th St
MontereyDrNE
CamasAveNE
143rdAveSE
Fern
daleAveNE
129thPlSE
S 32nd St
SE 13 9th St
145thAveSE
S 31st St
MonroeAveNE
SE 107th St
SE 137th Pl
N 7th St
IndexAveNE
NE1stPl
SE 125th St
SE 162nd St
SE 124th St
HarringtonPlSE
SE 118th St
S 25th St
161stAveSE
IndexPlNE
163rdAveSE
SE 104th St
GlenwoodAveNE
BlaineDrSE
LincolnAveNE
SE 19th Ct115thAveSE
139thAveSE
SE
124th Pl
141stAveSE
OlympiaAveNE
142ndAveSE
HouserWayN
SE 164th St
I-405Ramp
NE 5th St
I-405Fwy
SE 169th St
156thPlSE
SE 16th Pl
NE 1st Pl
162ndAveSE
S
23rd
St
FerndaleAveSE
SE
169th
St
161stAveSE
NE 9th St
156thAveSE
S 3rd St
IndexPlNE
SE 158th St
NE 19th St
NE 20th St
AccessRd
File Name: :HCEDPLANNINGGISgis_projectsshoreline_mgmt_program
6SMPmxds4E_cedar_river_floodplain_11x17_0909.mxd
Cedar River Floodplain
Map 4-E
Actual Data Source: City of Renton 2009,
King County 2009 and ESA Adolfson.
City Limits
PAA Boundary
Black River/Springbrook Creek Reaches
Cedar River Reaches
Green River Reaches
Lake Desire Reaches
Lake Washington Reaches
May Creek Reaches
Floodplain
Shoreline Master Program Update
City of Renton
0 10.5
Miles
September 16, 2009
1: 25,000
This map depicts the approximate location and extent of areas subject to the SMP. The actual extent of shoreline
jurisdiction requires a site-specific valuation to indentify the ordinary high water line and any associated wetlands.
The location of the 20 cfs limit is from USGS (1998). Floodplain and floodway extent are based on FEMA mapping
and Lower Green River Mapping Study by King County. Wetland locations are approximate and based on existing
city/regional inventories; additional wetlands may be present that are not shown on the maps and some of the areas
shown as wetlands may not meet the wetland criteria. This map makes no claim as to whether wetlands are associated
with the shoreline or not.
9. Black River
SpringbrookCreek
BRSC-C
BRSC-A
BRSC-B
GR-A
GreenRiver
SpringbrookCreek
PantherCreek
MillCreek
Duwamish
River
RollingHillsCreek
Springbrook
Springbrook Creek
RollingHillsCreek
Rolling
HillsCreek
Springbrook Creek
PantherCreek
RollingHillsCreek
RollingHillsCreek
T u k w i l aT u k w i l a
K e n tK e n t
SR167
I-405 Fwy
LindAveSW
WValleyHwy
TalbotRdS
BNIncRd
I-5Fwy
OakesdaleAveSW
EastValleyRd
BensonDrS
AndoverParkW
GreenRiv
e
rW
alk
S 180th St SW 43rd St
SW 7th St
SW Grady Way
AndoverParkE
SW 16th St
GrantAveS
InterurbanAveS
BensonRdS
InterurbanWalk
Strander Blvd
SW 27th St
SW 41st St
SW 34th St
Mons
ter Rd
SW
S 144th St
I-5Ramp
S Grady Way
S 4th St
SR167Ramp
I-405 Ramp
57thAveS
SE C arr R
d
56thAveS
58thAveS
Tukwila Pkwy
S 7th St
S 5th St
RainierAveS
S 15th St
SW 19th St
RentonAveS
IndustryDr
80thPlS
S 14th St
SW 12th St
S 19th St
Macadam Rd
S
MillAveS
80thAveS
EValleyHwy
65thAveS
SperryDr
SPugetD
r
PowellAveSW
SW 10th St
SouthcenterPkwy
SW Sunset Blvd
SW 39th St
HardieAveSW
MauleAveS
106thAveSE
S 6th St
S 32nd St
59thAveS
S 23rd St
Minkler Blvd
ShattuckAveS
S75thPl
SW
5th Pl
Baker Blvd
55thAveS
S 21st St
84thAveS
Triland Dr
106thPlSE
SW 23rd St
103rdAveSE
MainAveS
DavisAveS
BoeingAcRd
MorrisAveS
105thPlSE
S Carr Rd
Todd Blvd
S 47th St
Saxon Dr
ChristensenRd
SegaleParkBDr
Hospital AcRd
CedarAveS
ThomasAveSW
MapleAveSW
61stPlS
53rdAveS
SW 13th St
S 27th St
Midland Dr
S
26t
h St
S 184th St
S 152nd St
S 43rd St
SE 181st St
62ndAveS
S 45th Pl
Park
Access R
d
S 150th St
S 17th St
OlympicAveS
TalbotCrestDr
SE 185th Pl
S
27th Pl
Treck Dr
S 9th St
NachesAveSW
S 168th St
S 18th St
S Renton Village Pl
MillAveSE
S 31st St
SW 29th St
S 35th St
Segale Park D Dr
61stAveS
98thAveS
NelsonPlS
FortDentWay
S 25th St
SW 5th Ct
Fun Center Way
Lon
gacres Dr
SW
S 22nd
Ct
SW 21st St
S 29th Ct
S 10th St
64thAveS
SE 183rd Pl
SW 23rd St
ShattuckAveS
TalbotRdS
LindAveSW
I-405 Fwy
I-405 Ramp
ShattuckAveS
I-5Fwy
S 27th St
GreenRi
ver Walk
S 4th St
File Name: :HCEDPLANNINGGISgis_projectsshoreline_mgmt_program
6SMPmxds4F_green_river_floodplain_11x17_0909.mxd
Black River, Green River,
Springbrook Creek Floodplain
Map 4-F
Actual Data Source: City of Renton 2009,
King County 2009 and ESA Adolfson.
City Limits
PAA Boundary
Wetlands Inventory
LG FEMA floodway
Floodway
LG FEMA floodplain
Shoreline Master Program Update
City of Renton
0 0.60.3
Miles
September 16, 2009
1: 18,000
This map depicts the approximate location and extent of areas subject to the SMP. The actual extent of shoreline
jurisdiction requires a site-specific valuation to indentify the ordinary high water line and any associated wetlands.
The location of the 20 cfs limit is from USGS (1998). Floodplain and floodway extent are based on FEMA mapping
and Lower Green River Mapping Study by King County. Wetland locations are approximate and based on existing
city/regional inventories; additional wetlands may be present that are not shown on the maps and some of the areas
shown as wetlands may not meet the wetland criteria. This map makes no claim as to whether wetlands are associated
with the shoreline or not.
10. May Cree
k
MC-D
MC-C
MC-A
MC-B
LW-C
LW-F
LW-D
LW-E
LW-G
MayCreek
HoneyCreek
GypsyCreek
HoneyCreek
I-405I-405
N e w c a s t l eN e w c a s t l e
M e r c e r I s l a n dM e r c e r I s l a n d
Lake Washington
I-405Fwy
NE 27th St
NE 24th St
LakeWashingtonBlvdN
116thAveSE
ParkAveN
N 30th St
JonesAveNE
NE 20th St
SE 80th St
SE 76th St
I-405Ramp
BurnettAveN
NE 31st St
N 31st St
N 29th St
AberdeenAveNE
N 33rd St
N 32nd St
SE 95th Way
118thAveSE
126thAveSE
N 38th St
S E 88th Pl
EdmondsAveNE
E Merce
rW
ay
N 36th St
N 33rd Pl
N 34th St
N 35th St
SE
7
5 th P l
N 27th Pl
HazelwoodLn
127thAveSE
SE
89thPl
NE 23rd St
N 40th St
SE 91st St
NE 28th St
SE
80thW
ay
SE 88th St
120thPlSE
122ndPlSE
112thPlS
E
BlaineAveNE
LincolnAveNE
SE 100th St
SE 93rd St
SE 7 4th S
t
MontereyPlNE
NE 25th St
N 28th St
NE 36th St
NE43rdSt
NE 21st St
SE 78th St
SE 89th St
N 26th St
SE 77th Pl
MontereyCtNE
HighAveNE
SE 82nd St
MeadowAveN
N 37th St
PedestrianWalk
NE 22nd St
SE 98th St
H
arrington A
veN
E
NE 40th St
SE 84th St
N20thSt
N 24th St
Kirklan
dAveNE
SE 87th St
111thPlSE
SE 95th Pl
NE 44th St
SE 86th St
126thPlSE
OlympiaAveNE
KennewickPlNE
SE 96th Pl
DaytonAveNE
NE 19th St
SE8
6th Pl
NE 26th Pl
113thAveSE
123rdAveSE
Lincoln
Pl NE
114thAveSE
CamasAveNE
SE 85th Pl
117thAveSE
SE 92nd St
122ndAveSE
LynnwoodAveNE
120thPlSE
N 36th St
118thAveSE
MeadowAveN
I-405Ramp
NE 20th St
N 34th St
JonesAveNE
I-405Ramp
NE 21st St
SE 88th St
I-405Fwy
NE 21st St
126thAveSE
File Name: :HCEDPLANNINGGISgis_projectsshoreline_mgmt_program
6SMPmxds4G_may_creek_floodplain_11x17_0909.mxd
May Creek Floodplain
Map 4-G
Actual Data Source: City of Renton 2009,
King County 2009 and ESA Adolfson.
City Limits
PAA Boundary
Shoreline Planning Area - Reaches
Lake Washington Reaches
May Creek Reaches
Floodplain
Shoreline Master Program Update
City of Renton
0 0.50.25
Miles
September 16, 2009
1: 12,000
This map depicts the approximate location and extent of areas subject to the SMP. The actual extent of shoreline
jurisdiction requires a site-specific valuation to indentify the ordinary high water line and any associated wetlands.
The location of the 20 cfs limit is from USGS (1998). Floodplain and floodway extent are based on FEMA mapping
and Lower Green River Mapping Study by King County. Wetland locations are approximate and based on existing
city/regional inventories; additional wetlands may be present that are not shown on the maps and some of the areas
shown as wetlands may not meet the wetland criteria. This map makes no claim as to whether wetlands are associated
with the shoreline or not.
11. CedarRiver
MayCreek
Coal Creek
PantherCreek
MillCreek
BigSoosCreek
MadsenCreek
SpringbrookCreek
GarrisonCreek
GypsyCreek
MaplewoodCreek
Honey Creek
KennydaleCreek
Coal Creek Tributary
MolassesCreek
GingerCreek
RollingHillsCreek
JohnsCreek
SpringbrookCreek
RollingHillsCreek
MolassesCreek
RollingHillsCreek
HoneyCreek
PantherCreek
Big Soos Creek
MadsenCreek
K e n tK e n t
B e l l e v u eB e l l e v u e
N e w c a s t l eN e w c a s t l e
Tu k w i l aTu k w i l a
S e a t t l eS e a t t l e
M e r c e r I s l a n dM e r c e r I s l a n d
Lake Washington
Lake Young
Lake Desire
Panther Lake
Lake Boren
Cedar River
Green River
Duwamish Waterway
File Name: :HCEDPLANNINGGISgis_projectsshoreline_mgmt_program
6SMPmxds5A_fish_distribution_11x17_0909.mxd
Fish Distribution
Map 5-A
Actual Data Source: City of Renton 2009,
WA Dept of Fish & Wildlife, King County 2009 and ESA Adolfson.
Shoreline Master Program Update
City of Renton
0 52.5
Miles
September 16, 2009
1: 140,000
This map depicts the approximate location and extent of areas subject to the SMP. The actual extent of shoreline
jurisdiction requires a site-specific valuation to indentify the ordinary high water line and any associated wetlands.
The location of the 20 cfs limit is from USGS (1998). Floodplain and floodway extent are based on FEMA mapping
and Lower Green River Mapping Study by King County. Wetland locations are approximate and based on existing
city/regional inventories; additional wetlands may be present that are not shown on the maps and some of the areas
shown as wetlands may not meet the wetland criteria. This map makes no claim as to whether wetlands are associated
with the shoreline or not.
Cedar R iver
May Creek
Coal Creek
Gre
enRiv
er
Mill Cree
k
PantherCree
k
B
i
g
Soos
Creek
Mad sen Cre
ek
Sprin
gbrookCreek
GarrisonCreek
G
y psy Creek
Honey Creek
Kennyd
aleCreek
Coal Creek Tributary
MolassesCreek
GingerCreek
RollingHillsCreek
JohnsCreek
RollingHillsCreek
MadsenCreek
Coal Creek
Hone
yCreek
PantherCreek
SpringbrookCreek
Big Soos
C
reek
M
olassesCreek
K e n tK e n t
B e l l e v u eB e l l e v u e
N e w c a s t l eN e w c a s t l e
T u k w i l aT u k w i l a
S e a t t l eS e a t t l e
M e r c e r I s l a n dM e r c e r I s l a n d
I s s a q u a hI s s a q u a h
Lake Washington
Lake Young
Lake Desire
Panther Lake
Shady Lake
Lake Boren
Cedar RiverGreen River
Duwamish Waterway
Cedar R iver
May Creek
Coal Creek
Gree n
River
PantherCree
k
Mill Cree
k
B
i
g
Soos
Creek
Mad sen Cre
ek
Sprin
gbrookCreek
GarrisonCreek
G
ypsy Creek
Honey Creek
Kennyd
aleCreek
Coal Cr eek Tributary
MolassesCreek
GingerCreek
RollingHillsCreek
JohnsCreek
RollingHillsCreek
PantherCreek
Big Soos
Creek
MadsenCreek
Coal Creek
SpringbrookCreek
Hone
yCreek
MadsenCreek
K e n tK e n t
B e l l e v u eB e l l e v u e
T u k w i l aT u k w i l a
N e w c a s t l eN e w c a s t l e
S e a t t l eS e a t t l e
M e r c e r I s l a n dM e r c e r I s l a n d
Lake Washington
Lake Young
Lake Desire
Panther Lake
Lake Boren
Cedar River
Green River
Duwamish Waterway
Cedar River
May Creek
Gree
nRiver
Mill Cree
k
Coal Creek
PantherCree
k
B
i
g
Soos
Creek
Mad sen Cre
ek
Sprin
gbrookCreek
GarrisonCreek
G
ypsy Creek
Honey Creek
Kennyd
aleCreek
MolassesCreek
GingerCreek
Coal C reek Tributary
RollingHillsCreek
JohnsCreek
RollingHillsCreek
SpringbrookCreek
PantherCreek
MadsenCreek
MadsenCreek
Hone
yCreek
Big Soos
Creek
K e n tK e n t
N e w c a s t l eN e w c a s t l e
T u k w i l aT u k w i l a
B e l l e v u eB e l l e v u e
S e a t t l eS e a t t l e
M e r c e r I s l a n dM e r c e r I s l a n d
Lake Washington
Lake Young
Lake Desire
Panther Lake
Lake Boren
Cedar River
Green River
Duwamish Waterway
Ceda r River
May Creek
Green
Riv
er
MillCreek
Coal Creek
PantherCree
k
BigS
oo
sCre
e
k
Madsen Cr
eek
Sprin
gbrookCreek
GarrisonCreek
Gyp
sy Creek
Duw
amishRiver
Honey Creek
MolassesCreek
GingerCreek
Coal C reek Tributary
RollingHillsCreek
RollingHillsCreek
MadsenCreek
SpringbrookCreek
Honey
Creek
Big Soo
sCreek
K e n tK e n t
T u k w i l aT u k w i l a
N e w c a s t l eN e w c a s t l e
B e l l e v u eB e l l e v u e
S e a t t l eS e a t t l e
M e r c e r I s l a n dM e r c e r I s l a n d
Lake Washington
Lake Young
Lake Desire
Panther Lake
Lake Boren
Cedar River
Green River
Duwamish Waterway
Ced ar River
May Creek
Coal Creek
Gr
ee
n River
MillCreek
PantherCree
k
BigS
oo
sCre
e
k
Madsen Cr
eek
Sprin
gbrookCreek
GarrisonCreek
Gyp
sy Creek
Honey Creek
Coal C reek Tributary
MolassesCreek
GingerCreek
RollingHillsCreek
RollingHillsCreek
SpringbrookCreek
MadsenCreek
MadsenCreek
Honey
Creek
Big Soo
sCreek
K e n tK e n t
B e l l e v u eB e l l e v u e
N e w c a s t l eN e w c a s t l e
T u k w i l aT u k w i l a
S e a t t l eS e a t t l e
M e r c e r I s l a n dM e r c e r I s l a n d
I s s a q u a hI s s a q u a h
Lake Washington
Lake Young
Lake Desire
Panther Lake
Lake Boren
Cedar River
Green River
DuwamishWaterway
Resident Cutthroat Trout Fall Chinook
Dolly Varden/Bull Trout Sockeye Salmon
Coho Salmon
Winter Steelhead
City Limits
PAA Boundary
Fish Distribution
SPPCODE
CCT-Resident Cutthroat Trout
CHFA-Fall Chinook
COHO-Coho Salmon
DBT-Dolly varden/Bull trout
SOCK-Sockeye salmon
STWI-Winter Steelhead
12. M
ayCreek
Black R iver
SpringbrookCreek
CR-C
CR-D
CR-A
BRSC-C
MC-D
LD-A
BRSC-A
CR-B
LW-K
LW-C
MC-C
LW-F
LW-I
MC-A
LW-D
LW-G
LW-E
MC-B
LW-B
LW-A
BRSC-B
LW-H
CR-D
LW-J
GR-A
CR-D
T u k w i l aT u k w i l a
K e n tK e n t
S e a t t l eS e a t t l e
N e w c a s t l eN e w c a s t l e
M e r c e r I s l a n dM e r c e r I s l a n d
B e l l e v u eB e l l e v u e
Lake Washington
Lake Young
Lake Desire
Shady Lake
Panther Lake
Lake Boren
Cedar River
C edar R iver
Gre
en River
M
ay C
reek
PantherCreek
MillCreek
Madsen
Creek
CoalCreek
SpringbrookCreek
Duwamish
River
BigSoos
Creek
Gypsy Creek
Maplewood Creek
Honey Creek
Kenn
ydaleCreek
M
olass
esCreek
GingerCreek
Coal Creek Tributary
RollingHillsCreek
RollingHillsCreek
RollingH
ills Creek
Madse
n Cr
eek
Coal Creek
PantherCreek
M
adsenCreek
M
olassesCreek
Hon
eyCreek
GingerCreek
File Name: :HCEDPLANNINGGISgis_projectsshoreline_mgmt_program
6SMPmxds5B_spawning_rearing_or_presence_of_salmonids_
salmon_stock_inventory_11x17_0909.mxd
Spawning, Rearing or Presence of Salmonids
& Salmon Stock Inventory
Map 5-B
Actual Data Source: City of Renton 2009,
WA Dept of Fish & Wildlife, King County 2009 and ESA Adolfson.
City Limits
PAA Boundary
Black River/Springbrook Creek Reaches
Cedar River Reaches
Green River Reaches
Lake Desire Reaches
Lake Washington Reaches
May Creek Reaches
Salmon Stock Inventory
SASISTKNUM
1144 - 1160
1161 - 3140
3141 - 5400
5401 - 6175
6176 - 7380
Migration - Spawning - Known Juvenile Rearing
USE_TYPE
1 - Presence Migration
2 - Known Spawning
3 - Known Juvenile Rearing
Shoreline Master Program Update
City of Renton
0 21
Miles
September 16, 2009
1: 50,000
This map depicts the approximate location and extent of areas subject to the SMP. The actual extent of shoreline
jurisdiction requires a site-specific valuation to indentify the ordinary high water line and any associated wetlands.
The location of the 20 cfs limit is from USGS (1998). Floodplain and floodway extent are based on FEMA mapping
and Lower Green River Mapping Study by King County. Wetland locations are approximate and based on existing
city/regional inventories; additional wetlands may be present that are not shown on the maps and some of the areas
shown as wetlands may not meet the wetland criteria. This map makes no claim as to whether wetlands are associated
with the shoreline or not.
13. M
ayCreek
Black R iver
SpringbrookCreek
T u k w i l aT u k w i l a
K e n tK e n t
S e a t t l eS e a t t l e
N e w c a s t l eN e w c a s t l eM e r c e r I s l a n dM e r c e r I s l a n d
B e l l e v u eB e l l e v u e
CR-C
CR-D
CR-A
BRSC-C
MC-D
LD-A
BRSC-A
CR-B
LW-K
LW-C
MC-C
LW-F
LW-I
MC-A
LW-D
LW-G
LW-E
MC-B
LW-B
LW-A
BRSC-B
LW-H
CR-D
LW-J
GR-A
CR-D
I-5
SR 167
I-405
SR 599
SR 518
I-405Fwy
SR167
I-5Fwy
BNIncRd
Cedar River Trl Walk
SE 192nd St
SE Petrovitsky
Rd
RentonAveS
S
E
Jones Rd
SE 128th St
NE 4th St
140thAveSE
SR
599
116thAveSE
RainierAveS
LindAveSW
InterurbanAveS
Renton Maple Valley Rd
WValleyHwy
TalbotRdS
UnionAveNE
NE 12th St
NE 7th St
BensonDrS
EdmondsAveNE
OakesdaleAveSW
108thAveSE
SE 144th St
SE Renton Issaquah Rd
ParkAveN
AndoverParkW
SE May Valley Rd
BeaconAve S
S 128th St
Green R
iverWalk
SE 116th St
78thAveS
InterurbanWalk
SE 168th St
Maple Valley Hwy
DuvallAveNE
S 180th St SW 43rd St
80thAveS
SE 196th St
NE
Sunset Blvd
SW 7th St
S 132nd St
E M
ercerW
ay
LakeWashingtonBlvdN
190thAveSE
AndoverParkE
72ndAveS
160thAveSE
SE 164th St
KirklandAveNE
NE 3rd St
S Bangor St
N 3rd St
MartinLKingJrWayS
SE 134th St
GrantAveS
S 3rd St
SE 95th Way
120thAveSE
NE 27th St
AberdeenAveNE
164thAveSE
SE
79t
h Dr
SE 149th St
SE 200th St
SE Fair
wo
od Blvd
80thPlS
SE
170th
St
51stAveS
CoalCreekPkwySE
RainierAveN
144thAveSE
42ndAveS
S 196th St
SE 179 th St
LoganAveN
Cor
ne
llAveS
85thAveS
Strander Blvd
SW 27th St
SW 41st St
SW 34th St
NE 6th St
S 55th St
SE 8 9th Pl
SE 121st Pl
SE 136th St
59thAveS
I-5Ramp
N 30th St
171stAveSE
Ped estrian Walk
SE Carr Rd
S 135th St
S Leo St
128thAveSE
SE 184th St
SR167Ramp
Dixon Dr S
SE 186th St
HazelwoodLn
SE 5th St
57thAveS
S 134th St
JonesAveNE
S 133rd St
183rdAveSE
SW Sunset Blvd
112thAveSE
125thAveSE
168thAveSE
140thW
ay SE
S 120th St
161stAveSE
184thAveSE
PugetDrSE
96thAveS
63rdAveS
S
LangstonRd
Tukwila Pkwy
S 7th St
102ndAveSE
N 8th St
132ndPlSE
S 5th St
SE 80th St
SE 76th St
SE 124th St
NE Park Dr
118thAveSE
SE 176th St
64thAveS
156thAveSE
S 116th St
163rdPlSE
NE 21st St
155th Ave SE
44thPlS
SE 160th St
IndustryDr
SE 140th St
SE 141st St
NE 31st St
S Tobin St
S 114th St
SE 165th St
NE 24th St
NE 9th St
113thAveSE
NE 8th St
NE 5th St
S 200th St
SE 192nd Dr
HouserWayN
51stPlS
NRiversideDr
133rdAveSE
1
29thPlSE
158thAveSE
138thAveSE
SE 180th St
SE 4th St
N 33rd St
WestLake
Desire Dr SE
142ndAveSE
SE
80t
h Way
SE 142nd St
126thAveSE
68thAveS
SE 88th Pl
NE
2ndSt
S Taft St
S
E 196t h Dr
S 126th St
136thPlSE
SE 8th Pl
S 192nd St
SE 188th St
143rdPlSE
S 113th St
SE 100th St
BeaconW
ayS
Easement
727 Ave
S 190th St
I-405 Ramp
IlwacoAveNE
LindAveNW
SE 83rd Pl
106thAveSE
SE Royal Hills Dr
184th Pl SE
S 23rd St
SE 2nd Pl
SE18
3rd Dr
UnionAveSE
131st Ave SE
HoquiamAveNE
S 187th St
SE 161st St
180thAveSE
SE 16th Pl
PellyAveN
N 36th St
NE 16th St
SE 181st St
S E 18
2ndSt
SE 112th St
SE 162nd Pl
121stPlSE
194thAveSE
147thAveSE
S 182nd St
WestLakeKathleenDrSE
NE 23rd St
SE 159th Pl
S 124th St
121stAveSE
84thAveS
SE 135th St
NE 17th St
SE 174th St
SE 175th St
SW 23rd St
SE 72nd Pl
SE 82 nd St
SE 122nd St
S Rya n Way
N Park Dr
BoeingAcRd
177thPlSE
SE 113th St
SE 160th Pl
143rd Av
eSE
PascoPlNE
SE 162nd St
SE 147th St
W
estSpringL
ake Dr SE
SE 132nd St
151stAveSE
S 143rd St
164thPlSE
S Carr Rd
160thPlSE
Todd Blvd
S 47th St
SE 86th Pl
SE 173rd Pl
124thAveSE
137thAveSE
69thAveS
S Fountain St
112thPlSE
85thAveSE
169thAveSE
SE 100th Pl
WatersAveS
NE 11th St
SE 9 3rd St
NE 2nd Ct
191stAveSE
SE
169thSt
SE 163rd St
SE 183rd St
ASt
127thAveSE
S 123rd Pl
148thAveSE
SE 120th St
S 4th Pl
135thAveSE
185thWaySE
NE 2nd Pl
S 194th Pl
MonroeAveNE
SE 71st St
S 146th St
SE 131st St
SE
171st St
SE 159th St
NE 5th Ct
SE 8th St
IndexAveNE
SE 126th St
SE 191st Pl
S Bond St
SE 172nd Ln
SE 165th Pl
SE 184th Pl
NE 4th St
I-5 Fwy
SE 160th St
161stAveSE
SE 196th St
I-40
5
Fw
y
SE144thSt
SE 184th St
I-405Ramp
116thAveSE
184thAv
e SE
161stAveSE
SE 200th St
Lake Washington
Lake Young
Lake Desire
Cedar River
Green River
Duwamish Waterway
File Name: HCEDPLANNINGGISgis_projectsshoreline_mgmt_program
6SMPmxds8D_impervious_surface_11x17_0909.mxd
Impervious Surface
Map 8-D
Actual Data Source: City of Renton 2009,
King County 2009 and ESA Adolfson.
City Limits
PAA Boundary
Shoreline Jurisdiction
Impervious Level
Value
0 - 11
12 - 42
43 - 94
95 - 130
Shoreline Master Program Update
City of Renton
0 21
Miles
September 24, 2009
1: 50,000
This map depicts the approximate location and extent of areas subject to the SMP. The actual extent of shoreline
jurisdiction requires a site-specific valuation to indentify the ordinary high water line and any associated wetlands.
The location of the 20 cfs limit is from USGS (1998). Floodplain and floodway extent are based on FEMA mapping
and Lower Green River Mapping Study by King County. Wetland locations are approximate and based on existing
city/regional inventories; additional wetlands may be present that are not shown on the maps and some of the areas
shown as wetlands may not meet the wetland criteria. This map makes no claim as to whether wetlands are associated
with the shoreline or not.
14. M
ayCreek
Black R iver
SpringbrookCreek
K e n tK e n t
T u k w i l aT u k w i l a
N e w c a s t l eN e w c a s t l e
S e a t t l eS e a t t l e
M e r c e r I s l a n dM e r c e r I s l a n d
B e l l e v u eB e l l e v u e
I s s a q u a hI s s a q u a h
CR-C
CR-D
CR-A
BRSC-C
MC-D
LD-A
BRSC-A
CR-B
LW-K
LW-C
MC-C
LW-F
LW-I
MC-A
LW-D
LW-G
LW-E
MC-B
LW-B
BRSC-B
LW-A
LW-H
CR-D
LW-J
GR-A
CR-D
I-5
SR167
I-405
SR 518
I-5
Lake Washington
Lake Young
Lake Desire
Shady Lake
Panther Lake
Lake Boren
Cedar River
Green River
Duwamish Waterway
File Name: HCEDPLANNINGGISgis_projectsshoreline_mgmt_program
6SMPmxds8E_land_cover_11x17_0909.mxd
Land Cover
Map 8-E
Actual Data Source: City of Renton 2009,
King County 2009 and ESA Adolfson.
City Limits
PAA Boundary
Shoreline Jurisdictions
Barren Land
Cultivated Crops
Deciduous Forest
Developed, High Intensity
Developed, Low Intensity
Developed, Medium Intensity
Developed, Open Space
Emergent Herbaceuous Wetlands
Evergreen Forest
Hay/Pasture
Herbaceuous
Mixed Forest
Open Water
Perennial Snow/Ice
Shrub/Scrub
Woody Wetlands
Shoreline Master Program Update
City of Renton
0 21
Miles
September 17, 2009
1: 50,000
This map depicts the approximate location and extent of areas subject to the SMP. The actual extent of shoreline
jurisdiction requires a site-specific valuation to indentify the ordinary high water line and any associated wetlands.
The location of the 20 cfs limit is from USGS (1998). Floodplain and floodway extent are based on FEMA mapping
and Lower Green River Mapping Study by King County. Wetland locations are approximate and based on existing
city/regional inventories; additional wetlands may be present that are not shown on the maps and some of the areas
shown as wetlands may not meet the wetland criteria. This map makes no claim as to whether wetlands are associated
with the shoreline or not.
15. M
ayCreek
Cedar R
ive
r
GreenRiver
Black R iver
SpringbrookCreek
CR-C
CR-D
CR-A
BRSC-C
MC-D
LD-A
BRSC-A
CR-B
LW-K
LW-C
MC-C
LW-F
LW-I
MC-A
LW-D
LW-G
LW-E
MC-B
LW-B
LW-A
BRSC-B
LW-H
CR-D
LW-J
GR-A
CR-D
T u k w i l aT u k w i l a
K e n tK e n t
S e a t t l eS e a t t l e
N e w c a s t l eN e w c a s t l e
M e r c e r I s l a n dM e r c e r I s l a n d
B e l l e v u eB e l l e v u e
Lake Washington
Lake Young
Lake Desire
Shady Lake
Panther Lake
Lake Boren
File Name: :HCEDPLANNINGGISgis_projectsshoreline_mgmt_program
6SMPmxds9B_storm_surface_water_system_11x17_0909.mxd
Storm Surface Water System
Map 9-B
Actual Data Source: City of Renton 2009,
King County 2009 and ESA Adolfson.
City Limits
PAA Boundary
Black River/Springbrook Creek Reaches
Cedar River Reaches
Green River Reaches
Lake Desire Reaches
Lake Washington Reaches
May Creek Reaches
Culvert End
DetRetPond
DitchEnd
Inlet
LiftStation
PondEntranceOutlet
SystemEntranceOutlet
DitchLine
Pipe
Culvert
Shoreline Master Program Update
City of Renton
0 21
Miles
September 17, 2009
1: 50,000
This map depicts the approximate location and extent of areas subject to the SMP. The actual extent of shoreline
jurisdiction requires a site-specific valuation to indentify the ordinary high water line and any associated wetlands.
The location of the 20 cfs limit is from USGS (1998). Floodplain and floodway extent are based on FEMA mapping
and Lower Green River Mapping Study by King County. Wetland locations are approximate and based on existing
city/regional inventories; additional wetlands may be present that are not shown on the maps and some of the areas
shown as wetlands may not meet the wetland criteria. This map makes no claim as to whether wetlands are associated
with the shoreline or not.
16. M
ayCreek
Cedar R
ive
r
GreenRiver
Black R iver
SpringbrookCreek
CR-C
CR-D
CR-A
BRSC-C
MC-D
LD-A
BRSC-A
CR-B
LW-K
LW-C
MC-C
LW-F
LW-I
MC-A
LW-D
LW-G
LW-E
MC-B
LW-B
LW-A
BRSC-B
LW-H
CR-D
LW-J
GR-A
CR-D
I-5
I-405
SR167
S
R
599
SR 518
Martin
L
King
Jr
I-5
K e n tK e n t
S e a t t l eS e a t t l e
N e w c a s t l eN e w c a s t l e
M e r c e r I s l a n dM e r c e r I s l a n d
B e l l e v u eB e l l e v u e
T u k w i l aT u k w i l a
Lake Washington
Lake Young
Lake Desire
Shady Lake
Panther Lake
Lake Boren
File Name: :HCEDPLANNINGGISgis_projectsshoreline_mgmt_program
6SMPmxds9C_sanitary_sewer_system_11x17_0909.mxd
Sanitary Sewer System
Map 9-C
Actual Data Source: City of Renton 2009,
King County 2009 and ESA Adolfson.
City Limits
Service_Boundary
Black River/Springbrook Creek Reaches
Cedar River Reaches
Green River Reaches
Lake Desire Reaches
Lake Washington Reaches
May Creek Reaches
BrynMawrSewerMains
Cedar_RiverSewerMains
CoalCreekSewerMains
SoosCreekSewerMains
Wastewater_mains
KCMetroMains
Major Drainage Basins
Basin_Name
BLACK RIVER BASIN
DOWNTOWN BASIN
EAST CEDAR RIVER BASIN
EAST LAKE WASHINGTON BASIN
MAY VALLEY BASIN
WEST CEDAR RIVER BASIN
Shoreline Master Program Update
City of Renton
0 21
Miles
September 17, 2009
1: 50,000
This map depicts the approximate location and extent of areas subject to the SMP. The actual extent of shoreline
jurisdiction requires a site-specific valuation to indentify the ordinary high water line and any associated wetlands.
The location of the 20 cfs limit is from USGS (1998). Floodplain and floodway extent are based on FEMA mapping
and Lower Green River Mapping Study by King County. Wetland locations are approximate and based on existing
city/regional inventories; additional wetlands may be present that are not shown on the maps and some of the areas
shown as wetlands may not meet the wetland criteria. This map makes no claim as to whether wetlands are associated
with the shoreline or not.
17. I-405Fwy
HazelwoodLn
I-405Ramp
RipleyLnN
SE 76th St
LakeW
ashingtonBlvdSE
LakeWashingtonBlvdSE
I-405Fwy
Lake Washington
X
F
C
M
L
F
D
J
C
J
J
LC
X
X
D
LC
F
C
L
X
X
L
File Name: :HCEDPLANNINGGISgis_projectsshoreline_mgmt_program
4SMPmxds11A_shoreline_modifications_11x17_0709.mxd
Shoreline Modifications
Map 11-A
Actual Data Source: City of Renton 2009,
King County 2009 and ESA Adolfson.
0-No Structure Present
1-Less than 20 Feet
2-20 to 50 Feet
3-More than 50 Feet
Natural/Un-modified
Some Modification/Partially Vegetated
Hard Armoring Concrete
Hard Armoring Rock Wall
Hard Armoring Other
Alternatively Modified and Natural
Commercial/Industrial Shoreline
Restored Shoreline
C, Private Residential Docks, Covered
D, Private Residential Docks
F, Floats
J, Joint Use Private Residential Docks
L, Boat Lift
LC, Boat Lift and Covered Private Dock
M, Marina
O, Other Dock Structure
R, Major Boat Ramp Facility
X, No Dock
Shoreline Master Program Update
City of Renton
0 0.10.05
Miles
July 30, 2009
1: 3,000
This map depicts the approximate location and extent of areas subject to the SMP. The actual extent of
shoreline jurisdiction requires a site-specific valuation to indentify the ordinary high water line and
any associated wetlands. The location of the 20 cfs limit is from USGS (1998). Floodplain and floodway extent
are based on FEMA mapping. Wetland locations are approximate and based on existing city/regional inventories;
additional wetlands may be present that are not shown on the maps and some of the areas shown as
wetlands may not meet the wetland criteria.
This map makes no claim as to whether wetlands are associated with the shoreline or not.
18. May Creek
I-405Fwy
N 38th St
I-405Ramp
LakeW
ashingtonBlvdN
N 40th St
ParkAveN
MeadowAveN
I-405Fwy
I-405
Lake Washington
F
J
X
X
L
X
L
LC
D
L
D
L
LC
L
X
R
L
LC
LC
LC
L
File Name: :HCEDPLANNINGGISgis_projectsshoreline_mgmt_program
4SMPmxds11B_shoreline_modifications_11x17_0709.mxd
Shoreline Modifications
Map 11-B
Actual Data Source: City of Renton 2009,
King County 2009 and ESA Adolfson.
0-No Structure Present
1-Less than 20 Feet
2-20 to 50 Feet
3-More than 50 Feet
Natural/Un-modified
Some Modification/Partially Vegetated
Hard Armoring Concrete
Hard Armoring Rock Wall
Hard Armoring Other
Alternatively Modified and Natural
Commercial/Industrial Shoreline
Restored Shoreline
C, Private Residential Docks, Covered
D, Private Residential Docks
F, Floats
J, Joint Use Private Residential Docks
L, Boat Lift
LC, Boat Lift and Covered Private Dock
M, Marina
O, Other Dock Structure
R, Major Boat Ramp Facility
X, No Dock
Shoreline Master Program Update
City of Renton
0 0.10.05
Miles
July 30, 2009
1: 3,000
This map depicts the approximate location and extent of areas subject to the SMP. The actual extent of
shoreline jurisdiction requires a site-specific valuation to indentify the ordinary high water line and
any associated wetlands. The location of the 20 cfs limit is from USGS (1998). Floodplain and floodway extent
are based on FEMA mapping. Wetland locations are approximate and based on existing city/regional inventories;
additional wetlands may be present that are not shown on the maps and some of the areas shown as
wetlands may not meet the wetland criteria.
This map makes no claim as to whether wetlands are associated with the shoreline or not.
19. N 31st St
N 32nd St
N 33rd St
BurnettAveN
LakeWashingtonBlvdN
N 33rd Pl
N 34th St
N 36th St
N 35th St
N 38th St
MountainViewAveN
N 37th St
Lake Washington
O
D
J
L
L
LC
LC
LC
LC
D
F
L
L
LC
L
L
R
X
L
X
L
LC
LC
LC
LC
LC
LC
L
LC
LC
LCLC
L
File Name: :HCEDPLANNINGGISgis_projectsshoreline_mgmt_program
4SMPmxds11C_shoreline_modifications_11x17_0709.mxd
Shoreline Modifications
Map 11-C
Actual Data Source: City of Renton 2009,
King County 2009 and ESA Adolfson.
0-No Structure Present
1-Less than 20 Feet
2-20 to 50 Feet
3-More than 50 Feet
Natural/Un-modified
Some Modification/Partially Vegetated
Hard Armoring Concrete
Hard Armoring Rock Wall
Hard Armoring Other
Alternatively Modified and Natural
Commercial/Industrial Shoreline
Restored Shoreline
C, Private Residential Docks, Covered
D, Private Residential Docks
F, Floats
J, Joint Use Private Residential Docks
L, Boat Lift
LC, Boat Lift and Covered Private Dock
M, Marina
O, Other Dock Structure
R, Major Boat Ramp Facility
X, No Dock
Shoreline Master Program Update
City of Renton
0 0.10.05
Miles
July 30, 2009
1: 3,000
This map depicts the approximate location and extent of areas subject to the SMP. The actual extent of
shoreline jurisdiction requires a site-specific valuation to indentify the ordinary high water line and
any associated wetlands. The location of the 20 cfs limit is from USGS (1998). Floodplain and floodway extent
are based on FEMA mapping. Wetland locations are approximate and based on existing city/regional inventories;
additional wetlands may be present that are not shown on the maps and some of the areas shown as
wetlands may not meet the wetland criteria.
This map makes no claim as to whether wetlands are associated with the shoreline or not.
20. N 31st St
N 30th St
N 29th St
N 28th Pl
N 27th Pl
LakeWashingtonBlvdN
BurnettAveN
PedestrianWalk
MountainViewAveN
WilliamsAveN
PedestrianWalk
Pedestrian W
alk
M
ountainViewAv
e N
F
O
J
L
L
D
X
X
L
L
L
L
D
LC
L
L
L
L
LC
L
X
L
LC
L
L
L
L
L
O
X
L
Lake Washington
File Name: :HCEDPLANNINGGISgis_projectsshoreline_mgmt_program
mxds6SMP11D_shoreline_modifications_11x17_0210.mxd
Shoreline Modifications
Map 11-D
Actual Data Source: City of Renton 2009,
King County 2009 and ESA Adolfson.
0-No Structure Present
1-Less than 20 Feet
2-20 to 50 Feet
3-More than 50 Feet
Natural/Un-modified
Some Modification/Partially Vegetated
Hard Armoring Concrete
Hard Armoring Rock Wall
Hard Armoring Other
Alternatively Modified and Natural
Commercial/Industrial Shoreline
Restored Shoreline
C, Private Residential Docks, Covered
D, Private Residential Docks
F, Floats
J, Joint Use Private Residential Docks
L, Boat Lift
LC, Boat Lift and Covered Private Dock
M, Marina
O, Other Dock Structure
R, Major Boat Ramp Facility
X, No Dock
Shoreline Master Program Update
City of Renton
0 0.10.05
Miles
February 8, 2010
1: 3,000
This map depicts the approximate location and extent of areas subject to the SMP. The actual extent of
shoreline jurisdiction requires a site-specific valuation to indentify the ordinary high water line and
any associated wetlands. The location of the 20 cfs limit is from USGS (1998). Floodplain and floodway extent
are based on FEMA mapping. Wetland locations are approximate and based on existing city/regional inventories;
additional wetlands may be present that are not shown on the maps and some of the areas shown as
wetlands may not meet the wetland criteria.
This map makes no claim as to whether wetlands are associated with the shoreline or not.
21. I-405Fwy
JonesAveNE
LakeWashingtonBlvdN
I-405Ramp
N 20th St
HighAveNE
NE 16th St
NE 20th St
I-405FwyI-405Ramp
M
F
Lake Washington
File Name: :HCEDPLANNINGGISgis_projectsshoreline_mgmt_program
4SMPmxds11E_shoreline_modifications_11x17_0709.mxd
Shoreline Modifications
Map 11-E
Actual Data Source: City of Renton 2009,
King County 2009 and ESA Adolfson.
0-No Structure Present
1-Less than 20 Feet
2-20 to 50 Feet
3-More than 50 Feet
Natural/Un-modified
Some Modification/Partially Vegetated
Hard Armoring Concrete
Hard Armoring Rock Wall
Hard Armoring Other
Alternatively Modified and Natural
Commercial/Industrial Shoreline
Restored Shoreline
C, Private Residential Docks, Covered
D, Private Residential Docks
F, Floats
J, Joint Use Private Residential Docks
L, Boat Lift
LC, Boat Lift and Covered Private Dock
M, Marina
O, Other Dock Structure
R, Major Boat Ramp Facility
X, No Dock
Shoreline Master Program Update
City of Renton
0 0.10.05
Miles
July 30, 2009
1: 3,000
This map depicts the approximate location and extent of areas subject to the SMP. The actual extent of
shoreline jurisdiction requires a site-specific valuation to indentify the ordinary high water line and
any associated wetlands. The location of the 20 cfs limit is from USGS (1998). Floodplain and floodway extent
are based on FEMA mapping. Wetland locations are approximate and based on existing city/regional inventories;
additional wetlands may be present that are not shown on the maps and some of the areas shown as
wetlands may not meet the wetland criteria.
This map makes no claim as to whether wetlands are associated with the shoreline or not.
22. 757 Ave
ParkAveN
Coulon Beach AcRd
O
M
X
J
J
Lake Washington
File Name: :HCEDPLANNINGGISgis_projectsshoreline_mgmt_program
4SMPmxds11F_shoreline_modifications_11x17_0709.mxd
Shoreline Modifications
Map 11-F
Actual Data Source: City of Renton 2009,
King County 2009 and ESA Adolfson.
0-No Structure Present
1-Less than 20 Feet
2-20 to 50 Feet
3-More than 50 Feet
Natural/Un-modified
Some Modification/Partially Vegetated
Hard Armoring Concrete
Hard Armoring Rock Wall
Hard Armoring Other
Alternatively Modified and Natural
Commercial/Industrial Shoreline
Restored Shoreline
C, Private Residential Docks, Covered
D, Private Residential Docks
F, Floats
J, Joint Use Private Residential Docks
L, Boat Lift
LC, Boat Lift and Covered Private Dock
M, Marina
O, Other Dock Structure
R, Major Boat Ramp Facility
X, No Dock
Shoreline Master Program Update
City of Renton
0 0.10.05
Miles
July 30, 2009
1: 3,000
This map depicts the approximate location and extent of areas subject to the SMP. The actual extent of
shoreline jurisdiction requires a site-specific valuation to indentify the ordinary high water line and
any associated wetlands. The location of the 20 cfs limit is from USGS (1998). Floodplain and floodway extent
are based on FEMA mapping. Wetland locations are approximate and based on existing city/regional inventories;
additional wetlands may be present that are not shown on the maps and some of the areas shown as
wetlands may not meet the wetland criteria.
This map makes no claim as to whether wetlands are associated with the shoreline or not.
23. 87thAveS
RainierAveS
S 115th Pl
S 117th St
S 117th Pl
S 114th St
NRiversideDr
S 113th St
S 116th St
88thAveS
89thAveS
RainierAveN
S 112th St
S 115th St
S 113th St
S 116th St
S 114th St
88thAveS
R
O
X
J
M
J
C
R
J
X
L L
X
C
L
L
F
X
X
L
J
J
L
L
L
JX
LC
LC
CLC
Lake Washington
CedarRiver
File Name: :HCEDPLANNINGGISgis_projectsshoreline_mgmt_program
4SMPmxds11G_shoreline_modifications_11x17_0709.mxd
Shoreline Modifications
Map 11-G
Actual Data Source: City of Renton 2009,
King County 2009 and ESA Adolfson.
0-No Structure Present
1-Less than 20 Feet
2-20 to 50 Feet
3-More than 50 Feet
Natural/Un-modified
Some Modification/Partially Vegetated
Hard Armoring Concrete
Hard Armoring Rock Wall
Hard Armoring Other
Alternatively Modified and Natural
Commercial/Industrial Shoreline
Restored Shoreline
C, Private Residential Docks, Covered
D, Private Residential Docks
F, Floats
J, Joint Use Private Residential Docks
L, Boat Lift
LC, Boat Lift and Covered Private Dock
M, Marina
O, Other Dock Structure
R, Major Boat Ramp Facility
X, No Dock
Shoreline Master Program Update
City of Renton
0 0.10.05
Miles
July 30, 2009
1: 3,000
This map depicts the approximate location and extent of areas subject to the SMP. The actual extent of
shoreline jurisdiction requires a site-specific valuation to indentify the ordinary high water line and
any associated wetlands. The location of the 20 cfs limit is from USGS (1998). Floodplain and floodway extent
are based on FEMA mapping. Wetland locations are approximate and based on existing city/regional inventories;
additional wetlands may be present that are not shown on the maps and some of the areas shown as
wetlands may not meet the wetland criteria.
This map makes no claim as to whether wetlands are associated with the shoreline or not.
24. RainierAve SDixon
Dr S
Forest Ave S
S Lakeridge Dr
Garden Pl S
Laurel Ln S
Rowan
R
dS
OakwoodAveS
S106thSt
S Sunnycrest Rd
79thAveS
Mission Dr S
Lotus Pl S
84thAveS
S Garden Pl
S Laurel St
S Lakeri
dge
Dr
Forest Ave S
Garden Pl S
X
O
C
L
X
C
C
D
D
X
D
L
C
D
D
L
O
L
L
L
LC
C
D
D
D
D
L
D
X
L
X
LC
D
LC
D
LC
D
L
D
LC
X
D
D
D
D
D
D
D
D
LC
D
D
LC
L
D
D
D
F
C
C
LC
C
LC
LC
LC
LC
X
Lake Washington
File Name: :HCEDPLANNINGGISgis_projectsshoreline_mgmt_program
mxds6SMP11H_shoreline_modifications_11x17_0210.mxd
Shoreline Modifications
Map 11-H
Actual Data Source: City of Renton 2009,
King County 2009 and ESA Adolfson.
0-No Structure Present
1-Less than 20 Feet
2-20 to 50 Feet
3-More than 50 Feet
Natural/Un-modified
Some Modification/Partially Vegetated
Hard Armoring Concrete
Hard Armoring Rock Wall
Hard Armoring Other
Alternatively Modified and Natural
Commercial/Industrial Shoreline
Restored Shoreline
C, Private Residential Docks, Covered
D, Private Residential Docks
F, Floats
J, Joint Use Private Residential Docks
L, Boat Lift
LC, Boat Lift and Covered Private Dock
M, Marina
O, Other Dock Structure
R, Major Boat Ramp Facility
X, No Dock
Shoreline Master Program Update
City of Renton
0 0.10.05
Miles
February 8, 2010
1: 3,000
This map depicts the approximate location and extent of areas subject to the SMP. The actual extent of
shoreline jurisdiction requires a site-specific valuation to indentify the ordinary high water line and
any associated wetlands. The location of the 20 cfs limit is from USGS (1998). Floodplain and floodway extent
are based on FEMA mapping. Wetland locations are approximate and based on existing city/regional inventories;
additional wetlands may be present that are not shown on the maps and some of the areas shown as
wetlands may not meet the wetland criteria.
This map makes no claim as to whether wetlands are associated with the shoreline or not.