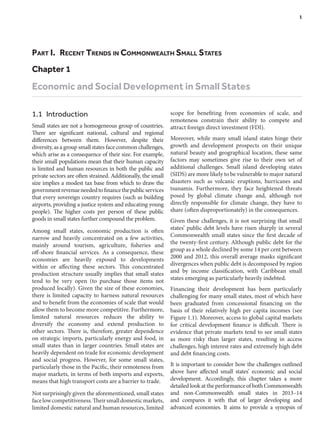
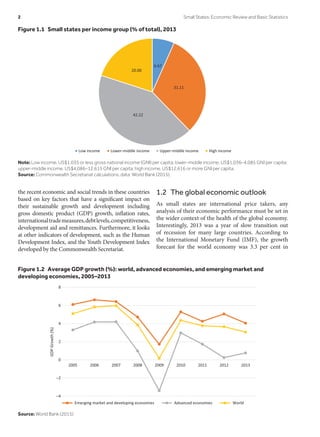
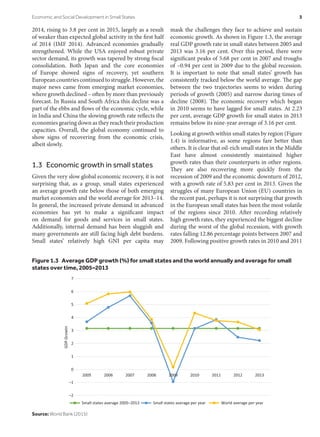
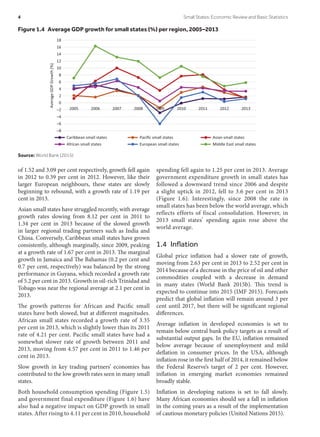
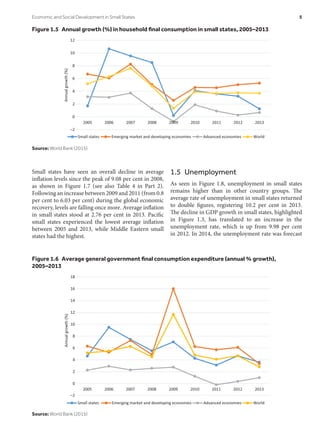
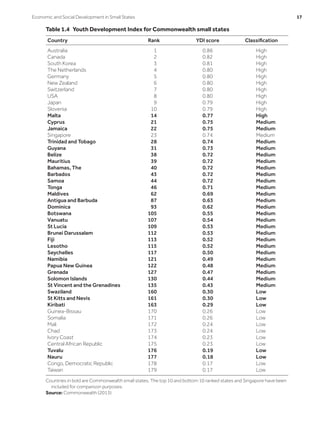
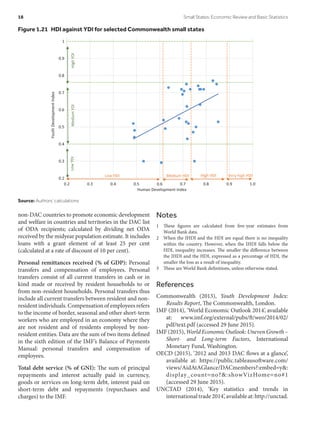
This document summarizes recent economic and social trends in small states. It finds that while small states experienced average GDP growth of 3.4% annually from 2005-2013, growth has slowed since the global financial crisis. Inflation has declined but unemployment remains high in some regions. Trade is important for small states but most engage primarily in intraregional trade. Development aid and remittances are significant sources of income. Human development as measured by the HDI has improved, but inequality and youth unemployment require more attention according to indices.

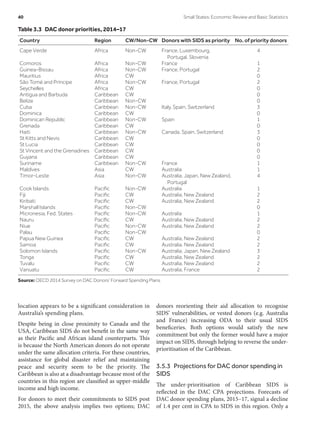
![Country programmable aid: Introduced by the DAC
in 2007, CPA is the portion of aid actually transferred
to developing countries. It is aid on which recipient
countries have, or could have, a significant say and
for which donors should be accountable for delivering
‘as programmed’. It is calculated as ODA minus
unpredictable aid (e.g. humanitarian and debt relief),
in-donor costs (e.g. administration, student costs and
refugee spending) and non-sector allocable aid (e.g.
food aid, funding to non-governmental organisations
and ODA equity investments).
Differentiated discount rates: The interest rate
calculated to reflect the level of concessionality to
be applied to a loan extended under the OECD
Arrangement on Officially Supported Export Credits.
Under the new arrangements for concessionality, the
term will also refer to the discount interest rate to
be applied in calculating grant elements on loans to
eligible OECD DAC recipients.
Concessionality: Reflects the benefit extended to
the borrower when comparing the terms of the
concessional loan and a loan at market rates. An
OECD loan under the 2013 OECD framework must
possess a grant element of 25 per cent to be counted
as concessional.
Discount rate (reference rate): Generally used to
calculate the opportunity costs of holding money
today relative to some period in the future. With
respect to OECD grant element calculation, it allows
for an assessment of the opportunity costs to donors
of lending at a concessional rate rather than lending at
the market rate at which they would have been able to
invest the same funds. The reference rate is, therefore,
an interest rate that reflects average expected current
and future market conditions.
Grant element/grant equivalent: The grant element is
a calculation of the difference between what a borrower
must pay at the concessional interest rate and at the
discount/reference rate. It is calculated as the principal
loan value, minus the sum of the discounted cash flow
repayments, divided by the principal face value. The
grant equivalent of the loan is the calculated grant
element, which differs according to the discount rate,
loan maturity and principal value.
Market instrument: Refers to lending mechanisms
used in capital markets where ‘capital market’ denotes
the market through which long-term funds are raised.
Public guarantees: An instrument used by donor
governments to facilitate loans to developing countries,
which requires the public guarantor to agree to repay
the outstanding loan balances in the event that the
borrowing country defaults.
Subsidy: Some type of concession, whether it be a grant
or interest rate reduction on a loan to a borrowing
country.
Notes
1 Author’s assumption based on CPA projections (Ericsson, F
and S Steensen. 2014. The Global Outlook on Aid: Results of
the 2014 DAC Survey on Donors’ Forward Spending Plans
and Prospects for Improving Aid Predictability. Organisation
for Economic Co-operation and Development. DCD/DAC
[2014]53). Note: CPA is only a component of ODA and
therefore the actual projection for ODA could be larger or
smaller than 2.4 per cent.
2 OECD (2014). Final Communiqué, DAC High Level Meeting.
15-16 December. OECD Conference Centre, Paris.
3 The DAC will continue to report loans on a gross basis alongside
the grant equivalent basis, and to report disbursements and
reflows (principal + interest) to compute gross and net ODA
flows. The changes will become the standard from 2018. In the
period 2015 to 2017, ODA will be reported on both a gross and
grant equivalent basis.
4 To review discount rates and grant element thresholds in order
to reflect changes in borrowing costs, emerging experience
with risk and any need for further incentives for countries
most in need.
5 Anguilla is a Commonwealth member by association. The
country is a UK overseas territory.
6 Countries highlighted are members of the Commonwealth
7 The EU is recognised as a bilateral donor in the DAC. For the
purposes of this paper the EU is treated as a multilateral donor
in line with common practice.
8 Ericsson, F and S Steensen (2014). The Global Outlook on
Aid: Results of the 2014 DAC Survey on Donors Forward
Spending Plans and Prospects for Improving Aid Predictability.
Organisation for Economic Co-operation and Development.
DCD/DAC (2014)53.
9 List of priority countries for the EU, Japan and the US were not
available in the DAC Survey.
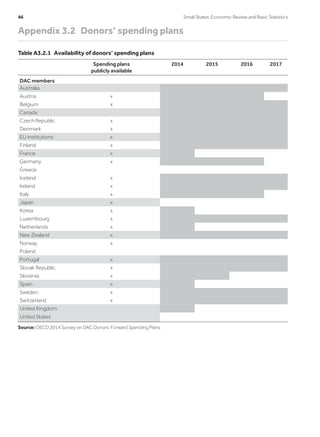
10 Where information from donors is not available, the DAC
estimates forward spending based on historical trends (see
Appendix 3.2, Table A3.2.1 for donors covered in the DAC
Survey).
44 Small States: Economic Review and Basic Statistics](https://image.slidesharecdn.com/6348da63-69bc-4ab1-b7e8-d674fd1de008-151117183315-lva1-app6891/85/Small-States-Economic-Review-and-Basic-Statistics-Volume-18-55-320.jpg)


![Presentation on update of macroeconomic framework for negotiations 2[1]](https://cdn.slidesharecdn.com/ss_thumbnails/presentationonupdateofmacroeconomicframeworkfornegotiations21-130812212223-phpapp01-thumbnail.jpg?width=640&height=640&fit=bounds)