Download as PDF, PPTX
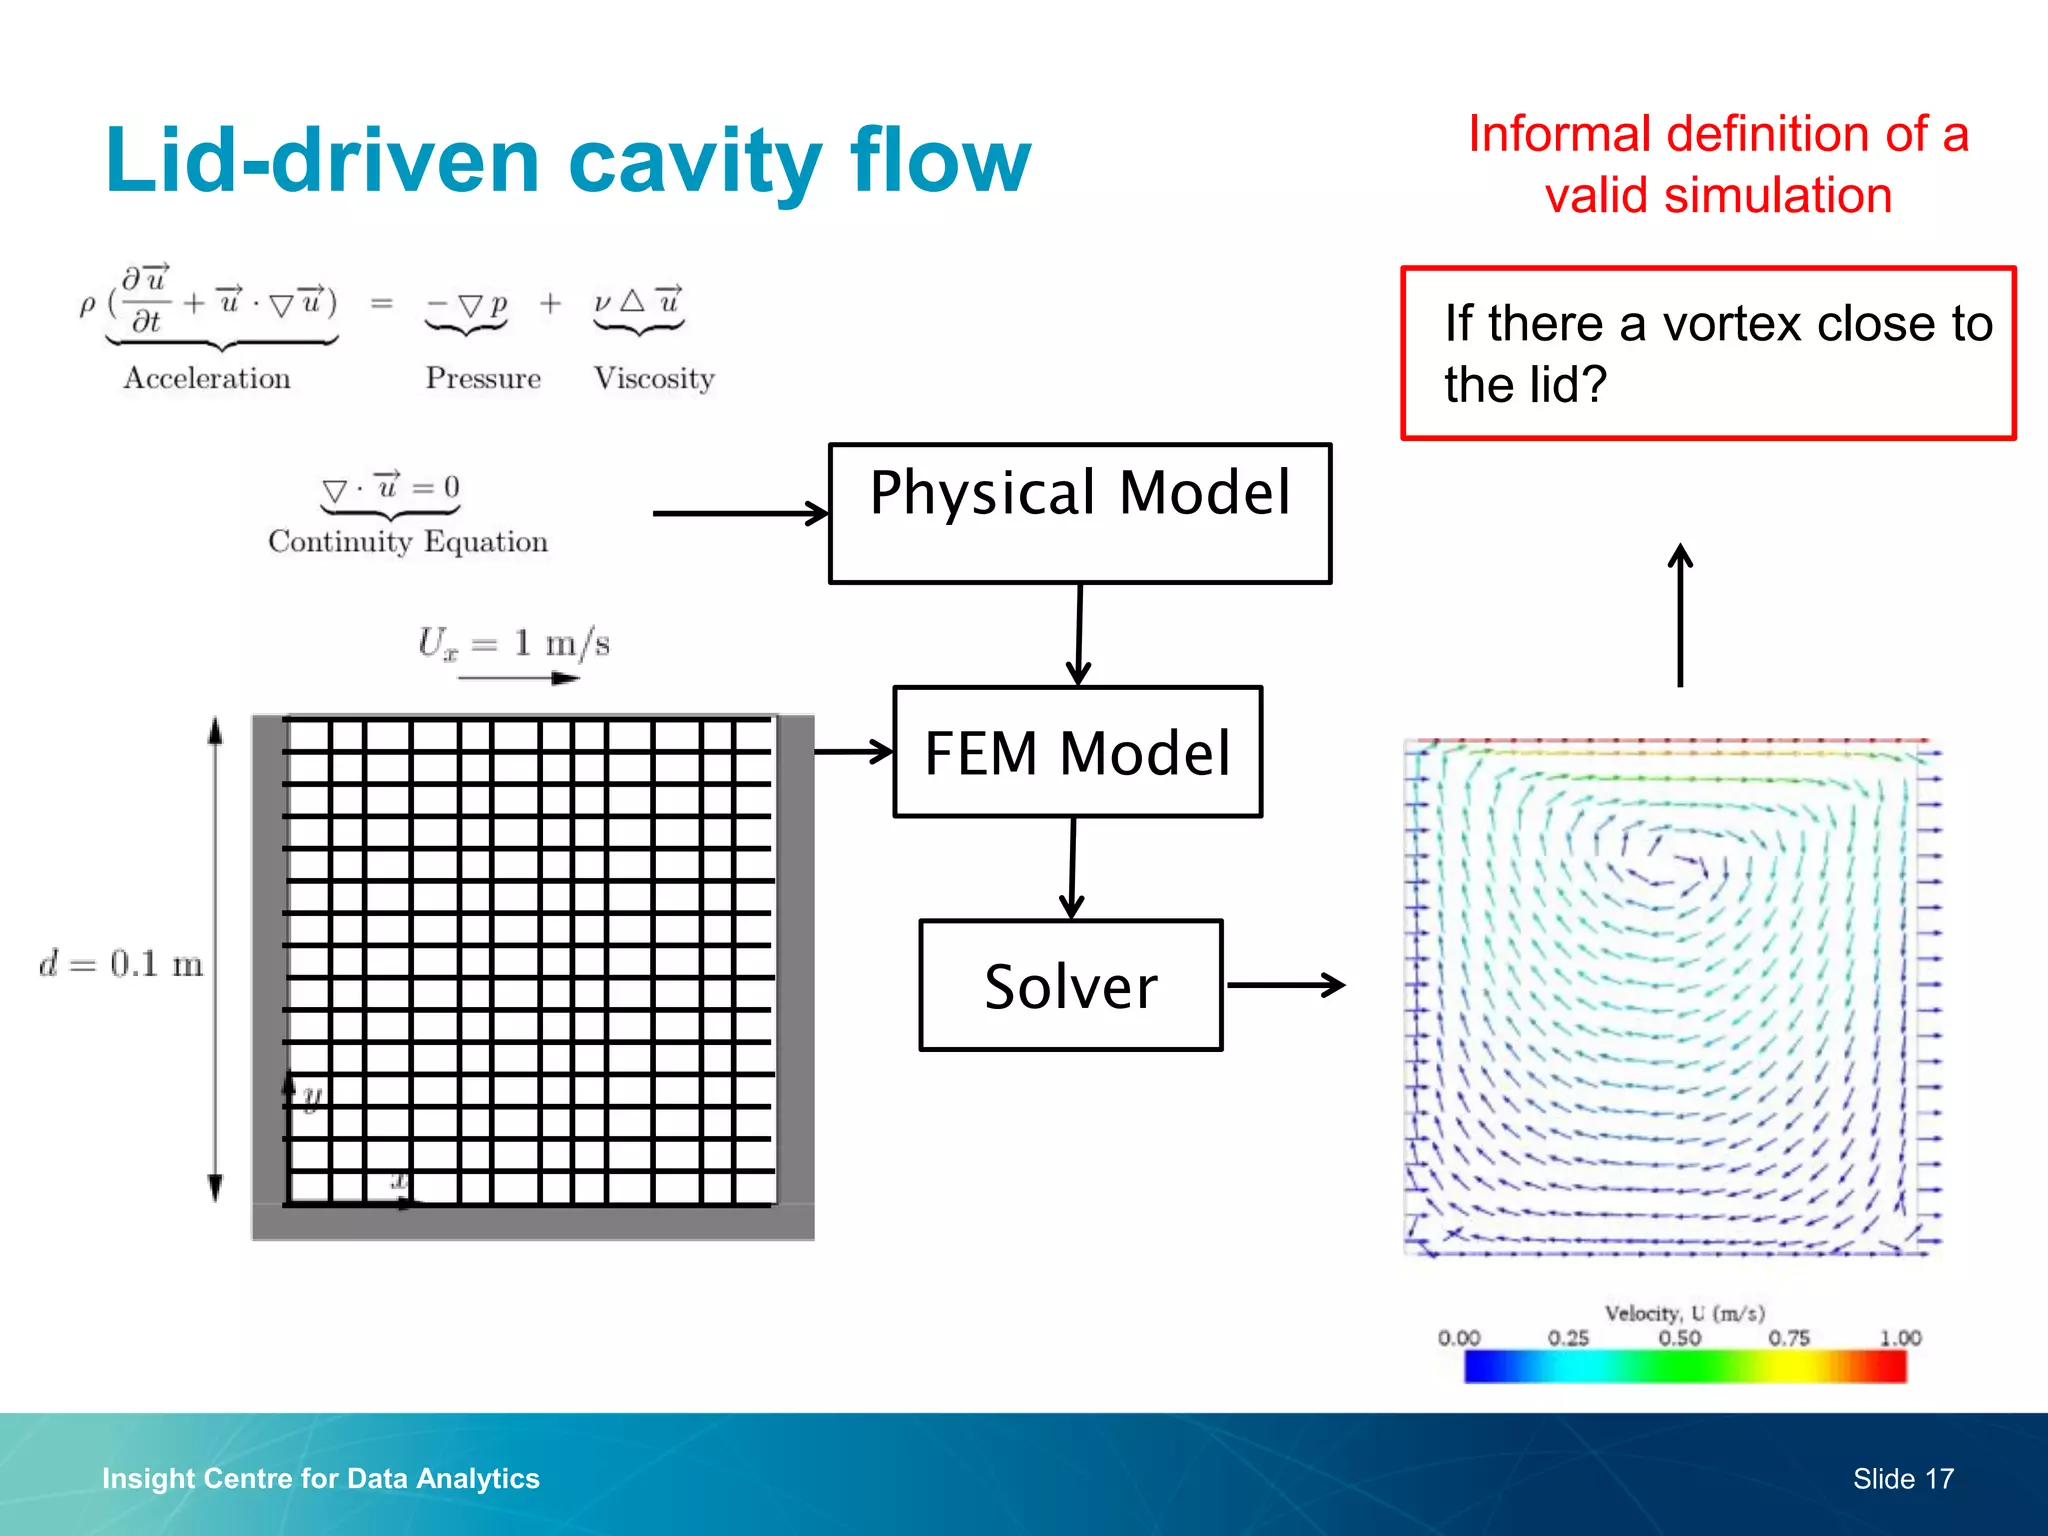
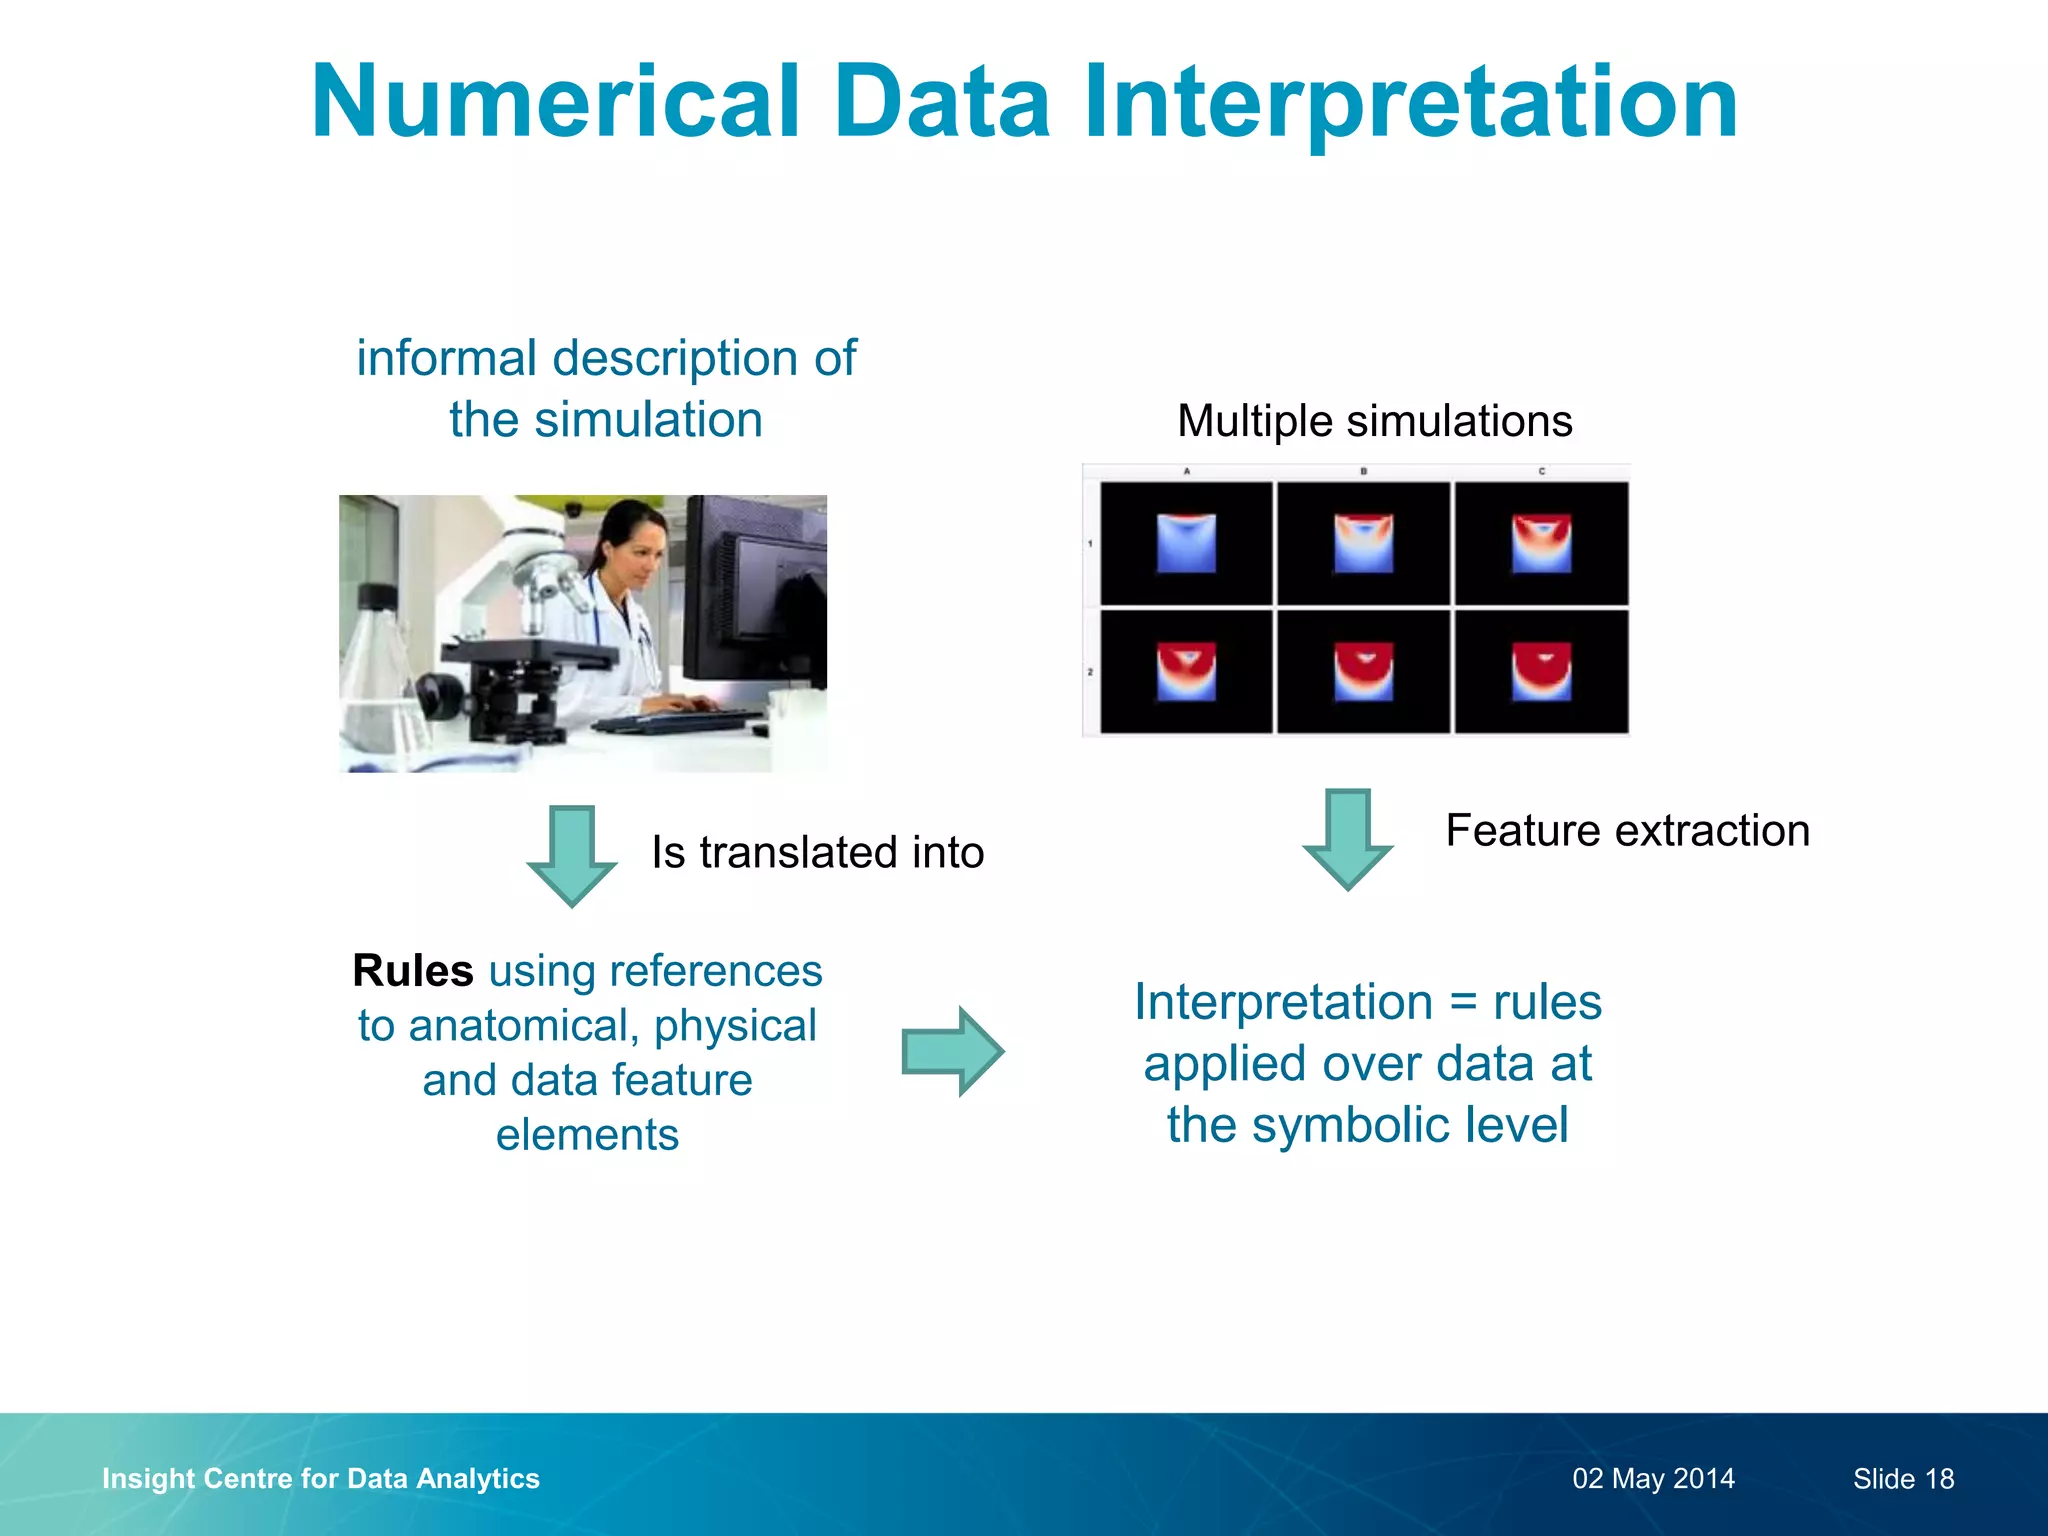
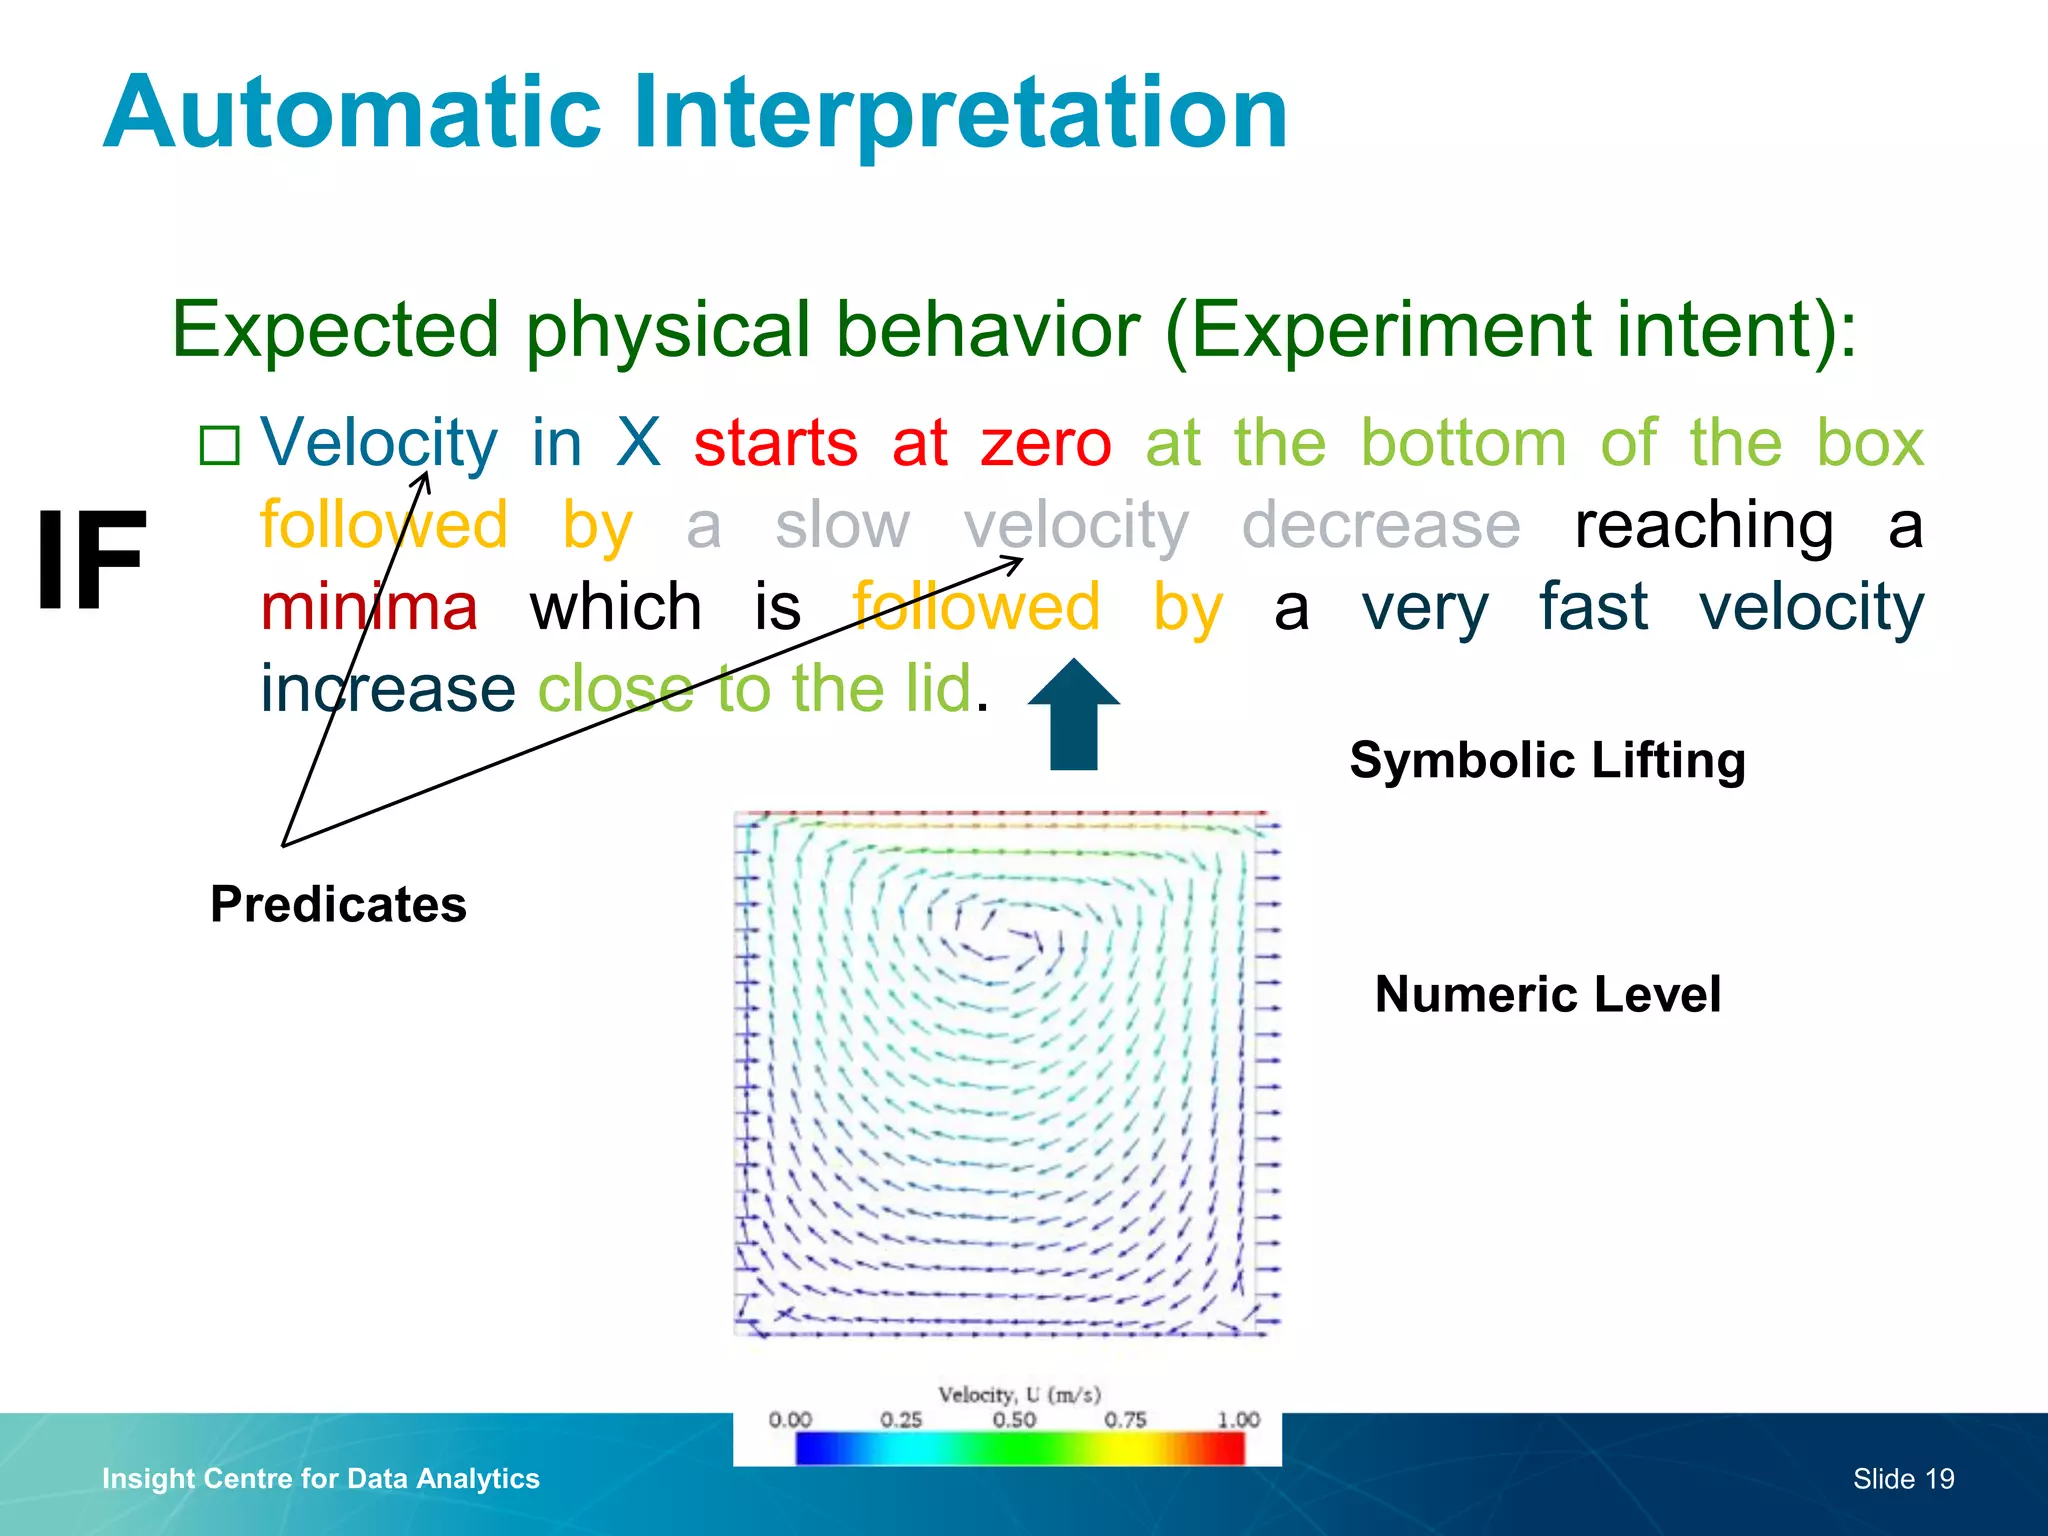
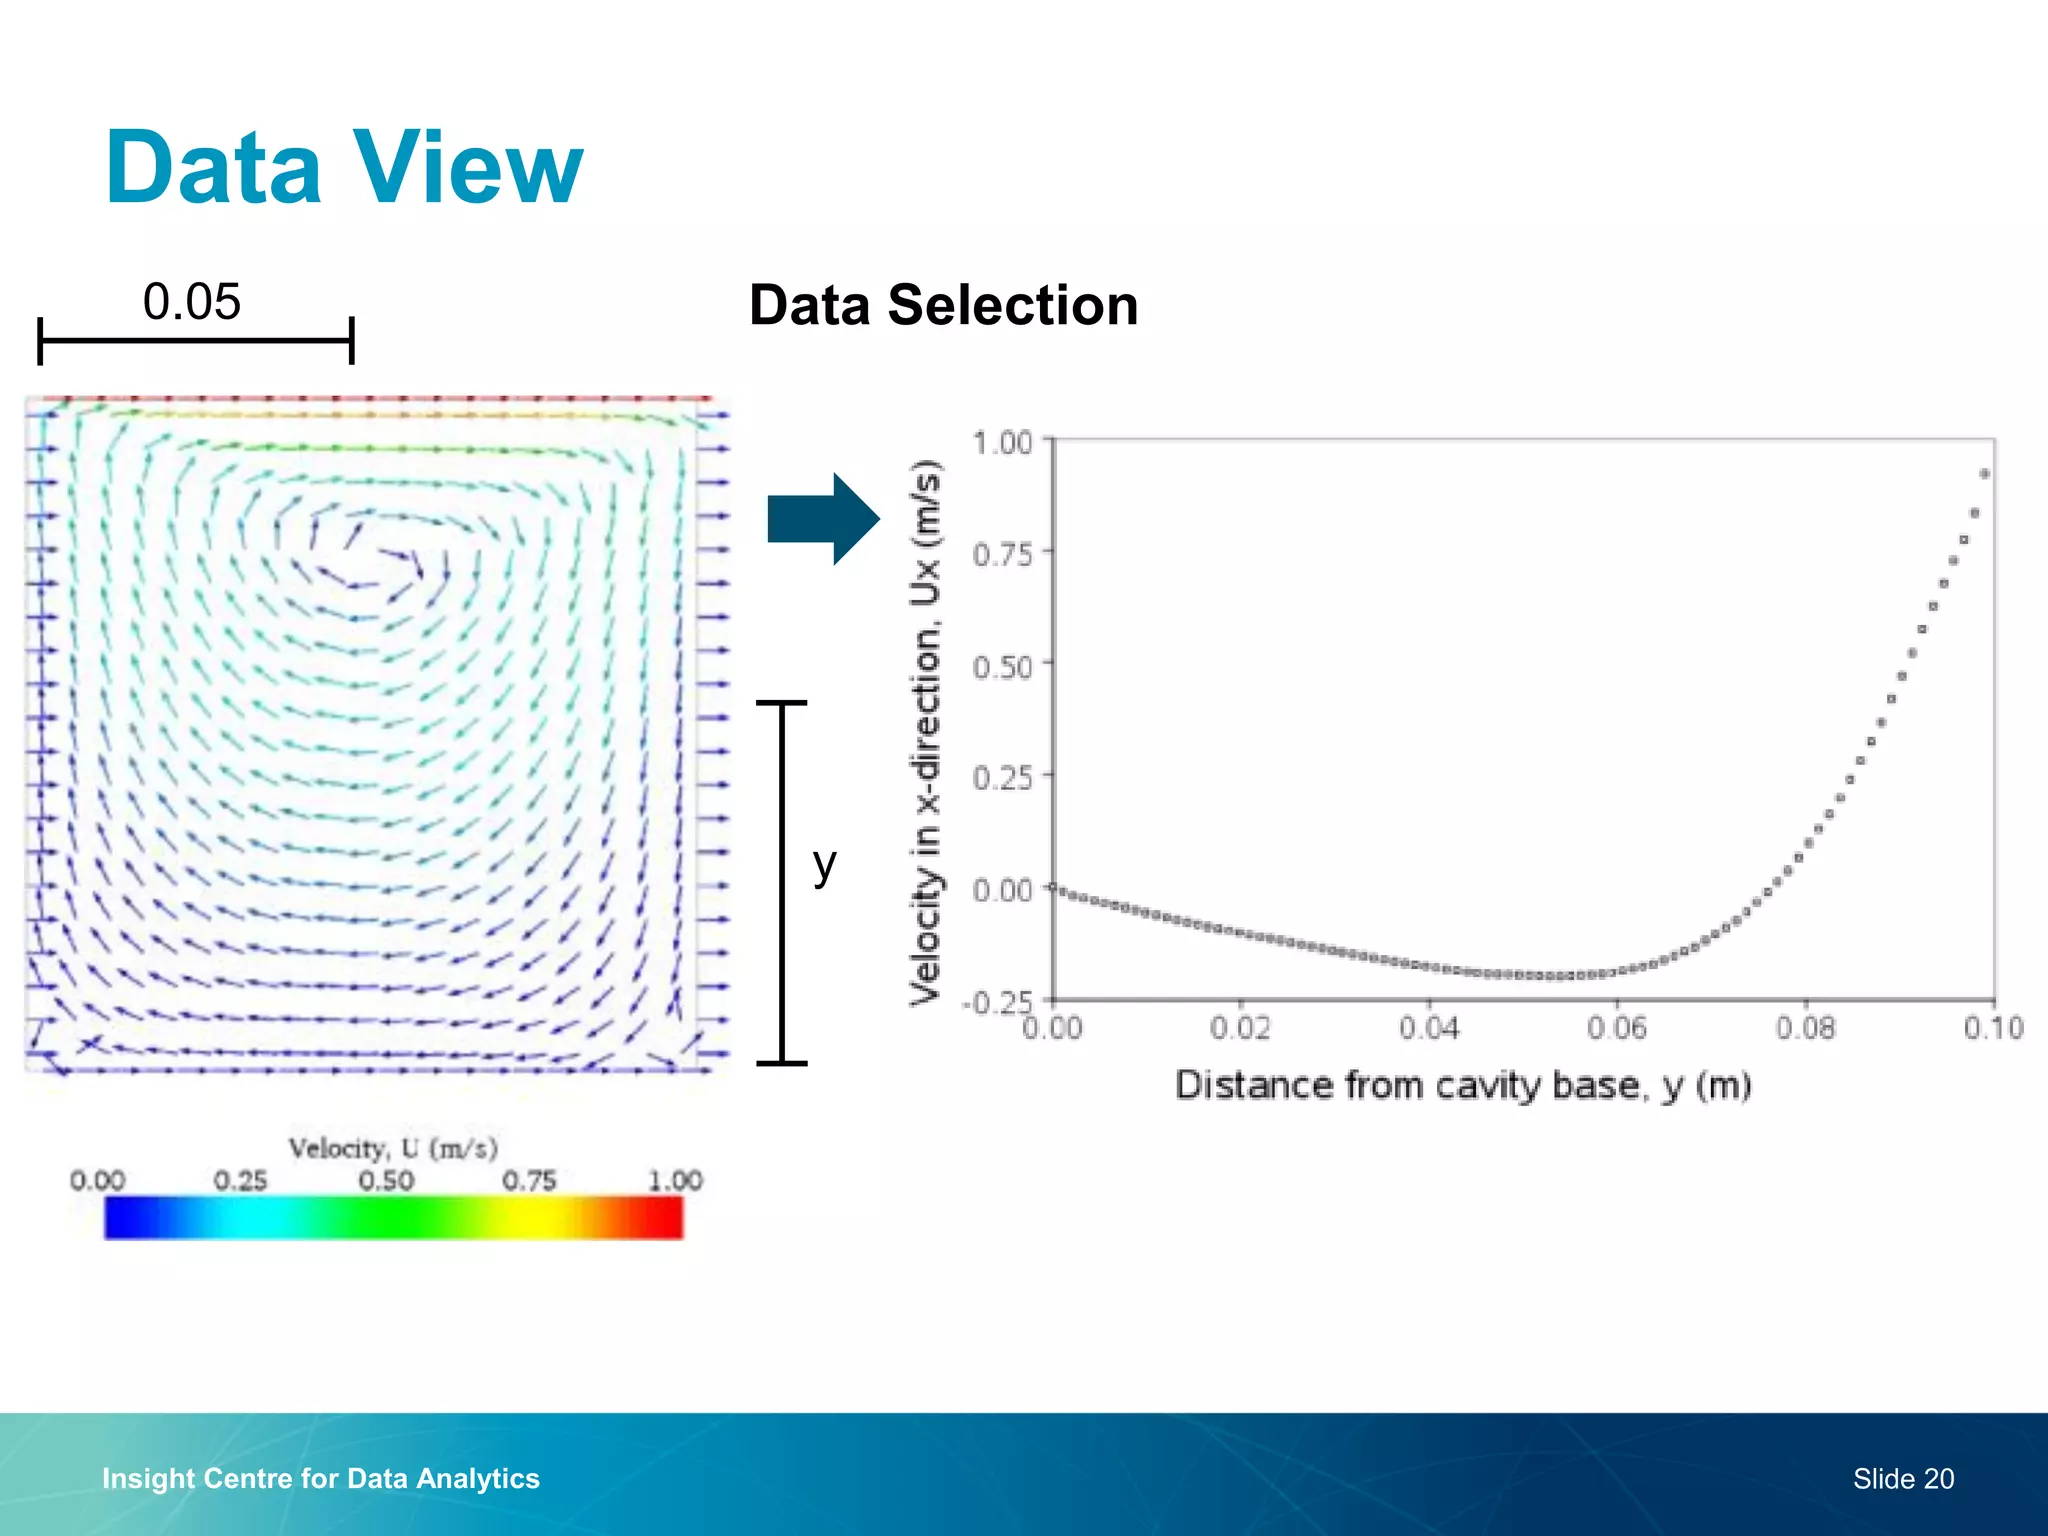
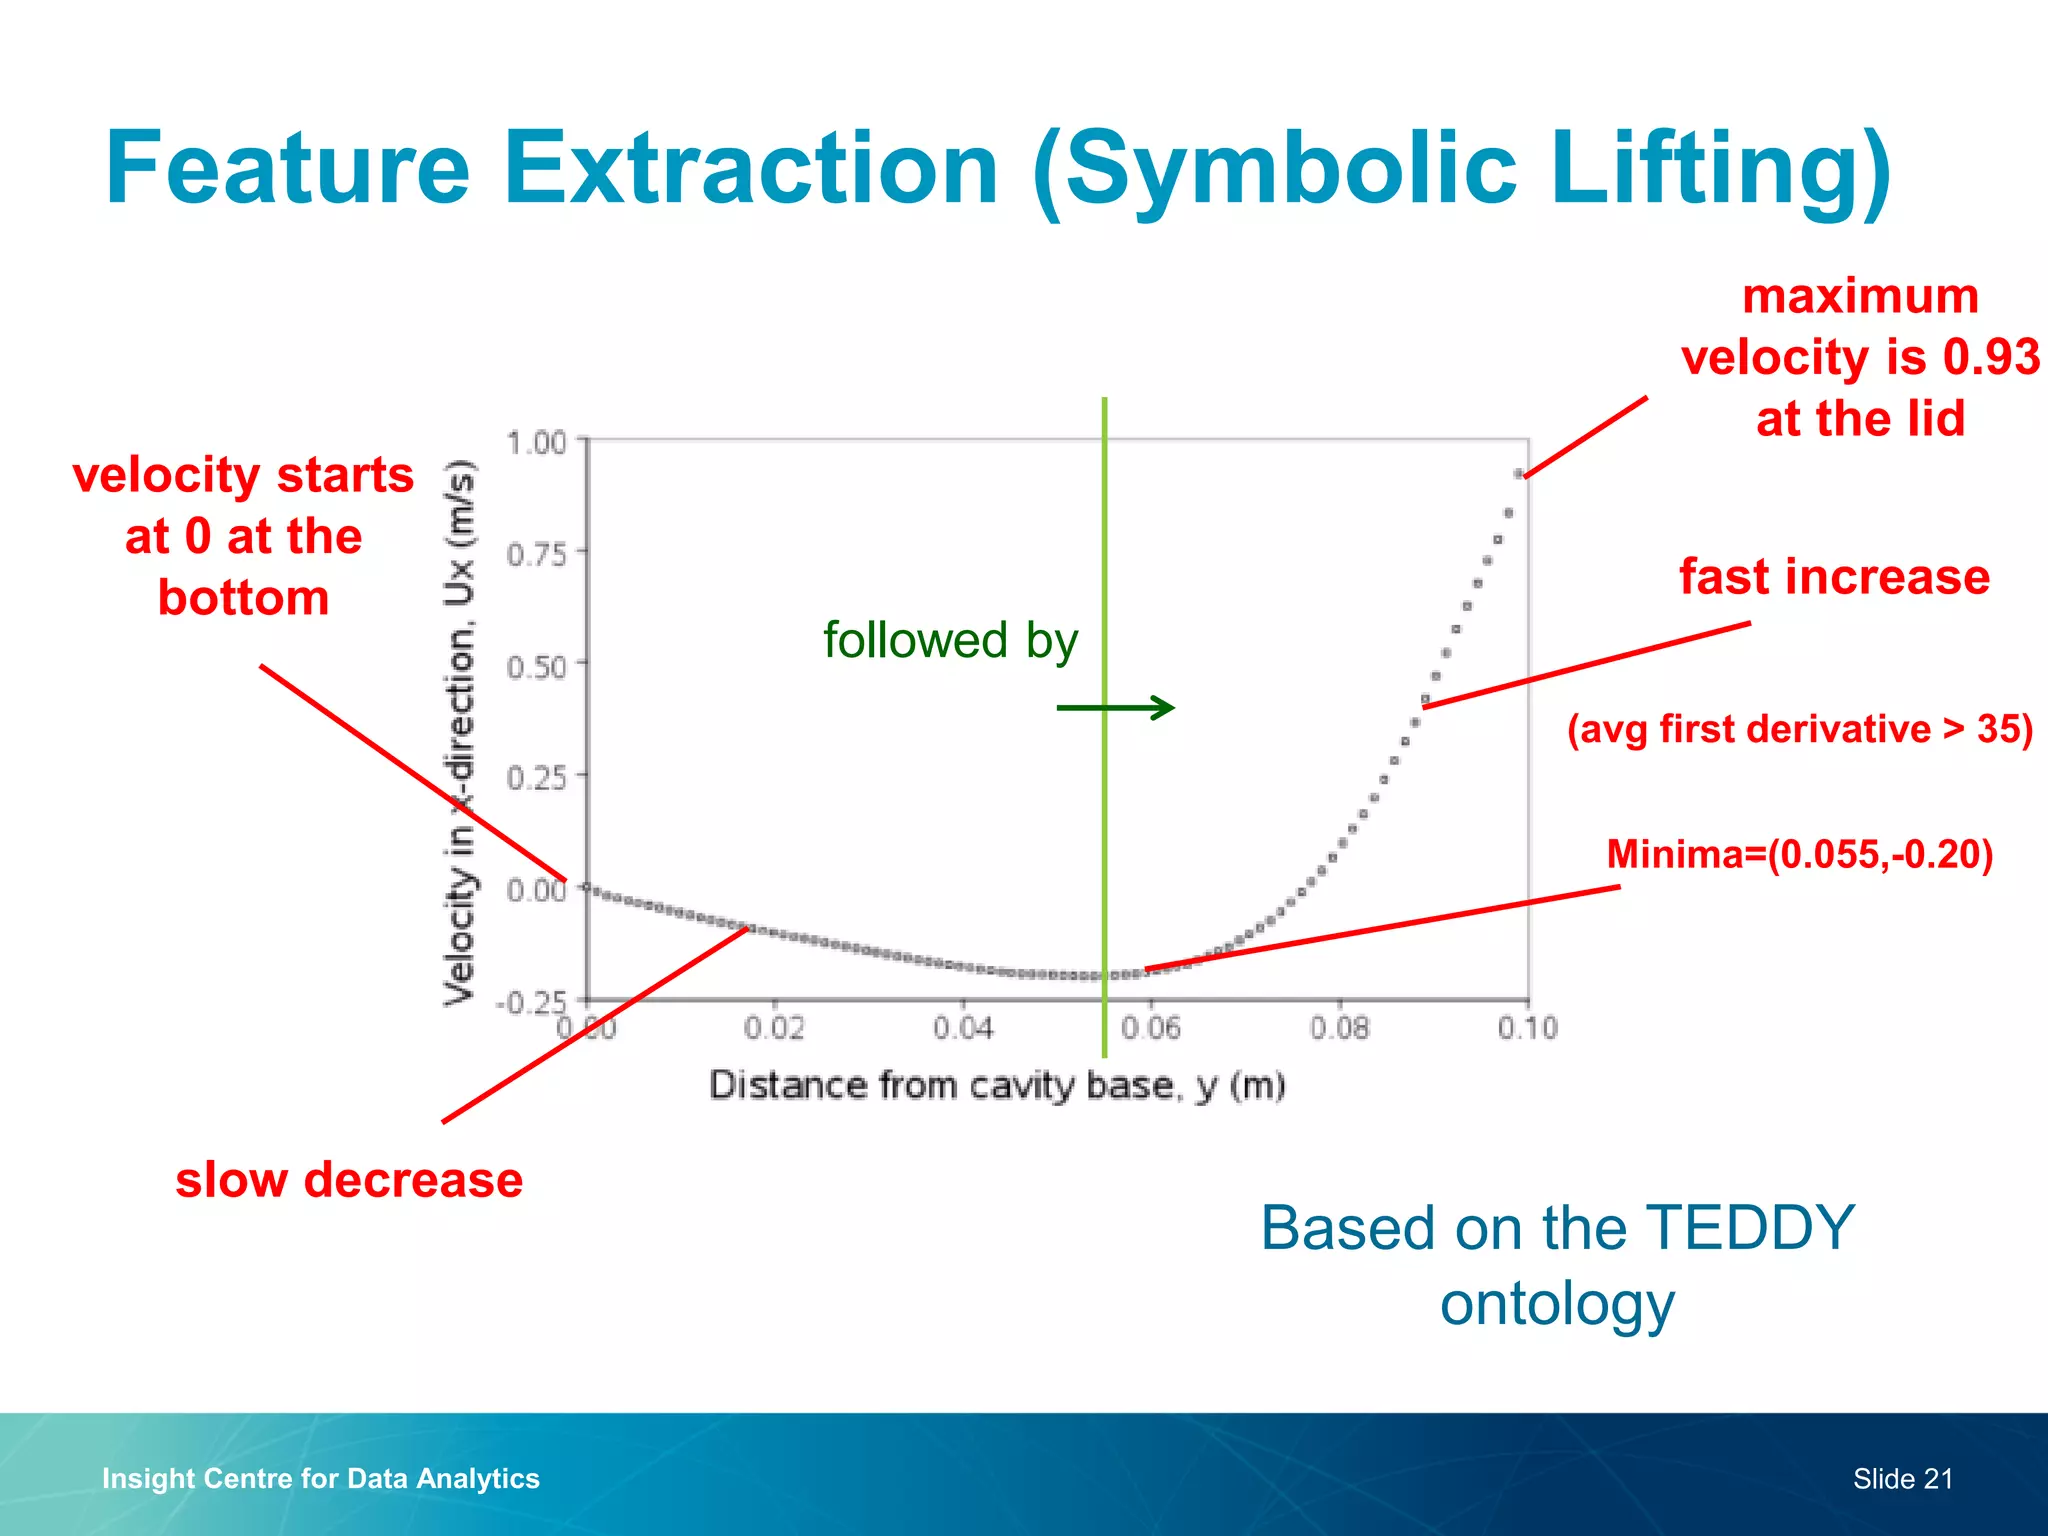
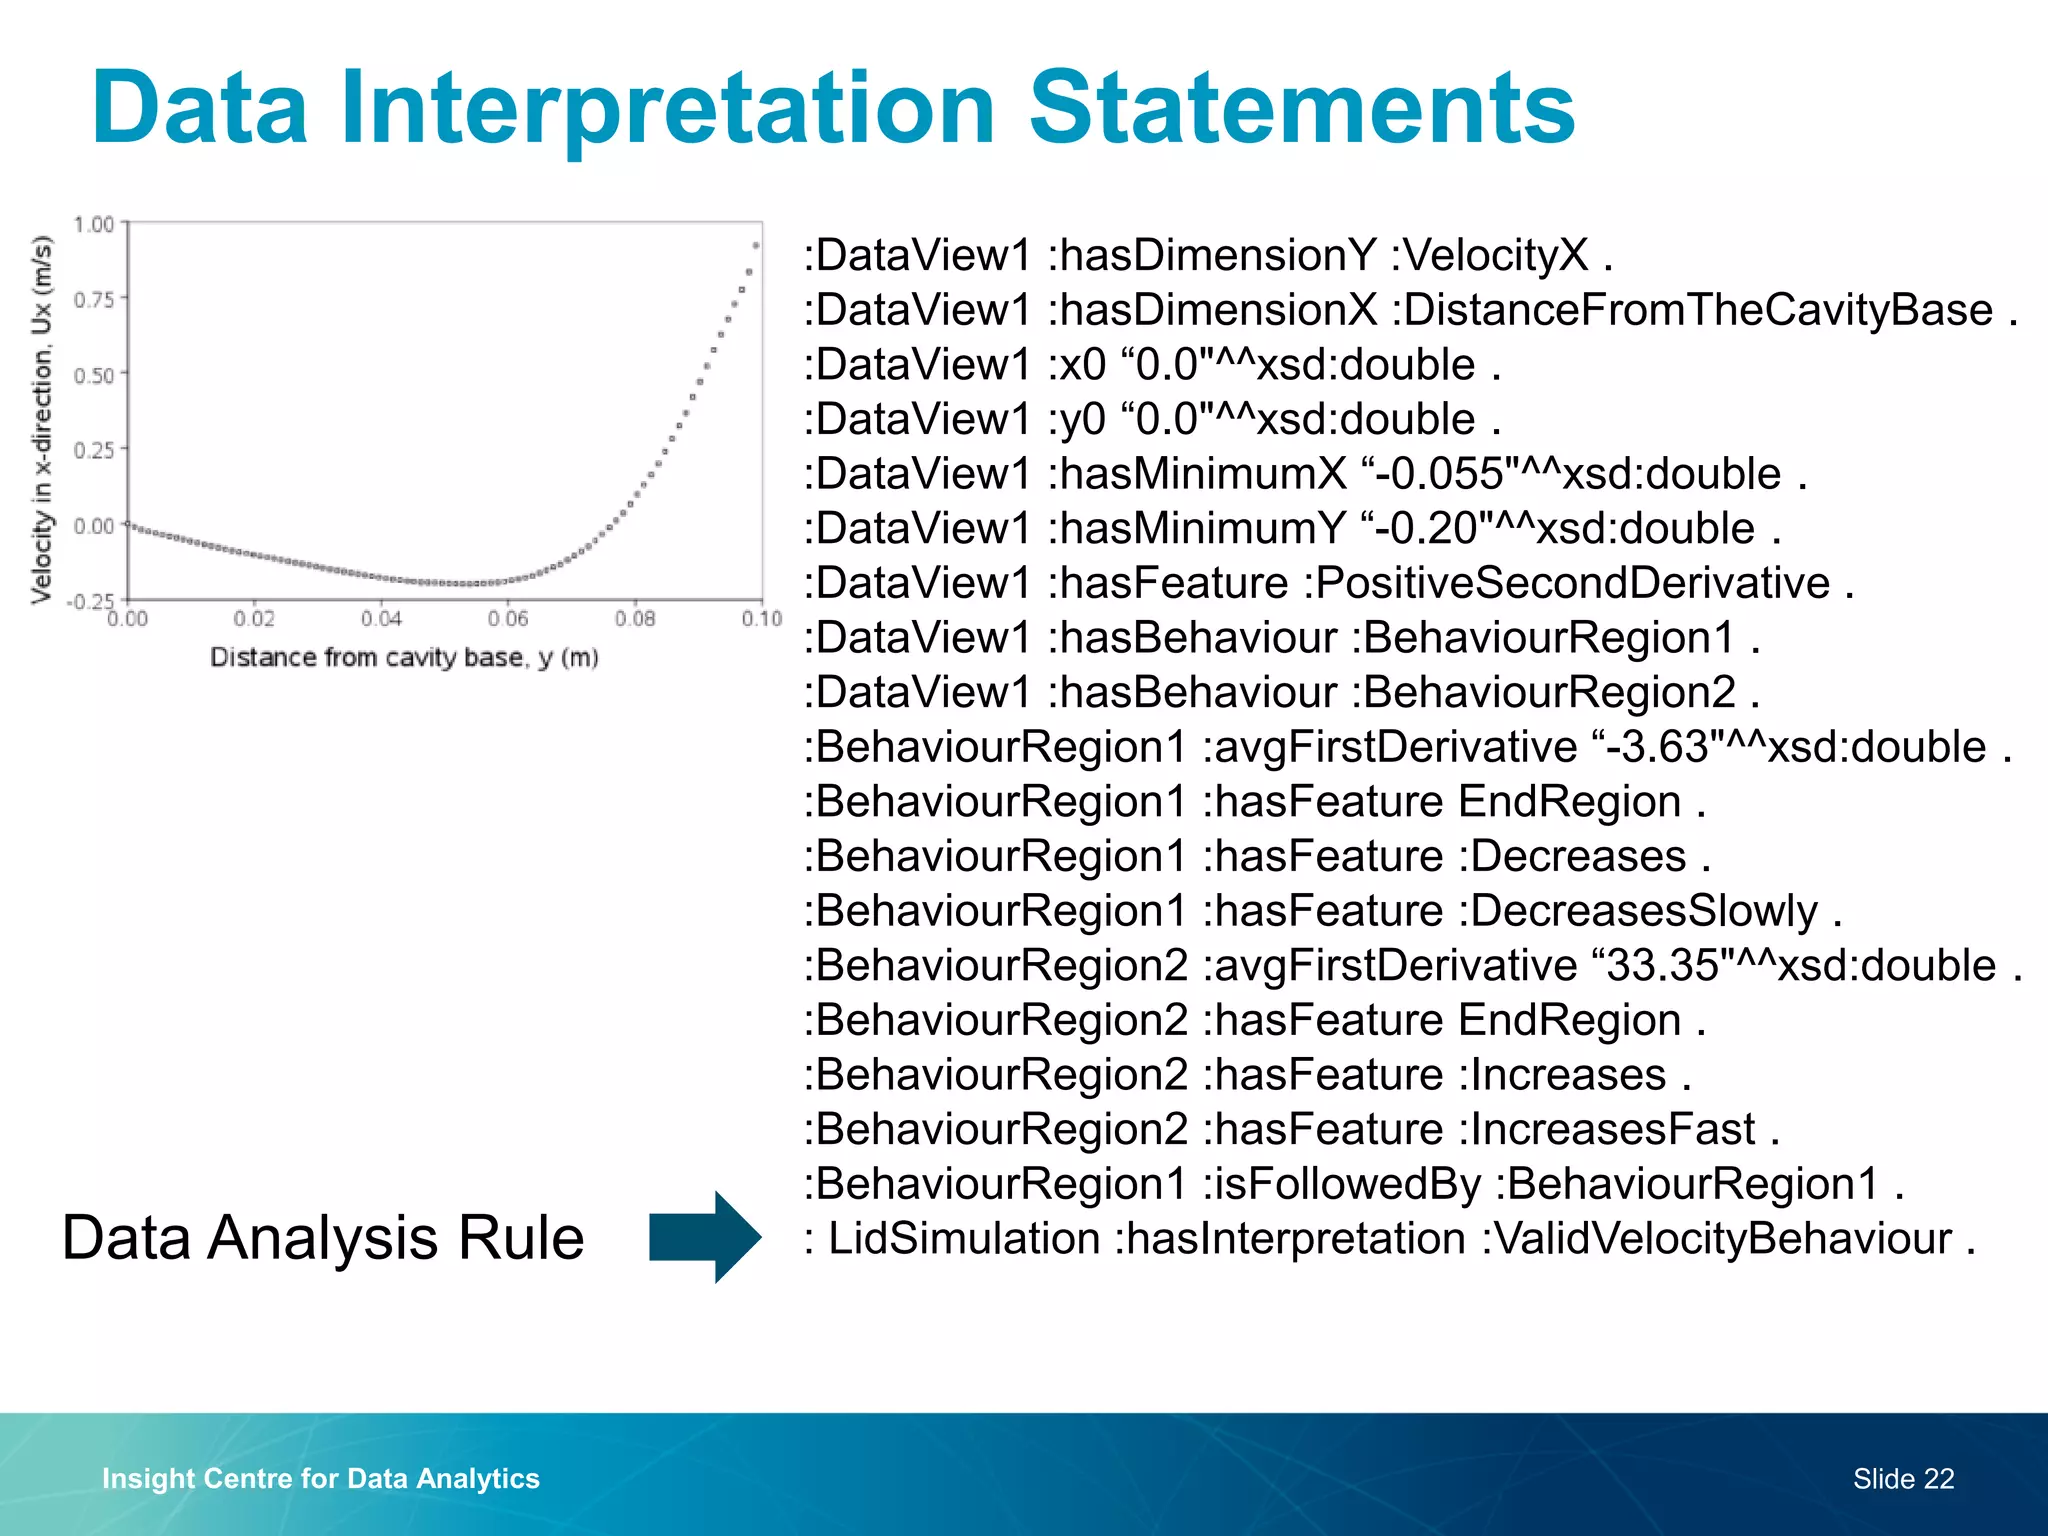
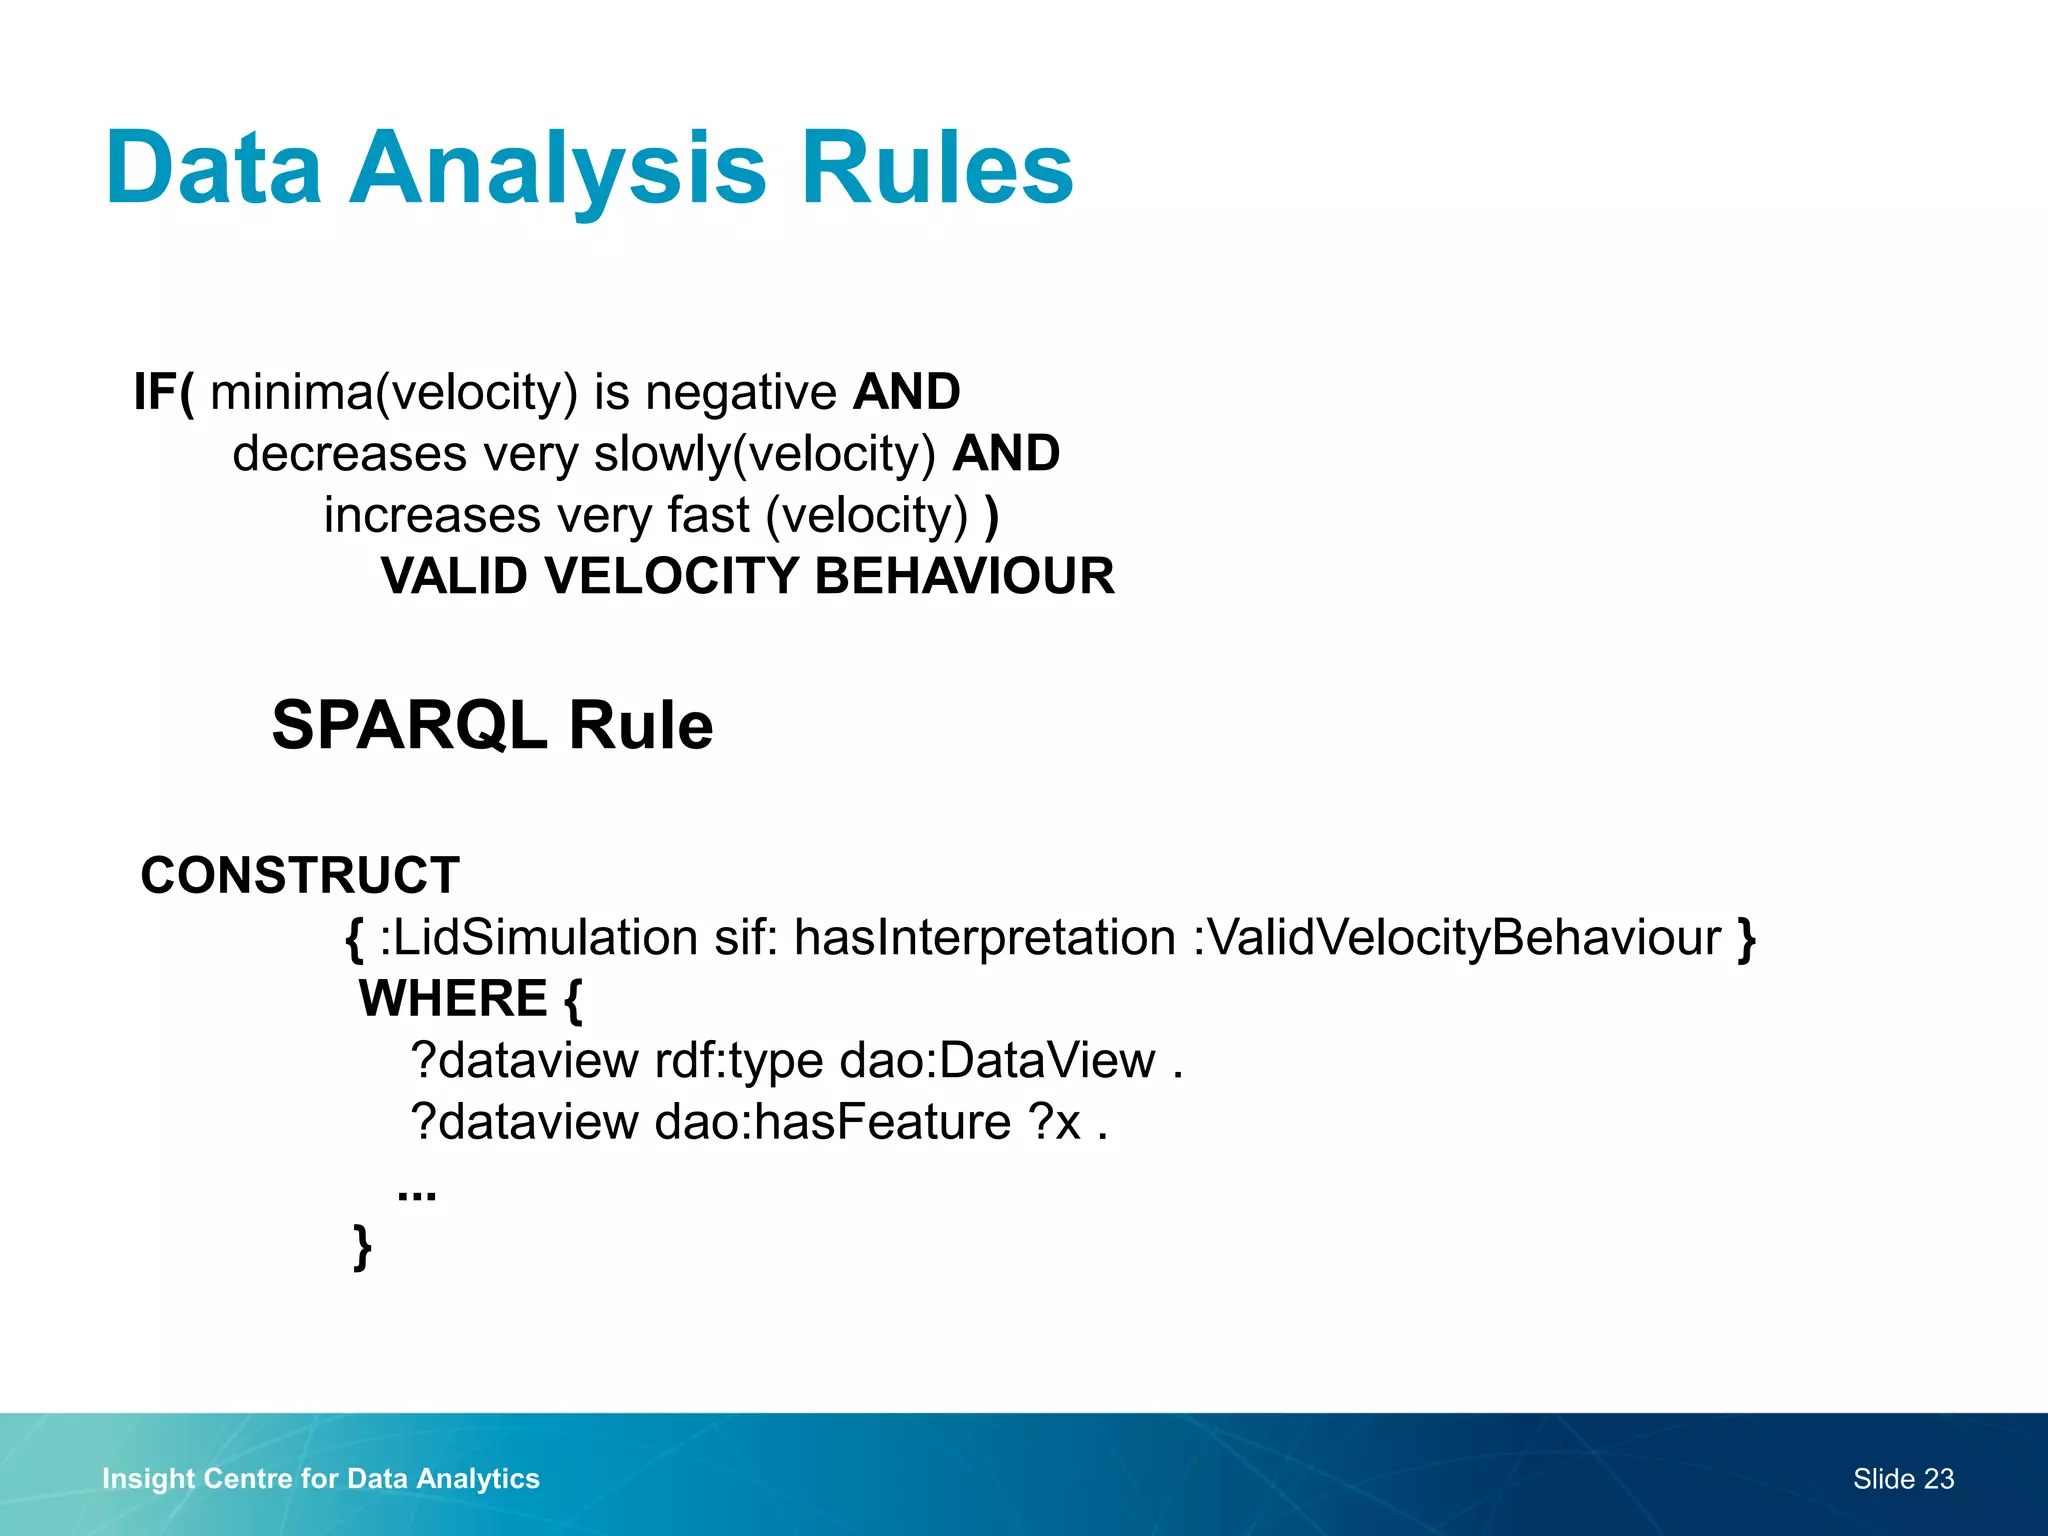
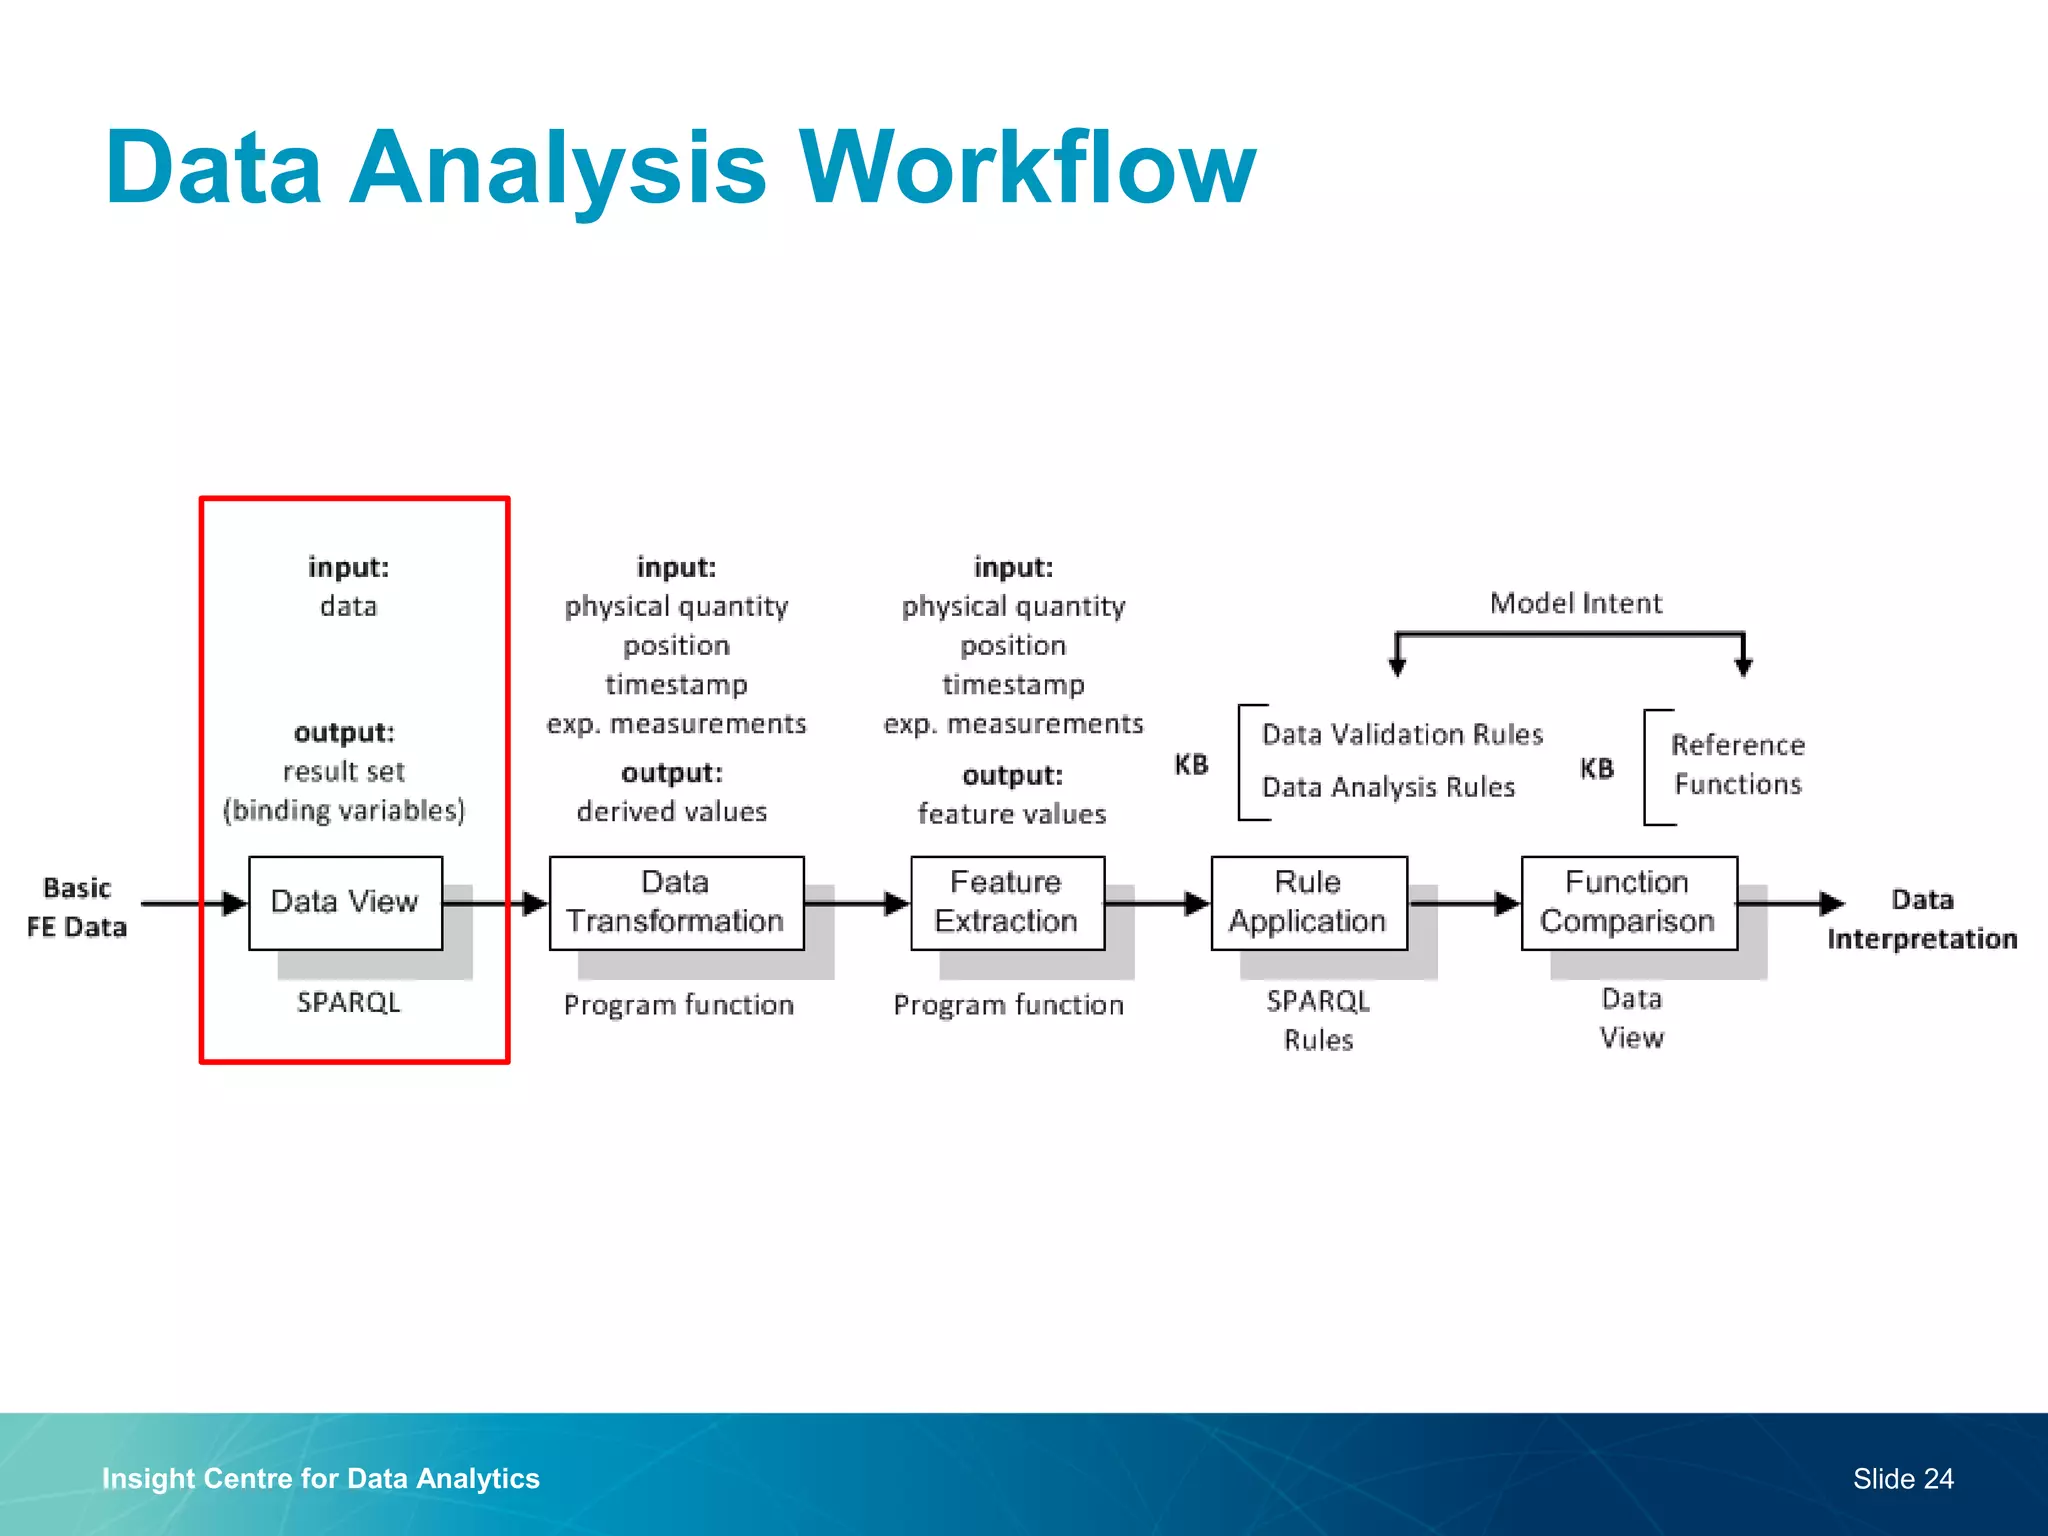
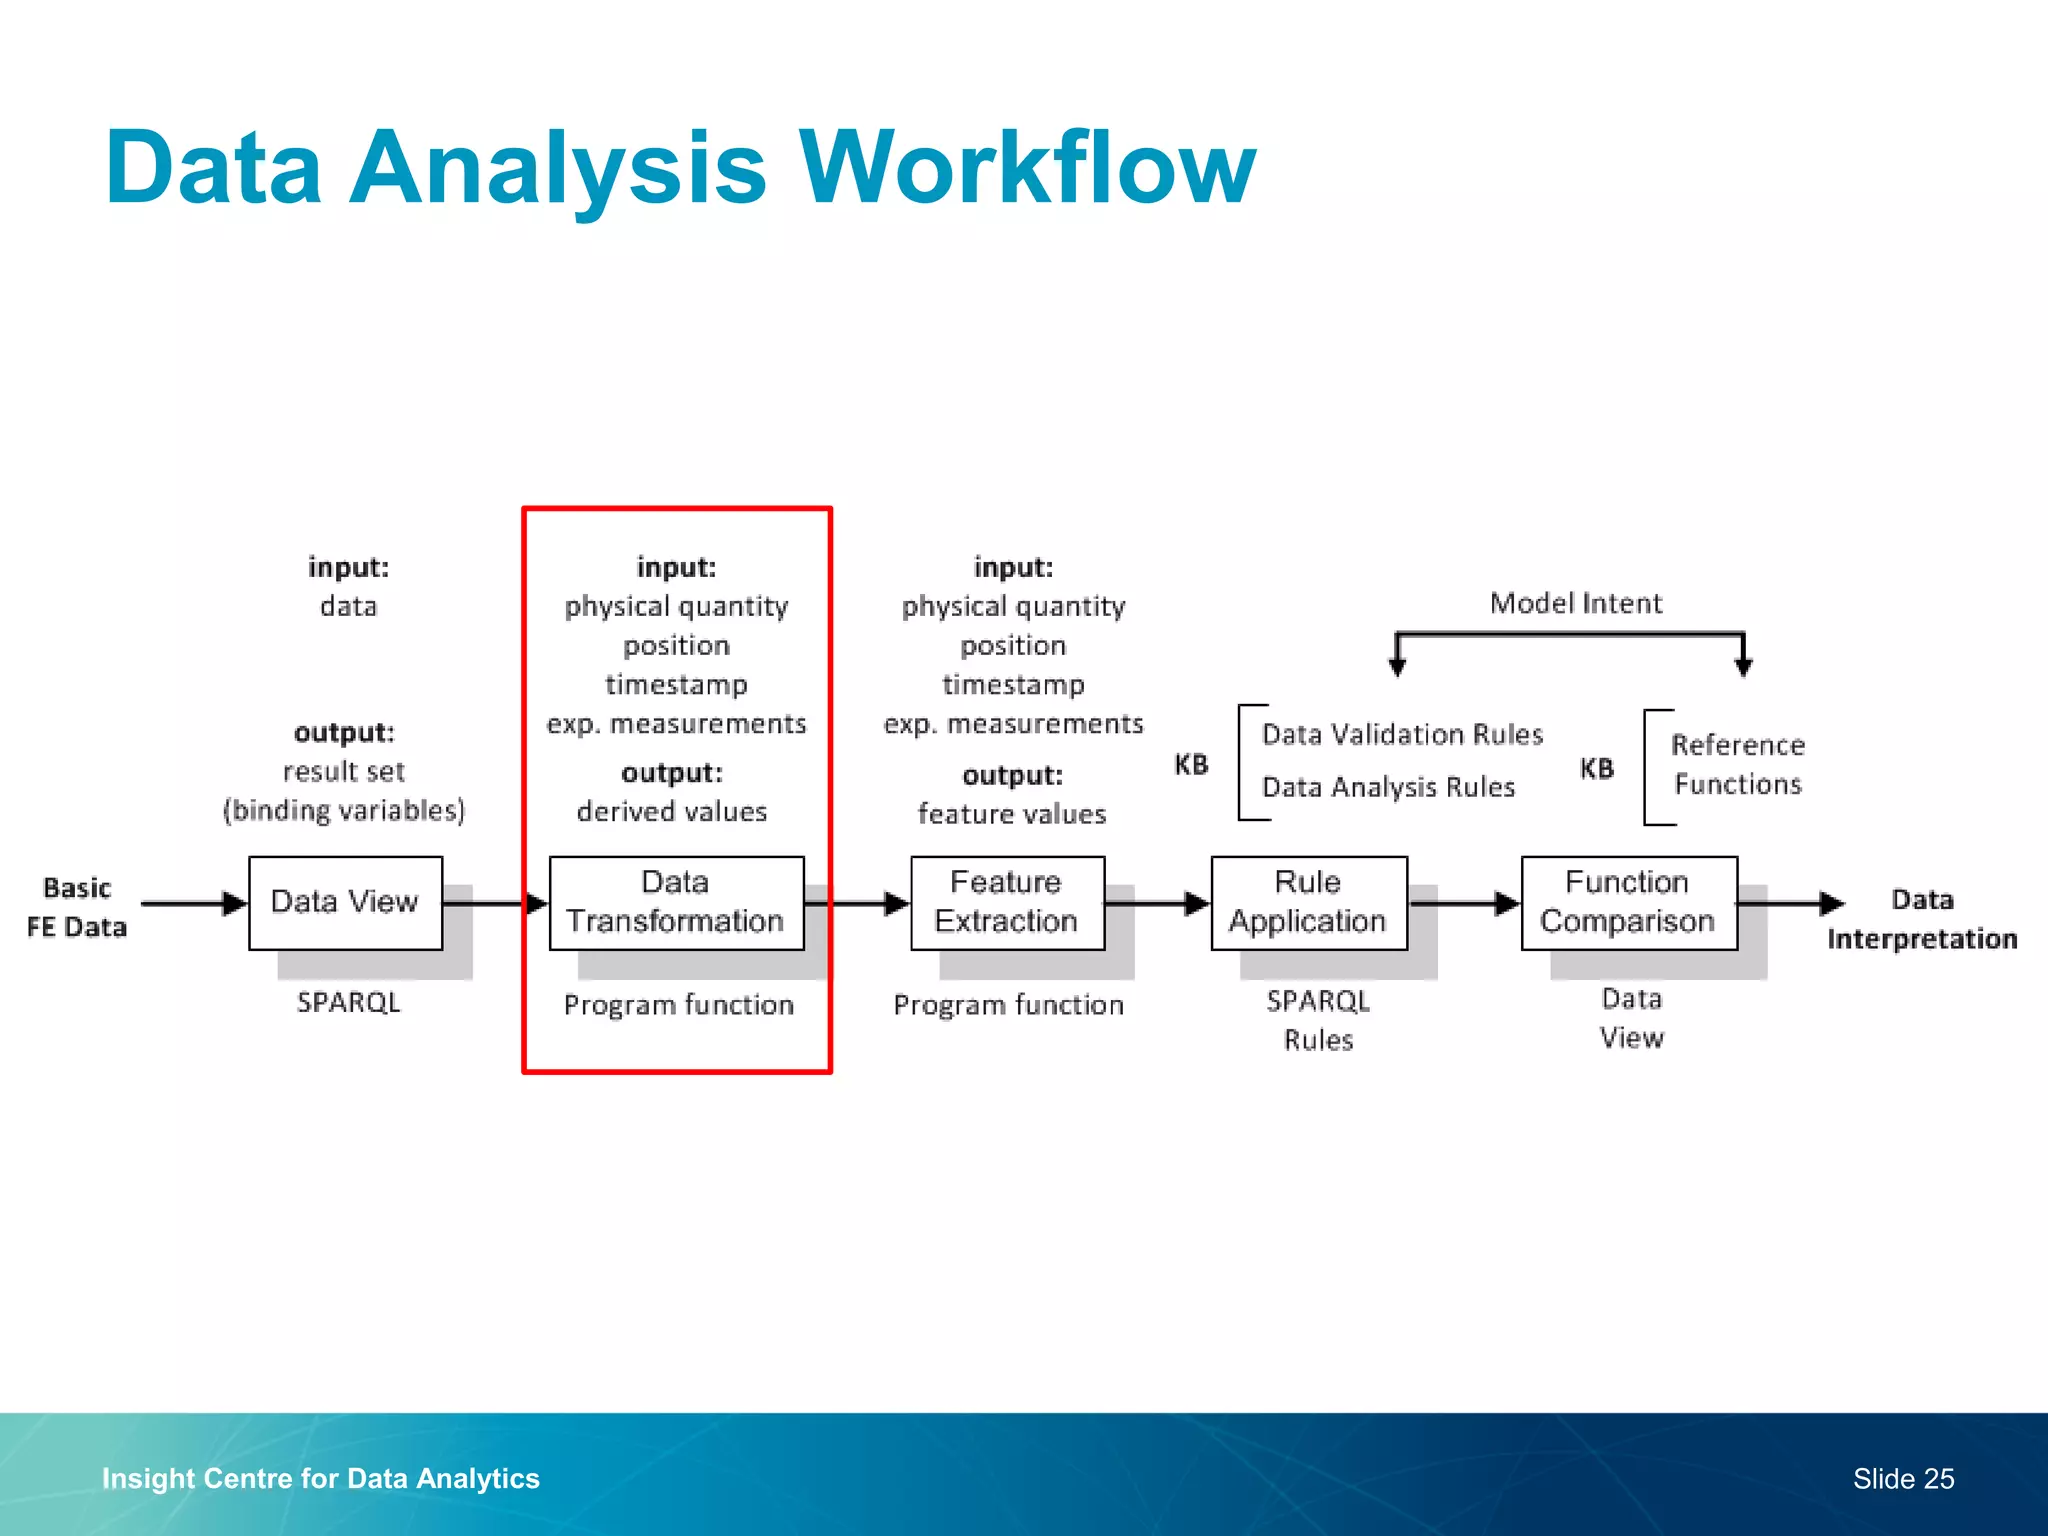
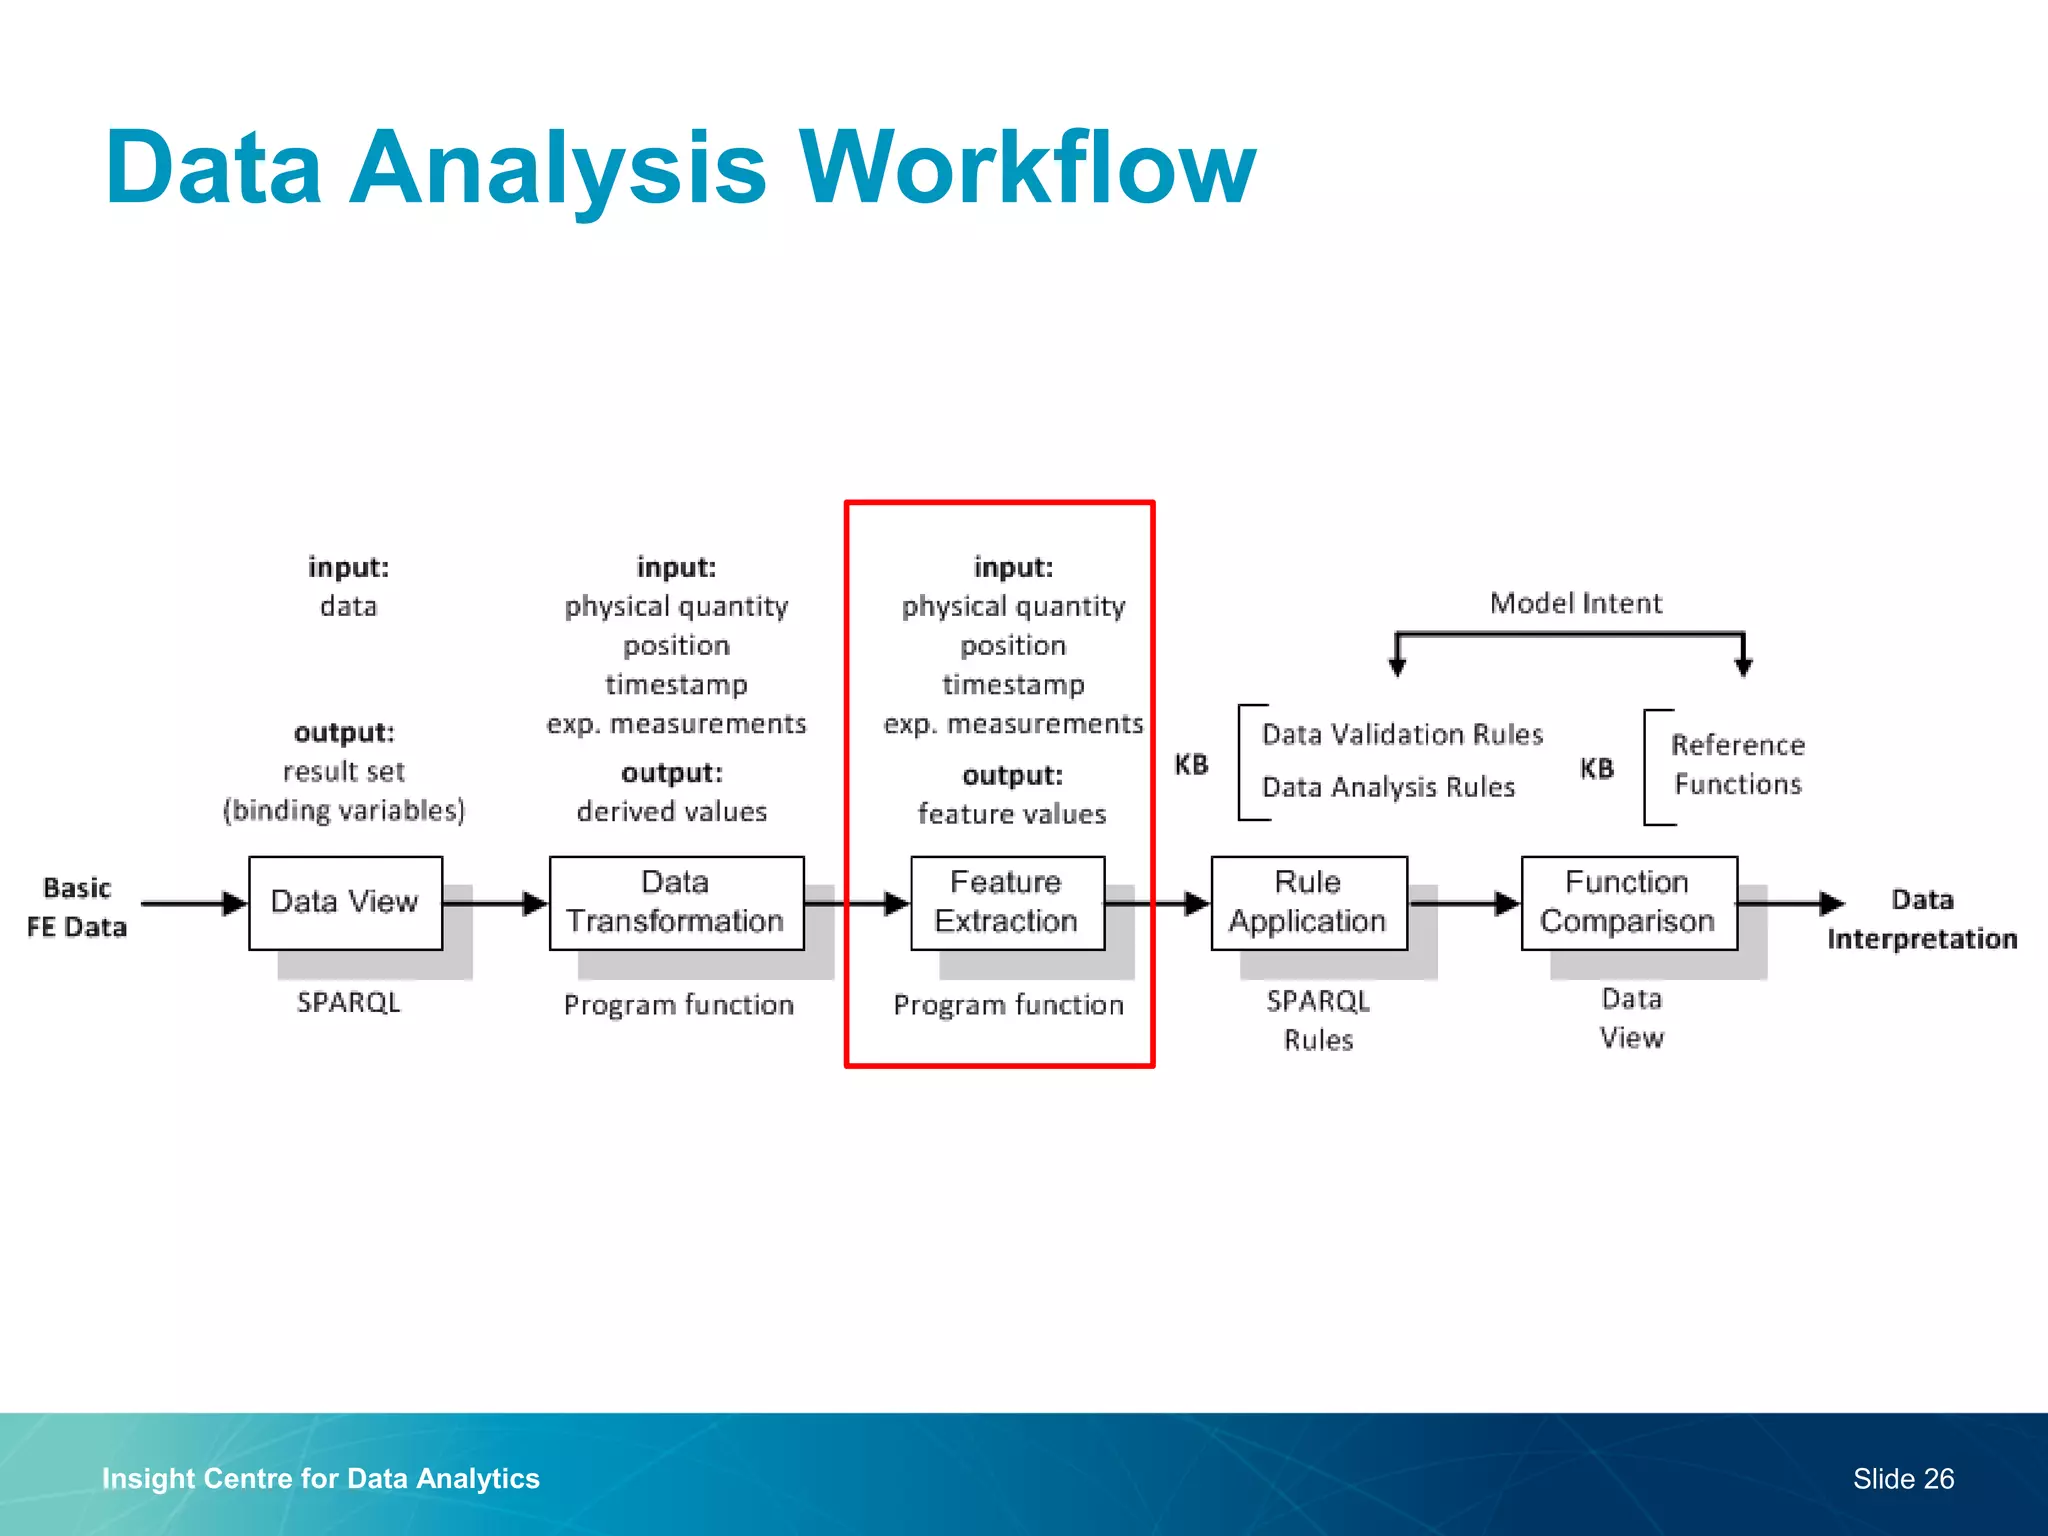
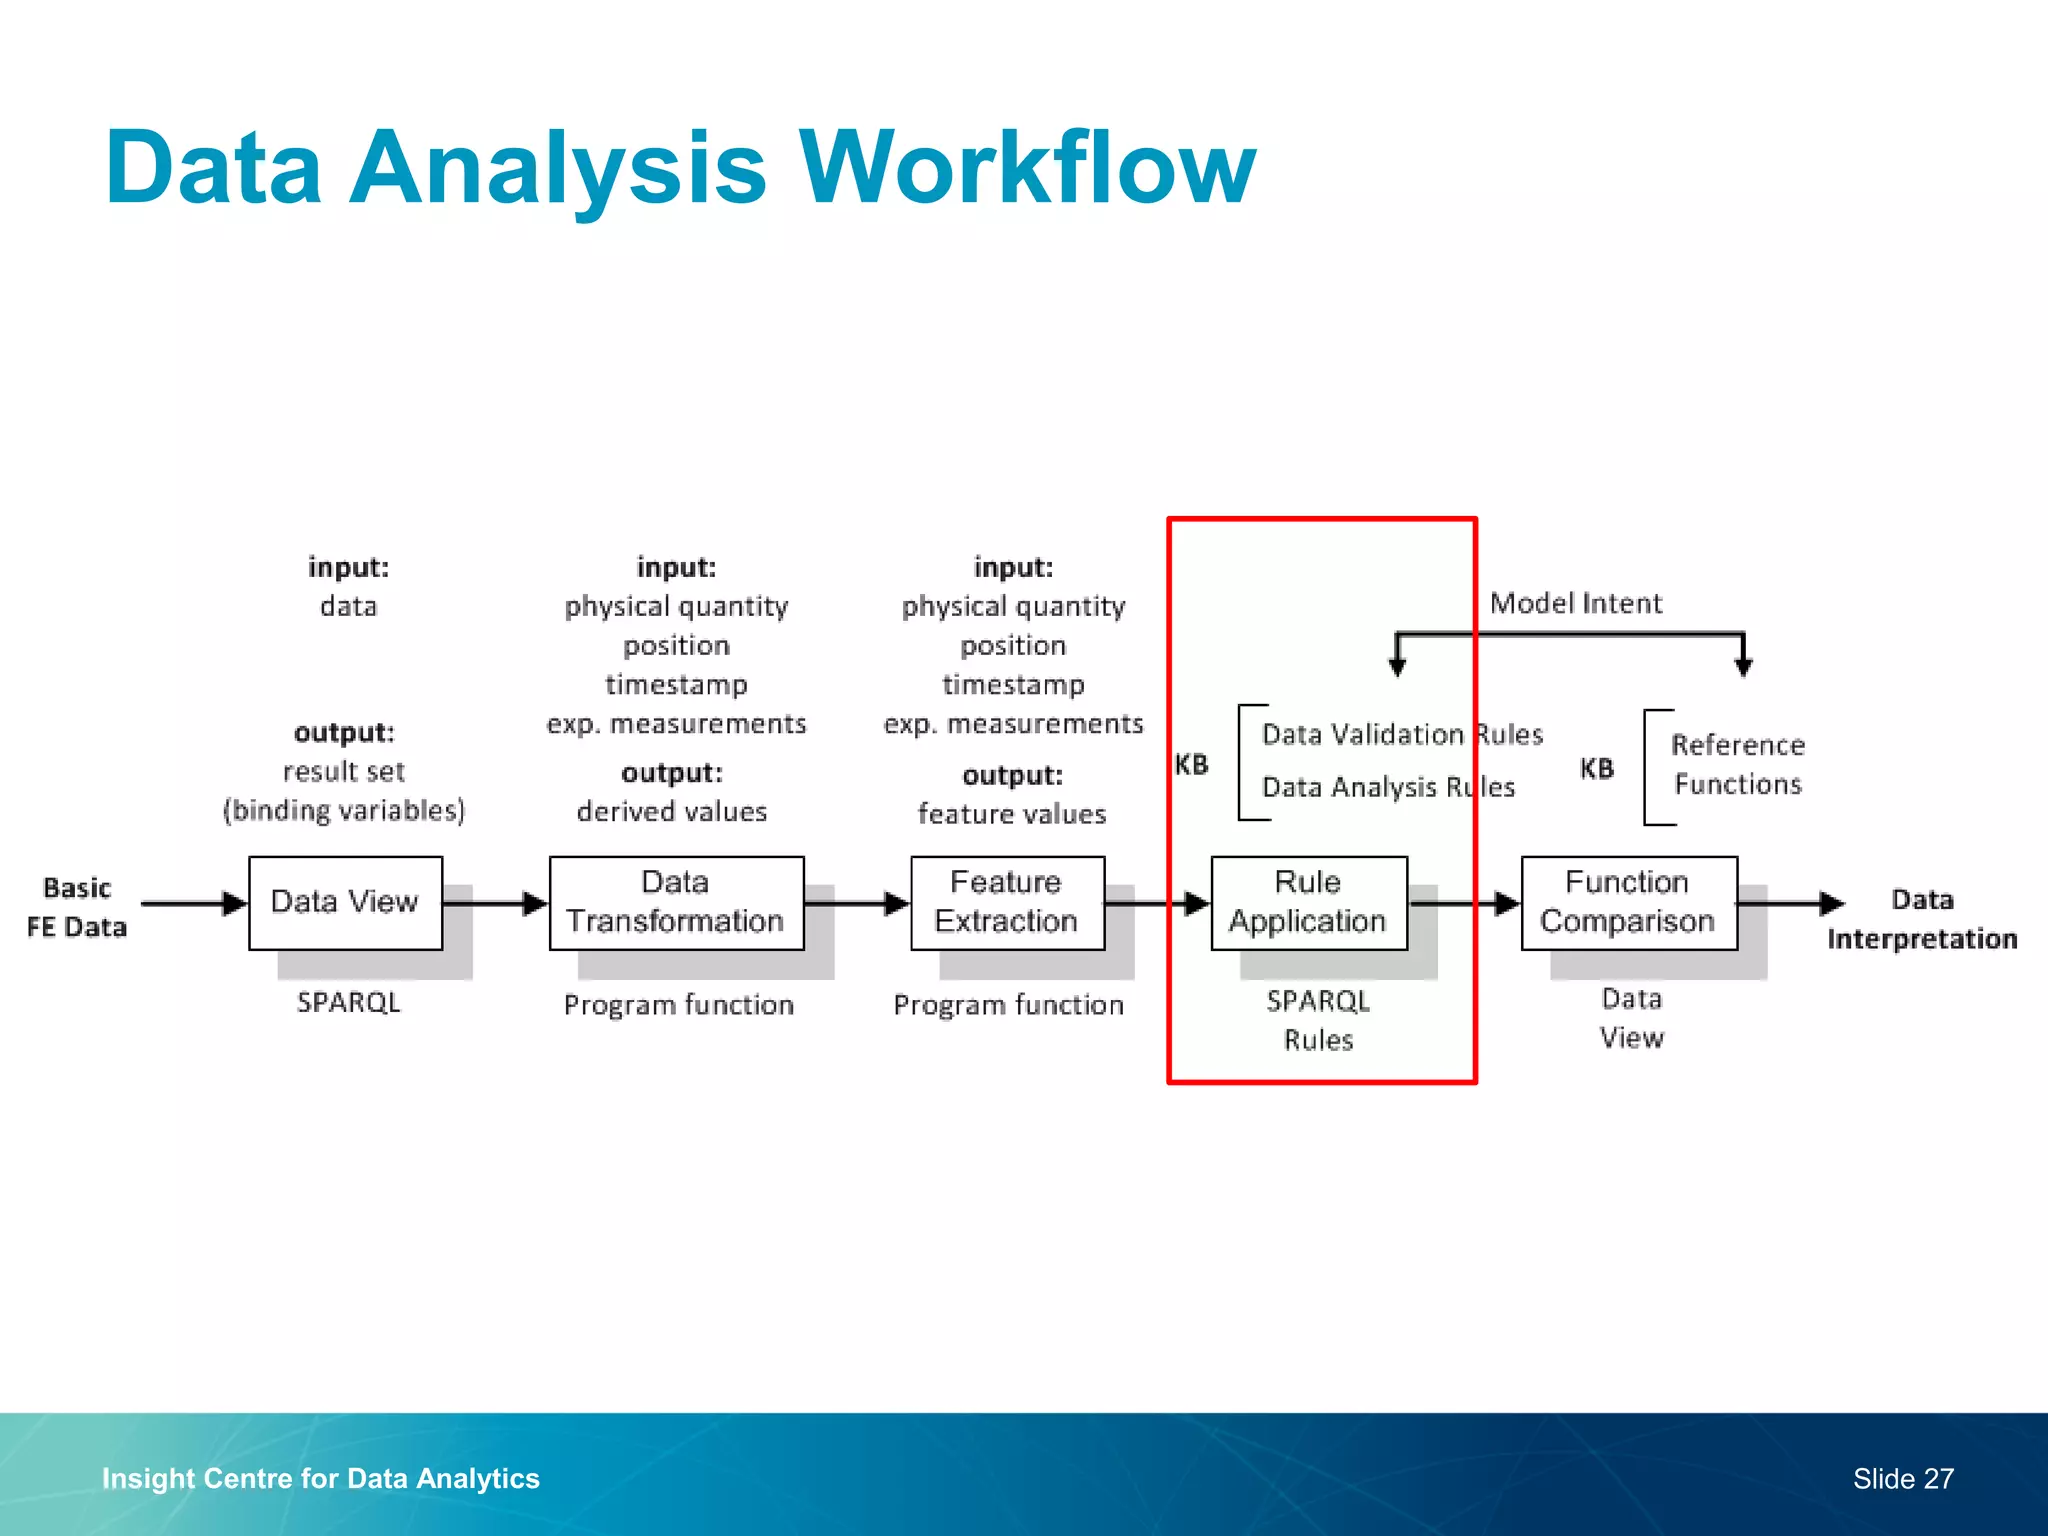
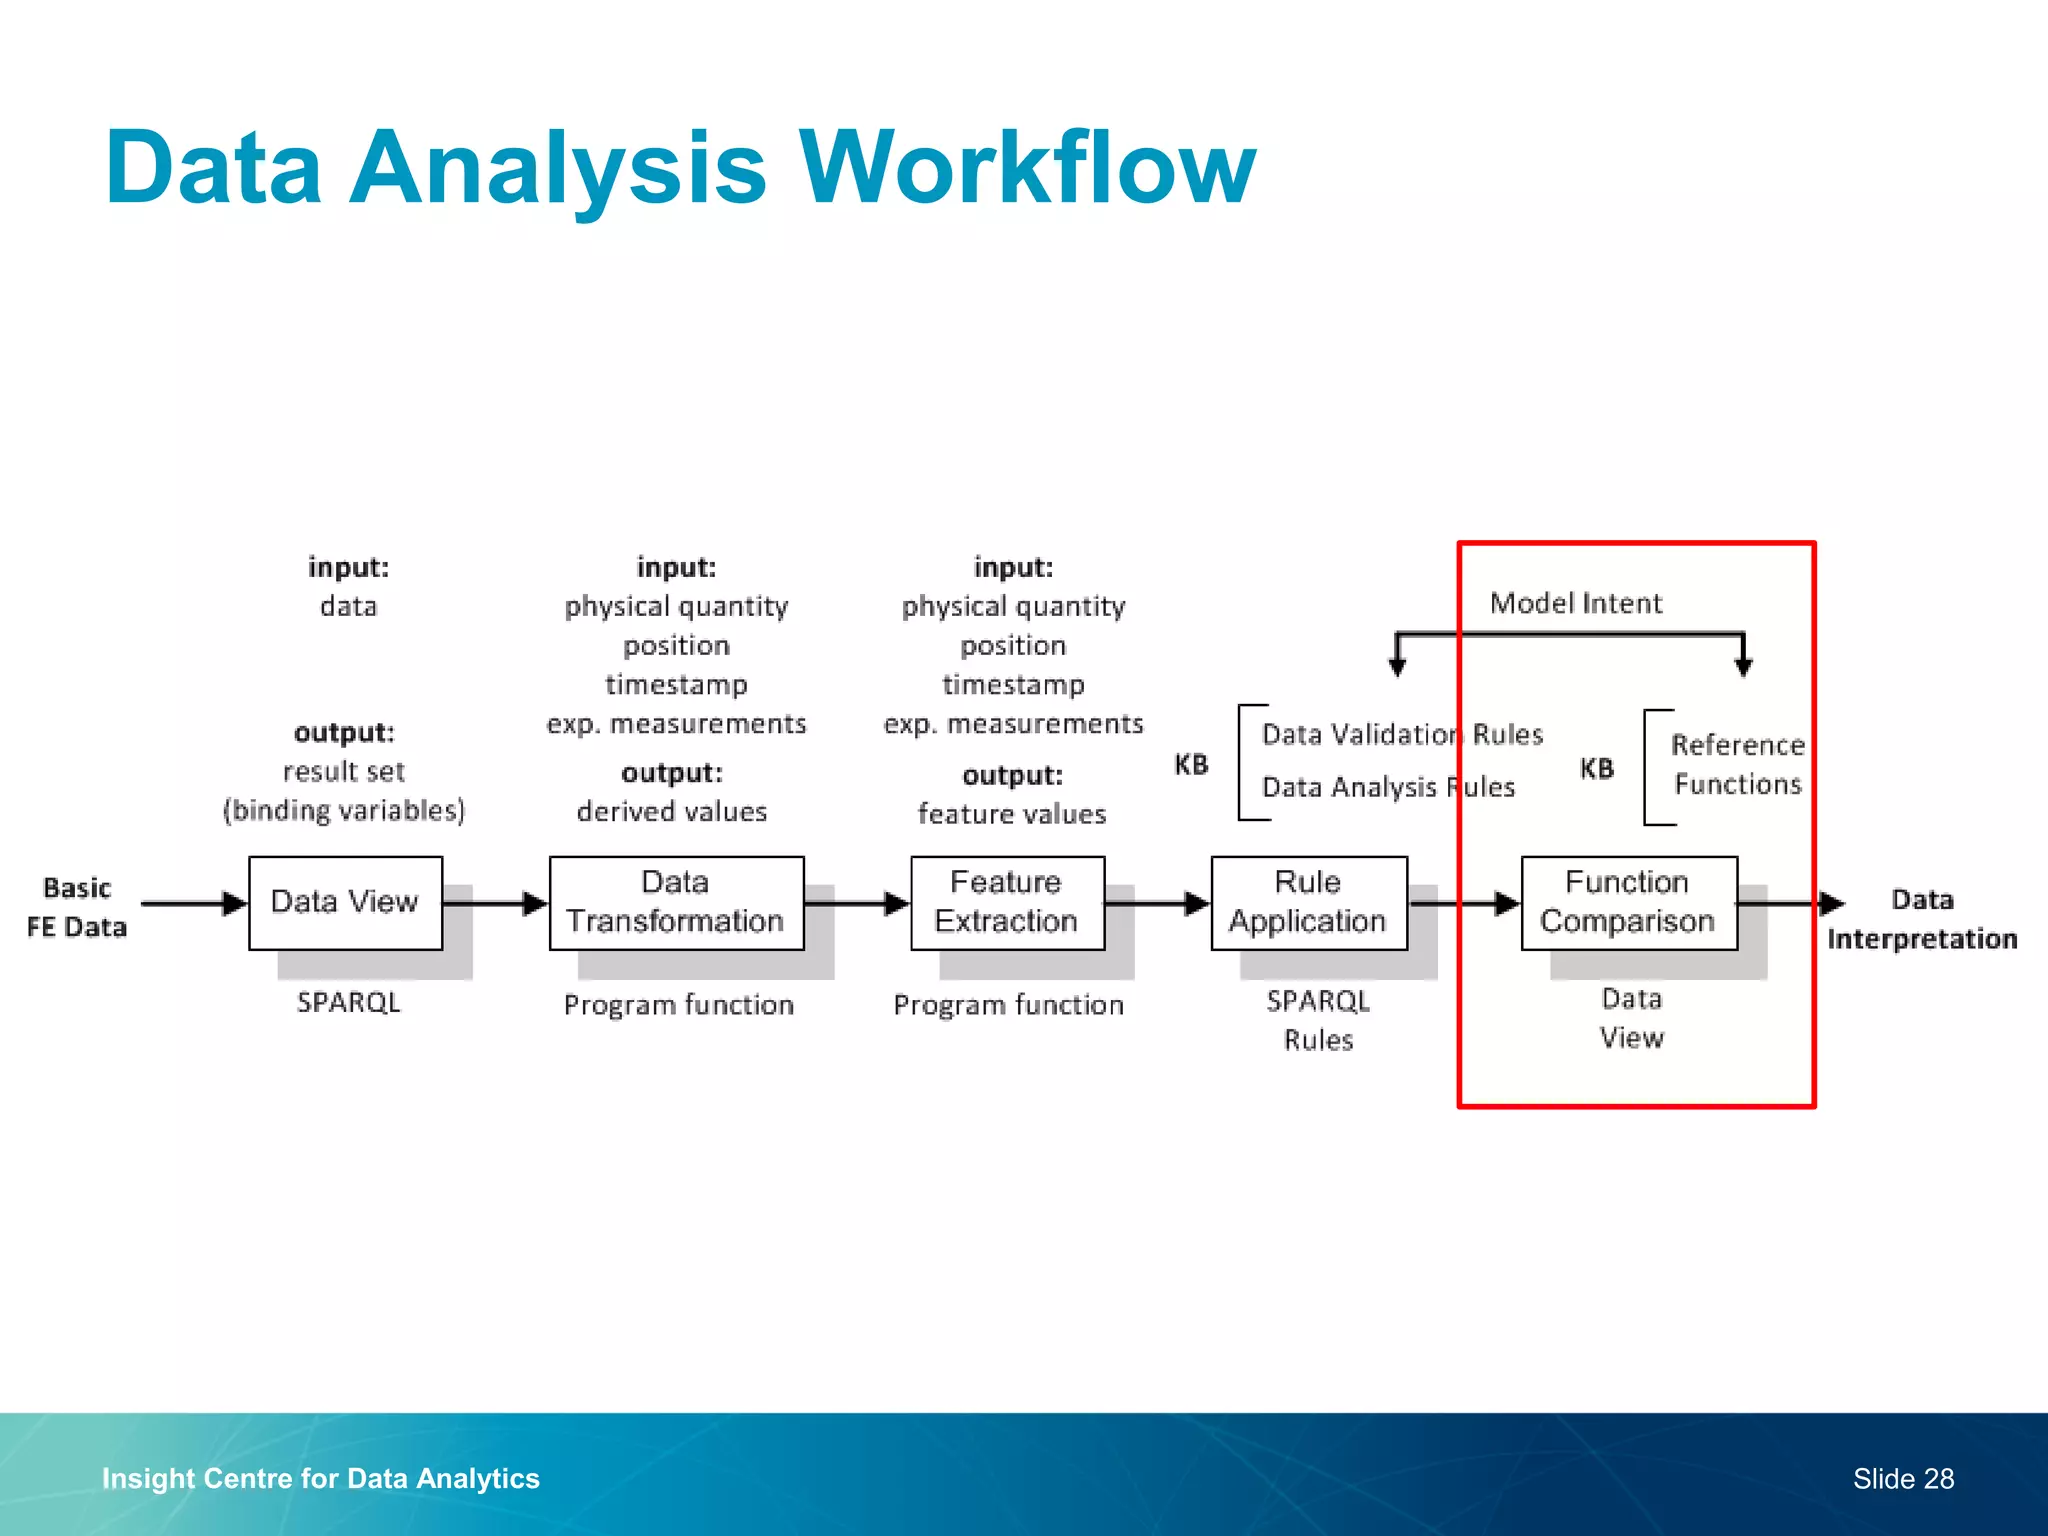
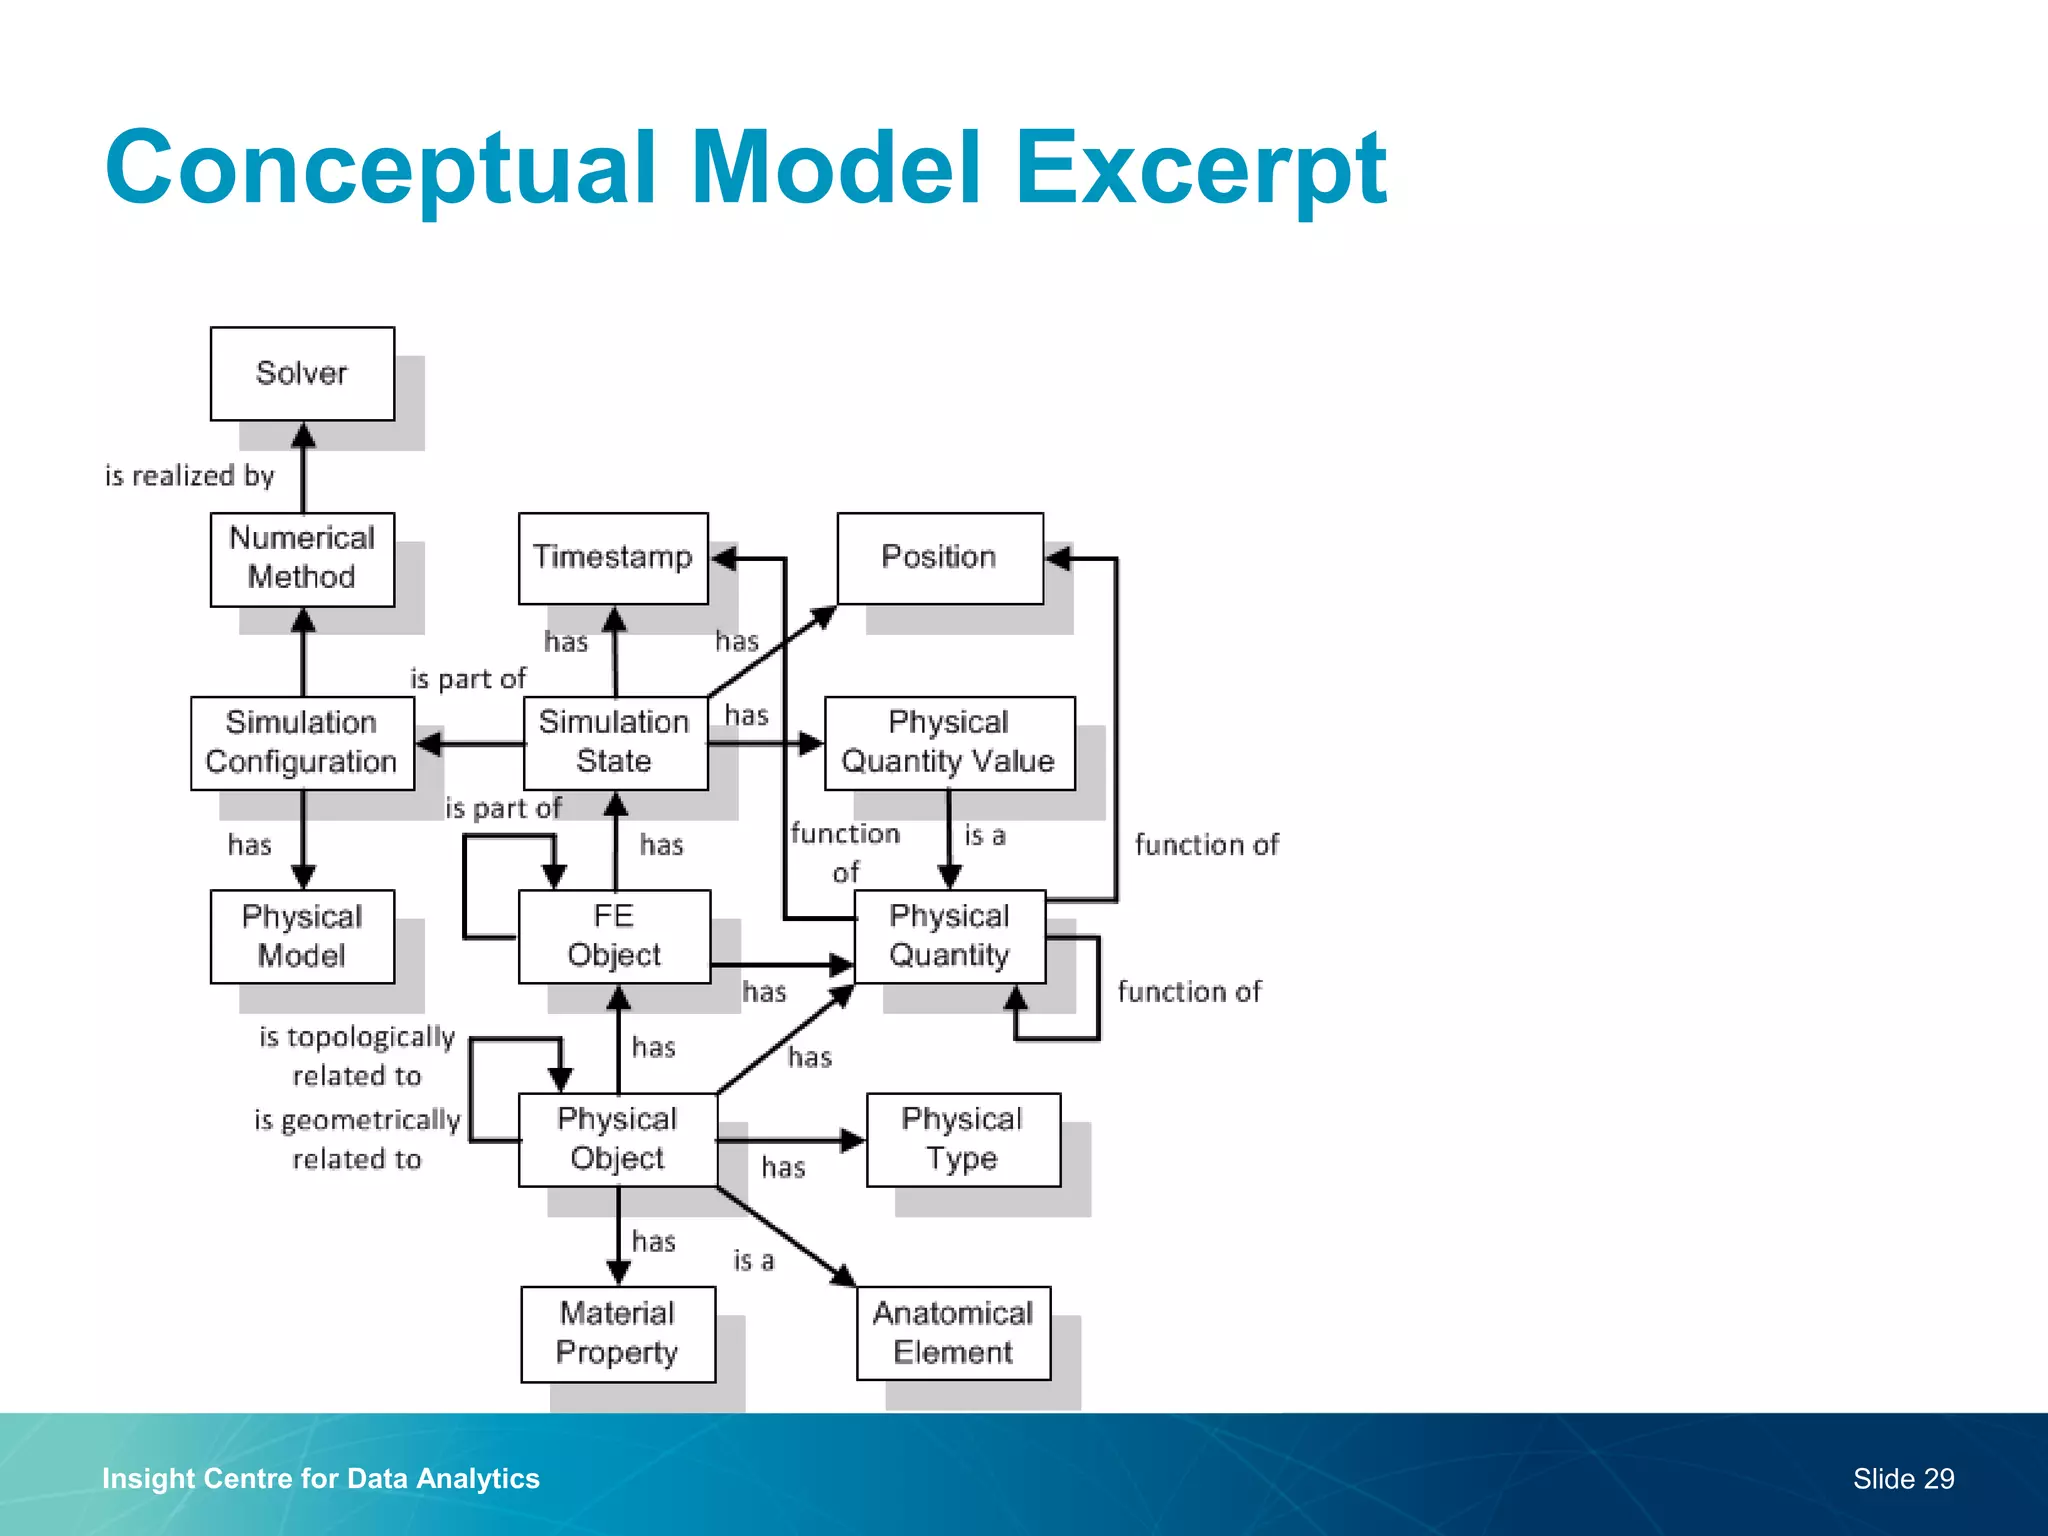
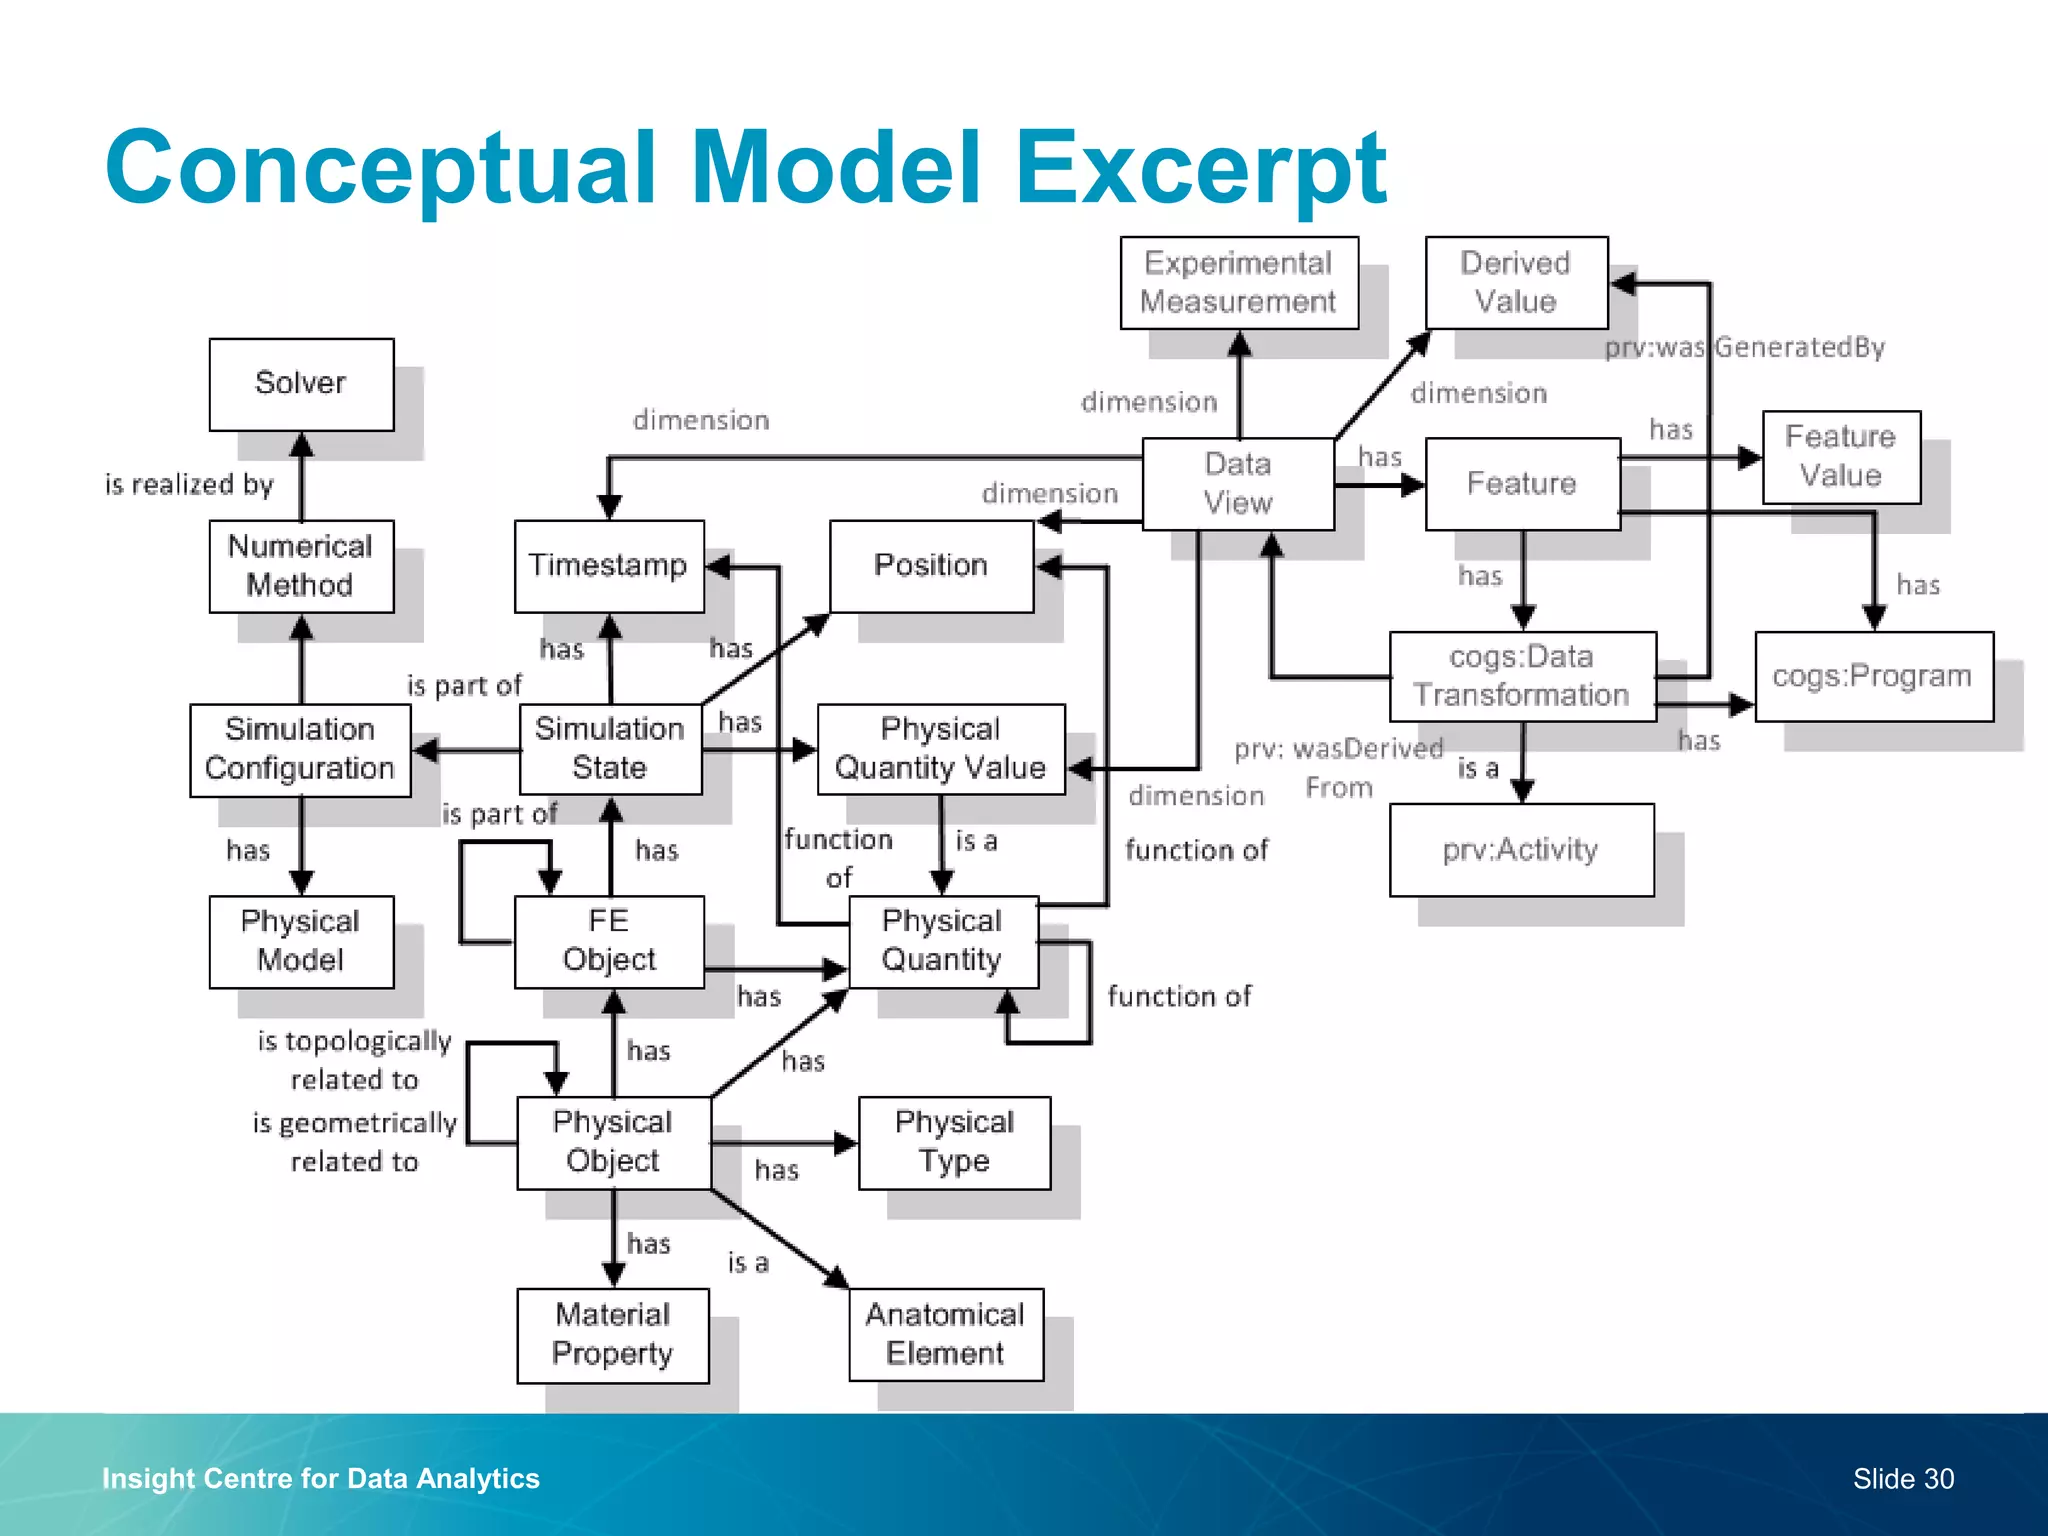
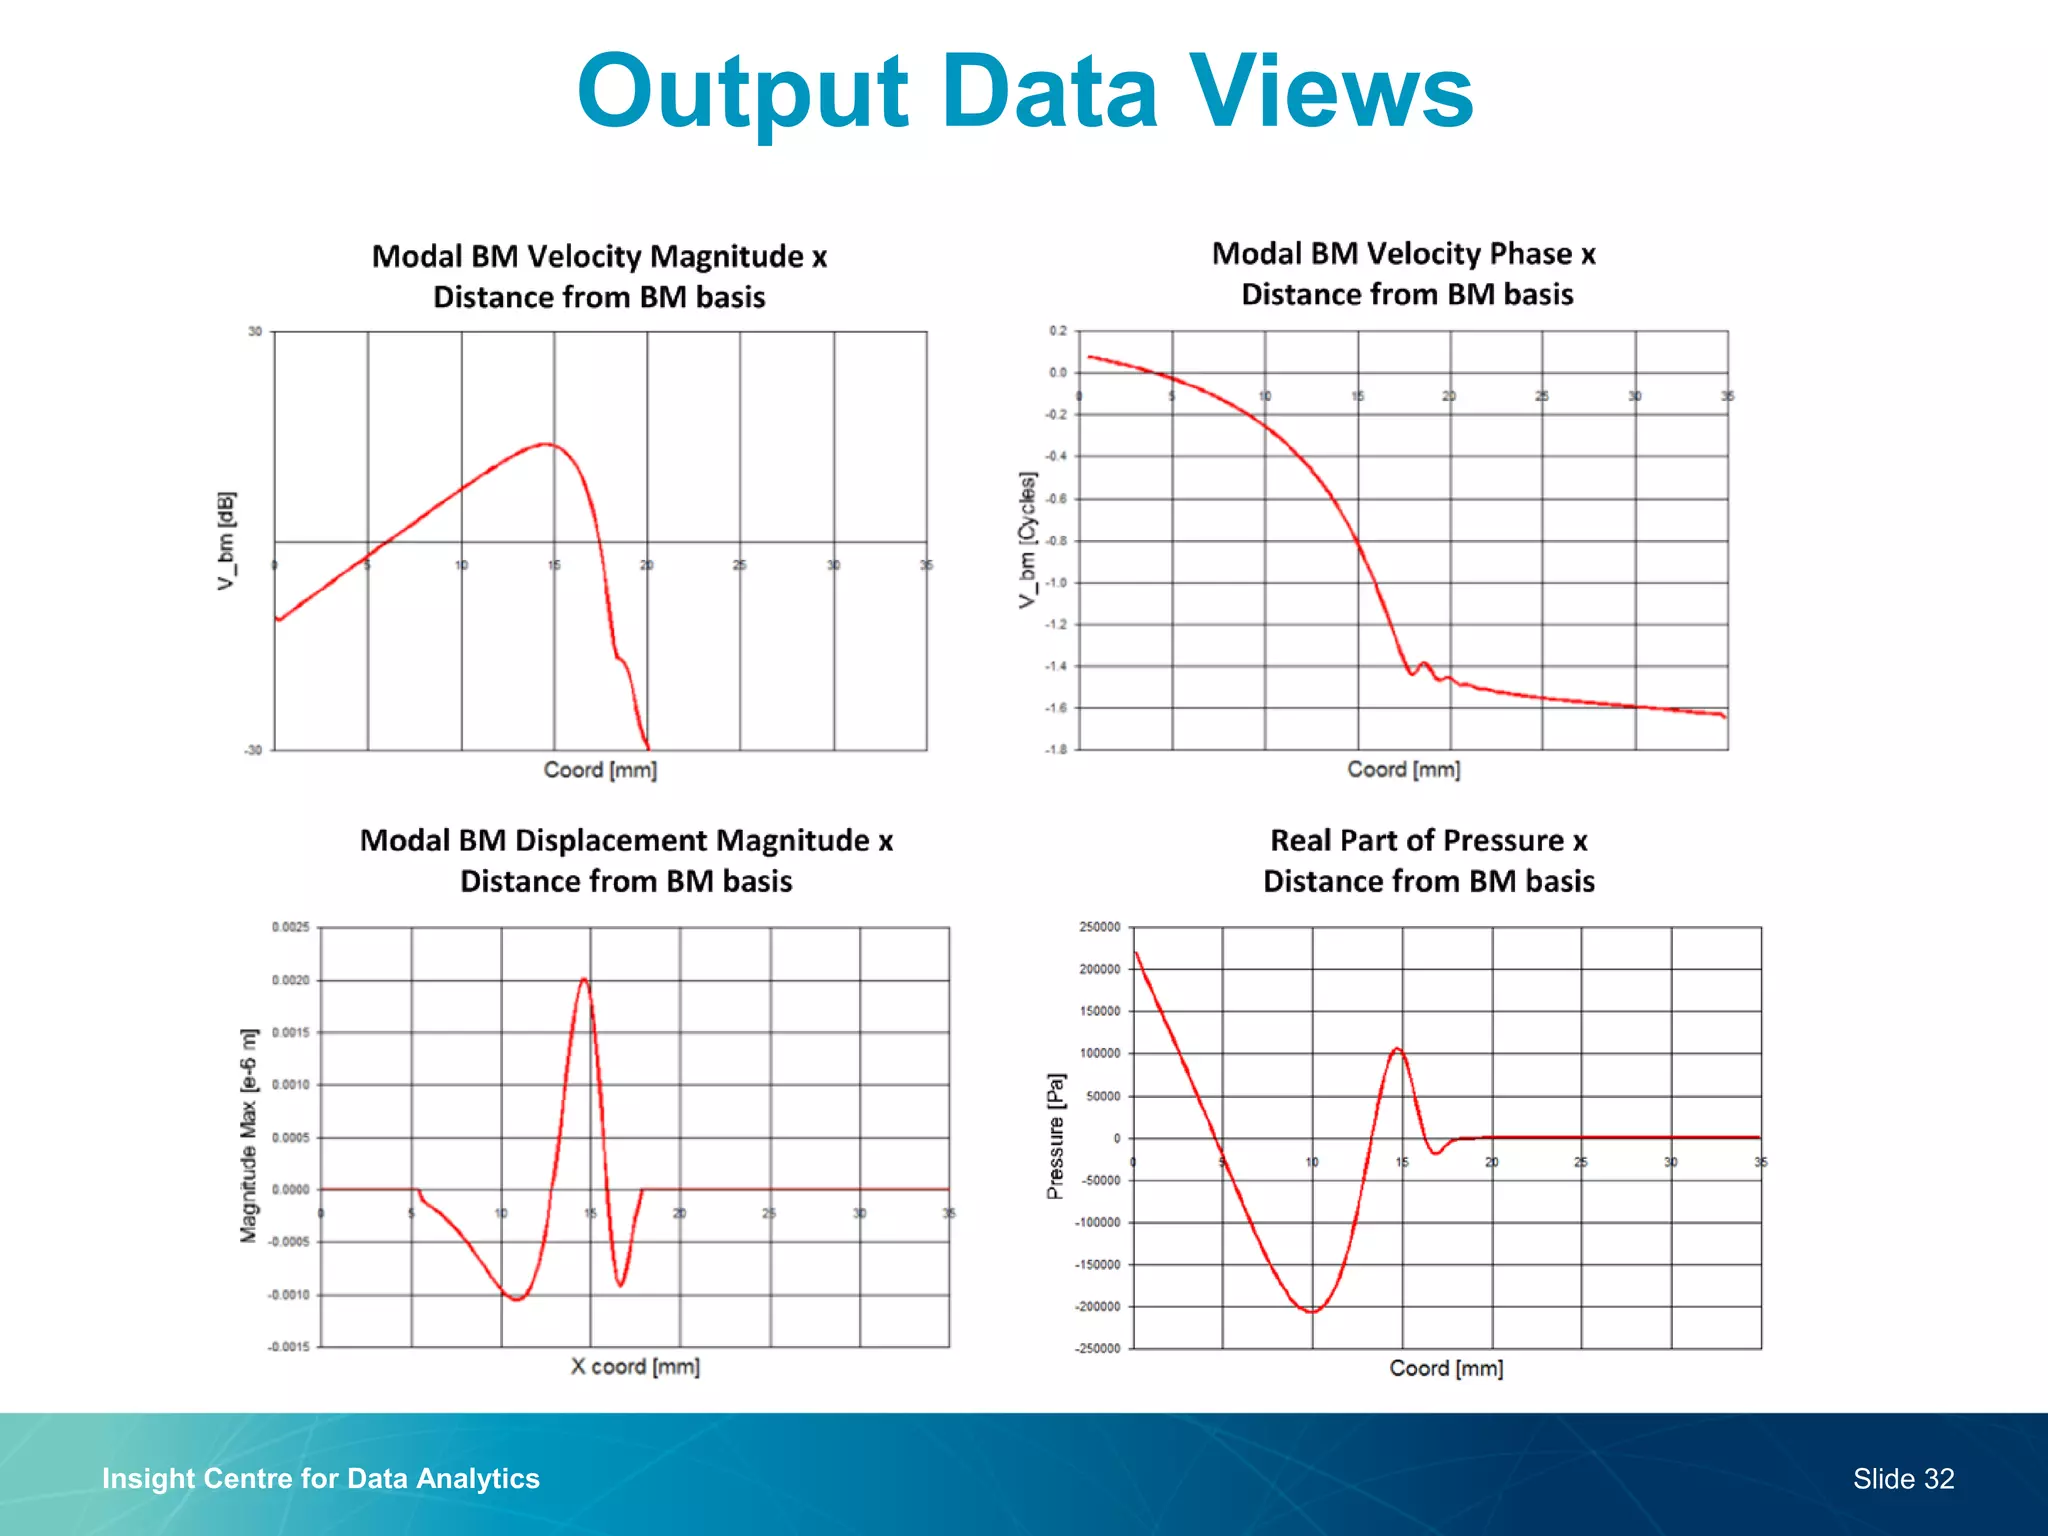
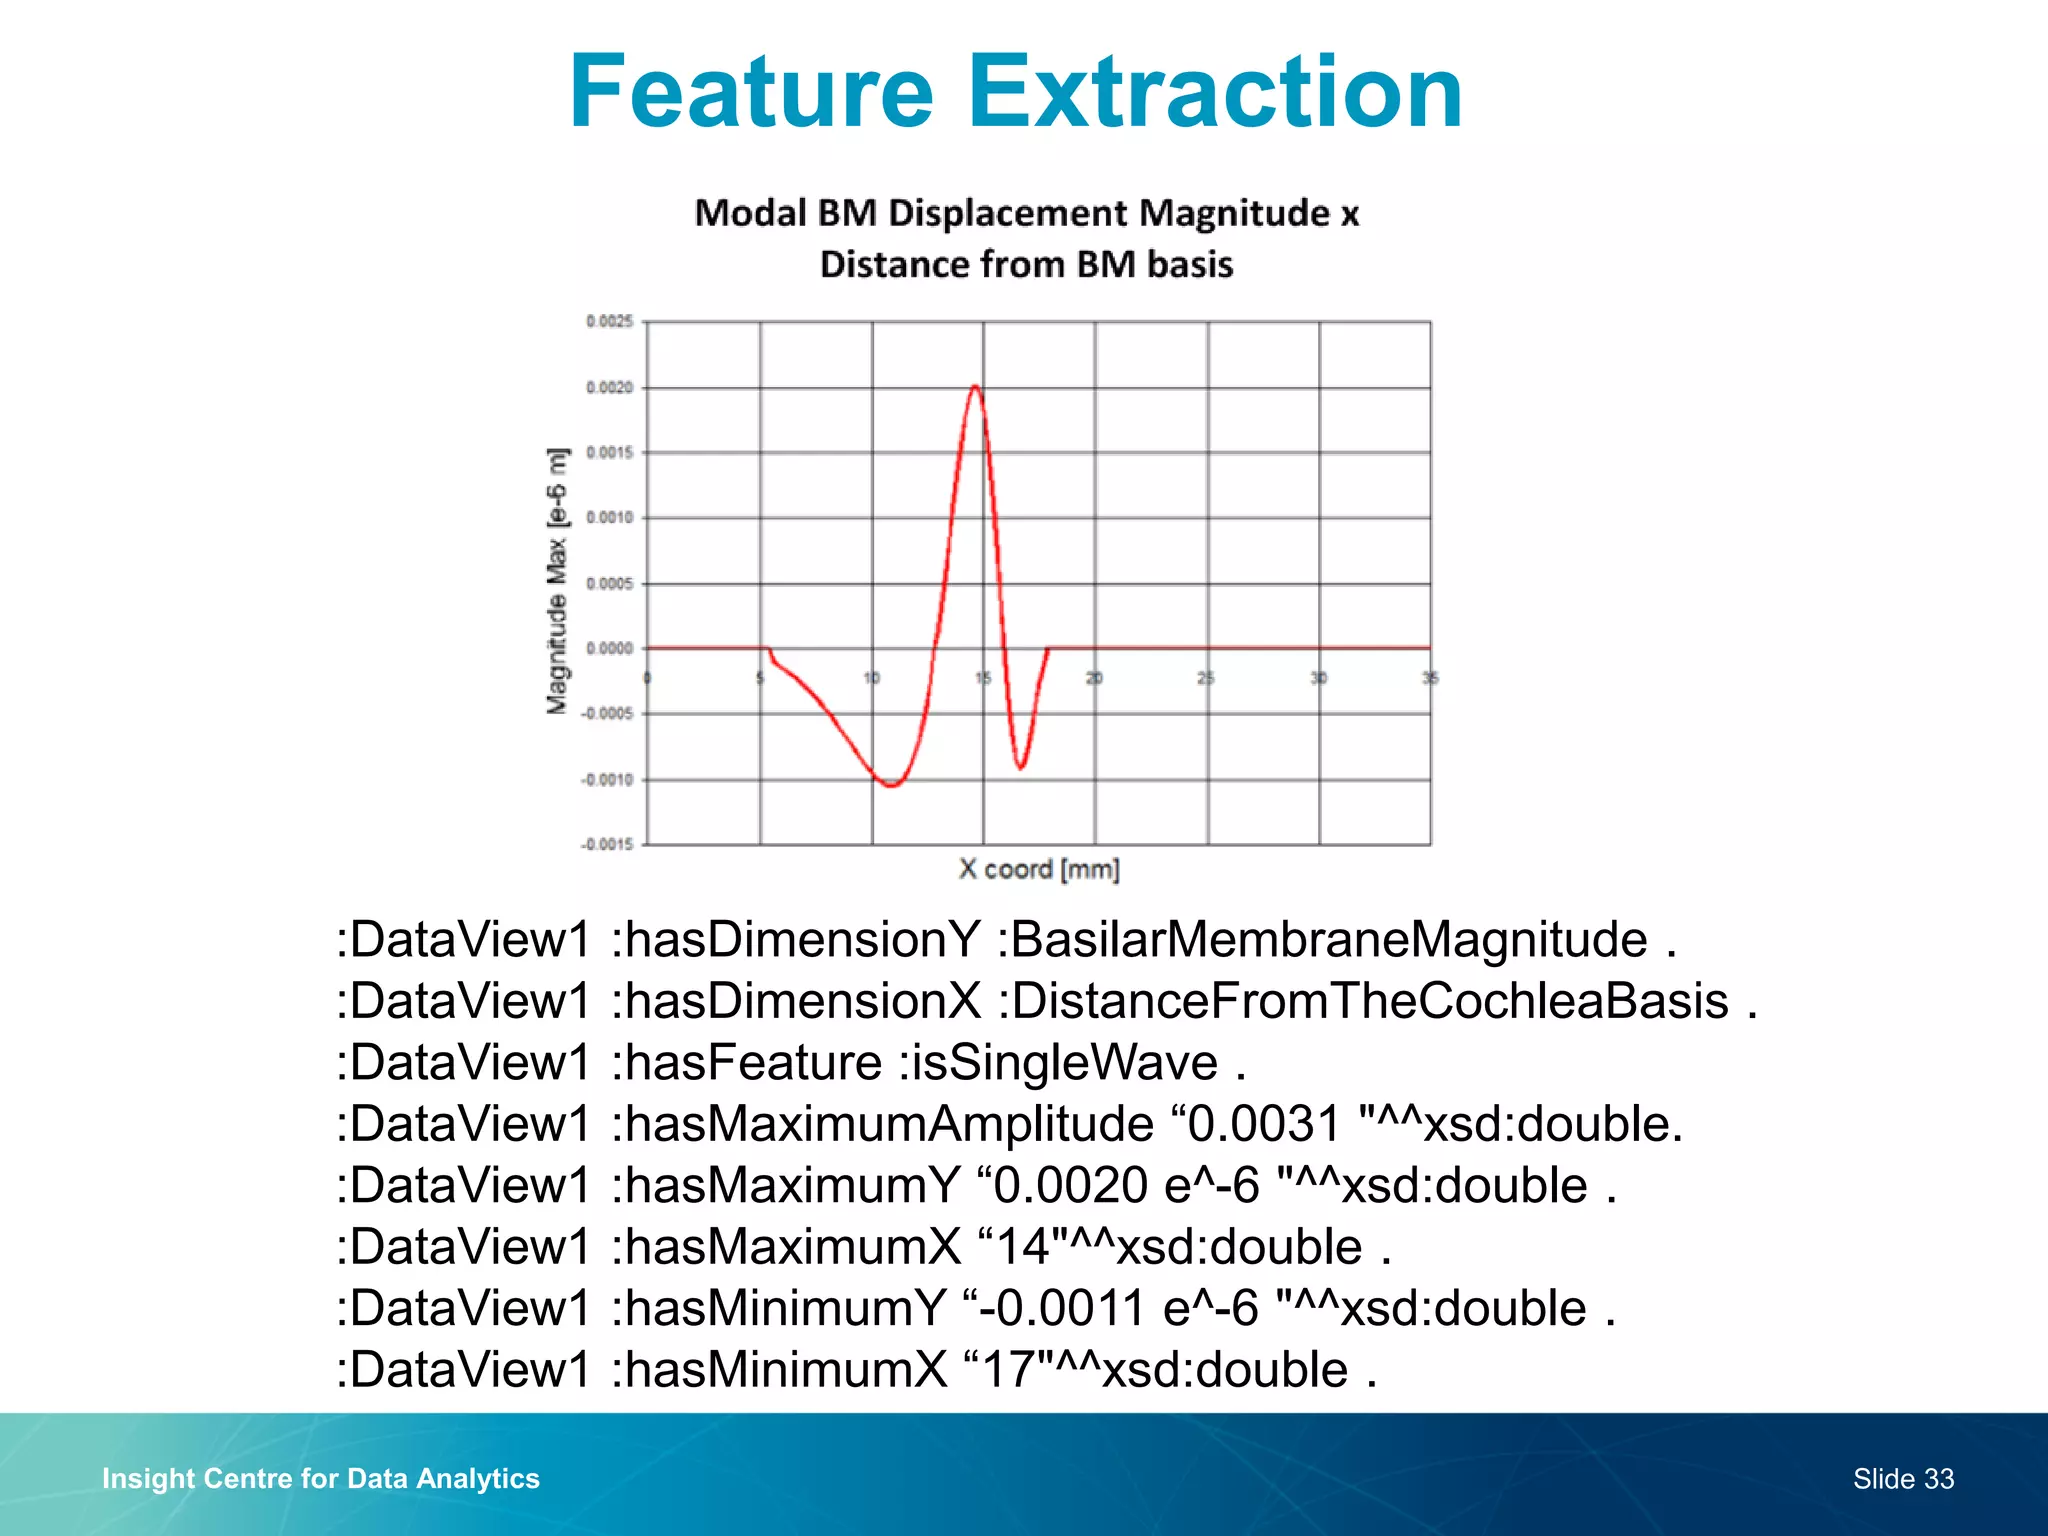
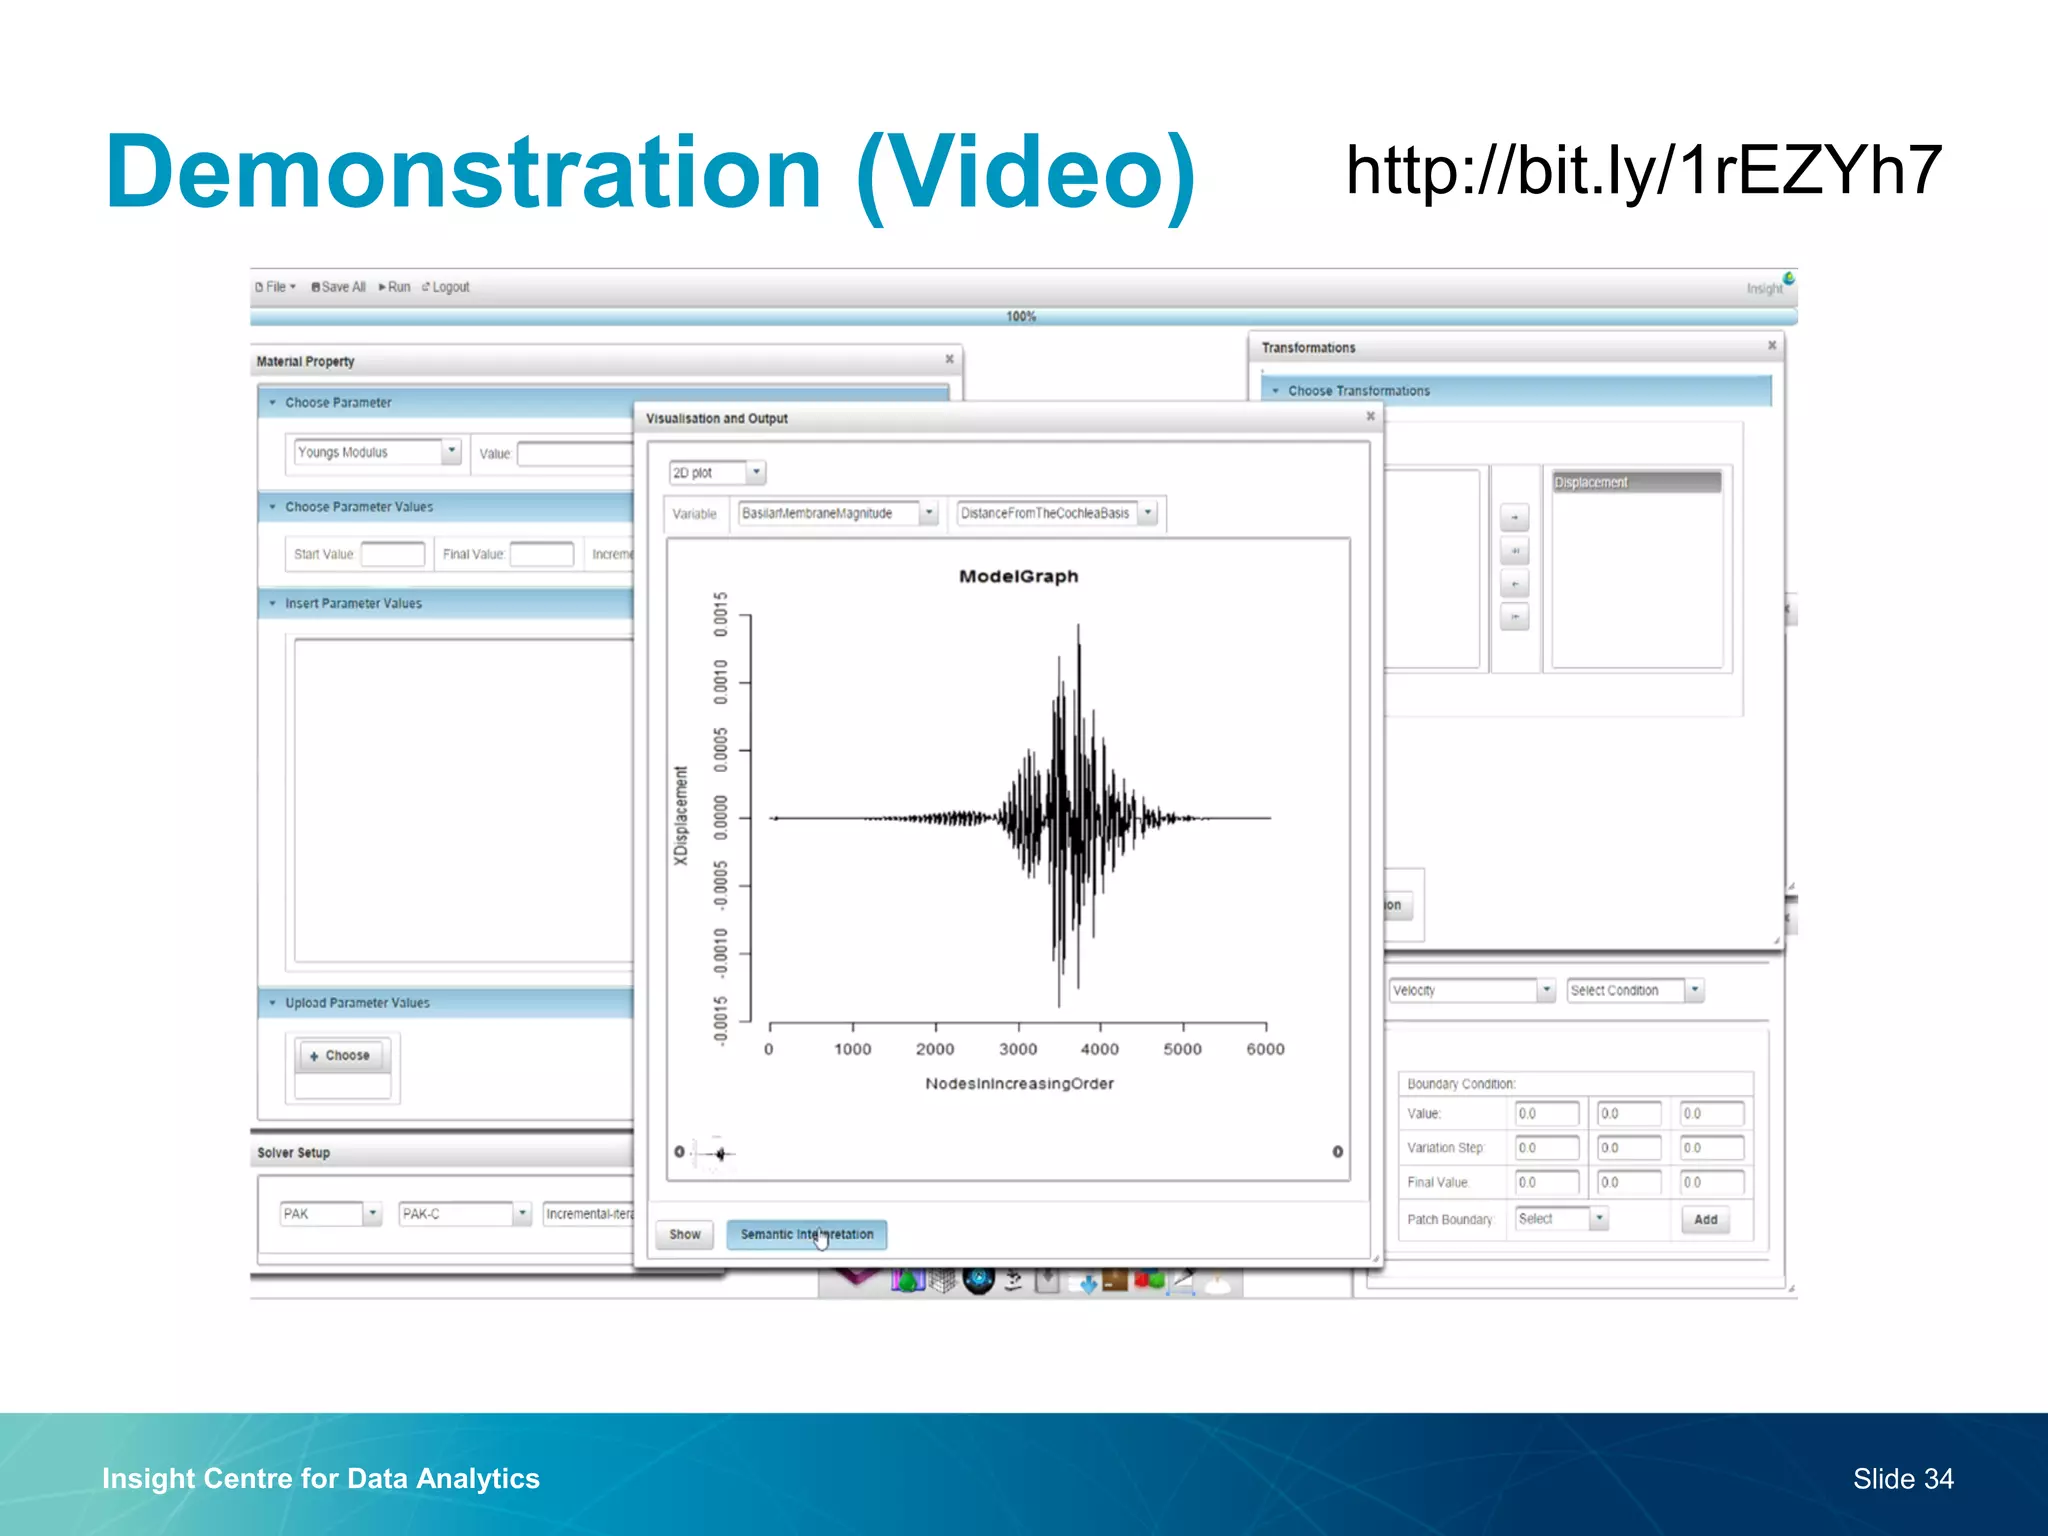
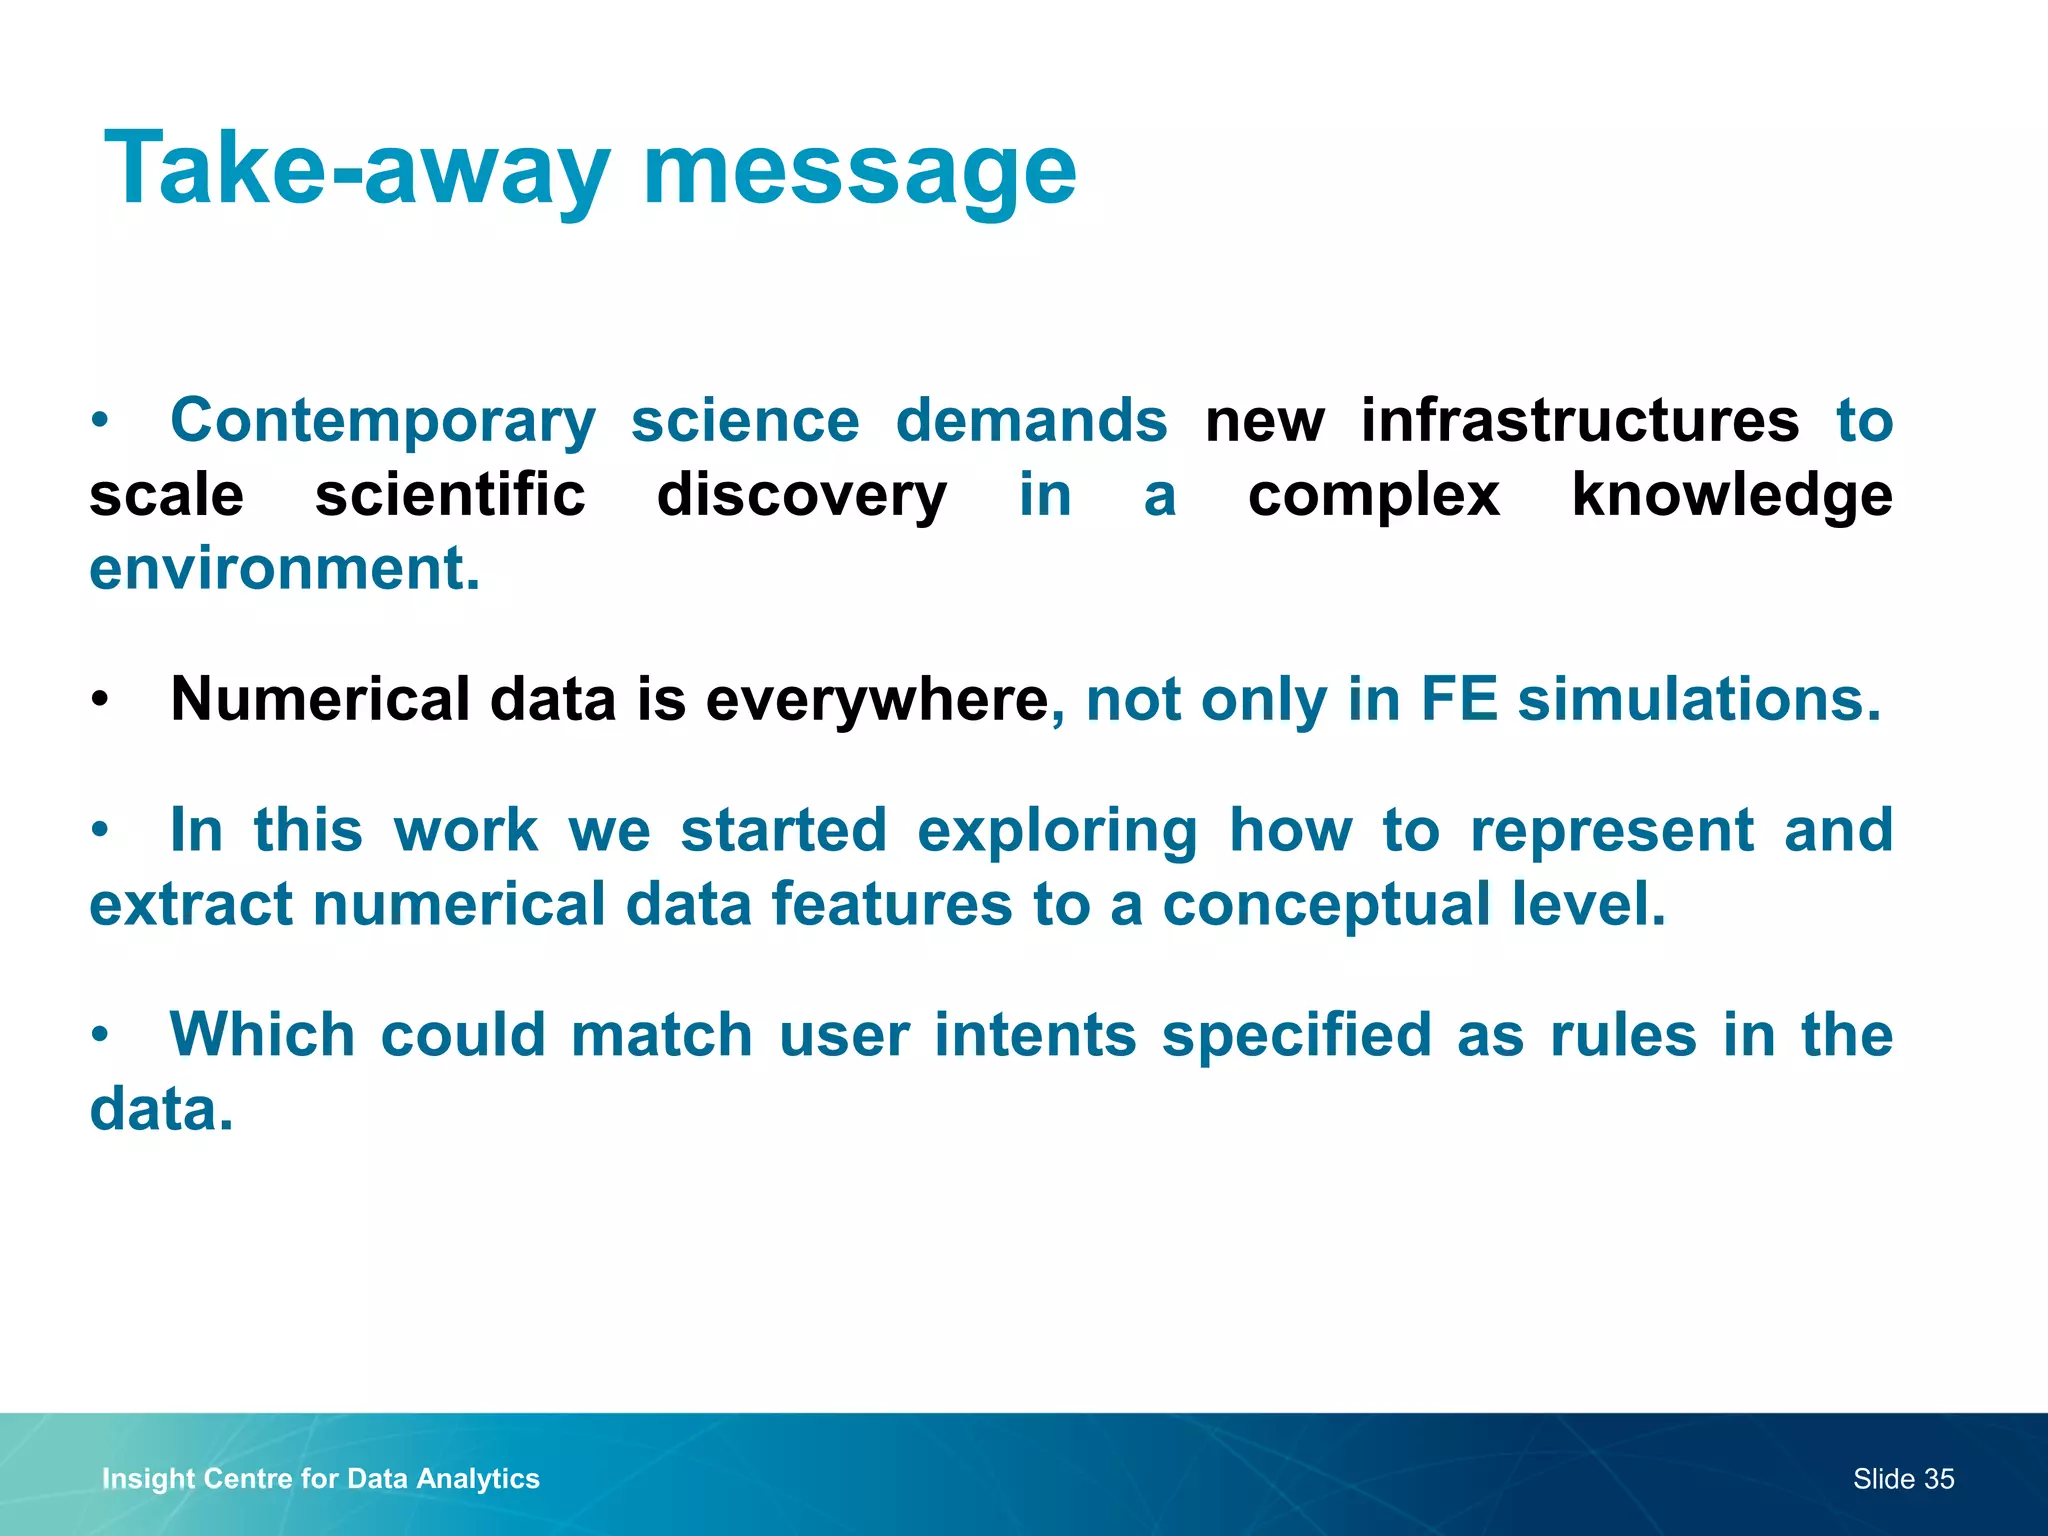
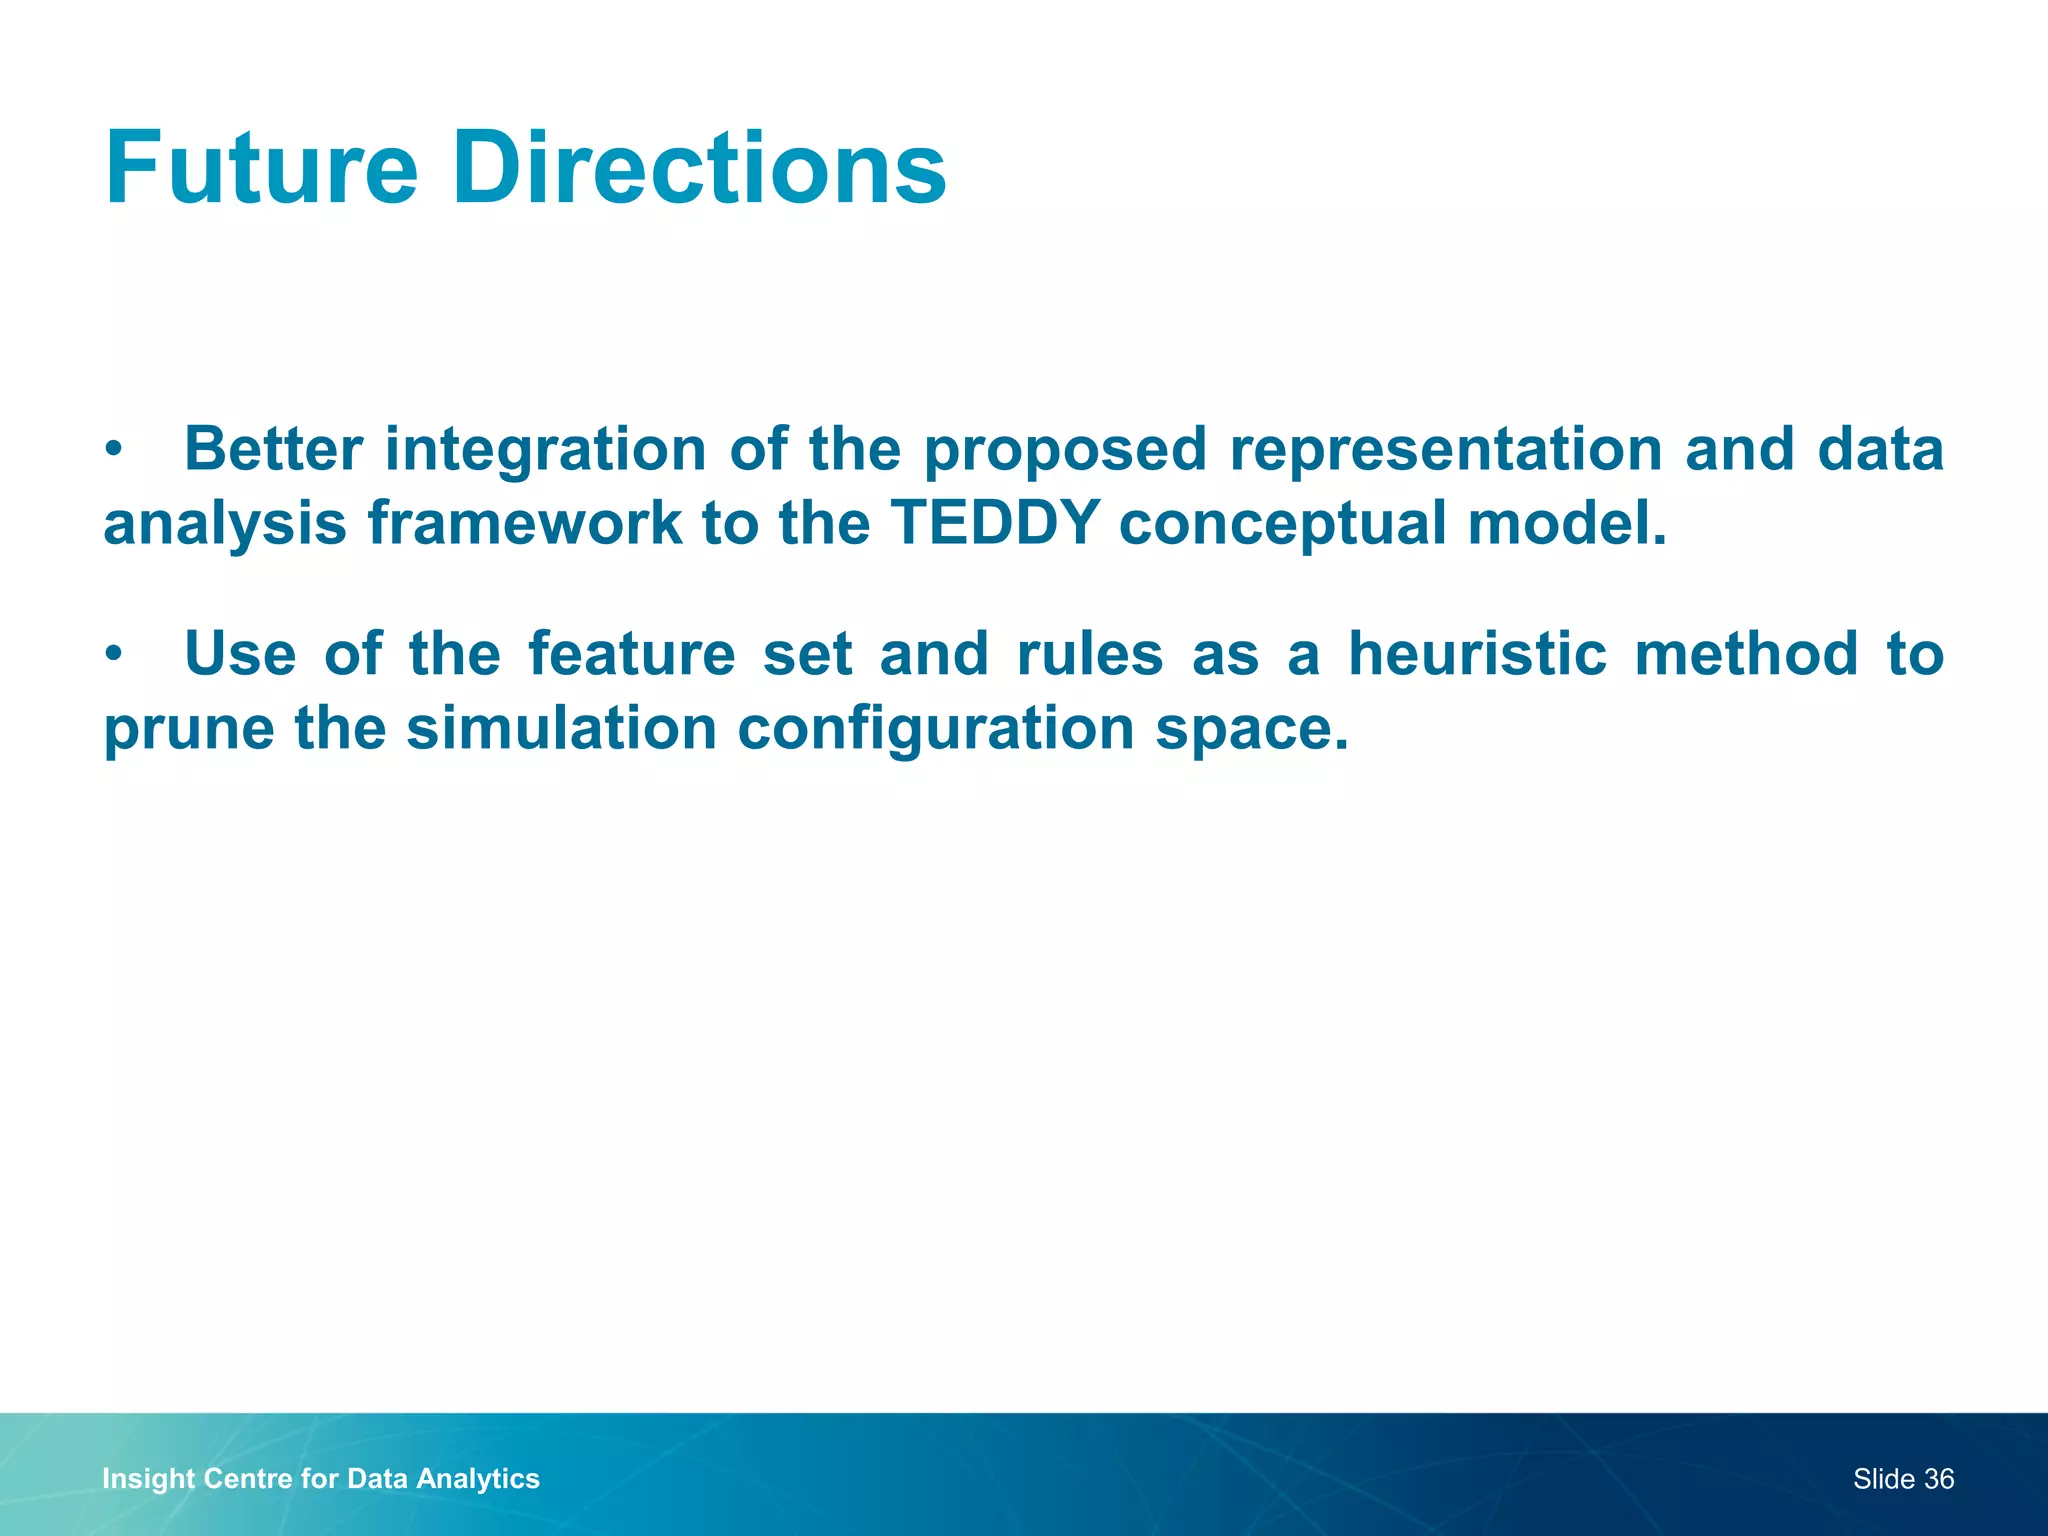

The document discusses a semantic web platform aimed at automating the interpretation of finite element (FE) bio-simulations, focusing on depicting finite element data symbolically. It highlights the challenges in representing complex FE concepts while performing efficient data analysis and feature extraction. Future directions include better integration with conceptual models and utilizing heuristic methods to enhance simulation configuration efficiency.