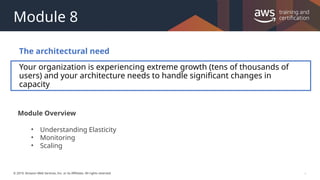
#3 Three factors that determine the overall availability of your application are fault tolerance, recoverability, and scalability.
Fault tolerance is often confused with high availability, but fault tolerance refers to the built-in redundancy of an application's components. Does it avoid single points of failure? This module covers fault tolerance later.
Recoverability is often overlooked as a component of availability. If a natural disaster makes one or more of your components unavailable or destroys your primary data source, can you restore service quickly and without lost data? Specific disaster recovery strategies will be covered in a later module.
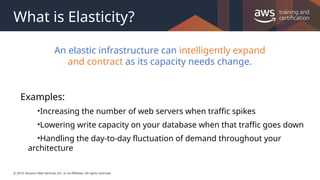
Scalability is the measure of how quickly your application's infrastructure can respond to increased capacity needs so that your application is available and performing within your required standards. It does not guarantee availability, but is one part of your application's availability.
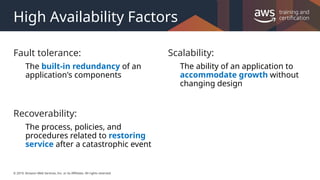
#4 By the end of class, you will be able to understand all of the components of this architectural diagram. You will also be able to construct your own architectural solutions that are just as large and robust.
#6 Traditional data centers: Once deployed, resources typically runs whether they are needed or not. You will end up paying for capacity that might not ever be used. Worse yet, you could need more capacity immediately, but be unable to obtain it.
can grow or shrink to match the required demand.
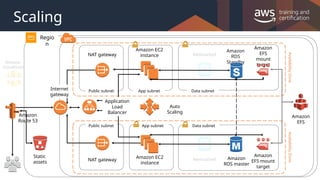
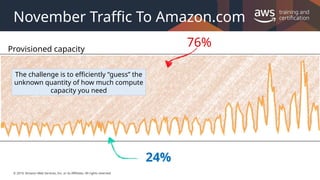
#7 Needless to say, the retail company Amazon.com is one of the largest AWS customers. Typically, the incoming traffic is very predictable. Before Amazon.com moved their infrastructure onto AWS, they had a traditional data center, as many companies had. In order to support the peak load, your data center must provide enough hardware and software to support the capacity.
#8 Amazon.com experiences a seasonal peak in November (Black Friday, a key consumer shopping day in the United States). The company had to invest in enough resources to support this once-yearly seasonal peak. As the business grew, Amazon.com had to keep investing in additional hardware and software. At some point, they ran out of space, so they had to add a new data center.
By using an on-premises solution, about 76 percent of the resources were left idle for most of the year, which wastes resources. But without investing in that additional hardware, the company might not have had enough compute capability to support the seasonal peak. If the servers had crashed, the business might have lost customer confidence.
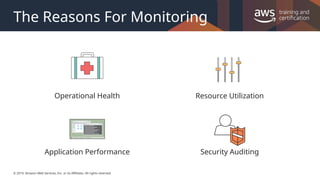
#13 Monitoring your environment is one of the most important things to think about when creating architecture. You will always need a way to keep track of how your resources are operating and performing. Monitoring give you the first hints for asking the question does something need to change. Here are a few points to remember:
Monitoring is really the first step to building a reactive architecture that can scale as demand climbs and pull back when focus shifts away. This kind of scaling will greatly save you money and provide a better user experience for you and your customers.
Resource utilization and application performance will be a large component for making sure our infrastructure is satisfying our demand. You can pull this information through monitoring.
Monitoring also is very important on a security standpoint. With effective parameters in place you can understand when your users are accessing pieces of your AWS environment that they shouldn’t.
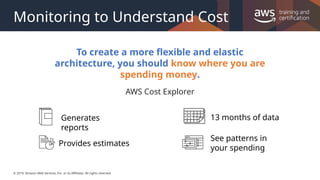
#14 Cost Optimization Monitor – Can generate reports that provide insight into service usage and cost. Provides estimates costs that can break down by period, account, resource or tags.
AWS Cost Explorer – Can view data up to the last 13 months, allowing you to see patterns in how you spend on AWS resources over time.
Forecasting with AWS Cost Explorer - A forecast is a prediction of how much you will use AWS services over the forecast time period you selected, based on your past usage. You create a forecast by selecting a future time range for your report. Forecasting provides an estimate of what your AWS bill will be and enables you to use alarms and budgets for amounts that you're predicted to use. Because forecasts are predictions, the forecasted billing amounts are estimated and might differ from your actual charges for each statement period.
Different ranges of accuracy have different confidence intervals. The higher the confidence interval, the more likely the forecast is to be correct. AWS Cost Explorer forecasts have a confidence interval of 80%. If AWS doesn't have enough data to forecast within an 80% confidence interval, AWS Cost Explorer doesn't show a forecast.
https://docs.aws.amazon.com/awsaccountbilling/latest/aboutv2/ce-modify.html#ce-timerange
#15
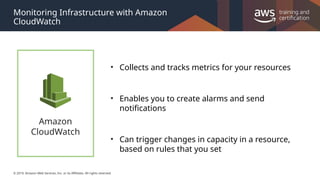
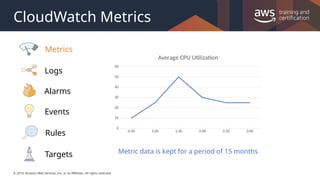
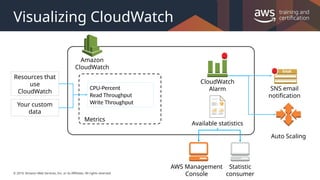
The first step on our journey to create elastic architectures is an overview of Amazon CloudWatch. CloudWatch helps to provide a greater level of visibility into your AWS resource and applications.
You can use CloudWatch to collect and track metrics, which are variables you can measure for your resources and applications. CloudWatch alarms send notifications or automatically make changes to the resources you are monitoring based on rules that you define. For example, you can monitor the CPU usage and disk reads and writes of your Amazon EC2 instances and then use this data to determine whether you should launch additional instances to handle increased load. You can also use this data to stop under-used instances to save money. In addition to monitoring the built-in metrics that come with AWS, you can monitor your own custom metrics. With CloudWatch, you gain system-wide visibility into resource utilization, application performance, and operational health.
For more information, see https://docs.aws.amazon.com/AmazonCloudWatch/latest/monitoring/WhatIsCloudWatch.html.
#17 Metrics are data about the performance of your systems. Many AWS services provide metrics for resources by default (such as Amazon EC2 instances, Amazon EBS volumes, and Amazon RDS DB instances). You can also enable detailed monitoring some resources, such as your Amazon EC2 instances, or publish your own application metrics. Amazon CloudWatch can load all the metrics in your account (both AWS resource metrics and application metrics that you provide) for search, graphing, and alarms.
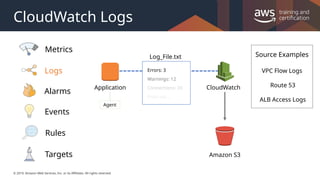
#18 CloudWatch Logs allows you to monitor, store, and access your log files from sources such as EC2 instances, Amazon Route 53, AWS CloudTrail, and other AWS services.
For example, you could monitor logs from Amazon EC2 instances in real time. You could track the number of errors that have occurred in your application logs and send a notification if that rate exceeds a previously defined amount.
CloudWatch Logs specifically monitors your log data itself, so no code changes are required.
Additionally you can use CloudWatch Logs Insights to analyze your logs in seconds to give you fast, interactive queries and visualizations. You can visualize query results using line or stacked area charts, and add those queries to a CloudWatch Dashboard.
For more information, see https://docs.aws.amazon.com/AmazonCloudWatch/latest/logs/WhatIsCloudWatchLogs.html
https://aws.amazon.com/blogs/aws/new-amazon-cloudwatch-logs-insights-fast-interactive-log-analytics/
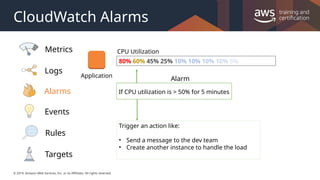
#19 You can use an alarm to automatically initiate actions on your behalf. An alarm watches a single metric over a specified time period, and performs one or more specified actions, based on the value of the metric relative to a threshold over time. The action is a notification sent to an Amazon SNS topic or an Auto Scaling policy. You can also add alarms to dashboards.
Alarms invoke actions for sustained state changes only. CloudWatch alarms do not invoke actions simply because they are in a particular state. The state must have changed and been maintained for a specified number of periods.
With these examples, the triggering of the alarm would start some other action, such as executing an Auto Scaling policy, sending a notification (to an Ops team, for instance), etc.
Actions can also be executed when an alarm is not triggered.
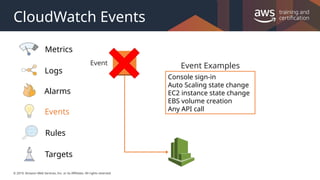
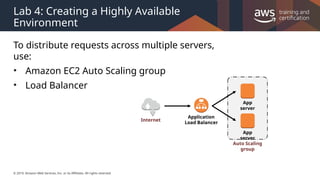
#20 Amazon CloudWatch Events delivers a near real-time stream of system events that describe changes in AWS resources.
AWS resources can generate events when their state changes. For example, Amazon EC2 generates an event when the state of an EC2 instance changes from pending to running, and Amazon EC2 Auto Scaling generates events when it launches or terminates instances.
Using simple rules that you can quickly set up, you can match events and route them to one or more target functions or streams.
CloudWatch Events becomes aware of operational changes as they occur. CloudWatch Events responds to these operational changes and takes corrective action as necessary, by sending messages to respond to the environment, activating functions, making changes, and capturing state information.
You can also use CloudWatch Events to schedule automated actions that self-trigger at certain times using cron or rate expressions.
#21 A rule matches incoming events and routes them to targets for processing. A single rule can route to multiple targets, all of which are processed in parallel. Rules are not processed in a particular order. This enables different parts of an organization to look for and process the events that are of interest to them. A rule can customize the JSON sent to the target, by passing only certain parts or by overwriting it with a constant.
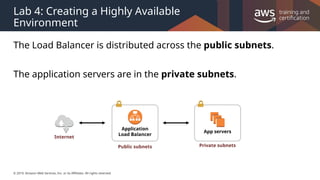
#22 A target processes events. Targets can include Amazon EC2 instances, AWS Lambda functions, Kinesis streams, Amazon ECS tasks, Step Functions state machines, Amazon SNS topics, Amazon SQS queues, and built-in targets. A target receives events in JSON format.
#23 Amazon CloudWatch is basically a metrics repository. An AWS service—such as Amazon EC2—puts metrics into the repository, and you retrieve statistics based on those metrics. If you put your own custom metrics into the repository, you can retrieve statistics on these metrics as well.
For more information, see https://docs.aws.amazon.com/AmazonCloudWatch/latest/monitoring/cloudwatch_architecture.html
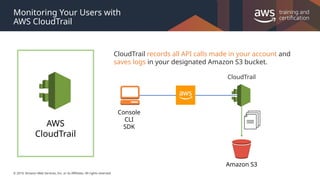
#24 AWS CloudTrail is a web service that records AWS API calls for your account and delivers log files to you. The recorded information includes the identity of the API caller, the time of the API call, the source IP address of the API caller, the request parameters, and the response elements returned by the AWS service.
With CloudTrail, you can get a history of AWS API calls for your account, including API calls made via the AWS Management Console, AWS SDKs, command line tools, and higher-level AWS services (such as AWS CloudFormation). The AWS API call history produced by CloudTrail enables security analysis, resource change tracking, and compliance auditing.
You turn on CloudTrail on a per-region basis. If you use multiple regions, you can choose where log files are delivered for each region. For example, you can have a separate Amazon S3 bucket for each region, or you can aggregate log files from all regions in a single Amazon S3 bucket.
For a list of AWS services supported by CloudTrail, see http://docs.aws.amazon.com/awscloudtrail/latest/userguide/cloudtrail-supported-services.html.
For more information about CloudTrail APN partners, see:
•Splunk: http://aws.amazon.com/cloudtrail/partners/splunk/
•AlertLogic: https://aws.amazon.com/cloudtrail/partners/alert-logic/
•SumoLogic: https://aws.amazon.com/cloudtrail/partners/sumo-logic/
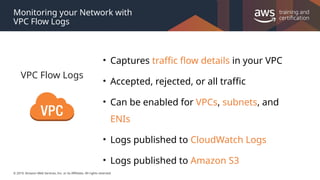
#25 VPC Flow Logs is a feature that enables you to capture information about the IP traffic going to and from network interfaces in your VPC. Flow log data is stored using Amazon CloudWatch Logs. After you've created a flow log, you can view and retrieve its data in Amazon CloudWatch Logs.
Flow logs can help you with a number of tasks—like troubleshooting why specific traffic is not reaching an instance, which in turn helps you diagnose security group rules that are overly restrictive. You can also use flow logs as a security tool to monitor the traffic that is reaching your instance.
Use cases:
Troubleshoot connectivity issues
Test network access rules
Monitor traffic
Detect and investigate security incidents
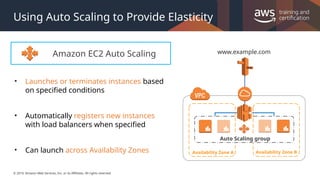
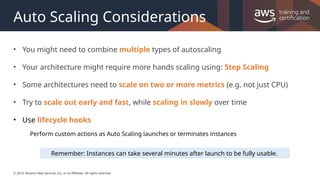
#27 If you specify scaling policies, then Auto Scaling can launch or terminate instances as demand on your application increases or decreases. Auto Scaling integrates with ELB to enable you to attach one or more load balancers to an existing Auto Scaling group. After you attach the load balancer, it automatically registers the instances in the group and distributes incoming traffic across the instances.
When one Availability Zone becomes unhealthy or unavailable, Auto Scaling launches new instances in an unaffected Availability Zone. When the unhealthy Availability Zone returns to a healthy state, Auto Scaling automatically redistributes the application instances evenly across all of the Availability Zones for your Auto Scaling group. Auto Scaling does this by attempting to launch new instances in the Availability Zone with the fewest instances. If the attempt fails, however, Auto Scaling attempts to launch in other Availability Zones until it succeeds.
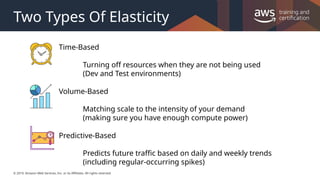
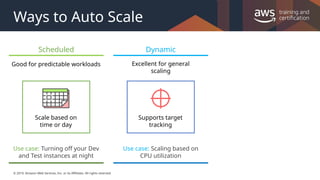
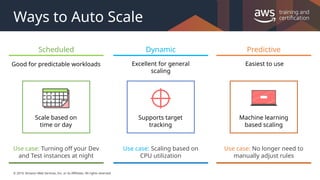
#28 Scaling based on a schedule allows you to scale your application ahead of known load changes. For example, every week the traffic to your web application starts to increase on Wednesday, remains high on Thursday, and starts to decrease on Friday. You can plan your scaling activities based on the known traffic patterns of your web application.
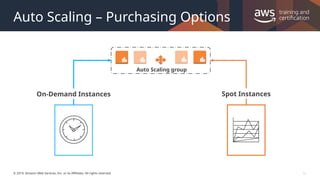
#31 Amazon EC2 Auto Scaling supports multiple purchasing options within the same Auto Scaling group (ASG). You can include Spot, On-Demand, and Reserved Instances (RIs) (which are on-demand instances until after the bill is processed) within a single ASG, allowing you to save up to 90% on compute costs.
Using Amazon EC2 Fleet, you can define a combination of EC2 instance types to make up the desired capacity of your ASG. This is defined as a percentage of each type of purchasing option. EC2 Auto Scaling will maintain the desired cost optimization as your ASG scales in or out. ASGs made up of mixed fleets still support the same lifecycle hooks, instance health checks, and scheduled scaling as a single-fleet ASG.
The following options can be configured when defining an ASG using combined purchasing models and instance types:
Maximum Spot Price: Sets the maximum Spot price for instances in the ASG.
Spot Allocation Strategy: Configure the per-Availability Zone diversity. This is especially helpful when particular instance types are in high demand in a single Availability Zone.
(Optional) On-Demand Base: Configure the initial capacity to be made up of On-Demand Instances. This is independent of the percentage of On-Demand Instances making up the total capacity.
On-Demand Percentage Above Base: Controls the percentage of On-Demand Instances to add on to the initial group.
A mixed-fleet configuration can be combined with different EC2 instance types with varying amounts of RAM and vCPU capacity. EC2 Auto Scaling will automatically provision the lowest price combination to meet the desired capacity.
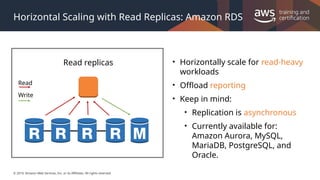
#35 Read replicas with PostgreSQL have specific requirements. For more information, see: http://docs.aws.amazon.com/AmazonRDS/latest/UserGuide/USER_ReadRepl.html#USER_ReadRepl.PostgreSQL
Oracle supports read replicas with Dataguard. For more information see: https://aws.amazon.com/about-aws/whats-new/2019/03/Amazon-RDS-for-Oracle-Now-Supports-In-region-Read-Replicas-with-Active-Data-Guard-for-Read-Scalability-and-Availability/
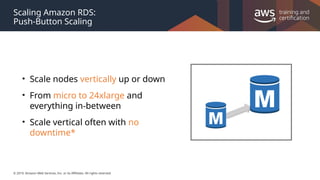
#36 Using the Amazon RDS APIs or a few clicks of the console, you can scale the compute and memory resources powering your deployment up or down. Scaling operations typically finish within a few minutes. *Note that normal RDS requires a short downtime of 1-2 minutes when scaled, but aurora serverless can scale without any downtime.
As your storage requirements grow, you can provision additional storage on-the-fly with zero downtime. If you are using RDS PIOPS (with the exception of Amazon RDS with SQL Server), you can also scale the throughput of your DB instance by specifying the IOPS rate from 1,000 IOPS to 30,000 IOPS in 1,000 IOPS increments and storage from 100GB and 6TB.
Storage can be increased with no downtime. However, changing instance type requires downtime. Refer to https://aws.amazon.com/blogs/database/scaling-your-amazon-rds-instance-vertically-and-horizontally
Amazon RDS for SQL Server does not currently support increasing storage or IOPS of an existing SQL Server DB instance.
There is minimal downtime when you are scaling up on a multi-Availability Zone environment because the standby database gets upgraded first, then a failover will occur to the newly sized database. A single-Availability Zone instance will be unavailable during the scale operation. To see a table that describes what DB instance changes will cause downtime, see http://docs.aws.amazon.com/AmazonRDS/latest/UserGuide/Overview.DBInstance.Modifying.html#USER_ModifyInstance.Settings.
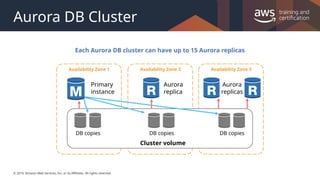
#37 Primary instance – Supports read and write operations, and performs all of the data modifications to the cluster volume. Each Aurora DB cluster has one primary instance.
Aurora replica – Supports only read operations. Each Aurora DB cluster can have up to 15 Aurora replicas in addition to the primary instance. Multiple Aurora replicas distribute the read workload, and by locating Aurora replicas in separate Availability Zones, you can also increase database availability.
Note that you can have a read replica in the same region as the master.
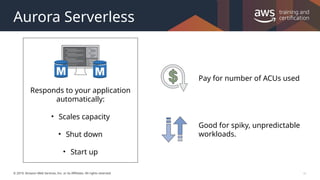
#38 Amazon Aurora Serverless is an on-demand, auto scaling configuration for Amazon Aurora as a relational database. An Aurora Serverless DB cluster is a DB cluster that automatically starts up, shuts down, and scales up or down capacity based on your application's needs without the need for managing database server infrastructure.
Aurora Serverless provides a relatively simple, cost-effective option for infrequent, intermittent, or unpredictable workloads. It can provide this because it automatically starts up, scales capacity to match your application's usage, and shuts down when it's not in use. You define a maximum and minimum Aurora Capacity Units (ACU) and pay for the number of ACUs used.
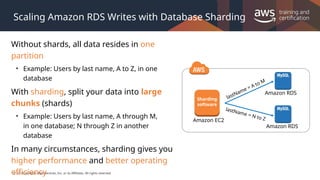
#39 Sharding is a technique for improving the performance of writing with multiple database servers. Fundamentally, databases with identical structures are prepared and divided using appropriate table columns as keys, to distribute the writing processes. The use of the RDBMS service provided in the AWS Cloud lets you perform this sharding to achieve an increase in availability and operating efficiency.
You can use Amazon RDS in sharding backend databases. Install sharding software such as MySQL server combined with a Spider Storage Engine on an Amazon EC2 instance. Prepare multiple RDSs and use them as the sharding backend databases. You can distribute the RDSs to multiple regions.
For more information, see http://en.clouddesignpattern.org/index.php/CDP:Sharding_Write_Pattern.
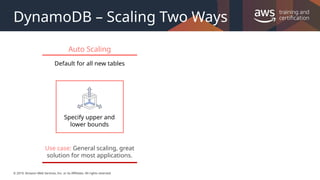
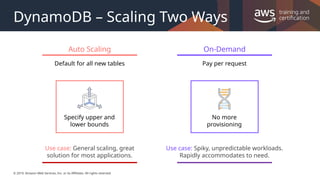
#40 When you create a new DynamoDB table using the console, the table will have Auto Scaling enabled by default. DynamoDB Auto Scaling automatically adjusts read and write throughput capacity in response to dynamically changing request volumes, with zero downtime. With DynamoDB Auto Scaling, you simply set your desired throughput utilization target, minimum and maximum limits, and Auto Scaling takes care of the rest.
DynamoDB Auto Scaling works with Amazon CloudWatch to continuously monitor actual throughput consumption, and scales capacity up or down automatically, when actual utilization deviates from your target. Auto Scaling can be enabled for new and existing tables, and global secondary indexes. You can enable Auto Scaling with just a few clicks in the console, where you'll also have full visibility into scaling activities. You can also manage DynamoDB Auto Scaling programmatically, using the AWS Command Line Interface and the AWS Software Development Kits.
There is no additional cost to use DynamoDB Auto Scaling, beyond what you already pay for DynamoDB and CloudWatch alarms. DynamoDB Auto Scaling is available in all AWS regions, effective immediately.
#41 Amazon DynamoDB On-Demand is a flexible billing option for DynamoDB capable of serving thousands of requests per second without capacity planning. It moves to a pay-per-request pricing, instead of a provisioned pricing model. DynamoDB On-Demand can observe any increase or scale of traffic level. If the level of traffic hits a new peak, DynamoDB adapts rapidly to accommodate the workload. This is useful if your workload is difficult to predict, or has large spikes over a short duration. You can change a table from provisioned capacity to on-demand once per day. You can go from on-demand capacity to provisioned as often as you want.
https://aws.amazon.com/blogs/aws/amazon-dynamodb-on-demand-no-capacity-planning-and-pay-per-request-pricing/
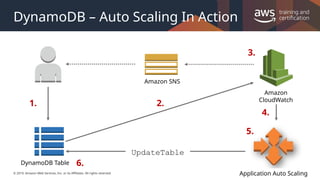
#42 Create an Application Auto Scaling policy for your DynamoDB table.
DynamoDB publishes consumed capacity metrics to Amazon CloudWatch.
If the table's consumed capacity exceeds your target utilization (or falls below the target) for a specific length of time, Amazon CloudWatch triggers an alarm. You can view the alarm on the console and receive notifications using Amazon SNS.
The CloudWatch alarm invokes Application Auto Scaling to evaluate your scaling policy.
Application Auto Scaling issues an UpdateTable request to adjust your table's provisioned throughput.
DynamoDB processes the UpdateTable request, dynamically increasing (or decreasing) the table's provisioned throughput capacity so that it approaches your target utilization.
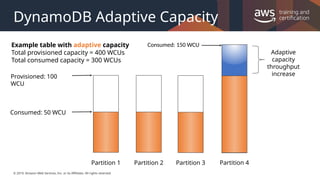
#43 It's not always possible to distribute read and write activity evenly all the time. When data access is imbalanced, a "hot" partition can receive such a higher volume of read and write traffic compared to other partitions. In extreme cases, throttling can occur if a single partition receives more than 3,000 RCUs or 1,000 WCUs.
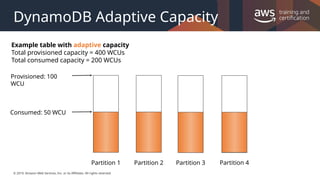
To better accommodate uneven access patterns, DynamoDB adaptive capacity enables your application to continue reading and writing to hot partitions without being throttled, provided that traffic does not exceed your table’s total provisioned capacity or the partition maximum capacity. Adaptive capacity works by automatically increasing throughput capacity for partitions that receive more traffic.
Adaptive capacity is enabled automatically for every DynamoDB table, so you don't need to explicitly enable or disable it.
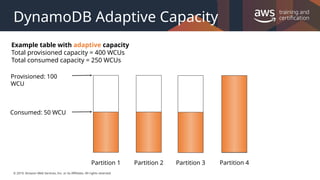
The following diagram illustrates how adaptive capacity works. The example table is provisioned with 400 write-capacity units (WCUs) evenly shared across four partitions, allowing each partition to sustain up to 100 WCUs per second. Partitions 1, 2, and 3 each receive write traffic of 50 WCU/sec. Partition 4 receives 150 WCU/sec. This hot partition can accept write traffic while it still has unused burst capacity, but eventually it will throttle traffic that exceeds 100 WCU/sec.
DynamoDB adaptive capacity responds by increasing partition 4's capacity so that it can sustain the higher workload of 150 WCU/sec without being throttled.
For more information, see
https://docs.aws.amazon.com/amazondynamodb/latest/developerguide/bp-partition-key-design.html.
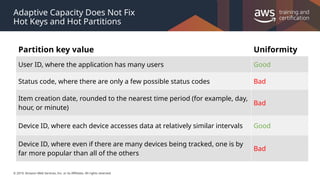
#46 The partition key portion of a table's primary key determines the logical partitions in which a table's data is stored. This in turn affects the underlying physical partitions. Provisioned I/O capacity for the table is divided evenly among these physical partitions. Therefore a partition key design that doesn't distribute I/O requests evenly can create "hot" partitions that result in throttling and use your provisioned I/O capacity inefficiently.
The optimal usage of a table's provisioned throughput depends not only on the workload patterns of individual items, but also on the partition-key design. This doesn't mean that you must access all partition key values to achieve an efficient throughput level, or even that the percentage of accessed partition key values must be high. It does mean that the more distinct partition key values that your workload accesses, the more those requests will be spread across the partitioned space. In general, you will use your provisioned throughput more efficiently as the ratio of partition key values accessed to the total number of partition key values increases.
For more information, see https://docs.aws.amazon.com/amazondynamodb/latest/developerguide/bp-partition-key-uniform-load.html


![© 2019, Amazon Web Services, Inc. or its Affiliates. All rights reserved.
CloudWatch Rules
{
"source": [ "aws.ec2" ],
"detail-type": [ "EC2
Instance State-change
Notification" ],
"detail": {
"state": [ “terminated" ]
}
}
Rule
Event
Logs
Events
Targets
Rules
Alarms
Metrics](https://image.slidesharecdn.com/architectingonawsmodule08-250629183231-6b5654cc/85/shhsbshsuhsbsjsjshsvsbsjsiusegbejsjsjsbsbs-21-320.jpg)
![© 2019, Amazon Web Services, Inc. or its Affiliates. All rights reserved.
CloudWatch Targets
EC2 instances
AWS Lambda
Kinesis streams
Amazon ECS
Step Functions
Amazon SNS
Amazon SQS
Targets
{
"source": [ "aws.ec2" ],
"detail-type": [ "EC2
Instance State-change
Notification" ],
"detail": {
"state": [ “terminated" ]
}
}
Rule
Event
Logs
Events
Targets
Rules
Alarms
Metrics](https://image.slidesharecdn.com/architectingonawsmodule08-250629183231-6b5654cc/85/shhsbshsuhsbsjsjshsvsbsjsiusegbejsjsjsbsbs-22-320.jpg)


![[AWS에서의 미디어 및 엔터테인먼트] AWS 개요, 클라우드 스토리지 및 Amazon CloudFront, Elastic Transcod...](https://cdn.slidesharecdn.com/ss_thumbnails/awsoverview-140219201920-phpapp02-thumbnail.jpg?width=640&height=640&fit=bounds)


