The document discusses Shell's valuation and upcoming changes to its weighting in various stock indices due to the unification of Royal Dutch Petroleum and Shell Transport and Trading. It finds:
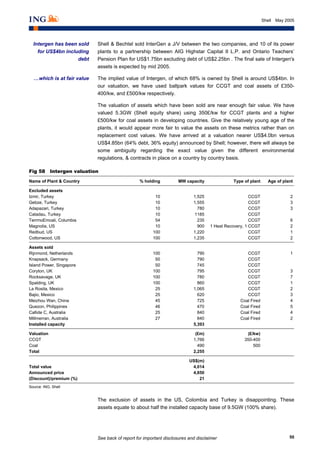
1) Shell is set to become the largest constituent of the FTSE 100, with a weighting of around 9.8% compared to its current weighting of 3.9%.
2) Shell's stock price may see a short-term rally in the weeks leading up to the index change as fund managers adjust their portfolios, but longer term fundamentals will determine valuation.
3) Academic studies show stock prices see only modest abnormal returns in the months following inclusion in or exclusion from major indices.
4) Investors in