More Related Content Similar to Sheet1Create a Status Report for your company or any other company.docx (20) More from edgar6wallace88877 (20) 1. Sheet1Create a Status Report for your company or any other
company using the template provided.Rubric for Assignment
Unit 9 - Status ReportMaxYour
Points1. Use of Template502. 4 Additional Slides 40 Status
charts are used as control mechanisms to convey the health of
the ongoing project and alert management to any execution
problems. The red, yellow, green rating and description chart
was the legend for the status on the cover page. Grammar -
Organization - Spelling10Late -10% Total 100
Sheet2
Sheet3
Extent
(How Much)
Decisions
4
©2018 Cengage Learning. All Rights Reserved. May not be
copied, scanned, or duplicated, in whole or in part, except for
use as permitted in a license distributed with a certain product
or service or otherwise on a password-protected website for
classroom use. ©Kamira/Shutterstock Images
CHAPTER
Do not confuse average and marginal costs.
Average cost (AC) is total cost (fixed and variable) divided by
total units produced.
Average cost is irrelevant to an extent decision.
Marginal cost (MC) is the additional cost incurred by producing
and selling one more unit.
Marginal revenue (MR) is the additional revenue gained from
selling one more unit.
2. Sell more if MR > MC; sell less if MR < MC. If MR = MC, you
are selling the right amount (maximizing profit!).
2
©2018 Cengage Learning. All Rights Reserved. May not be
copied, scanned, or duplicated, in whole or in part, except for
use as permitted in a license distributed with a certain product
or service or otherwise on a password-protected website for
classroom use. ©Kamira/Shutterstock Images
The relevant costs and benefits of an extent decision are
marginal costs and marginal revenue. If the marginal revenue of
an activity is larger than the marginal cost, then do more of it.
An incentive compensation scheme that increases marginal
revenue or reduces marginal cost will increase effort. Fixed fees
have no effects on effort.
A good incentive compensation scheme links pay to
performance measures that reflect effort.
3
continued
©2018 Cengage Learning. All Rights Reserved. May not be
copied, scanned, or duplicated, in whole or in part, except for
use as permitted in a license distributed with a certain product
or service or otherwise on a password-protected website for
classroom use. ©Kamira/Shutterstock Images
US Financial Crisis
The financial crisis began in the subprime housing market,
where government policies encouraged lenders to extend credit
to low-income borrowers (by lowering lending standards)
These high-risk loans, or mortgages, were being packaged into
securities by lenders and sold to investors.
If the risk had been recognized investor demand would have
been low, but rating agencies were too liberal with AAA
3. ratings, increasing demand for loans.
The result? A credit “bubble”
How did this lending crisis arise?
4
©2018 Cengage Learning. All Rights Reserved. May not be
copied, scanned, or duplicated, in whole or in part, except for
use as permitted in a license distributed with a certain product
or service or otherwise on a password-protected website for
classroom use. ©Kamira/Shutterstock Images
Average Cost Caution!
Memorial Hospital’s CEO conducted performance reviews of
the hospital departments.
During this process, the chief of obstetrics proposed an increase
in the number of babies being delivered in his department.
The CEO wondered why since the cost of delivering babies was
higher than the revenues brought in.
The CEO’s mistake: He began with the costs instead of the
decision.
He committed the fixed-cost fallacy by looking at average cost,
which include costs that do not vary with the decision.
If he had ignored fixed costs, he would have seen that
increasing the number of deliveries would increase profit.
5
©2018 Cengage Learning. All Rights Reserved. May not be
copied, scanned, or duplicated, in whole or in part, except for
use as permitted in a license distributed with a certain product
or service or otherwise on a password-protected website for
classroom use. ©Kamira/Shutterstock Images
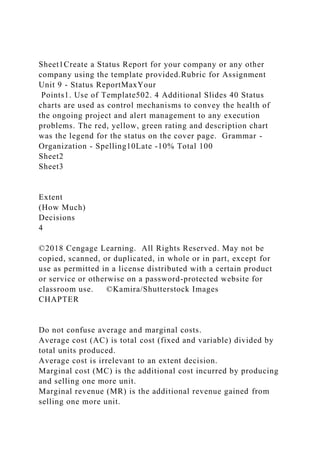
Background: Average Cost
Definition: Average cost (AC) is simply the total cost (TC) of
production divided by the number of units produced (Q).
4. AC = TC/Q
Average costs often decrease as quantity increases due to
presence of fixed costs (FC)
AC = (VC + FC)/Q
FC does not change as Q increases
Key note: Average costs are not relevant to extent decisions
6
©2018 Cengage Learning. All Rights Reserved. May not be
copied, scanned, or duplicated, in whole or in part, except for
use as permitted in a license distributed with a certain product
or service or otherwise on a password-protected website for
classroom use. ©Kamira/Shutterstock Images
Background: Average Cost (cont.)
7
FIGURE 4.1 Average Cost Curve
©2018 Cengage Learning. All Rights Reserved. May not be
copied, scanned, or duplicated, in whole or in part, except for
use as permitted in a license distributed with a certain product
or service or otherwise on a password-protected website for
classroom use. ©Kamira/Shutterstock Images
Memorial Hospital Revisited
Memorial made 500 deliveries originally
Fixed cost: $1,000,000
Variable cost: $3,000/delivery
Total cost: $1,000,000 + ($3,000 x 500)
Average cost: total costs/# of deliveries
Average costs fall as you increase output, but the variable costs
remain constant
Marginal cost is only $3,000 at Memorial Hospital
8
5. ©2018 Cengage Learning. All Rights Reserved. May not be
copied, scanned, or duplicated, in whole or in part, except for
use as permitted in a license distributed with a certain product
or service or otherwise on a password-protected website for
classroom use. ©Kamira/Shutterstock Images
Marginal Cost & Marginal Revenue
Definition: Marginal cost is the additional cost to make and sell
one additional unit of output (Q)
MC = TCQ+1 – TCQ
Marginal cost is often lower than average cost (due to fixed
costs) but not always
Marginal costs are what matter in extent decisions
Definition: Marginal revenue (MR) is the additional revenue
gained from producing and selling one more unit.
9
©2018 Cengage Learning. All Rights Reserved. May not be
copied, scanned, or duplicated, in whole or in part, except for
use as permitted in a license distributed with a certain product
or service or otherwise on a password-protected website for
classroom use. ©Kamira/Shutterstock Images
Extent Decisions
Examples of extent decisions:
Should you change the level of advertising?
Should you increase the quality of service?
Is your staff big enough, or too big?
How many parking spaces should you lease?
For extent decisions, we break the decision into small steps
If taking a step provides more benefit than cost, take a step
forward
If not, step backward
10
©2018 Cengage Learning. All Rights Reserved. May not be
6. copied, scanned, or duplicated, in whole or in part, except for
use as permitted in a license distributed with a certain product
or service or otherwise on a password-protected website for
classroom use. ©Kamira/Shutterstock Images
Extent (How Much?) Decisions
This analysis tells you direction of change but not the distance.
You can only measure MR and MC at the current level of output
– make a change and re-measure
If the benefits of selling another unit (MR) are bigger than the
costs (MC), then sell another unit.
Maxim:
Produce more when MR>MC
Produce less when MR<MC
Profits are maximized when MR=MC
11
©2018 Cengage Learning. All Rights Reserved. May not be
copied, scanned, or duplicated, in whole or in part, except for
use as permitted in a license distributed with a certain product
or service or otherwise on a password-protected website for
classroom use. ©Kamira/Shutterstock Images
Memorial Hospital Marginal Analysis
As we mentioned, the MC of a delivery was $3,000
The MR was $5,000
Therefore, MR>MC so the hospital was not delivering enough
babies
This explains why the CEO was wrong
12
©2018 Cengage Learning. All Rights Reserved. May not be
copied, scanned, or duplicated, in whole or in part, except for
use as permitted in a license distributed with a certain product
or service or otherwise on a password-protected website for
classroom use. ©Kamira/Shutterstock Images
7. Advertising Extent Decision Example
Answering the “How much advertising?” question
A $50,000 increase in the TV ad budget brings in 1,000 new
customers
Estimated MCTV is $50 (the cost to get one more customer)
$50,000 / 1,000 = $50
If the marginal revenue generated by this customer is greater
than $50, do more advertising.
13
©2018 Cengage Learning. All Rights Reserved. May not be
copied, scanned, or duplicated, in whole or in part, except for
use as permitted in a license distributed with a certain product
or service or otherwise on a password-protected website for
classroom use. ©Kamira/Shutterstock Images
Advertising Extent Decision Example (cont.)
You know the direction (do more), but you do
not know how far to go
You have to take a step and re-compute marginal cost and
benefit to see if you should continue in the direction your
analysis originally pointed
you in
Also, even if we do not know the marginal revenue, we can still
use marginal analysis to make extent decisions
by comparing marginal effectiveness of different media
14
©2018 Cengage Learning. All Rights Reserved. May not be
copied, scanned, or duplicated, in whole or in part, except for
use as permitted in a license distributed with a certain product
or service or otherwise on a password-protected website for
classroom use. ©Kamira/Shutterstock Images
Competing Strategies & Marginal Analysis
8. Example: Compare TV advertising to telephone solicitation
The opportunity cost of spending one more $ on TV advertising
is the forgone opportunity to spend $ on telephone solicitation
Say you recently cut telephone (PH) budget by $10,000 and lost
100 customers
Estimated MCPH = $100= ($10,000 / 100)
So, to get one more customer costs $50 for TV and $100 for
phone
MCPH > MCTV so shift ad dollars from phone to TV
Advice: make changes one-at-a-time to gather valuable
information about marginal effectiveness of each medium
15
©2018 Cengage Learning. All Rights Reserved. May not be
copied, scanned, or duplicated, in whole or in part, except for
use as permitted in a license distributed with a certain product
or service or otherwise on a password-protected website for
classroom use. ©Kamira/Shutterstock Images
Textile Production Example
A textile company with manufacturing plants in Latin America
uses SAH=“Standard Absorbed Hours” a measure of textile
factory output
Allows managers to compare factories making different items,
e.g. t-shirt = 1 SAH while dress=3 SAH
Suppose Factory A has costs of $30 per SAH while Factory B
has cost of $20 per SAH. How can you profitably use this
information?
Should you move production to cheaper factory?
Make sure you are not including fixed costs in the analysis
Marginal costs matter, not average costs!
If the $20 and $30 rates are good MC proxies, shift some
production from Factory A to Factory B
16
©2018 Cengage Learning. All Rights Reserved. May not be
9. copied, scanned, or duplicated, in whole or in part, except for
use as permitted in a license distributed with a certain product
or service or otherwise on a password-protected website for
classroom use. ©Kamira/Shutterstock Images
Incentive Pay
Discussion: Royalty rates vs. fixed fee contracts
How hard to work is an extent decision so you can design
incentives to encourage hard work by using marginal analysis
Example: You receive two bids to harvest 100 trees on your
land
$150/tree or $15,000 for the right to harvest all the trees.
On your tract there are pines (worth $200) and fir (worth $100).
Which offer should you accept?
Hint: consider the effects of the two bids on the incentives of
the logger.
17
©2018 Cengage Learning. All Rights Reserved. May not be
copied, scanned, or duplicated, in whole or in part, except for
use as permitted in a license distributed with a certain product
or service or otherwise on a password-protected website for
classroom use. ©Kamira/Shutterstock Images
Tree Harvesting Answer
The bids have the same face value, but are very different in
terms of logger’s incentives
Fixed fee: the logger will ignore the $15,000 because it doesn’t
vary with the decision to cut down trees.
The logger will end up cutting down all trees that are profitable
to
cut down, MR>MC
Royalty Rate: The logger will only cut down trees trees that
generate profit of $150, MR>MC+150
Mix of $200- and $100-value trees – logger will harvest only
the $200
10. The landowner receives less money since the logger only
harvests one type of tree
Royalties deter some wealth-creating transactions as fir trees
are not harvested
18
©2018 Cengage Learning. All Rights Reserved. May not be
copied, scanned, or duplicated, in whole or in part, except for
use as permitted in a license distributed with a certain product
or service or otherwise on a password-protected website for
classroom use. ©Kamira/Shutterstock Images
Sales Commission Example
Motivating salespeople:
Expected sales level: 100 units @ $10,000/unit=$1M
Option 1: 10% commission
Option 2: 5% commission + $50,000 salary
Hint: consider incentives for salespeople
Use Option 1 because MR=$1000/sale > $500/sale, the MR
under Option 2
The sales force responds to larger marginal benefits of selling
with more effort
Lower sales effort under option 2 is called “shirking”
19
©2018 Cengage Learning. All Rights Reserved. May not be
copied, scanned, or duplicated, in whole or in part, except for
use as permitted in a license distributed with a certain product
or service or otherwise on a password-protected website for
classroom use. ©Kamira/Shutterstock Images
Tie Pay to Performance
A consulting firm COO received a flat salary of $75,000
After learning about the benefits of incentive pay
in class, the CEO changed COO compensation to
$50K + (1/3)* (Profits-$150K)
11. Profits increased 74% to $1.2 M
Compensation increased $75Kg$177K
Discussion: What are the disadvantages to incentive pay?
20
©2018 Cengage Learning. All Rights Reserved. May not be
copied, scanned, or duplicated, in whole or in part, except for
use as permitted in a license distributed with a certain product
or service or otherwise on a password-protected website for
classroom use. ©Kamira/Shutterstock Images
Title?
American Express offers a Platinum Card to affluent customers
In 2001, there were approximately 2,000 Platinum cardholders
in the Japanese market. Numbers had been limited to ensure
high quality customer service
With customer service technology advances, the company
considered expanding number of card holders
How many more should be added?
As more members are acquired, average spending per card
member decreases because the financial threshold for
membership is lowered
Costs of customer service rise for each additional member
added, and growing beyond a certain point would require
building and operating an additional call center
After analyzing the costs and benefits, American Express
realized that it should expand its offering to only 15,000 more
Platinum Card members
We call this an “extent” decision, because the company needed
to decide “how many” platinum cards to provide. In this
chapter, we show you how to make profitable extent decisions.
21
©2018 Cengage Learning. All Rights Reserved. May not be
copied, scanned, or duplicated, in whole or in part, except for
use as permitted in a license distributed with a certain product
12. or service or otherwise on a password-protected website for
classroom use. ©Kamira/Shutterstock Images
Type notes and comments here
Type notes and comments here
Headlines (Enter any tasks requiring upper management
assistance.)
Key Issues & Resolution Plan (Enter any issues/problems)
Key Risks & Mitigation Plan (Enter any risks and short
mitigation plan-use the 5 alternatives discussed in class.)
Type notes and comments here
Success Metrics:
ROI/Business Case
Etc.
Etc.
13. Accomplishments (Key milestones/deliverables)
Financial Metrics:
Budget (PRC) :
Forecast:
Actual
(Insert Project Name) (Month 2010)
Project Manager: [John Doinger]
Lead: [Jane Johnson]
Sponsor: [John Jonesame]
Project Description/Scope: [insert description] This is a test
example of a project status report to provide as an example for
team members to use in their monthly updates.
15. G
G
G
Project Timeline (completion dates)
Gate 1:
Scope Review/
Resources Assigned
August 2010
Gate 2:
Plan/Funding
Approval
Sept 30, 2010
Gate 3:
Pilot/Test
Approval
Apr. 30, 2011
Gate 4:
Implementation
Approval
July 2011
Gate 5:
Verification
Dec. 2011
Plan
Initiate
Design/Dev
Pilot/Test
Implement
16. Gate 0:
Project Approval
July 2010
Put any Logo Here
Red-Yellow-Green Rating Descriptions and
CriteriaRedYellowGreenDescriptionUnable to meet cost,
schedule or qualityIf corrective actions are successful, then
cost, schedule and quality can be metAble to meet cost,
schedule and qualityOverall StatusSummary of current and
forecasted project status across key dimensionsAny component
is Red; 3 or more are Yellow None Red; 2 or 3 are Yellow; rest
GreenNone Red; no more than 1 Yellow; rest GreenTimeline /
MilestonesPerformance against timeline10% or more slippage to
project duration0-10% slippage to project durationNo slippage
to project durationFinancial & Budget ManagementFinancial-
performance against project financial targets and breakeven;
Budget- % spent and contractually committed vs. plan, compare
to work completed vs. planFinancial- >= 5% worse than target
or < breakeven; Budget- >= 5% above plan (actual +
contractually committed) or $100kFinancial- < 5% worse than
target and > breakeven; Budget- < 5% above plan (actual +
contractually committed) or $100kFinancial- project
performance on track; Budget- on plan (actual + contractually
committed)Risk ManagementIndicator of degree of risk to
successful project executionMore than 2 open, high priority
(RED) risk1-2 open, high priority (RED) riskNo open high
priority, critical (RED) risksIssue ManagementIndicator of
progress on critical, high priority issues and action items. Focus
on issues that impact delivery date, cost, project quality or
benefits and/or require elevation to resolve.3 or more Open
issues and Priority = High or Urgent1 or 2 Open issues and
Priority = High or UrgentNo OPEN issues