This lab report summarizes an experiment to calculate the critical speed of a flexible shaft rotor assembly with three disks. Key points:
1) The student was unable to perform the physical experiment due to equipment issues. Instead, calculations of critical speed and disk deflection were performed analytically.
2) Parameters like disk locations, sizes, and shaft properties were used to calculate deflections and critical speeds with and without including shaft weight.
3) Results were presented in tables and comparisons were made between theoretical values calculated in Excel.
4) The analytical approach provided estimates of critical speed around 228-231 RPM, which could be compared to experimental ranges had the lab been performed.
• Cooperated with fellow colleagues in a lab environment and experimented on the science of fluid flow through various types of piping and fittings.
• Researched the head loss that is caused in different piping including Venturi pipe, orifice plate, and elbow pipe fittings.
A Guide to Technical Report Writing Australian Col.docxaryan532920
A Guide to
Technical Report Writing
Australian College of Kuwait
School of Engineering
Engineering Skills (ENEG11001)
1. Introduction
Technical report writing is an essential part of engineering
communication - you are communicating the results of your
work to someone else.
Once ‘published’, your technical reports will become a long-
lasting record of your proficiency and ability as an Engineer.
The following topics will be discussed:
• General report layout and presentation
• Report sections
• Report formatting
• Tables, figures and graphs
2
2. General Report Layout and Presentation
The key points in effective written communication in
technical report writing are:
• Logical and neat presentation
• Clarity
• Concise expression
• Continuity between sections
When you write a report be mindful of the purpose of the
report. More is not necessarily better – give enough detail so
that you present a convincing case. Third person, past tense is
generally accepted.
3
2. General Report Layout and Presentation
Some important points to note:
• Only print on one face of each page
• Bind the report so that it is easy to read and ensure
that no part of the report is concealed by the binding
• Ensure that tables, figures etc. are not ‘fragmented’
over two pages
• Ensure that a section heading is not separated from
the section text due to end of page/start of new page
• Use a spellchecker but be aware that it will not pick up
incorrect usage of words eg. there/their.
4
3. Report Sections
• Title Page
• Executive Summary
• Table of Contents
• List of Figures/Tables
• Abbreviations
• Acknowledgements
• Introduction
• Literature Review
• Methodology
• Results and/or Discussion
• Conclusion
• Reference List
• Appendices
5
3. Report Sections
• Please note, that while there is a basic standard layout for
technical report writing, you must accept the possibility of
variations in requirements for different ‘clients’.
• You must be flexible and adaptive in these circumstances.
• You need to be certain of the requirements for a specific
report.
6
3. Report Sections
3.1 Title Page
This should clearly show the name of the client, the report
title, report date, the author’s name and the author’s
organization.
The Title Page is the first page of the report to be viewed by
the reader and should show the above information clearly,
and be well presented.
7
3. Report Sections
3.2 Executive Summary
The Executive Summary is best left until the rest of the report
is written. A concise summary of the work contained in the
report should be given.
The Summary should be brief, but not omit any important
information. Abbreviations should only be used when they
are acceptable. The Summary should ‘stand alone’ without
reference to any other part of the report, and include the
main results of the work.
8
3. Rep ...
Process Simulation (CE2105) Aston University 1 Dr Amir ADaliaCulbertson719
Process Simulation (CE2105) Aston University
1
Dr Amir Amiri
Coursework
--------------------------------------------------------------------------------------------------------------
Important Notes:
1. The designated coursework enable you to demonstrate your skills in practical
utilisation of the commercial process simulators for process computations. Moreover,
you show your competence in analysing the results.
2. This is a group work in which all members MUST evenly contribute. Peer
assessment will be done to evaluate individual members’ contributions.
3. As the class test will be an individual assessment with similar elements to this work,
your attempts for this commitment certainly equip you with the necessary skills to
properly accomplish that part of the module’s assessment too.
4. The given problem is same for all groups. The contents that can make your work
more distinguishable are, but not limited to, a good literature review, rigorous results,
high quality interpretation, well managed and articulated report, etc. These are highly
recommended as definitely make your work outstanding.
5. Critical thinking and interpretation of the results is required and highly acknowledged.
The more professional/technical interpretation, the higher value. This is an open task
that you can put in creativity and analysis skills. Few examples, but not all, can be
commenting on: How well the process is simulated and if you see any problem how
you can resolve/improve it? What are the assumptions used for simulation simplicity
that might be risky for final results’ accuracy, why? Can these assumptions be
avoided? If so how? How the simulation results improves your understandings about
this case study? How can you use them to suggest process improvement strategies?
Support your answers with examples and results.
6. You should submit your simulation and report files. Maximum page limits are given
for some sections of the report, and are indicated with square brackets.
7. You are welcome to ask your questions by contacting Lecture/tutors. The
response(s) to your question might be posted on the website (BB) to be accessible
by all students.
8. Further guidance will be given in lecture/tutorial times or via the website updates.
Technical tasks and report preparation
Part A: Simulation Principle and VLE [Repot: 4 pages, Marks: 20]
(a) Which Fluid Package/Property Method can be suitable for this simulation? Justify
your answer through Vapour Liquid Equilibrium (VLE) evaluation.
Note: In order to make decision on which Fluid Package/Properly Method is
suitable for this project, you may compare VLE data (such as xy, Txy and Pxy
equilibrium data) attained using 3 to 4 Fluid Package/Property Method and judge
which one(s) are more reliable. Moreover, you may compare the theoretical xy
data (achieved by using Fluid Package/Property Method) with practical data for
the same species and under same conditions (T, P). For practical data you may
refer ...
This template was created for DSCE, Aeronautical students. You have to replace the institution details.
Create a separate document for each chapter, so that under numbering, you can change the sequence of chapter main heading according to chapter wise. i.e., 2.1, 2.2 etc.
Same procedure is applicable to Figure caption and Table caption.
This template can be used to generate, BE seminar report, M.Tech and Ph.D thesis also.
This template is created to assist UG students in generating their thesis without much hassle.
Contents are taken from VTU website. I don’t hold any copyright for this document.
Hareesha N G
Assistant Professor
DSCE, Bengaluru
Me 308 142 syllabus(2) . Electrical power transformer is a static device which transforms electrical energy from one circuit to another without any direct electrical connection and with the help of mutual induction between two windings. It transforms power from one circuit to another without changing its frequency but may be in different voltage level.
Applying fuzzy ahp to evaluate the carbon foot print on the workplace in educ...eSAT Publishing House
IJRET : International Journal of Research in Engineering and Technology is an international peer reviewed, online journal published by eSAT Publishing House for the enhancement of research in various disciplines of Engineering and Technology. The aim and scope of the journal is to provide an academic medium and an important reference for the advancement and dissemination of research results that support high-level learning, teaching and research in the fields of Engineering and Technology. We bring together Scientists, Academician, Field Engineers, Scholars and Students of related fields of Engineering and Technology
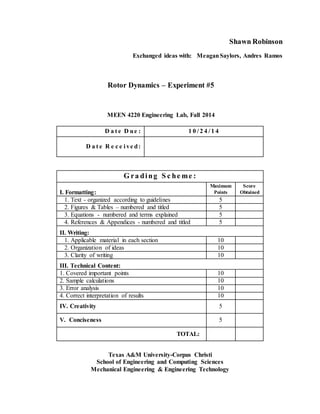
1. Shawn Robinson
Exchanged ideas with: MeaganSaylors, Andres Ramos
Rotor Dynamics – Experiment #5
MEEN 4220 Engineering Lab, Fall 2014
D a t e D ue : 1 0 / 2 4 / 1 4
D a t e R e c e i ve d:
G ra ding S c he me :
I. Formatting:
Maximum
Points
Score
Obtained
1. Text - organized according to guidelines 5
2. Figures & Tables – numbered and titled 5
3. Equations - numbered and terms explained 5
4. References & Appendices - numbered and titled 5
II. Writing:
1. Applicable material in each section 10
2. Organization of ideas 10
3. Clarity of writing 10
III. Technical Content:
1. Covered important points 10
2. Sample calculations 10
3. Error analysis 10
4. Correct interpretation of results 10
IV. Creativity 5
V. Conciseness 5
TOTAL:
Texas A&M University-Corpus Christi
School of Engineering and Computing Sciences
Mechanical Engineering & Engineering Technology
2. Objectives:
Evaluate experimentally and analytically the critical speed and perform balancing of a flexible
shaft rotor assembly.
Materials:
Procedure:
My lab class did not get to perform the lab experiment. This lab report will focus on the
calculations of the experiment.
1. Measure the location of the rotors along the shaft and the distance between bearings.
2. Measure the shaft diameter, and the thickness and diameter of each rotor. Calculate their masses
3.
3. For Young’s modulus of the shaft material E=207MPa, calculate the critical speeds of the rotor
assembly in RPM with and without neglecting the weight of the shaft
Results:
3. Deflection due to shaft
Deflection due to Disk (repeat 3x)
Data Analysis:
Compare the results and explain the differences between the experimentally determined and the
calculated critical speeds. Formulas were put into excel to calculate theoretical values. Equations used ae
in appendix B.
Table.1 – Disk 1 deflection
Table.3 – Disk 3 deflection
Table.2 – Disk 2 deflection
4. Error Analysis:
My deflection values were all around 1*E-5(m) in magnitude. My critical speed for the disk was
228.85 rpm, and 231.55rpm with the shaft deflection values. Because we didn’t get to do the
experiment we don’t have any values to compare with other than ballpark range answers.
Table.4 – Disk and max deflections
Table.7 – Critical speed calculations
Table.6 – deflections of Disk w/ Shaft
Table.5 –deflections of Disk w/o Shaft
5. Conclusion:
In conclusion, the critical speed and deflections for a shaft with weighted disk can be calculated.
This method can be used to balance cam shafts and other industrial equipment. We did not get to
perform the full experiment due to system malfunction.
References:
P.A. Simionescu, Class Notes, Texas A&M Corpus Christi, Fall 2014.
J.L. Meriam and L. G. Kraige, Engineering Mechanics: Dynamics, Wiley, 7th ed., 2012.
AppendixA – ExperimentI
Appendix B – Calculations