
Recommended
Recommended
More Related Content
Similar to 05_2017_PSE_Monthly_Report_Preview.pdf
Similar to 05_2017_PSE_Monthly_Report_Preview.pdf (20)
More from srichardequip
Recently uploaded
Recently uploaded (20)
05_2017_PSE_Monthly_Report_Preview.pdf
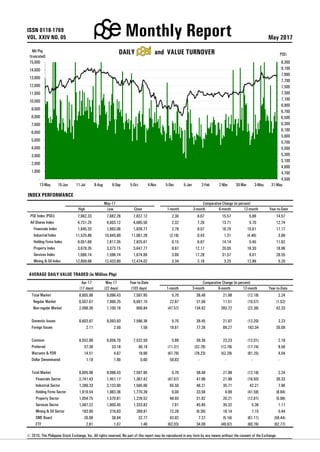
- 1. May 2017 Monthly Report 4,500 4,700 4,900 5,100 5,300 5,500 5,700 5,900 6,100 6,300 6,500 6,700 6,900 7,100 7,300 7,500 7,700 7,900 8,100 8,300 - 1,000 2,000 3,000 4,000 5,000 6,000 7,000 8,000 9,000 10,000 11,000 12,000 13,000 14,000 15,000 13-May 10-Jun 11-Jul 8-Aug 6-Sep 5-Oct 4-Nov 5-Dec 5-Jan 2-Feb 2-Mar 30-Mar 3-May 31-May PSEi Mil Php (truncated) DAILY and VALUE TURNOVER ISSN 0118-1769 VOL. XXIV NO. 05 INDEX PERFORMANCE May-17 Comparative Change (in percent) High Low Close 1-month 3-month 6-month 12-month Year-to-Date PSE Index (PSEi) 7,962.33 7,682.26 7,837.12 2.30 8.67 15.57 5.88 14.57 All Shares Index 4,731.25 4,603.12 4,685.50 2.32 7.26 13.71 5.70 12.74 Financials Index 1,945.33 1,893.06 1,939.77 2.79 9.07 16.70 15.61 17.17 Industrial Index 11,525.86 10,945.89 11,061.28 (2.18) 0.43 1.31 (4.46) 3.86 Holding Firms Index 8,051.69 7,817.35 7,825.61 0.15 6.87 14.14 5.45 11.92 Property Index 3,679.35 3,373.15 3,647.77 9.67 12.17 20.05 16.30 18.96 Services Index 1,686.14 1,596.74 1,674.89 3.69 17.28 31.57 9.61 28.55 Mining & Oil Index 12,809.68 12,433.80 12,474.02 3.34 2.18 3.25 12.89 5.20 AVERAGE DAILY VALUE TRADED (in Million Php) Apr-17 May-17 Year-to-Date Comparative Change (in percent) (17 days) (22 days) (103 days) 1-month 3-month 6-month 12-month Year-to-Date Total Market 8,605.98 9,096.43 7,597.95 5.70 38.46 21.98 (12.18) 2.24 Regular Market 6,507.67 7,996.25 6,691.10 22.87 31.06 11.51 (10.57) (1.52) Non-regular Market 2,098.30 1,100.18 906.84 (47.57) 134.92 283.72 (22.36) 42.33 Domestic Issues 8,603.87 9,093.93 7,596.36 5.70 38.45 21.97 (12.20) 2.23 Foreign Issues 2.11 2.50 1.59 18.61 77.26 69.27 192.34 35.09 Common 8,552.89 9,056.70 7,532.50 5.89 39.36 22.23 (12.01) 2.18 Preferred 37.39 33.16 46.19 (11.31) (32.76) (12.78) (17.74) 9.56 Warrants & PDR 14.51 4.67 18.66 (67.79) (78.23) (52.29) (81.25) 4.04 Dollar Denominated 1.19 1.90 0.60 59.83 - - - - Total Market 8,605.98 9,096.43 7,597.95 5.70 38.46 21.98 (12.18) 2.24 Financials Sector 2,741.43 1,451.17 1,367.42 (47.07) 47.96 21.96 (16.93) 30.33 Industrial Sector 1,289.33 2,133.90 1,595.66 65.50 48.21 35.71 42.21 7.96 Holding Firms Sector 1,819.54 1,983.36 1,770.39 9.00 33.58 4.69 (41.59) (8.84) Property Sector 1,054.75 1,570.81 1,226.52 48.93 31.82 20.21 (12.61) (5.98) Services Sector 1,487.22 1,600.45 1,333.82 7.61 45.85 35.32 5.36 1.11 Mining & Oil Sector 183.90 316.83 269.91 72.28 (6.30) 18.14 7.15 5.44 SME Board 26.99 38.84 32.77 43.92 7.27 (5.16) (61.11) (58.44) ETF 2.81 1.07 1.46 (62.03) 34.09 (49.97) (60.76) (62.77) 2010, The Philippine Stock Exchange, Inc. All rights reserved. No part of this report may be reproduced in any form by any means without the consent of the Exchange.
- 2. 6,500 6,800 7,100 7,400 7,700 8,000 8,300 0 3,000 6,000 9,000 12,000 15,000 18,000 21,000 1 2 3 4 5 6 7 8 9 10 11 12 13 14 15 16 17 18 19 20 21 22 PSEi Value (Mil Php) MAY Monthly Report Table of Contents 1 Monthly Review 5 Monthly Feature 8 Business Cost Indicators Foreign Quotations Exchange Rates 9 Market Statistics Daily PSEi Daily Foreign Transactions Daily Trading Monthly Sector Summary Monthly Market Activity PSE Sector Indices Sector Index Performance & Trading Value Market Capitalization PSEi Constituents 15 Active Companies By Volume Turnover Ratio By Trading Frequency By Trading Value By Foreign Activity 17 Active Issues Gainers and Losers By Price Change By Change in Volume Traded By Net Foreign Buying By Net Foreign Selling 20 Active Trading Participants By Trading Value By Frequency 21 Trading Statistics 22 Fundamental Data & Financial Ratios 35 Corporate Disclosures Dividend Declaration Additional Listings Changes in Corporate Information Block Sales Schedule of Stockholders‟ Meeting 41 Directory of Trading Participants 46 PSE Board of Directors & Officers The data contained in the PSE Monthly Report were collated by the Corporate Planning and Research Department of the Philippine Stock Exchange. The views and comments presented by the writers in this report do not necessarily represent the views and comments of the PSE. The PSE does not make any representations or warranties on matters such as, but not limited to, the accuracy, timeliness, completeness, currentness, non-infringement, merchantability or fitness for any particular purpose of the information and data herein contained. The PSE assumes no liability and responsibility for any loss or damage suffered as a consequence of any errors or omissions in the report, or any decision made or action taken in reliance upon information contained herein. The information contained herein is for information purposes only, does not constitute investment advice, and is not intended to influence investment decisions. Advice from a securities professional is strongly recommended. For inquiries, suggestions or subscriptions to the Monthly Report, please call (632) 819-4100, or send a message by fax to (632) 864 - 9046, or email to pr@pse.com.ph. STOCK MARKET REPORT The benchmark PSEi closed the month on a positive note as it went up by 2.3% to 7,837.12 points from the previous month‟s 7,661.01 points. Share prices were pushed upward by a confluence of factors including optimism on the government‟s tax reform program and anticipation of first quarter GDP figures. The naming of the new BSP chief likewise signaled continuity in monetary policy which supported stock market trading during the month. Year-to date (YTD), the PSEi was up by 14.6% from its end-December finish of 6,840.64 points. Five out of six sector indices advanced during the month, led by the Property index at 9.7%. This was followed by Services, Mining and Oil, Financials, and Holding Firms indices, which grew by 3.7%, 3.3%, 2.8%, and 0.1%, respectively. Conversely, the Industrial index declined by 2.2%. The broader All-Shares index meanwhile gained 2.3% at the end of the month at 4,685.50 points from 4,579.20 points in April. Total value turnover in May increased by 36.8% to P200.12 billion from P146.30 billion the previous month. Year-on-year, however, this was 8.0% lower than the P217.52 billion total value turnover posted in May 2016. On the other hand, the average daily value turnover in May accelerated by 5.7% to P9.10 billion from P8.61 billion a month ago. YTD, average daily value turnover was posted at P7.60 billion, down by 2.7% from the 2016 full year average of P7.81 billion. Foreign investors were net buyers in May at P9.17 billion, albeit lower than the net foreign buying figures of P10.45 billion the past month, and P14.15 billion in May 2016. Foreign transactions accounted for 48.4% of the total market activity during the month. YTD, net foreign buying was recorded at P1.29 billion. The Philippine Stock Exchange welcomed Eagle Cement Corporation (EAGLE) in its roster of listed companies on 29 May 2017. EAGLE raised P7.50 billion through the sale of 500 million primary shares at P15.00 apiece. Shares of EAGLE capped the month at P15.62, up by 4.1% from its initial public offering price. MONTHLY REVIEW May 2017 1