Characterizing the Aggregation and Toxicity of the MJD-Associated Ataxin-3 Protein in C. elegans
1. Nakeirah Christie, Hannah Fay, Amy Lee, Sheana Algama, Jordan Grant, Fridien Tchoukoua, Paul Sands, Emily Javadi, David Spears, Jacob Zalewski, Emily Williams, John Peyton Bush
Abstract
Machado Joseph Disease (MJD) is a neurodegenerative disorder
caused by an expansion of CAG (polyQ) repeats within the gene
that codes for the ataxin-3 (AT3) protein. This expansion leads to
protein aggregation and a toxic-gain of function, but
understanding the mechanisms by which aggregated ataxin-3
affects cell function is not well understood. We utilize the model
organism C. elegans to investigate the toxicity and aggregation
of the ataxin-3 protein in different cell and tissue-
types. Specifically, we are interested in how cellular protein
homeostasis (“proteostasis”) impacts aggregation and toxicity of
the mutated protein in different tissues. To address this, we
characterized the aggregation and toxicity of a C-terminal
fragment of ataxin-3 (AT3CT) with various polyQ tract lengths
expressed in C. elegans body wall muscle cells or
neurons. Toxicity was determined by performing motility assays
and aggregation was determined by fluorescence microscopy.
Because it has previously been shown that neurons control the
organismal heat shock response, we wondered whether animals
expressing a disease-associated, aggregation-prone variant of
ataxin-3 in neurons would have an impaired HSR. To address
this, we performed qRT-PCR of heat-inducible genes.
Surprisingly, our data suggest that ataxin-3 expressed in neurons
has little effect on the organismal heat shock response, despite a
clear age-dependent increase in aggregation.
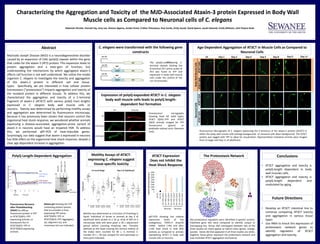
Age-Dependent Aggregation of AT3CT in Muscle Cells as Compared to
Neuronal Cells
Fluorescence Micrographs of C. elegans expressing the C-terminus of the ataxin-3 protein (AT3CT) in
either the body wall muscle cells (orange background) or neuronal cells (blue background). The AT3CT
protein was tagged with YFP to allow for visualization. Representative individual animals were imaged
from L4 stage until Day 11 of adulthood.
Motility was determined as a function of thrashing in
liquid. Individual L4 larvae or animals at day 4 of
adulthood were picked to a 10 µL drop of M9 on a
microscope slide and were given a 30 s adjustment
period before counting thrashing rate. Thrashes
(defined as the head crossing the vertical midline of
the body) were counted for 60 s. A minimal n-
number of n = 30 was assayed for each genotype or
time point indicated.
Characterizing the Aggregation and Toxicity of the MJD-Associated Ataxin-3 protein Expressed in Body Wall
Muscle cells as Compared to Neuronal cells of C. elegans
qRT-PCR showing the relative
expression levels of the
endogenous F44E5.4 (Hsp70)
mRNA before (-HS) and after
(+HS) heat shock in wild (N2)
animals as compared to animals
expredssing AT3CT in body wall
muscle cells or neurons.
Conclusions
• AT3CT aggregation and toxicity is
polyQ-length dependent in body
wall muscles cells.
• AT3CT aggregation and toxicity is
polyQ-length dependent and
modulated by aging.
Future Directions
• Develop an AT3CT intestinal line to
continue comparing AT3CT toxicity
and aggregation in various tissue
types
• Use RNAi to knock the expression of
proteostasis network genes to
identify regulators of AT3CT
aggregation and toxicity.
The polyQ-conAT3taining C-
terminal domain (lacking the
N-terminal 257 amino acids) of
AT3 was fused to YFP and
expressed in body wall muscle
cells under the control of the
unc-54 promoter.
YFP
unc-54
YFPAT3CT
Q45
unc-54
YFPAT3CT
Q63
unc-54
C. elegans were transformed with the following gene
constructs
L4
AT3CTQ45AT3CTQ63AT3CTQ14AT3CTQ75
Day 1 Day 2 Day 4 Day 8Day 5 Day 9 Day 11
GFP Phalloidin
N2
AT3CT(Q45)
AT3CT(Q63)
Expression of polyQ-expanded AT3CT in C. elegans
body wall muscle cells leads to polyQ length-
dependent foci formation
Fluorescence micrographs
showing fixed N2 (wild type),
AT3CT (Q45)::YFP and AT3CT
(Q63) animals imaged for YFP
fluorescence (green) or
phalloidin-stained actin filaments
(red).
0
20
40
60
80
100
120
140
0 10 20 30 40 50 60
RelativeFluorescenceIntensity
Time (s)bleach
AT3CT(Q63)
YFP
AT3CT(Q45) (foci)
AT3CT(Q45)
(diffuse)
Q0(YFP)
AT3CTQ45-YFP
AT3CTQ63-YFP
YFP
monomer
a
o
m
PolyQ Length-Dependent Aggregation
Native gel showing the YFP-
containing protein species
that accumulate in lines
expressing YFP alone,
At3CT(Q45)::YFP, or
AT3CT(Q63)::YFP. Aggregates
(a), oligomers (o), and
monomers (m) are indicated.
Fluorescence Recovery
after Photobleaching
(FRAP) for diffuse
fluorescent protein in YFP
or AT3CT(Q45)::YFP-
expressing animals, or
fluorescent foci in
AT3CT(Q45)::YFP or
AT3CT(Q63)-expressing
animals.
462 proteostasis regulators were identified in genetic screens.
Published gene lists were compared to identify unique or
overlapping hits. Genes that overlapped between two of the
three studies (21 total) appear as hybrid colors (green, orange,
purple). Genes (8) that appeared in all three studies are white.
Together, these genes represent the proteostasis network and
may modulate AT3CT aggregation and toxicity.
The Proteostasis NetworkAT3CT Expression
Does not Inhibit the
Heat Shock Response
Motility Assays of AT3CT-
expressing C. elegans suggest
tissue-specific toxicity
BodyWallMuscleCellsNeuronalCells
Muscles Neurons
0
500
1000
1500
2000
2500
3000
3500
4000
N2-HS
N2+HS
AT3CTQ45-HS
AT3CTQ45+HS
AT3CTQ63-HS
AT3CTQ63+HS
AT3CTQ14-HS
AT3CTQ14+HS
AT3CTQ75-HS
AT3CTQ75+HS
RelativeHsp70GeneExpression
N2 AT3CTQ45
(muscle)
AT3CTQ63
(muscle)
AT3CTQ14
(neurons)
AT3CTQ75
(neurons)
N2 AT3CTQ45
(muscle)
AT3CTQ63
(muscle)
AT3CTQ14
(neurons)
AT3CTQ75
(neurons)
L4 Larval Stage Day 4 of Adulthood
Thrashes/min
Thrashes/min