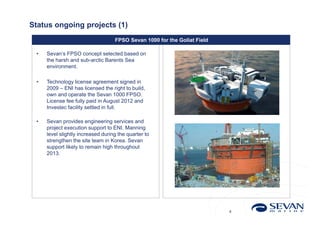
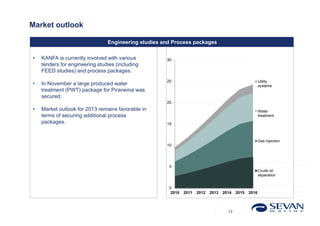
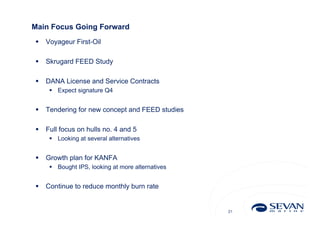
Sevan Marine ASA
                Presentation of third quarter results 2012


Shippingklubben, Oslo, November 21, 2012
Presented by:    Carl Lieungh, CEO
                 Kjetil Vangsnes, CFO                1
IMPORTANT INFORMATION

THIS PRESENTATION AND ITS ENCLOSURES AND APPENDICES (HEREINAFTER JOINTLY REFERRED TO AS THE “PRESENTATION”) HAVE BEEN PREPARED BY
SEVAN MARINE ASA (”SEVAN” OR THE ”COMPANY”) EXCLUSIVELY FOR INFORMATION PURPOSES. THIS PRESENTATION HAS NOT BEEN REVIEWED OR REGISTERED
WITH ANY PUBLIC AUTHORITY OR STOCK EXCHANGE. RECIPIENTS OF THIS PRESENTATION MAY NOT REPRODUCE, REDISTRIBUTE OR PASS ON, IN WHOLE OR IN
PART, THE PRESENTATION TO ANY OTHER PERSON.

THE CONTENTS OF THIS PRESENTATION ARE NOT TO BE CONSTRUED AS LEGAL, BUSINESS, INVESTMENT OR TAX ADVICE. EACH RECIPIENT SHOULD CONSULT
WITH ITS OWN LEGAL, BUSINESS, INVESTMENT AND TAX ADVISER AS TO LEGAL, BUSINESS, INVESTMENT AND TAX ADVICE.

THERE MAY HAVE BEEN CHANGES IN MATTERS WICH AFFECT THE COMPANY SUBSEQUENT TO THE DATE OF THIS PRESENTATION. NEITHER THE ISSUE NOR
DELIVERY OF THIS PRESENTATION SHALL UNDER ANY CIRCUMSTANCE CREATE ANY IMPLICATION THAT THE INFORMATION CONTAINED HEREIN IS CORRECT AS
OF ANY TIME SUBSEQUENT TO THE DATE HEREOF OR THAT THE AFFAIRS OF THE COMPANY HAVE NOT SINCE CHANGED, AND THE COMPANY DOES NOT INTEND,
AND DOES NOT ASSUME ANY OBLIGATION, TO UPDATE OR CORRECT ANY INFORMATION INCLUDED IN THIS PRESENTATION.

THIS PRESENTATION INCLUDES AND IS BASED ON, AMONG OTHER THINGS, FORWARD-LOOKING INFORMATION AND STATEMENTS. SUCH FORWARD-LOOKING
INFORMATION AND STATEMENTS ARE BASED ON THE CURRENT EXPECTATIONS, ESTIMATES AND PROJECTIONS OF SEVAN OR ASSUMPTIONS BASED ON
INFORMATION AVAILABLE TO THE COMPANY. SUCH FORWARD-LOOKING INFORMATION AND STATEMENTS REFLECT CURRENT VIEWS WITH RESPECT TO FUTURE
EVENTS AND ARE SUBJECT TO RISKS, UNCERTAINTIES AND ASSUMPTIONS. SEVAN CANNOT GIVE ANY ASSURANCE AS TO THE CORRECTNESS OF SUCH
INFORMATION AND STATEMENTS.

AN INVESTMENT IN THE COMPANY SHOULD BE CONSIDERED AS AN HIGH-RISK INVESTMENT, AND SEVERAL FACTORS COULD CAUSE THE ACTUAL RESULTS,
PERFORMANCE OR ACHIEVEMENTS OF THE COMPANY TO BE MATERIALLY DIFFERENT FROM ANY FUTURE RESULTS, PERFORMANCE OR ACHIEVEMENTS THAT
MAY BE EXPRESSED OR IMPLIED BY STATEMENTS AND INFORMATION IN THIS PRESENTATION, INCLUDING, AMONG OTHERS, RISKS OR UNCERTAINTIES
ASSOCIATED WITH THE RESTRUCTURING, THE COMPANY’S BUSINESS, SEGMENTS, DEVELOPMENT, MANAGEMENT, FINANCING, MARKET ACCEPTANCE AND
RELATIONS WITH CUSTOMERS, ABILITY TO SECURE EMPLOYMENY FOR ITS TWO HULLS, ABILITY TO IMPLEMENT COST REDUCING INITIATIVES, THE COMPANY’S
TECHNOLOGY AND OFFSHORE UNIT DESIGN, LATENT LIABILITIES ASSOCIATED WITH DIVESTED BUSINESSES, AND, MORE GENERALLY, GENERAL ECONOMIC AND
BUSINESS CONDITIONS, INCLUDING, BUT NOT LIMITED TO, WITHIN THE OIL AND GAS INDUSTRY, CHANGES IN DOMESTIC AND FOREIGN LAWS AND REGULATIONS,
TAXES, CUSTOMS DUTIES, VAT OR VARIATIONS THEREOF, CHANGES IN COMPETITION AND PRICING ENVIRONMENTS, FLUCTUATIONS IN CURRENCY EXCHANGE
RATES AND INTEREST RATES AND OTHER FACTORS. MOREOVER, THE CONTEMPLATED RESTRUCTURING IS ASSOCIATED WITH UNCERTANTIES AND MAY BE
CONSUMMATED IN A MANNER THAT DEVIATES FROM THE DISCUSSIONS CONTAINED IN THIS PRESENTATION, OR NOT AT ALL. READERS ARE CAUTIONED THAT,
EVEN IF THE RESTRUCTURING IS CONSUMMATED, THE COMPANY MAY NOT ACHIEVE THE BENEFITS FROM THE RESTRUCTURING, OR SUCCESSFULLY BE ABLE TO
IMPLEMENT ITS STRATEGIES, IMPLIED BY THIS PRESENTATION. SHOULD ONE OR MORE OF THESE RISKS OR UNCERTAINTIES MATERIALISE, OR SHOULD
UNDERLYING ASSUMPTIONS PROVE INCORRECT, ACTUAL RESULTS MAY VARY MATERIALLY FROM THOSE DESCRIBED IN THIS DOCUMENT. THE COMPANY DOES
NOT INTEND, AND DOES NOT ASSUME ANY OBLIGATION, TO UPDATE OR CORRECT THE INFORMATION INCLUDED IN THIS PRESENTATION.

THIS PRESENTATION DOES NOT CONSTITUTE OR FORM A PART OF, AND SHOULD NOT BE CONSTRUED AS, AN OFFER OR INVITATION TO SUBSCRIBE FOR OR
PURCHASE ANY SECURITIES OF THE COMPANY. NEITHER THIS PRESENTATION NOR ANYTHING CONTAINED HEREIN SHALL FORM THE BASIS OF, OR BE RELIED
ON IN CONNECTION WITH, ANY POTENTIAL TRANSACTION REFERRED TO IN THIS PRESENTATION. ANY POTENTIAL OFFER OF SECURITIES OF THE COMPANY
WOULD BE BASED ON A PROSPECTUS PREPARED FOR THAT PURPOSE.

THIS PRESENTATION IS SUBJECT TO NORWEGIAN LAW, AND ANY DISPUTE ARISING IN RESPECT OF THIS PRESENTATION IS SUBJECT TO THE EXCLUSIVE
JURISDICTION OF NORWEGIAN COURTS.


                                                                                                       2
Contents


•   Floating Production (FPSO/FSO)

•   Topside and Process Technology (KANFA)

•   Third Quarter Highlights


                                             3
Status ongoing projects (1)
                                   FPSO Sevan 1000 for the Goliat Field

 •   Sevan’s FPSO concept selected based on
     the harsh and sub-arctic Barents Sea
     environment.

 •   Technology license agreement signed in
     2009 – ENI has licensed the right to build,
     own and operate the Sevan 1000 FPSO.
     License fee fully paid in August 2012 and
     Investec facility settled in full.

 •   Sevan provides engineering services and
     project execution support to ENI. Manning
     level slightly increased during the quarter to
     strengthen the site team in Korea. Sevan
     support likely to remain high throughout
     2013.


                                                                          4
Status ongoing projects (2)

                            Voyageur upgrade project for the Huntington Field

 •   Sail-away of the FPSO Voyageur Spirit from
     the Nymo yard in Arendal commenced
     September 30. Hook-up of the 12 anchors
     on the Huntington field was completed
     October 11.

 •   The process of pulling risers is on-going
     under the management of the operator.

 •   First oil is expected to occur in Q1/2013
     following certain delays due to riser
     installation issues on the field and weather-
     related delays (both of which are unrelated
     to Sevan or the unit).

 •   Teekay has confirmed that they remain
     committed to assuming ownership as soon
     as practically possible, and in any event
     upon first oil being achieved.


                                                                                5
Status ongoing projects (3)

                               FPSO Sevan 400 for the Western Isles Field

 •   The Western Isles Project (Dana 65% and
     Cieco 35%) will develop two oil fields called
     Harris and Barra in the Northern North Sea,
     160km east of the Shetlands.

 •   The development is expected to produce
     more than 40,000 barrels of oil equivalent
     each day and the project is expected to
     receive full approval from the UK
     Government towards the end of 2012, with
     first oil production expected in 2015.

 •   Sevan Marine and Dana Petroleum have
     negotiated two agreements, one Technology
     License Agreement whereby Dana pays a
     license fee to Sevan for the right to use the
     proprietary Sevan Technology, and one
     Service Agreement under which Sevan will
     provide technical and administrative
     resources to Dana during the project. The
     agreements are expected to be signed
     shortly.


                                                                            6
Status ongoing projects (4)

                      Concept study for FPSO Sevan 1000 for Skrugard/Havis Field


 •   Location Norwegian Barents Sea

 •   License partners: Statoil (operator), ENI,
     Petoro

 •   Large similarities with Goliat field
     development. Sevan performed a feasibility
     study for Skrugard in 2011.

 •   Sevan has been awarded a concept study of
     approx 30,000 manhours to be performed in
     the period March 2012 to May 2013.

 •   Project “milestones”:
      • PDO             June 2014
      • First Oil       October 2018


                                                                            7
Hulls No. 4 and No. 5

                                              Hulls No. 4 and 5

 •   Hull No. 4 includes a partially completed
     accommodation block. Hull No. 5 is less
     advanced, but the structural steel work is
     essentially completed.

 •   An impairment assessment has been
     performed in relation to the carrying values
     of hulls # 4 and #5. Even though
     uncertainties exist in relation to the
     carrying values, no further impairment has
     been done during Q3/2012 as the
     company‘s best estimate still is the
     replacement cost value in total of USD 92
                                                                  FPSO/ FSO       Accommodation
     million.

 •   Should the hulls be used for another
     purpose than FPSO, the Company expects
     that the value of the hulls may be further
     impaired. The Company is continuously
     working on different other applications for
     the hulls.


                                                                              8
Market outlook

                                      Concept studies and FEED studies


 •   Sevan is currently involved with various
     tenders for FEED studies. These include
     redeployment of existing unit (Hummingbird),
     potential new lease applications (together with                                                                                                                   52
     Teekay), and projects directly with end clients.

                                                                                                                                                                  43
 •   The many discoveries within oil and gas
     worldwide, more projects moving into a
     production phase, as well as expected high
                                                                                                                                                                    32
     and increasing investment levels in the
     industry, call for a positive market outlook for                                                                                              27          27
     the Company.                                                                                                                                       2424
                                                                                                                                                      22
                                                                                                                                        21                   21
                                                                                                                                              20
                                                                                                                                                           19
 •   The number of prospects where a Sevan unit                                                                                                  17
                                                                                                                           14               14
     may be suitable is favorable in terms of                                                                            13 13
                                                                                                                                     1010
     securing an additional license agreement in                                                                     8           8
     2013.                                              4           4                       4       4       4
                                                                                                                55
                                                                        3                               3
                                                            2                   2       2
                                                                1           1       1           1


                                                                            FPSO                        FSO              Semi               SPAR        TLP


                                                                                                                           9
Contents


   Floating Production (FPSO/FSO)

   Topside and Process Technology (KANFA)

   Third Quarter Highlights


                                             10
KANFA targets EPC projects to leverage engineering resources and
execution competence

   •     Currently 65 (51) employees throughout the KANFA Group.
   •     The business model is to i) provide engineering services within the area of liquid- and gas processing
         as well as process optimization, and ii) to provide process equipment packages/modules on an EPC
         basis.


                                                  Business models


          Engineering projects (MNOK)                                           Topside EPC projects (MNOK)
                                                                       Added value
                                                                        Project execution
                                                                         responsibility
 Engineering services quoted by the hour                               Procurement     >4x              >240

 Limited potential for value-added, scope-
  expanding offering

                  ~2x                     120
                                                   Balanced approach

                   60                                                                        60


                                         EBITDA                                                          EBITDA

               Employees               Revenues                                        Employees        Revenues


                                                                                                   11
Market outlook

                                Engineering studies and Process packages

•   KANFA is currently involved with various         30
    tenders for engineering studies (including
    FEED studies) and process packages.
                                                     25                                                 Utility
•   In November a large produced water                                                                  systems
    treatment (PWT) package for Piranema was
    secured.
                                                     20
•   Market outlook for 2013 remains favorable in                                                        Water
    terms of securing additional process                                                                treatment
    packages.                                        15


                                                                                                        Gas injection
                                                     10


                                                      5
                                                                                                        Crude oil
                                                                                                        separation


                                                      0
                                                       2010   2011   2012   2013   2014   2015   2016


                                                                                     12
KANFA has an ambition to become a leading processing house

                                                                                                                           Leading
                                                                                                                          processing
                                                                                                                            house

                                                                                                           Diversified revenue mix (engineering,
                                                                                                            modules, topsides)
                                                                                                           Robust financial performance, profitable 
                                                                                                            throughout the cycle
                                                                                                           Broad geographic presence
 Enterprise value / revenue


                                                                             Build core
                                                                         processing platform

                                                                 Organic growth and small acquisitions
                                                                 Increase base load and business 
                                                                  robustness
                                              AS-IS              Gain critical mass of engineering
                                                                  resources
                               Highly skilled process house     Complement current
                                w/ EPC capabilities               competence
                               High growth potential


                                               Now                        Medium term                            Long term


                                                                                                                    13
Contents


•   Floating Production (FPSO/FSO)

•   Topside and Process Technology (KANFA)

•   Third Quarter Highlights


                                             14
Highlights

      Operations
        o Revenue and costs in line with management expectations
        o Net burn rate in Q3 was in the range MUSD 0.0 – 0.5 per month
        o Current net burn rate is still in the range MUSD 0.0 – 0.5 per month

      Restructuring
        o Teekay Bridge Loan for Voyageur only outstanding item
        o Teekay has confirmed that Voyageur will be taken over at first-oil

      Finance
        o Cash end Q3/12 increased by MUSD 0.8 from Q2/12; and by MUSD 3.1
          since Q4/11
        o Investec facility settled in full in August


Note: See press release and Q3 2012 interim report dated November 20, 2012 for a more detailed description of the
third quarter interim financial results.
                                                                                                                    15
Q3 2012 - Profit and Loss Statement


         USDm                                                    Q3 12      Q2 12       30.09.12      Q3 11      30.09.11        2011
         Operating income                                           20,9        23,7          69,0        22,0           74,8    100,0
         Operating expense                                         -13,9       -13,3         -39,8       -35,5           -76,8    -94,4
         EBITDAFX                                                     7,1       10,4          29,2       -13,5            -2,0      5,6
         Operational foreign exchange gain/(loss)                    -0,8        1,2           -0,7        3,2            0,6       0,3
         EDITDA                                                       6,3       11,6          28,5       -10,3            -1,4      5,9
         Depreciation, amortization and impairment                   -0,4       -0,2           -1,0       -2,6           -62,5    -79,1

         Operating profit/(loss)                                      5,9       11,4          27,5       -12,9           -63,8    -73,2

         Income from associated companies                             0,0        0,0            0,0        0,0            1,9       1,9
         Net financial income/(expense)                               0,7        0,9            1,8      -79,8       -292,7      -292,7
         Net financial forex gain/(loss)                              0,9       -1,3            1,3       -0,2            -0,1     -1,2
         Profit/(loss) before tax                                     7,5       11,0          30,6       -92,8       -354,9      -365,2

         Tax income/(expense)                                        -1,3        0,0           -1,3       -1,7           -39,0    -38,6

         Net profit/(loss) continued operations                       6,2       11,0          29,3       -94,5       -393,9      -403,8

         Net profit/(loss) discontinued operations                   -3,0       -3,5         -10,7     -201,2        -594,2      -337,4


Note: See press release and Q3 2012 interim report dated November 20, 2012 for a more detailed description of the
third quarter interim financial results.
                                                                                                                    16
Q3 2012 – Balance Sheet, Assets

      USDm                                                   30.09.12 30.06.12              30.09.11            31.12.11
       Sevan Capital Assets                                        92,0            92,0          110,0                    92,0
       Other fixed assets                                            0,7             0,9            1,2                    0,9
       Intangible assets                                           12,5            11,8            13,1                   11,5
       Investments in associates                                     0,0             0,0            0,0                    0,0
       Deferred tax assets                                           0,0             0,0            0,0                    0,0
       Other non-current assets                                      0,7             0,6            0,4                    0,3
      Total non-current assets                                   105,9           105,2           124,6                   104,8

       Financial assets available for sale                           0,0             0,0           63,5                    0,0
       Trade and other receivables                                 38,1            37,0            44,0                   44,4
       Cash and cash equivalents                                   55,2            54,4            11,2                   52,1
      Total current assets                                         93,3            91,3          118,7                    96,5
       Assets of disposal Group                                  493,7           447,5           718,9                   380,5
      Total assets                                               692,9           644,0           962,3                   581,8


Note: See press release and Q3 2012 interim report dated November 20, 2012 for a more detailed description of the
third quarter interim financial results.
                                                                                                                    17
Q3 2012 – Balance Sheet, Equity and Liabilities

USDm                                                             30.09.12 30.06.12                 30.09.11          31.12.11
 Share capital                                                         34,6             34,6            16,6              34,6
 Other equity                                                         108,1            103,7          -190,4              87,9
Total shareholders' equity                                            142,7            138,4          -173,8             122,5
 Minority Interest                                                      1,6              1,2             0,8               0,8
Total equity                                                          144,3            139,6          -173,0             123,3

 Interest-bearing debt                                                   0,0              0,0              0,0             0,0
 Retirement benefit obligations                                          1,7              1,7              1,9             1,9
 Other long-term liabilities/provisions                                  0,0              0,0              0,7             0,5
Total non-current liabilities                                            1,7              1,7              2,6             2,5

 Interest-bearing debt                                                   0,0             7,9             41,1             30,4
 Other current liabilities                                              39,9            39,6             58,1             47,5
Total current liabilities                                               39,9            47,5             99,3             77,9
Total liabilities                                                       41,6            49,2           101,9              80,4
 Liabilities of disposal Group                                        507,1            455,3         1 033,4             378,1
Total equity and liabilities                                          692,9            644,0           962,3             581,8


Note: See press release and Q3 2012 interim report dated November 20, 2012 for a more detailed description of the
third quarter interim financial results.
                                                                                                                    18
Q3 2012 – Financial Highlights


      Trade and other receivables of USD 38.1m (USD 37.0m)

  Short Term Receivables                                      Q3 2012           Q2 2012 Variance
  Trade receivables                                                    22,1            22,8             -0,7
  Provision for bad debt                                                 0,0            -0,5             0,5
  ONGC                                                                   8,0             8,0             0,0
  Accrued Income                                                         3,6             2,4             1,2
  Prepaids                                                               1,6             1,6             0,0
  VAT receivable                                                         0,2             0,4            -0,2
  Other short term receivable                                            2,5             2,2             0,3
  Total                                                                38,1            37,0              1,1


Note: See press release and Q3 2012 interim report dated November 20, 2012 for a more detailed description of the
third quarter interim financial results.
                                                                                                                    19
Q3 2012 – Financial Highlights


       Other current liabilities of USD 39.9m (USD 39.6m)

     Short Term Liabilities                                   Q3 2012         Q2 2012         Variance
     Trade creditors                                                    2,5             1,7             0,8
     Trade accruals                                                     2,2             2,6            -0,4
     Hulls 4 and 5                                                    10,4              8,6             1,8
     ONGC                                                               1,0             1,0             0,0
     Restructuring and indemnities TK                                   9,2             8,4             0,8
     Deferred revenue                                                   1,2             6,2            -5,0
     Holiday, vacation, severance                                       4,6             5,1            -0,5
     Tax and social contributions                                       3,1             2,5             0,6
     KANFA                                                              5,7             3,4             2,3
     Total                                                            39,9            39,6              0,3


Note: See press release and Q3 2012 interim report dated November 20, 2012 for a more detailed description of the
third quarter interim financial results.
                                                                                                                    20
Main Focus Going Forward
   Voyageur First-Oil

   Skrugard FEED Study

   DANA License and Service Contracts
      Expect signature Q4


   Tendering for new concept and FEED studies

   Full focus on hulls no. 4 and 5
      Looking at several alternatives


   Growth plan for KANFA
      Bought IPS, looking at more alternatives


   Continue to reduce monthly burn rate


                                                  21
Q&A


      22

Sevan Marine Q3 2012 results presentation

  • 1.
    Sevan Marine ASA Presentation of third quarter results 2012 Shippingklubben, Oslo, November 21, 2012 Presented by: Carl Lieungh, CEO Kjetil Vangsnes, CFO 1
  • 2.
    IMPORTANT INFORMATION THIS PRESENTATIONAND ITS ENCLOSURES AND APPENDICES (HEREINAFTER JOINTLY REFERRED TO AS THE “PRESENTATION”) HAVE BEEN PREPARED BY SEVAN MARINE ASA (”SEVAN” OR THE ”COMPANY”) EXCLUSIVELY FOR INFORMATION PURPOSES. THIS PRESENTATION HAS NOT BEEN REVIEWED OR REGISTERED WITH ANY PUBLIC AUTHORITY OR STOCK EXCHANGE. RECIPIENTS OF THIS PRESENTATION MAY NOT REPRODUCE, REDISTRIBUTE OR PASS ON, IN WHOLE OR IN PART, THE PRESENTATION TO ANY OTHER PERSON. THE CONTENTS OF THIS PRESENTATION ARE NOT TO BE CONSTRUED AS LEGAL, BUSINESS, INVESTMENT OR TAX ADVICE. EACH RECIPIENT SHOULD CONSULT WITH ITS OWN LEGAL, BUSINESS, INVESTMENT AND TAX ADVISER AS TO LEGAL, BUSINESS, INVESTMENT AND TAX ADVICE. THERE MAY HAVE BEEN CHANGES IN MATTERS WICH AFFECT THE COMPANY SUBSEQUENT TO THE DATE OF THIS PRESENTATION. NEITHER THE ISSUE NOR DELIVERY OF THIS PRESENTATION SHALL UNDER ANY CIRCUMSTANCE CREATE ANY IMPLICATION THAT THE INFORMATION CONTAINED HEREIN IS CORRECT AS OF ANY TIME SUBSEQUENT TO THE DATE HEREOF OR THAT THE AFFAIRS OF THE COMPANY HAVE NOT SINCE CHANGED, AND THE COMPANY DOES NOT INTEND, AND DOES NOT ASSUME ANY OBLIGATION, TO UPDATE OR CORRECT ANY INFORMATION INCLUDED IN THIS PRESENTATION. THIS PRESENTATION INCLUDES AND IS BASED ON, AMONG OTHER THINGS, FORWARD-LOOKING INFORMATION AND STATEMENTS. SUCH FORWARD-LOOKING INFORMATION AND STATEMENTS ARE BASED ON THE CURRENT EXPECTATIONS, ESTIMATES AND PROJECTIONS OF SEVAN OR ASSUMPTIONS BASED ON INFORMATION AVAILABLE TO THE COMPANY. SUCH FORWARD-LOOKING INFORMATION AND STATEMENTS REFLECT CURRENT VIEWS WITH RESPECT TO FUTURE EVENTS AND ARE SUBJECT TO RISKS, UNCERTAINTIES AND ASSUMPTIONS. SEVAN CANNOT GIVE ANY ASSURANCE AS TO THE CORRECTNESS OF SUCH INFORMATION AND STATEMENTS. AN INVESTMENT IN THE COMPANY SHOULD BE CONSIDERED AS AN HIGH-RISK INVESTMENT, AND SEVERAL FACTORS COULD CAUSE THE ACTUAL RESULTS, PERFORMANCE OR ACHIEVEMENTS OF THE COMPANY TO BE MATERIALLY DIFFERENT FROM ANY FUTURE RESULTS, PERFORMANCE OR ACHIEVEMENTS THAT MAY BE EXPRESSED OR IMPLIED BY STATEMENTS AND INFORMATION IN THIS PRESENTATION, INCLUDING, AMONG OTHERS, RISKS OR UNCERTAINTIES ASSOCIATED WITH THE RESTRUCTURING, THE COMPANY’S BUSINESS, SEGMENTS, DEVELOPMENT, MANAGEMENT, FINANCING, MARKET ACCEPTANCE AND RELATIONS WITH CUSTOMERS, ABILITY TO SECURE EMPLOYMENY FOR ITS TWO HULLS, ABILITY TO IMPLEMENT COST REDUCING INITIATIVES, THE COMPANY’S TECHNOLOGY AND OFFSHORE UNIT DESIGN, LATENT LIABILITIES ASSOCIATED WITH DIVESTED BUSINESSES, AND, MORE GENERALLY, GENERAL ECONOMIC AND BUSINESS CONDITIONS, INCLUDING, BUT NOT LIMITED TO, WITHIN THE OIL AND GAS INDUSTRY, CHANGES IN DOMESTIC AND FOREIGN LAWS AND REGULATIONS, TAXES, CUSTOMS DUTIES, VAT OR VARIATIONS THEREOF, CHANGES IN COMPETITION AND PRICING ENVIRONMENTS, FLUCTUATIONS IN CURRENCY EXCHANGE RATES AND INTEREST RATES AND OTHER FACTORS. MOREOVER, THE CONTEMPLATED RESTRUCTURING IS ASSOCIATED WITH UNCERTANTIES AND MAY BE CONSUMMATED IN A MANNER THAT DEVIATES FROM THE DISCUSSIONS CONTAINED IN THIS PRESENTATION, OR NOT AT ALL. READERS ARE CAUTIONED THAT, EVEN IF THE RESTRUCTURING IS CONSUMMATED, THE COMPANY MAY NOT ACHIEVE THE BENEFITS FROM THE RESTRUCTURING, OR SUCCESSFULLY BE ABLE TO IMPLEMENT ITS STRATEGIES, IMPLIED BY THIS PRESENTATION. SHOULD ONE OR MORE OF THESE RISKS OR UNCERTAINTIES MATERIALISE, OR SHOULD UNDERLYING ASSUMPTIONS PROVE INCORRECT, ACTUAL RESULTS MAY VARY MATERIALLY FROM THOSE DESCRIBED IN THIS DOCUMENT. THE COMPANY DOES NOT INTEND, AND DOES NOT ASSUME ANY OBLIGATION, TO UPDATE OR CORRECT THE INFORMATION INCLUDED IN THIS PRESENTATION. THIS PRESENTATION DOES NOT CONSTITUTE OR FORM A PART OF, AND SHOULD NOT BE CONSTRUED AS, AN OFFER OR INVITATION TO SUBSCRIBE FOR OR PURCHASE ANY SECURITIES OF THE COMPANY. NEITHER THIS PRESENTATION NOR ANYTHING CONTAINED HEREIN SHALL FORM THE BASIS OF, OR BE RELIED ON IN CONNECTION WITH, ANY POTENTIAL TRANSACTION REFERRED TO IN THIS PRESENTATION. ANY POTENTIAL OFFER OF SECURITIES OF THE COMPANY WOULD BE BASED ON A PROSPECTUS PREPARED FOR THAT PURPOSE. THIS PRESENTATION IS SUBJECT TO NORWEGIAN LAW, AND ANY DISPUTE ARISING IN RESPECT OF THIS PRESENTATION IS SUBJECT TO THE EXCLUSIVE JURISDICTION OF NORWEGIAN COURTS. 2
  • 3.
    Contents • Floating Production (FPSO/FSO) • Topside and Process Technology (KANFA) • Third Quarter Highlights 3
  • 4.
    Status ongoing projects(1) FPSO Sevan 1000 for the Goliat Field • Sevan’s FPSO concept selected based on the harsh and sub-arctic Barents Sea environment. • Technology license agreement signed in 2009 – ENI has licensed the right to build, own and operate the Sevan 1000 FPSO. License fee fully paid in August 2012 and Investec facility settled in full. • Sevan provides engineering services and project execution support to ENI. Manning level slightly increased during the quarter to strengthen the site team in Korea. Sevan support likely to remain high throughout 2013. 4
  • 5.
    Status ongoing projects(2) Voyageur upgrade project for the Huntington Field • Sail-away of the FPSO Voyageur Spirit from the Nymo yard in Arendal commenced September 30. Hook-up of the 12 anchors on the Huntington field was completed October 11. • The process of pulling risers is on-going under the management of the operator. • First oil is expected to occur in Q1/2013 following certain delays due to riser installation issues on the field and weather- related delays (both of which are unrelated to Sevan or the unit). • Teekay has confirmed that they remain committed to assuming ownership as soon as practically possible, and in any event upon first oil being achieved. 5
  • 6.
    Status ongoing projects(3) FPSO Sevan 400 for the Western Isles Field • The Western Isles Project (Dana 65% and Cieco 35%) will develop two oil fields called Harris and Barra in the Northern North Sea, 160km east of the Shetlands. • The development is expected to produce more than 40,000 barrels of oil equivalent each day and the project is expected to receive full approval from the UK Government towards the end of 2012, with first oil production expected in 2015. • Sevan Marine and Dana Petroleum have negotiated two agreements, one Technology License Agreement whereby Dana pays a license fee to Sevan for the right to use the proprietary Sevan Technology, and one Service Agreement under which Sevan will provide technical and administrative resources to Dana during the project. The agreements are expected to be signed shortly. 6
  • 7.
    Status ongoing projects(4) Concept study for FPSO Sevan 1000 for Skrugard/Havis Field • Location Norwegian Barents Sea • License partners: Statoil (operator), ENI, Petoro • Large similarities with Goliat field development. Sevan performed a feasibility study for Skrugard in 2011. • Sevan has been awarded a concept study of approx 30,000 manhours to be performed in the period March 2012 to May 2013. • Project “milestones”: • PDO June 2014 • First Oil October 2018 7
  • 8.
    Hulls No. 4and No. 5 Hulls No. 4 and 5 • Hull No. 4 includes a partially completed accommodation block. Hull No. 5 is less advanced, but the structural steel work is essentially completed. • An impairment assessment has been performed in relation to the carrying values of hulls # 4 and #5. Even though uncertainties exist in relation to the carrying values, no further impairment has been done during Q3/2012 as the company‘s best estimate still is the replacement cost value in total of USD 92 FPSO/ FSO Accommodation million. • Should the hulls be used for another purpose than FPSO, the Company expects that the value of the hulls may be further impaired. The Company is continuously working on different other applications for the hulls. 8
  • 9.
    Market outlook Concept studies and FEED studies • Sevan is currently involved with various tenders for FEED studies. These include redeployment of existing unit (Hummingbird), potential new lease applications (together with 52 Teekay), and projects directly with end clients. 43 • The many discoveries within oil and gas worldwide, more projects moving into a production phase, as well as expected high 32 and increasing investment levels in the industry, call for a positive market outlook for 27 27 the Company. 2424 22 21 21 20 19 • The number of prospects where a Sevan unit 17 14 14 may be suitable is favorable in terms of 13 13 1010 securing an additional license agreement in 8 8 2013. 4 4 4 4 4 55 3 3 2 2 2 1 1 1 1 FPSO FSO Semi SPAR TLP 9
  • 10.
    Contents  Floating Production (FPSO/FSO)  Topside and Process Technology (KANFA)  Third Quarter Highlights 10
  • 11.
    KANFA targets EPCprojects to leverage engineering resources and execution competence • Currently 65 (51) employees throughout the KANFA Group. • The business model is to i) provide engineering services within the area of liquid- and gas processing as well as process optimization, and ii) to provide process equipment packages/modules on an EPC basis. Business models Engineering projects (MNOK) Topside EPC projects (MNOK) Added value  Project execution responsibility  Engineering services quoted by the hour  Procurement >4x >240  Limited potential for value-added, scope- expanding offering ~2x 120 Balanced approach 60 60 EBITDA EBITDA Employees Revenues Employees Revenues 11
  • 12.
    Market outlook Engineering studies and Process packages • KANFA is currently involved with various 30 tenders for engineering studies (including FEED studies) and process packages. 25 Utility • In November a large produced water systems treatment (PWT) package for Piranema was secured. 20 • Market outlook for 2013 remains favorable in Water terms of securing additional process treatment packages. 15 Gas injection 10 5 Crude oil separation 0 2010 2011 2012 2013 2014 2015 2016 12
  • 13.
    KANFA has an ambition to become a leadingprocessing house Leading processing house  Diversified revenue mix (engineering, modules, topsides)  Robust financial performance, profitable  throughout the cycle  Broad geographic presence Enterprise value / revenue Build core processing platform  Organic growth and small acquisitions  Increase base load and business  robustness AS-IS  Gain critical mass of engineering resources  Highly skilled process house   Complement current w/ EPC capabilities competence  High growth potential Now Medium term Long term 13
  • 14.
    Contents • Floating Production (FPSO/FSO) • Topside and Process Technology (KANFA) • Third Quarter Highlights 14
  • 15.
    Highlights  Operations o Revenue and costs in line with management expectations o Net burn rate in Q3 was in the range MUSD 0.0 – 0.5 per month o Current net burn rate is still in the range MUSD 0.0 – 0.5 per month  Restructuring o Teekay Bridge Loan for Voyageur only outstanding item o Teekay has confirmed that Voyageur will be taken over at first-oil  Finance o Cash end Q3/12 increased by MUSD 0.8 from Q2/12; and by MUSD 3.1 since Q4/11 o Investec facility settled in full in August Note: See press release and Q3 2012 interim report dated November 20, 2012 for a more detailed description of the third quarter interim financial results. 15
  • 16.
    Q3 2012 -Profit and Loss Statement USDm Q3 12 Q2 12 30.09.12 Q3 11 30.09.11 2011 Operating income 20,9 23,7 69,0 22,0 74,8 100,0 Operating expense -13,9 -13,3 -39,8 -35,5 -76,8 -94,4 EBITDAFX 7,1 10,4 29,2 -13,5 -2,0 5,6 Operational foreign exchange gain/(loss) -0,8 1,2 -0,7 3,2 0,6 0,3 EDITDA 6,3 11,6 28,5 -10,3 -1,4 5,9 Depreciation, amortization and impairment -0,4 -0,2 -1,0 -2,6 -62,5 -79,1 Operating profit/(loss) 5,9 11,4 27,5 -12,9 -63,8 -73,2 Income from associated companies 0,0 0,0 0,0 0,0 1,9 1,9 Net financial income/(expense) 0,7 0,9 1,8 -79,8 -292,7 -292,7 Net financial forex gain/(loss) 0,9 -1,3 1,3 -0,2 -0,1 -1,2 Profit/(loss) before tax 7,5 11,0 30,6 -92,8 -354,9 -365,2 Tax income/(expense) -1,3 0,0 -1,3 -1,7 -39,0 -38,6 Net profit/(loss) continued operations 6,2 11,0 29,3 -94,5 -393,9 -403,8 Net profit/(loss) discontinued operations -3,0 -3,5 -10,7 -201,2 -594,2 -337,4 Note: See press release and Q3 2012 interim report dated November 20, 2012 for a more detailed description of the third quarter interim financial results. 16
  • 17.
    Q3 2012 –Balance Sheet, Assets USDm 30.09.12 30.06.12 30.09.11 31.12.11 Sevan Capital Assets 92,0 92,0 110,0 92,0 Other fixed assets 0,7 0,9 1,2 0,9 Intangible assets 12,5 11,8 13,1 11,5 Investments in associates 0,0 0,0 0,0 0,0 Deferred tax assets 0,0 0,0 0,0 0,0 Other non-current assets 0,7 0,6 0,4 0,3 Total non-current assets 105,9 105,2 124,6 104,8 Financial assets available for sale 0,0 0,0 63,5 0,0 Trade and other receivables 38,1 37,0 44,0 44,4 Cash and cash equivalents 55,2 54,4 11,2 52,1 Total current assets 93,3 91,3 118,7 96,5 Assets of disposal Group 493,7 447,5 718,9 380,5 Total assets 692,9 644,0 962,3 581,8 Note: See press release and Q3 2012 interim report dated November 20, 2012 for a more detailed description of the third quarter interim financial results. 17
  • 18.
    Q3 2012 –Balance Sheet, Equity and Liabilities USDm 30.09.12 30.06.12 30.09.11 31.12.11 Share capital 34,6 34,6 16,6 34,6 Other equity 108,1 103,7 -190,4 87,9 Total shareholders' equity 142,7 138,4 -173,8 122,5 Minority Interest 1,6 1,2 0,8 0,8 Total equity 144,3 139,6 -173,0 123,3 Interest-bearing debt 0,0 0,0 0,0 0,0 Retirement benefit obligations 1,7 1,7 1,9 1,9 Other long-term liabilities/provisions 0,0 0,0 0,7 0,5 Total non-current liabilities 1,7 1,7 2,6 2,5 Interest-bearing debt 0,0 7,9 41,1 30,4 Other current liabilities 39,9 39,6 58,1 47,5 Total current liabilities 39,9 47,5 99,3 77,9 Total liabilities 41,6 49,2 101,9 80,4 Liabilities of disposal Group 507,1 455,3 1 033,4 378,1 Total equity and liabilities 692,9 644,0 962,3 581,8 Note: See press release and Q3 2012 interim report dated November 20, 2012 for a more detailed description of the third quarter interim financial results. 18
  • 19.
    Q3 2012 –Financial Highlights  Trade and other receivables of USD 38.1m (USD 37.0m) Short Term Receivables Q3 2012 Q2 2012 Variance Trade receivables 22,1 22,8 -0,7 Provision for bad debt 0,0 -0,5 0,5 ONGC 8,0 8,0 0,0 Accrued Income 3,6 2,4 1,2 Prepaids 1,6 1,6 0,0 VAT receivable 0,2 0,4 -0,2 Other short term receivable 2,5 2,2 0,3 Total 38,1 37,0 1,1 Note: See press release and Q3 2012 interim report dated November 20, 2012 for a more detailed description of the third quarter interim financial results. 19
  • 20.
    Q3 2012 –Financial Highlights  Other current liabilities of USD 39.9m (USD 39.6m) Short Term Liabilities Q3 2012 Q2 2012 Variance Trade creditors 2,5 1,7 0,8 Trade accruals 2,2 2,6 -0,4 Hulls 4 and 5 10,4 8,6 1,8 ONGC 1,0 1,0 0,0 Restructuring and indemnities TK 9,2 8,4 0,8 Deferred revenue 1,2 6,2 -5,0 Holiday, vacation, severance 4,6 5,1 -0,5 Tax and social contributions 3,1 2,5 0,6 KANFA 5,7 3,4 2,3 Total 39,9 39,6 0,3 Note: See press release and Q3 2012 interim report dated November 20, 2012 for a more detailed description of the third quarter interim financial results. 20
  • 21.
    Main Focus GoingForward  Voyageur First-Oil  Skrugard FEED Study  DANA License and Service Contracts  Expect signature Q4  Tendering for new concept and FEED studies  Full focus on hulls no. 4 and 5  Looking at several alternatives  Growth plan for KANFA  Bought IPS, looking at more alternatives  Continue to reduce monthly burn rate 21
  • 22.
    Q&A 22