Set c
•Download as DOCX, PDF•
1 like•4,233 views

This document contains 18 questions related to statistics concepts such as mean, standard deviation, probability, normal distribution, and hypothesis testing. The questions cover computing GPA from credit hours and grades, determining if transportation methods are mutually exclusive or independent, calculating probabilities related to investments, loans, and job applications, and analyzing data related to costs, surveys, and traffic fatalities.

Recommended
More Related Content
Similar to Set c
Similar to Set c (20)
Recently uploaded
Recently uploaded (20)
Set c
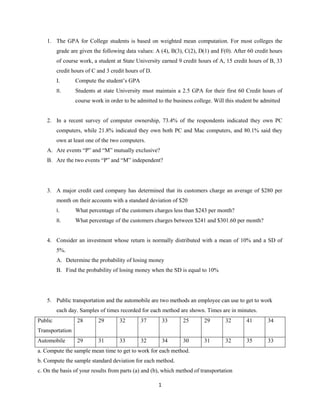
- 1. 1 1. The GPA for College students is based on weighted mean computation. For most colleges the grade are given the following data values: A (4), B(3), C(2), D(1) and F(0). After 60 credit hours of course work, a student at State University earned 9 credit hours of A, 15 credit hours of B, 33 credit hours of C and 3 credit hours of D. I. Compute the student’s GPA II. Students at state University must maintain a 2.5 GPA for their first 60 Credit hours of course work in order to be admitted to the business college. Will this student be admitted 2. In a recent survey of computer ownership, 73.4% of the respondents indicated they own PC computers, while 21.8% indicated they own both PC and Mac computers, and 80.1% said they own at least one of the two computers. A. Are events “P” and “M” mutually exclusive? B. Are the two events “P” and “M” independent? 3. A major credit card company has determined that its customers charge an average of $280 per month on their accounts with a standard deviation of $20 I. What percentage of the customers charges less than $243 per month? II. What percentage of the customers charges between $241 and $301.60 per month? 4. Consider an investment whose return is normally distributed with a mean of 10% and a SD of 5%. A. Determine the probability of losing money B. Find the probability of losing money when the SD is equal to 10% 5. Public transportation and the automobile are two methods an employee can use to get to work each day. Samples of times recorded for each method are shown. Times are in minutes. Public Transportation 28 29 32 37 33 25 29 32 41 34 Automobile 29 31 33 32 34 30 31 32 35 33 a. Compute the sample mean time to get to work for each method. b. Compute the sample standard deviation for each method. c. On the basis of your results from parts (a) and (b), which method of transportation
- 2. 2 Should be preferred? Explain. d. Develop a box plot for each method. Does a comparison of the box plots support your Conclusion in part (c) 6. In the IT Industry the average age of professional employees tends to be younger than in many other business professions. Suppose the average age of the professional employed by a particular IT firm is 28 with a SD of 6 years. A histogram of professional employee ages with this firm reveals that the data are not normally distributed but amassed in the 20’s and that few workers are over 40. Find out within what range of ages would atleast 80% of workers age fall 7. Franklin Joiner, director of health, education and welfare, had just left a meeting with the state’s newly elected governor and several of the other recently appointed department heads. One of the governor’s campaign promises was to try to halt the rising cost of a certain state entitlement program. In several speeches, the governor indicated the state of Idaho should allocate funds only to those individuals ranked in the bottom 10% of the state’s income distribution. Now the governor wants to know how much one could earn before being disqualified from the program and he also wants to know the range of incomes for the middle 95% of the state’s income distribution. Frank had mentioned in the meeting that he thought incomes in the state could be approximated by a normal distribution and that mean per capita income was about $33,000 with a standard deviation of nearly $9,000. The Governor was expecting a memo in his office by 3:00 P.M. that afternoon with answers to his questions. 8. American Oil Company Chad Williams, field geologist for the American Oil Company, settled into his first-class seat on the Sun-Air flight between Los Angeles and Oakland, California. Earlier that afternoon, he had attended a meeting with the design engineering group at the Los Angeles New Product Division. He was now on his way to the home office in Oakland. He was looking forward to the one-hour flight because it would give him a chance to reflect on a problem that surfaced during the meeting. It would also give him a chance to think about the exciting opportunities that lay ahead in Australia. Chad works with a small group of highly trained people at American Oil who literally walks the earth looking for new sources of oil. They make use of the latest in electronic equipment to take a
- 3. 3 wide range of measurements from many thousands of feet below the earth’s surface. It is one of these electronic machines that is the source of Chad’s current problem. Engineers in Los Angeles have designed a sophisticated enhancement that will greatly improve the equipment’s ability to detect oil. The enhancement requires 800 capacitors, which must operate within _0.50 microns from the specified standard of 12 microns. The problem is that the supplier can provide capacitors that operate according to a normal distribution, with a mean of 12 microns and a standard deviation of 1 micron. Thus, Chad knows that not all capacitors will meet the specifications required by the new piece of exploration equipment. This will mean that in order to have at least 800 usable capacitors, American Oil will have to order more than 800 from the supplier. However, these items are very expensive, so he wants to order as few as possible to meet their needs. At the meeting the group agreed that they wanted a 98% chance that any order of capacitors would contain the sufficient number of usable items. If the project is to remain on schedule, Chad must place the order by tomorrow. He wants the new equipment ready to go by the time he leaves for an exploration trip in Australia. As he reclined in his seat, sipping cool lemonade, he wondered whether a basic statistical technique could be used to help determine how many capacitors to order. 9. Franklin Joiner, director of health, education and welfare, had just left a meeting with the state’s newly elected governor and several of the other recently appointed department heads. One of the governor’s campaign promises was to try to halt the rising cost of a certain state entitlement program. In several speeches, the governor indicated the state of Idaho should allocate funds only to those individuals ranked in the bottom 10% of the state’s income distribution. Now the governor wants to know how much one could earn before being disqualified from the program and he also wants to know the range of incomes for the middle 95% of the state’s income distribution. Frank had mentioned in the meeting that he thought incomes in the state could be approximated by a normal distribution and that mean per capita income was about $33,000 with a standard deviation of nearly $9,000. The Governor was expecting a memo in his office by 3:00 P.M. that afternoon with answers to his questions 10. A certain production process produces items 10% of which defective. Each item is inspected before supplying to customers but 10 percent of the time the inspector incorrectly classifies an item. Only items classified as good are supplied. If 820 items have been supplied in all, how many of them are expected to be defective.
- 4. 4 11. From a Salesforce of 150 persons, one will be selected to attend a special sales meeting. If 52 of them are unmarried, 72 are college graduates, and ¾ of the 52 that are unmarried are college graduates, find the probability that a salesperson selected at random will be neither single nor a college graduate 12. From a computer tally based on employer records, the personal manager of the large manufacturing firm finds that 15% of the firm’s employees are supervisors and 25% of the firm employees are college graduates. He also discovers that 5% are both supervisors and college graduates. Suppose an employee is selected at random from the firm’s personal records. What is the probability of: Selecting a person who is neither a supervisor nor a college graduate 13. An MBA applies for a job in 2 firms X and Y. The Probab. of his being selected in the firm X is .7 and being rejected at Y is .5. The Probab. Of atleast one of his applications being rejected is .6. What is the Probab. that he will be selected by one of the firms. 14. Two computers A and B are to be marketed. A salesman who is assigned the job of finding customers for them has 60% and 40% chances of succeeding for computers A and B respectively. The 2 computers can be sold independently. Given that he was able to sell atleast one computer, what is the probability that computer A has been sold 15. Each salesperson is rated either below average, average or above average w.r.t sales ability. Each of them is also rated w.r.t his or her potential for advancement. – Fair, good or excellent. These traits of the 500 salespersons are given below Potential for Advancement Sales Ability Fair Good Excellent Below average 16 12 22 Average 45 60 45 Below average 93 72 135 A. What is the Probab. That a randomly selected salesperson will have above average sales ability and excellent potential for advancement B. Construct the tree diagram showing all the probabilities – conditional probabilities and Joint probabilities
- 5. 5 16. Mr. Gupta applies for a personal loan of Rs. 1, 50,000 from a nationalized bank to repair his home. The loan officer informed him that over the years, bank has received about 2920 loan applications per year and that the Probab. of approval was on an average .85 A. Mr. Gupta wants to know the average and SD of the number of loans approved per year. B. Suppose bank actually recd. 2654 loan applications per year with an approval Probab. of .82. what are the mean and SD now 17. ABC International publishes business travel costs for various cities throughout the world. In part. They publish average costs for the typical business traveler including 3 meals a day in business class restaurants and a single rate lodging in business class hotels and motels. If 86.65% of the costs in Buenos Aires, Argentina are less than $449 and if the SD of the costs is $36, what is the average per diem cost in Buenos Aires Assume that per diem costs are normally distributed 18. Is lack of sleep causing traffic fatalities? A study conducted under the auspices of the National Highway Traffic Safety Administration found that the average number of fatal crashes caused by drowsy drivers each year was 1550 (BusinessWeek, January 26, 2004). Assume the annual number of fatal crashes per year is normally distributed with a standard deviation of 300. A. What is the probability of fewer than 1000 fatal crashes in a year? B. What is the probability the number of fatal crashes will be between 1000 and 2000 for a year? C. For a year to be in the upper 5% with respect to the number of fatal crashes, how many Fatal crashes would have to occur?