Download to read offline

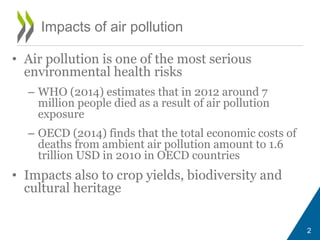
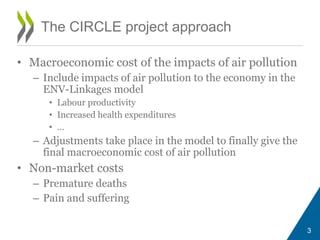
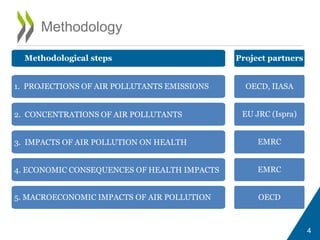
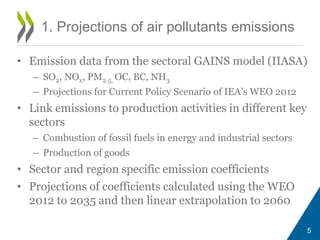

This document outlines the methodology for a project analyzing the macroeconomic costs of air pollution. The project will use emission projections to model pollutant concentrations. Health impacts from increased mortality and morbidity will then be calculated and valued in economic terms. Finally, a macroeconomic model will assess the overall costs of air pollution impacts on healthcare costs, labor productivity, and premature death. Policy scenarios will explore benefits of reducing air pollution through emissions standards and technology adoption.