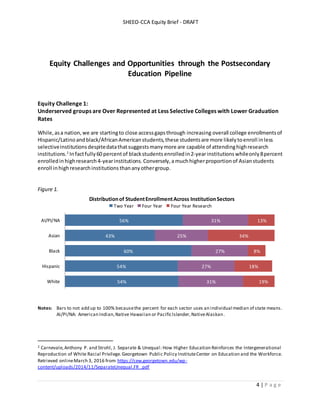
SlideShare a Scribd company logo
Serving the Equity Imperative: Intentional Action Toward Greater Student Success 2016
Serving the Equity Imperative:
Intentional Action Toward Greater Student Success
Katie Zaback, Andrew Carlson, Sophia Laderman and Sharmila Mann
State Higher Education Executive Officers and Complete College America
July 13, 2016
SHEEO-CCA Equity Brief - DRAFT
2 | P a g e
Introduction
If statesare to achieve theirpostsecondaryeducationattainmentgoals,itisbecomingincreasinglyclear
that theymusttake directand immediate actiontoaddressthe equitygapsinpostsecondaryeducation
betweenunderservedpopulationsandthe more likelytosucceedwhite andAsianstudents.Notonlyis
earninga postsecondarycredential essential forindividualeconomicvitality,butitisnecessarytothe
economicvitalityof ourstatesandour nation.AsSteve Murdock, demographerand formerdirectorof
the U.S. CensusBureau,hassaid,the economicprosperityof the entire nationhingesonreducingthese
gaps,since reducingthemisthe single greatestwayforusto drive economicgrowth1
.
Unfortunately,thesestudentsare disproportionatelyimpactedbycomponentsof the educationsystem
that consistentlyfail all students. Underserved studentsare overrepresentedinaremedial education
systemfromwhich fewstudentseveremerge.Theyare more likelytoattendunder-resourced
institutionswithfewerstructuresknowntosupportstudentsuccessand, asa result,accumulate fewer
creditsintheirfirstyear.All these factorscontribute tothe gapin completionrates.
The data presentedinthispolicybrief supportthe notionthattime is,infact,the enemy andthat for
manyunderservedstudentsahighereducationcredentialunnecessarilytakestoolongtocomplete and
costs toomuch, ultimatelydrivingdowncompletionratesforthese students.Thesedatashow thatfew
gaps existacrossrace/ethnicityforstudentswhosuccessfullycompletethe educationpipeline.Infact,
studentswhograduate take aboutthe same amountof time andthe same numberof creditsto geta
degree regardlessof theirrace or ethnicstatus.We must addresseachstage of the educationpipeline
to make real progressinaddressingthe equitygap.
1 Murdock, Ph.D., Steve, Professor of Sociology,RiceUniversity. Population Changein the United States:
Implicationsfor Education and Socioeconomic Development. Presentation at SHEEO Higher Education Policy
Conference. August 5, 2015
SHEEO-CCA Equity Brief - DRAFT
3 | P a g e
Background
Establishedin2009, Complete College Americaisanational nonprofit agency withasingle mission:to
workwithstatesto significantlyincreasethe numberof Americanswithqualitycareercertificatesor
college degreesandtoclose attainmentgapsfortraditionallyunderrepresentedpopulations.
As the national associationof statewidegoverning,policy,andcoordinatingboardsforpostsecondary
education,the State HigherEducationExecutive Officers Association(SHEEO) isfocusedonincreasing
postsecondaryeducationattainment.SHEEO’svisionstatementfocusesonstudentsuccessandsetsan
ambitiousgoal of at least60 percentof adultsfromeverysocioeconomicanddemographiccategory
completingapostsecondarydegreeorcredential of quality.
Both organizationsworkdirectlywiththeirstate membersand,since 2011, have collaboratedtocollect
the CCA commoncompletionmetrics.These dataprovide studentsuccesspointsthroughoutthe
postsecondaryeducationpipeline.Unlike the federalIntegratedPostsecondaryEducationDataSystem
(IPEDS),the CCA datasetincludes informationonremedialeducationandgatewaymathandEnglish
courses;student,first-yearcreditaccumulation;andthe time andcreditstodegree.Further,CCA data
can be disaggregatedbyrace/ethnicityinadditiontofull-time,part-time andtransferstatus.These data
provide apowerful tool forstatesinunderstandingtheirequitygapsandtheyprovide aunique
opportunitytolookat these trendsfromanational perspective.
SHEEO-CCA Equity Brief - DRAFT
4 | P a g e
Equity Challenges and Opportunities through the Postsecondary
Education Pipeline
Equity Challenge 1:
Underserved groups are Over Represented at Less Selective Colleges with Lower Graduation
Rates
While,asa nation,we are startingto close accessgapsthrough increasing overall college enrollmentsof
Hispanic/Latinoandblack/AfricanAmerican students,these studentsare more likelytoenroll inless
selectiveinstitutionsdespitedatathatsuggestsmanymore are capable of attendinghighresearch
institutions.2
Infactfully60 percentof blackstudents enrolledin2-yearinstitutions whileonly8percent
enrolledinhighresearch4-yearinstitutions.Conversely,amuchhigherproportionof Asianstudents
enroll inhighresearchinstitutions thananyothergroup.
Figure 1.
Notes: Bars to not add up to 100% becausethe percent for each sector uses an individual median of state means.
AI/PI/NA: American Indian,Native Hawaiian or PacificIslander,NativeAlaskan.
2 Carnevale,Anthony P. and Strohl, J. Separate & Unequal: How Higher Education Reinforces the Intergenerational
Reproduction of White Racial Privilege.Georgetown Public Policy InstituteCenter on Education and the Workforce.
Retrieved onlineMarch 3, 2016 from https://cew.georgetown.edu/wp-
content/uploads/2014/11/SeparateUnequal.FR_.pdf
56%
43%
60%
54%
54%
31%
25%
27%
27%
31%
13%
34%
8%
18%
19%
AI/PI/NA
Asian
Black
Hispanic
White
Distributionof StudentEnrollmentAcross InstitutionSectors
Two Year Four Year Four Year Research
SHEEO-CCA Equity Brief - DRAFT
5 | P a g e
Figure 2.
Note:
AI: American Indian,Native Hawaiian or Pacific Islander,NativeAlaskan
A: Asian
B: Black or African American
H: Hispanic or Latino
W: White
At all institution types, Black,HispanicandAmericanIndian,Native HawaiianorPacificIslander,Native
Alaskanstudentshave lowergraduationrates andthese differencesare especiallypronouncedatthe
typesof institutions whichminoritystudentsare more likelytoattend—community collegesandnon-
researchfour-yearinstitutions. Asnotedabove blackstudents are farmore likelyto enroll ina
communitycollege andof those whoentered full timeseekingadegree onlysevenpercentgraduated
withan associate degree within three years.Another13 to 16 percentgo on totransferto a four-year
institutionbefore receivingtheirdegree butonlyaportionof those studentsgoonto complete a
degree.
Figure 3.
Note: Bars to not add up to 100%because the percent for each sector uses an individual median of state means.
AI/PI/NA: American Indian,Native Hawaiian or PacificIslander,NativeAlaskan.
9%
38%
61%
16%
50%
72%
7%
31%
57%
12%
41%
63%
15%
50%
72%
0%
50%
100%
Associates Bachelors Bachelors Research
Graduation Rate in 150% Time (Full Time Students)
12%
5%
7%
6%
4%
39%
23%
36%
39%
32%
55%
73%
59%
57%
63%
AI/PI/NA
Asian
Black
Hispanic
White
Distributionof StudentCompletionsby Degree Type
Certificate Associates Bachelors
AI A B H WAI A B H WAI A B H W
SHEEO-CCA Equity Brief - DRAFT
6 | P a g e
Thisdisproportionate enrollment of minoritystudentsinlessselective institutions describedabove,and
lack of successat those institutions alsocontributestodisproportionate attainment.The datashowa
much smallerproportionof black,Hispanic,andAmericanIndian,Native HawaiianorPacificIslander,
Native Alaskan studentsreceive bachelor’sdegreesincomparisonwithAsianandwhite students.While
the completionof anypostsecondarycredential providesaboostinearningpotential overhighschool
graduationalone,national averagesshow that bachelor’sdegrees,onaverage,conferhigherlifetime
earningsthanassociate degreesjustasassociate degreesconferahigherboostthan certificates.
If statesare to improve the postsecondaryattainmentratesforunderservedpopulationsitiscritical for
themto focus theireffortsonequippingthe openaccessinstitutionsthese studentsattendwith
promisingprogramreformstobetterserve all students.Todate,manyeffortshave focusedon
improvingstudentchoice andmatching,butthisignoresthe factthatlocationandcost are the primary
driversof student’scollege decisions andthatselectiveinstitutionswill neverhave asufficientnumber
of seatsto serve all students. Giventhe growingdiversityinthe U.S. population,the equityimperative is
clear:We mustclose the gaps inenrollment,completion,andattainment all studentgroups if we wish
to have the workforce,wealth,andcivicparticipationwe needfromourcountryinthe 21st
century.
Thankfully,thereare policiesandpracticesemergingthatshow greatpromise forincreasingattainment
ratesfor all students andimprovingoutcomesforunderservedminoritypopulations.Complete College
Americacallsthese strategiesthatGame Changersbecause institutionsandstatesimplementingthese
reformsare seeing promisinginitial improvementsinstudentsuccess.
The Game Changer:
Creatingincentivesfor studentsuccessthrough outcomes-basedfunding
The firststep to ensuringthatall studentshave the opportunitytosucceedisensuringthatstudent
successisthe primarygoal of postsecondaryinstitutions.Formany years,statesfundedinstitutions
basedon the numberof studentstheyenrolledbut32 stateshave now shiftedtofundinginstitutions,at
leastpartially,oncompletionoutcomesratherthanmerelyenrollmentinputs3
.A well-designed
outcomes-basedfundingpolicytiedtoa state’sstrategicplancanhelpcreate the internal conditions
necessaryfora state to focuson completionandincreasingattainment.Outcomes-basedfunding
programs encourage participatinginstitutionstofocusoncompletionandthe stepsnecessarytoget
studentsthere.
Thoughoutcomes-basedfundingalone cannotincrease completion,thisinterventionprovidesa
financial incentiveforinstitutionstoimproveoutcomes. A growingbodyof researchshowsthese
modelsoftenleadtoinstitution-levelimprovementsinaligningwithstate goalstoimprove educational
outcomes4
.Stateswhodistributeall ora significantportionof theirstate appropriationsbasedon
outcomesratherthan enrollment,suchas TennesseeandOhio, are alsohighly involvedin institution-
level reformsthatfocusoninterventions thatshow promise in improvingcompletionandclosing
3 National Conference of State Legislatures onlinePerformanceBased Fundingdashboard.Retrieved February 26,
2016 at: http://www.ncsl.org/research/education/performance-funding.aspx
4 Hearn, James C. (2015). Outcomes-Based Fundingin Historical and ComparativeContext. The Lumina Foundation.
Retrieved May 25, 2016 at: https://www.luminafoundation.org/files/resources/hearn-obf-full.pdf
SHEEO-CCA Equity Brief - DRAFT
7 | P a g e
achievementgaps.Additionally,bothstates includeweightingforbetterservingunderserved
populations,includingstudentswhoare older,low income, minority(inOhioonly) andotherwise at-risk.
A well-designedfundingformulathatprovidesincentive fundingforcredentialsearnedby blackand
Hispanicstudents mayhelpclose equitygapsinpostsecondaryeducation.
The U.S. will notachieve itsattainmentgoalsif we merelyavoidincreasingthe equitygapsthatexist
betweenstudentsubgroups—we mustclose those gaps.Asstatescontinue toexperimentwith
outcomes-basedfunding,we will learnhow touse thislever more effectively tobothclose equitygaps
and increase attainmentforall students.Bytrackingthe resultsof various outcomes-basedfunding
initiativesinthe states withclose attentionpaidto the equityimperative,we have the opportunityto
shape outcomes-basedfundingintoatrue game changerfor highereducationattainmentANDequity.
Equity Challenge 2:
Far too many students of color are lost in the traditional remediation system
Most studentswhoenternon-selectivefour-yearinstitutionsandcommunitycolleges musttake
placementtestsinmathandEnglishpriorto registeringforclasses.Thesetestsdetermine if astudent
will startincollege level workorbe placedintoremedial ordevelopmental education.Traditionally,
studentswhotestbelowcollege levelhave tocomplete aseries of courses,overmultiple semesters that
do notcount towarda degree before theycanevenenroll incollege level credit-bearingcourses.For
manystudents,these remedial classesare theirfirstandlastexperience incollege.Eventhose who
successfullycomplete the remedial sequence fartoooftenfail toevenenroll inthe associatedgateway
course5
.It isessential forstudentstocompletethese gatewaycourses earlyintheircareersince they
are oftenprerequisiterequirementsforothercoursesrequiredforadegree.What’smore,datasuggest
that manyof the studentsplacedinremediationcouldhave successfullycompletedcollege level
courseworkif they hadstartedthere,andmany more couldcomplete if providedwithadditional
supplemental support6
.
While remedialplacementburdensstudentsof all races,the effectsare particularlydire forstudents
fromhistoricallyunderservedpopulations. Attwo-yearinstitutions,more than70 percent of black
studentsand 60 percentof Hispanicstudentsenroll inatleast one remedialcourse compared tojust
over50 percentof white andAsianstudents.Atfour-yearinstitutions,the gapsare evenmore
pronounced.Infact, blackstudentsare more than twice as likelytoenroll in remediation.Additionally,
bothblack andHispanicstudentsare more likelytoneedremediationin bothmathandEnglish.
5 Bailey,Thomas R., Jeong, Dong W. and Cho, Sung-Woo (2009). Referral, Enrollment and Completion in
Developmental Education Sequences in Community Colleges. Economics of Education Review. Volume 29, Issue2.
6 Scott-Clayton, Judith. (2012). Do High-Stakes Placement Exams Predictcollege Success? CCRC WorkingPaper No.
41. Retrieved May 25, 2016 at: http://ccrc.tc.columbia.edu/media/k2/attachments/high-stakes-predict-success.pdf
SHEEO-CCA Equity Brief - DRAFT
8 | P a g e
Figure 4.
Note: Four Year Research institutions arenotincluded sincethese institutions offer very littleremediation.
Successinthe firstcollege levelgatewaycourse forthose studentswhocompletethe remedial
sequence alsovariesdramaticallybyrace.Inparticular,farfewerblackstudentsgoonto complete the
gatewaycourse (orcoursesassociatedwiththeirremedial needs) withintwoyears,whileAsianstudents
are highlylikelytocompletethe gatewaycourse.The gapsare lesspronouncedforwhite andHispanic
students.Acrossbothrace and subject,fartoo few studentsof nearlyanybackgroundcomplete their
associatedgatewaycourseswithintwoyearsof entry,whichsignificantlyimpactstheirabilityto
complete adegree ontime.
Figure 5.
Note: N/A = Sample sizeis too small.
Math 17%
20%
25%
27%
11%
24%
20%
15%
English 13%
12%
9%
7%
8%
8%
7%
4%
Both 22%
39%
30%
20%
6%
19%
12%
5%
0% 25% 50% 75% 100%
Asian
Black
Hispanic
White
Asian
Black
Hispanic
White
Perventof First Time StudentsWho Enroll in Remedial Courses
FourYearTwoYear
38%
52%
26%
50%
N/A N/A
14%
22%
7%
25%
39%
17%
23%
35%
18%
31%
51%
25%27%
34%
16%
37%
57%
28%
0%
50%
100%
Math English Math & English Math English Math & English
Percentof Remedial StudentsWhoComplete an AssociatedGateway Course in Two
Years
Two Year Four Year
A B H W A B H WA B H W A B H W B H W B H W
SHEEO-CCA Equity Brief - DRAFT
9 | P a g e
While these datagive usan overall sense of inequityacrossstudentsubgroups, Figure6highlightsthe
overall impactof these trends more clearly.Forevery100 studentsenrollingin college, approximately
the same numberof studentswill be successfulinremediation ineachrace/ethnicitycategory.
However,since somanymore blackstudentsenroll inremedial educationandsofew completethe
associated gateway;twice asmanyblackstudentsfail tocomplete gateway courses aswhite students.
Althoughthe successratesfor white andHispanicstudentsare somewhatsimilar, manymore Hispanic
students are lostinthe pipeline because so manymore enroll inremedial courses.Asianstudents are
not onlylesslikelytoenroll inremedialcourses, theyare more likelytosucceedinremedial courses,
meaningthat,unlike foranyothergroup,almostas many Asianstudentswill succeedaswill dropoutof
the pipeline.
Figure 6.
Note: Total length of bars (green + red) represents the number of students who startin remediation
These data confirmwhatthe empirical research hasbeenshowingforsome time:the traditional
approach to remedial education isnotservingstudents well.These dataalsounderscore the importance
of disaggregatingoutcomes byrace and ethnicity.Implicationsformaintainingthe currentsystemare
greaterfor blackand Hispanicstudents whoare more likelytoenrollinremedial educationandless
likelytosucceed inthe current,statusquo,system.
The Game Changer:
Corequisite remediation
Addressingthisissuemeansabandoningthe systemthatdoesnotworkforsomethingthat continuesto
show far betterresults—corequisiteremediation. Withthisapproach,studentsare enrolleddirectlyinto
a college level course withadditionalcorequisite supportsystems. Remedial supportsare providedas
withcollege courseworkasa corequisite ratherthanbefore collegecourseworkasa prerequisite.
Colorado,Indiana,Georgia,Tennessee,andWestVirginiaare seeingdramaticincreasesingateway
completionrateswithin one semester(nottwoyears) forstudentsenrolledincorequisite models.
-16
-52
-35
-26
10
9
11
9
Asian
Black
Hispanic
White
First Year Pipeline for100 EnteringStudentsof Each Race
Fail to Complete Gateway Course Complete Gateway Course
SHEEO-CCA Equity Brief - DRAFT
10 | P a g e
Figure 7.
The resultsin Figure 8 come fromthe Tennessee Boardof RegentsCorequisite RemediationPilotStudy7
and showthat minoritystudentssawsimilargainsinoutcomesunderthe corequisitemodelacrossall
levelsof preparationandforstudentswithlowerACTscoresgainsare perhapsmore dramatic.
Figure 8.
7 Retrieved May 25 at: http://completecollege.org/wp-content/uploads/2016/01/TBR-CoRequisite-Study-Update-
Fall-2015-pages-2.pdf
31%
16%
37%
31%
37%
20%
29%
12% 14%
64%
71%
55%
64%
68%
63% 64% 61% 62%
0%
50%
100%
Colorado Georgia Indiana Tennessee West
Virginia
Colorado Georgia Indiana Tennessee West
Virginia
Percentof Remedial StudentsWhoComplete an AssociatedGateway Course
Prerequisite Corequisite
English Math
N/A
SHEEO-CCA Equity Brief - DRAFT
11 | P a g e
In lightof these results,six highereducationpolicyorganizationshave endorsedcore principlesfor
transformingremediation8
designedtohelpstatesfocusonthe keyelementsneededtoachieve results.
Reformingplacementtoinclude multiple measuresandcareerpathways,enrollingstudentsdirectlyinto
college-level courseswithadditional support,servingasmall numberof studentswhomaynotsucceed
inthe gatewaycourse rightaway,aligninggatewaycourseswithaprogramof study,and trackingdata
are the essential principlesthatprovidearoad map forimplementingnew modelsof remediation.
Equity Challenge 3:
Underserved Students don’t start out on trackfor on time graduation
Most Americansbelieve itshouldtake twoyearstocomplete anassociate degree andfouryearsto
complete abachelor’sdegree asthisishow these degreesare marketedanddescribed.Still,fartoofew
studentscomplete two-yearorfour-yeardegreesontime.9
One reasonforthis issimple math:most
associate degreesconsistof 60 credits;most bachelor’sdegreesconsistof 120 credits.To be on track to
graduate on time, studentsmustcomplete 30credits peryear. Far toofew studentsmeetthisthreshold.
Figure 9.
The numberof studentswhocomplete30 or more credits inthe firstyear differsmateriallyacrossraces
and institutiontypes.Again,Asianandwhite studentsare more likelytostartoff on-trackthan their
blackand Hispaniccounterparts.The difference isespeciallypronouncedattwo-yearand four-yearnon-
researchinstitutions,the institutionsthat blackandHispanicstudentsare more likelytoattend.Across
the board, toofewstudentsstartout theircollege careerbycompletingthe 30 credithours inthe first
8 www.core-principles.org
9 Complete CollegeAmerica. (2014). The Four-Year Myth. Retrieved OnlineJune 1, 2016 from
http://completecollege.org/wp-content/uploads/2014/11/4-Year-Myth.pdf
SHEEO-CCA Equity Brief - DRAFT
12 | P a g e
yearthat theyneedtobe on track foran on-time degree.Evenatfour-yearresearchinstitutions,almost
a full 20 percentof studentsdonotstart out on time,andthe data are worse forblack andHispanic
students.
It isimportantto note that the acceptedstandardfor full time is24 credits peryear,rather than30, in
part due to federal financialaid parameters.Attwo-yearinstitutions,fewerthan40 percentof students
whostart full time intheirfirstsemestercompleteafull-time loadintheirfirstyearandfewerthan20
percentof blackstudentscomplete 24creditsintheirfirstyear.Pairthese data withthe fact that 62
percentof blackstudentsare attendingtwo-yearinstitutionsanditisclearthat we needtodo more to
encourage full-timeenrollment.
The Game Changer:
Set the Standard: 15 is Full Time and 30 is On Time
Lookingat theirstate level dataatthe 2010 CCA Convening, representativesfromthe UniversitySystem
of Hawaii were surprised tosee howfew creditsstudentswereaccumulating.Hawaii looked furtherinto
theirdata and foundthat studentswhoenrolledin15 credithoursin theirfirstsemesterwere more
successful onmultiple measures. Many students were notencouraged toenroll in15 credits;however
these studentsassumedtheywouldgraduate ontime. The Systemmovedforwardwithapublic
awarenesscampaigntitled “15to Finish”tohelpbothstudentsandadvisorsunderstandthe importance
of enrollingin15 creditsa semester.Todaythe systemhasseennotonlyagrowth increditcompletion
but alsoimprovedoutcomesforthe growingnumberof studentsenrollinginmore credits.
There are manythingsstatescan do to define full time as15 credits persemesteror30 creditsperyear.
As part of a LuminaFoundation-fundedproject,SHEEOinterviewedstaff atthe Universityof Hawaii to
understandhowthe programwas implementedsuccessfully.Twokeyfindingarose fromthisinterview.
First,institutionswithbandedtuitionpoliciessaw betterresultswithmore studentsattemptingand
succeedingin15 credits perterm.These tuitionpoliciesessentiallymade the extracourse (credits13 –
15) free aspart of a tuitionwindow.Those institutionswithlineartuitionstructureschargingforeach
credithour saw fewerpositivegains.Second,buy-infrominstitutional leadership—andmore
importantly,staff—wascritical tothe successof the implementation;specifically,shiftingthe default
definitionof 12 creditsequalsfull timethatalignswiththe federalPelldefinitionto15 for Hawaii’s
financial aidcounselors10
.
Complete CollegeAmericahasdrawnon thiswork,making “Full time is15” a key game changer, and
has workedwithstates (e.g.,Utah, Nevada, KentuckyandIndiana) toimplementtheirownpublic
service campaigns andidentifyotherwayspolicymakerscan reduce barriersforstudentstocomplete
on time by:
 Making the vastmajorityof theirdegrees60 or 120 credits
 Encouragingall institutions—notjustselective ones—toadoptbandedtuitionpoliciestomake it
more cost effectiveforstudentstoenroll in15 credits persemester
 Making 15 credits pertermor 30 credits peryearthe defaultnumberof creditsstudentsare
encouragedtoenroll in ratherthan 12 or 24
10 Carlson,Andy, Zaback,Katie. (2014) Moving the Needle: How Financial Aid Policies Can Help States Meet
Student Completion Goals.SHEEO Projectwith Lumina Foundation Support.
SHEEO-CCA Equity Brief - DRAFT
13 | P a g e
 Urging statesas well asthe federal governmenttoprovide bonusesthatallow studentswiththe
mostfinancial needtoenroll fulltime
These policiesare yielding initial positive resultsintheirfirstyearof implementation.Between2011 and
2012, the Universityof Hawaii Systemsaw the numberof studentsattempting15or more creditsin
theirfirstyearrise from 36 percentto 52 percentat four-yearinstitutions.These resultshave remained
consistentacrossadditional years withpromisingimprovementsinfactorslike retention,withachange
from9 percentto 11 percent.11
These dataalsoshow that underrepresentedminoritypopulations
actuallyexperiencedlargergains.
Figure 10.
By takinga comprehensive approach Indianasaw similartrends.Inadditiontooffering15to Finish
campaignresourcestocampuses,the IndianaCommissionof HigherEducation tiedstate financial aid
policiesto30 credits peryear byprovidingbonusestostudentswhoenrollinorcomplete 30 credits.
Afterthischange,studentsinthe O’Bannonneed-basedaidprogramcompleting30 creditsintheirfirst
yearincreasedfrom51 percentto63 percent. The approach doesnothave to be “all or nothing.”
Indianahasmaintained24 creditsasthe baseline foritsO’Bannonneed-basedgrantprogram, butoffers
bonuspaymentsforstudentscompleting30creditsduringan academicyear. Finally,anumberof
institutionsinIndianahave startedtoofferorconsiderofferingbandedtuitiontofurtherfacilitatecredit
accumulation,ineffect,making15 creditsa termcost the same as 12.
If we are to close the equitygapsinthe highereducationsystemwe mustcreate systemsthatput
students ona path to on-time graduationthe momenttheywalkoncampus. 15 to Finishcan be
11 Retrieved May 25, 2016 at: http://15tofinish.com/wp-content/uploads/2015/07/15_to_Finish_4-
Yr_Combined_Report-September_2013.pdf and http://15tofinish.com/wordpress/ftf-
content/uploads/2015/07/15toFinish_Summary_Fall2014_v1.pdf
SHEEO-CCA Equity Brief - DRAFT
14 | P a g e
complementedwithotherstructural changessuchas corequisite remediationandelementsof guided
pathwaysthathelpensure creditscount.
Equity Challenge 4:
More students are enrolled part-time and fewer part-time students succeed
Studentswhoenroll fulltime are more likelytograduate than are part-time ormixedenrollment
students. Studentswhoenroll fulltime completemore credits more quickly,therebydecreasingtheir
time to degree andincreasingtheirlikelihoodof success.Students whoenroll full time notonlyhave a
clearerpathto success,theyalsohave more access to supportservices suchasfaculty office hours,lab
hours,tutoring,counseling,andpeerstudygroups. Finally,full-time enrollmentmaximizesthe returnon
investmentbecause the economicbenefitsof the credentialare realizedsooner. Datafromthe National
StudentClearinghouseSignature Reports,whichcantrackdata across both institutionsandstates,
regularlyshowthatsix-yearcompletionratesare dramaticallyhigherforstudentswhoenroll fulltime all
the time.Unfortunately,only40 percentof studentsenroll full time all the time.
Data collectedfromCompleteCollegeAmericaAlliance of Statesshow thatthere are few differences
withinsectorsacrossrace groups.Onaverage,a little lessthan40 percentof studentsenrolledin
communitycollege are enrolledfulltime,70percentof studentsatfour-yearnon-researchinstitutions
are enrolledfull time,andclose to85 percentof studentsatresearchinstitutionsare enrolledfull time.
The one notable exceptionisthatAsianstudentsenrolledattwo-yearandblackstudentsatfour-year
researchinstitutionsare lesslikelytobe enrolledfull time thanstudentsfromothergroups.When
combinedwithenrollmentdatafromsectionone thatshows blackand Hispanicstudentsare much
more likelytobe enrolledintwo-yearinstitutionsandnon-researchfour-yearinstitutionsitisclearthat
to addressthe needsof these studentswe musthelpimprove outcomesforpart-time andmixed
enrollmentstudents.
Figure 10.
35%
68%
85%
39%
70%
78%
40%
72%
84%
41%
73%
86%
0%
50%
100%
Two Year Four Year Four Year Research
Percentof StudentsEnrolledFull Time
A B H WA B H WA B H W
SHEEO-CCA Equity Brief - DRAFT
15 | P a g e
The Game Changer:
We must provide more structure and clearer pathways for studentsnot enrolledfull time
For all studentstobe successful,theyneedanexpectationandpathwayforcompletion.Institutionsand
systemsinIndiana,Tennessee,andNew Yorkhave implementedstructuredschedulingwithpromising
initial results. Structuredschedulingcreatesclassesofferedinablockduringa specifictime period
throughouta degree program.Manyfor-profitandprivate,nonprofitinstitutionsalreadyoffercourses
inthisway. The collegesof appliedtechnologyinTennessee have streamlinedthe pathtocompletionby
enrollingstudentsinwholeacademicprograms, andhave managedtoattainan average completionrate
of 75 percent12
.Atthe CityUniversityof New York(CUNY) StellaandCharlesGuttmanCommunity
College studentsparticipateinastructured,cohort-basedprogram.Atthisinstitutionjust under30
percentthe firsttwocohorts have graduatedcomparedtojustover 6 percentfor otherCUNY
institutions.13
In2015, the Texaslegislaturepassedabill requiring some healthdegreesandcareerand
technical programstoimplementstructuredschedules withhopes theywill yieldsimilaroutcomes.
In additiontoincreasingpredictabilityanddecreasingtimetodegree,structuredschedulingwithin
degree programsallowsinstitutionstobuildcohortsof studentsworkingtowardacredential together.
Providingstudentswithapeergroupas theyprogressthroughtheireducationisone of the highimpact
practices measuredbythe National Surveyof StudentEngagementandshowntohave positive
outcomes.These practiceshelpall students andearlyresultsindicate thattheyhelpunderserved
studentpopulationsmore.
Equity Challenge 5:
Reaching the End Goal (Time and Credits to Degree)
In 2011, Complete College Americareleaseditsreport, Timeis theEnemy, whichhighlighted evidence
that studentsare takingfar toolongto graduate,and that those whodograduate have far more credits
than theyneedtogettheirdegree.Studentsfromall race groups take more time andearn excess
creditsthanwhat is requiredfortheirdegree orcredential. Onaverage,ittakesassociate degree
studentswhoenterfull time almosttwice aslongtocomplete andalmostas longas a bachelor’sdegree
requires.Forbachelor’sdegreestudents, ittakesstudentsatnon-researchfour-yearinstitutionsan
extrayearto complete,andat researchinstitutions,anextrasemestertocomplete.
Thoughthere are manyreasonsthat studentstake extratime,excesscreditsare likelyone culprit. Over
the time takento earnthe credential,associate degree recipientsearn,onaverage,30percentmore
creditsthantheyneed.Bachelor’sdegreerecipientsgraduate withanaverage of 12 percentmore
creditsthantheyneed.
12 Based on calculations of data submitted in 2014 to Complete College America.
13 Brown, J. and Kurzweil,M. (20016). Student Success by Design CUNY’s Guttman Community College. Retrieved
OnlineJune 28,2016 at: http://www.sr.ithaka.org/wp-
content/uploads/2016/02/SR_Case_Study_Student_Success_by_Design_Guttman020416.pdf
SHEEO-CCA Equity Brief - DRAFT
16 | P a g e
Figure 11.
Figure 12.
These data are perhapsmostinterestingwhenlookedat throughan equitylens.Inthiscase,whatis
mostinterestingisthe lackofdifference across race categories. Infact,Asianstudents are mostlikelyto
geta degree butalsotendto stayin the systemthe longerandaccumulate slightlymore credits. In
contrast, black students andlesslikelytograduate butforthose whodo so fasterandin manycases
withfewercredits.These similaritiessuggestthat,ingeneral,studentsare capable of completingcollege
withsimilaroutcomes andtheyoftendo.
The Game Changer:
Studentsneedto be put on direct pathways from day one
We are losingfar toomany students,particularlyblackand Hispanicstudents, inaneducationpipeline
that doesnotmeet theirneeds.The systemsandstructuresinourexistinghighereducation system
simplydo notmeetthe needsof today’sstudent. If we wantmore studentstocomplete,theymusthave
4.3
5.1
4.8
3.8
4.8
4.4
3.9
4.9
4.5
3.9
5.1
4.5
0
2
4
6
Associates Bachelors Bachelors Research
Average Time to Degree for Full Time Students
79
135 135
78
134 134
82
138 138
78
134 136
0
60
120
Associates Bachelors Bachelors Research
Average Creditsto Degree for Full Time Students
A B H WA B H WA B H W
SHEEO-CCA Equity Brief - DRAFT
17 | P a g e
the supporttheyneedtokeepthemenrolledandonaclear pathto graduation. We must addressequity
by rethinkingandredesigninghighereducationdelivery inwaysthatwill helpclose achievementgaps
that clearly exist. Studentsneedsupportstochoose the rightpathwaysandtheyneedtobe put directly
on those pathways.Evenif theycannotcomplete on time,theyneedaclearexpectationabouthow
much time itwill take, andwhatthey will needtodoto accomplishit. There are manyexamplesof
institutions thathave implementedcomprehensive guidedpathwayssystems whichhave yielded
unprecedentedresults.
For example,overtenyears,FloridaState Universitywasable touse degree mapsandtechnology
solutionstoimplementthosemapstoincrease graduationratesto74 percentforall students,77
percentforblack students, and70 percentforHispanicstudents.GeorgiaState hasuseddegree maps,
intrusive advisingandotherstrategiestobecome the U.S.Universitythatconfersthe mostdegreesto
blackstudentsandtheyhave a 57 percentgraduationrate forAfricanAmericansand66 percentfor
Hispanicstudents14
.Strategieslike defaultpathways,informedchoice,meta-majors,academicmaps,
milestonecourses,andintrusive advisingcanstandalone or togetherwithothergame changerslike
corequisite remediation, fulltime is 15-strategies, andstructured schedules askeycomponentsof a
comprehensive guidedpathwaysapproach.
14 Complete CollegeAmerica. (2012) Guided Pathways to Success:Boosting College Completion. Retrieved online
May 25, 2016 at: http://www.completecollege.org/docs/GPS_Summary_FINAL.pdf
SHEEO-CCA Equity Brief - DRAFT
18 | P a g e
Conclusion
The CCA datasetallowsusto examine successbyrace/ethnicitycategoryandinstitutiontype
throughouteachstepof the postsecondaryeducationfromenrollmentthroughcompletion.Thislevel of
detail haspreviouslynotbeenavailable andallowsustodrill downintothe “blackbox”between
enrollmentandcompletion/non-completiontoreallyunderstandwhere equitygapsdeveloporgrow.
Nationally,the datapresentedhere show thatateachstage of the postsecondarypipeline,blackand
Hispanicstudentsare lesslikelytosucceedthantheirwhite andAsianpeers. Overthe course of the
pipeline,these effectscompounduponthemselvesandbecome cumulative;the endresultof whichis
that blackand Hispanicstudentsare lesslikelytoearna postsecondarycredential.
If we are to addressthiscountry’sattainmentgapswe mustaddressourequitygapsat the root.We can
no longeraffordtolose studentsinaneducationsystemthatdoes notmeettheirneeds.The game
changerscontinue to show promisinginitial resultsinclosingequitygapsthroughoutthe postsecondary
educationpipelineand inhelpingstudentscompletetheirdegree orcredential. These earlyresults in
pilotstatesare positive and,asthese studentsmove forwardthroughtheircourse of study,the CCA
datasetwill provide amore complete picture of the effectof these programs.
It isimportantto recognize andacceptthat the earlyresultsfromstatesandinstitutionsimplementing
these game changersdidnothappenovernight.Theyare the resultof intentional andcommittedaction
to change howstudentsupportsare deliveredandimprove successfortheirunderservedstudent
populations.Otherstatesandinstitutionscanrealize similarresultsonce theycommittoimprovingthe
likelihoodof successforunderservedpopulations.

More Related Content

What's hot

The College Gender Gap in the U.S. and Colorado- Survey and Analysis
The College Gender Gap in the U.S. and Colorado- Survey and AnalysisThe College Gender Gap in the U.S. and Colorado- Survey and Analysis
The College Gender Gap in the U.S. and Colorado- Survey and Analysis
Michael Weddington
 
The Importance of Being in School
The Importance of Being in SchoolThe Importance of Being in School
The Importance of Being in School
Luis Taveras EMBA, MS
 
Educating Youth in Short-Term Detention
Educating Youth in Short-Term DetentionEducating Youth in Short-Term Detention
Educating Youth in Short-Term Detention
Tanya Paperny
 
Survey Results and Report- Hawaii State High School College Counselors
Survey Results and Report- Hawaii State High School College CounselorsSurvey Results and Report- Hawaii State High School College Counselors
Survey Results and Report- Hawaii State High School College Counselors
Michael Weddington
 
Brown, sidney l. the impact of middle schools health on dropout rates schooli...
Brown, sidney l. the impact of middle schools health on dropout rates schooli...Brown, sidney l. the impact of middle schools health on dropout rates schooli...
Brown, sidney l. the impact of middle schools health on dropout rates schooli...
William Kritsonis
 
Dr. W.A. Kritsonis, National FORUM Journals, www.nationalforum.com
Dr. W.A. Kritsonis, National FORUM Journals, www.nationalforum.comDr. W.A. Kritsonis, National FORUM Journals, www.nationalforum.com
Dr. W.A. Kritsonis, National FORUM Journals, www.nationalforum.com
William Kritsonis
 
WGS Recommendation Report
WGS Recommendation ReportWGS Recommendation Report
WGS Recommendation Report
Kyle Frost
 
Reality Check 2006: How Black and Hispanic Families Rate Their Schools
Reality Check 2006: How Black and Hispanic Families Rate Their SchoolsReality Check 2006: How Black and Hispanic Families Rate Their Schools
Reality Check 2006: How Black and Hispanic Families Rate Their Schools
Amber Ott
 
2016 Building a Grad Nation webinar slides
2016 Building a Grad Nation webinar slides2016 Building a Grad Nation webinar slides
2016 Building a Grad Nation webinar slides
America's Promise Alliance
 
Taxonomy of Research on At-Risk Students
Taxonomy of Research on At-Risk StudentsTaxonomy of Research on At-Risk Students
Taxonomy of Research on At-Risk Students
John Charles
 
Grant Narrative
Grant NarrativeGrant Narrative
Grant Narrative
ucrmentors
 
Patterns and Trends in Educational Opportunity for Students in Juvenile Justi...
Patterns and Trends in Educational Opportunity for Students in Juvenile Justi...Patterns and Trends in Educational Opportunity for Students in Juvenile Justi...
Patterns and Trends in Educational Opportunity for Students in Juvenile Justi...
Jeremy Knight
 
Staying in College: Student services and Freshman Retention
Staying in College:  Student services and Freshman RetentionStaying in College:  Student services and Freshman Retention
Staying in College: Student services and Freshman Retention
Dawn Follin
 
20871 prelim2
20871 prelim220871 prelim2
20871 prelim2
Will Valet
 
Pesquisa Pew sobre o Brasil - Junho de 2014
Pesquisa Pew sobre o Brasil - Junho de 2014Pesquisa Pew sobre o Brasil - Junho de 2014
Pesquisa Pew sobre o Brasil - Junho de 2014
Miguel Rosario
 
Benchmarks: WICHE Region 2017
Benchmarks: WICHE Region 2017Benchmarks: WICHE Region 2017
Karim Anil: Need for Change
Karim Anil: Need for ChangeKarim Anil: Need for Change
Karim Anil: Need for Change
AnilKarim
 
Eanes Senior Thesis
Eanes Senior ThesisEanes Senior Thesis
Eanes Senior Thesis
Clayton Eanes
 
An Impact Analysis of North Carolina’s Opportunity Scholarship Program on Stu...
An Impact Analysis of North Carolina’s Opportunity Scholarship Program on Stu...An Impact Analysis of North Carolina’s Opportunity Scholarship Program on Stu...
An Impact Analysis of North Carolina’s Opportunity Scholarship Program on Stu...
Mebane Rash
 
Regional Snapshot: Public Education in Metro Atlanta
Regional Snapshot: Public Education in Metro AtlantaRegional Snapshot: Public Education in Metro Atlanta
Regional Snapshot: Public Education in Metro Atlanta
ARCResearch
 

What's hot (20)

The College Gender Gap in the U.S. and Colorado- Survey and Analysis
The College Gender Gap in the U.S. and Colorado- Survey and AnalysisThe College Gender Gap in the U.S. and Colorado- Survey and Analysis
The College Gender Gap in the U.S. and Colorado- Survey and Analysis
 
The Importance of Being in School
The Importance of Being in SchoolThe Importance of Being in School
The Importance of Being in School
 
Educating Youth in Short-Term Detention
Educating Youth in Short-Term DetentionEducating Youth in Short-Term Detention
Educating Youth in Short-Term Detention
 
Survey Results and Report- Hawaii State High School College Counselors
Survey Results and Report- Hawaii State High School College CounselorsSurvey Results and Report- Hawaii State High School College Counselors
Survey Results and Report- Hawaii State High School College Counselors
 
Brown, sidney l. the impact of middle schools health on dropout rates schooli...
Brown, sidney l. the impact of middle schools health on dropout rates schooli...Brown, sidney l. the impact of middle schools health on dropout rates schooli...
Brown, sidney l. the impact of middle schools health on dropout rates schooli...
 
Dr. W.A. Kritsonis, National FORUM Journals, www.nationalforum.com
Dr. W.A. Kritsonis, National FORUM Journals, www.nationalforum.comDr. W.A. Kritsonis, National FORUM Journals, www.nationalforum.com
Dr. W.A. Kritsonis, National FORUM Journals, www.nationalforum.com
 
WGS Recommendation Report
WGS Recommendation ReportWGS Recommendation Report
WGS Recommendation Report
 
Reality Check 2006: How Black and Hispanic Families Rate Their Schools
Reality Check 2006: How Black and Hispanic Families Rate Their SchoolsReality Check 2006: How Black and Hispanic Families Rate Their Schools
Reality Check 2006: How Black and Hispanic Families Rate Their Schools
 
2016 Building a Grad Nation webinar slides
2016 Building a Grad Nation webinar slides2016 Building a Grad Nation webinar slides
2016 Building a Grad Nation webinar slides
 
Taxonomy of Research on At-Risk Students
Taxonomy of Research on At-Risk StudentsTaxonomy of Research on At-Risk Students
Taxonomy of Research on At-Risk Students
 
Grant Narrative
Grant NarrativeGrant Narrative
Grant Narrative
 
Patterns and Trends in Educational Opportunity for Students in Juvenile Justi...
Patterns and Trends in Educational Opportunity for Students in Juvenile Justi...Patterns and Trends in Educational Opportunity for Students in Juvenile Justi...
Patterns and Trends in Educational Opportunity for Students in Juvenile Justi...
 
Staying in College: Student services and Freshman Retention
Staying in College:  Student services and Freshman RetentionStaying in College:  Student services and Freshman Retention
Staying in College: Student services and Freshman Retention
 
20871 prelim2
20871 prelim220871 prelim2
20871 prelim2
 
Pesquisa Pew sobre o Brasil - Junho de 2014
Pesquisa Pew sobre o Brasil - Junho de 2014Pesquisa Pew sobre o Brasil - Junho de 2014
Pesquisa Pew sobre o Brasil - Junho de 2014
 
Benchmarks: WICHE Region 2017
Benchmarks: WICHE Region 2017Benchmarks: WICHE Region 2017
Benchmarks: WICHE Region 2017
 
Karim Anil: Need for Change
Karim Anil: Need for ChangeKarim Anil: Need for Change
Karim Anil: Need for Change
 
Eanes Senior Thesis
Eanes Senior ThesisEanes Senior Thesis
Eanes Senior Thesis
 
An Impact Analysis of North Carolina’s Opportunity Scholarship Program on Stu...
An Impact Analysis of North Carolina’s Opportunity Scholarship Program on Stu...An Impact Analysis of North Carolina’s Opportunity Scholarship Program on Stu...
An Impact Analysis of North Carolina’s Opportunity Scholarship Program on Stu...
 
Regional Snapshot: Public Education in Metro Atlanta
Regional Snapshot: Public Education in Metro AtlantaRegional Snapshot: Public Education in Metro Atlanta
Regional Snapshot: Public Education in Metro Atlanta
 

Viewers also liked

Как случайное открытие химиков изменило мир моды.
Как случайное открытие химиков изменило мир моды.Как случайное открытие химиков изменило мир моды.
Как случайное открытие химиков изменило мир моды.
Жанна Подколзина
 
Affiche animation salon pba
Affiche animation salon pbaAffiche animation salon pba
Affiche animation salon pba
Paris Beauty Academy
 
ACB Company Profile
ACB Company ProfileACB Company Profile
ACB Company Profile
American Breeze
 
Zahgar Takla
Zahgar TaklaZahgar Takla
Zahgar Takla
Zahgar Takla
 
昌骅 PPR001 样箱试验报告-140806
昌骅 PPR001 样箱试验报告-140806昌骅 PPR001 样箱试验报告-140806
昌骅 PPR001 样箱试验报告-140806Laura Han
 
תארים
תאריםתארים
תארים
Lilach Levi
 
Presentation by jonathan holdsworth
Presentation by jonathan holdsworthPresentation by jonathan holdsworth
Presentation by jonathan holdsworth
Jonathan Holdsworth
 
6973432
69734326973432
Hotel and lodges company brochure beglinwoods architects
Hotel and lodges company brochure beglinwoods architectsHotel and lodges company brochure beglinwoods architects
Hotel and lodges company brochure beglinwoods architects
Simon Woods
 
Обувь Christian Louboutin
Обувь Christian LouboutinОбувь Christian Louboutin
Обувь Christian Louboutin
Жанна Подколзина
 
SAICM conference speech current_mh final feb 5
SAICM conference speech current_mh final feb 5SAICM conference speech current_mh final feb 5
SAICM conference speech current_mh final feb 5
Felix Dodds
 

Viewers also liked (11)

Как случайное открытие химиков изменило мир моды.
Как случайное открытие химиков изменило мир моды.Как случайное открытие химиков изменило мир моды.
Как случайное открытие химиков изменило мир моды.
 
Affiche animation salon pba
Affiche animation salon pbaAffiche animation salon pba
Affiche animation salon pba
 
ACB Company Profile
ACB Company ProfileACB Company Profile
ACB Company Profile
 
Zahgar Takla
Zahgar TaklaZahgar Takla
Zahgar Takla
 
昌骅 PPR001 样箱试验报告-140806
昌骅 PPR001 样箱试验报告-140806昌骅 PPR001 样箱试验报告-140806
昌骅 PPR001 样箱试验报告-140806
 
תארים
תאריםתארים
תארים
 
Presentation by jonathan holdsworth
Presentation by jonathan holdsworthPresentation by jonathan holdsworth
Presentation by jonathan holdsworth
 
6973432
69734326973432
6973432
 
Hotel and lodges company brochure beglinwoods architects
Hotel and lodges company brochure beglinwoods architectsHotel and lodges company brochure beglinwoods architects
Hotel and lodges company brochure beglinwoods architects
 
Обувь Christian Louboutin
Обувь Christian LouboutinОбувь Christian Louboutin
Обувь Christian Louboutin
 
SAICM conference speech current_mh final feb 5
SAICM conference speech current_mh final feb 5SAICM conference speech current_mh final feb 5
SAICM conference speech current_mh final feb 5
 

Similar to Serving the Equity Imperative 7_1

The State of Higher Educationin CaliforniaLATINOS Bl.docx
The State of Higher Educationin CaliforniaLATINOS Bl.docxThe State of Higher Educationin CaliforniaLATINOS Bl.docx
The State of Higher Educationin CaliforniaLATINOS Bl.docx
sarah98765
 
Research Paper Draft TPOLS496 Internship
Research Paper Draft TPOLS496 InternshipResearch Paper Draft TPOLS496 Internship
Research Paper Draft TPOLS496 Internship
J. Bradon Rothschild
 
Keeping kids in the classroom2
Keeping kids in the classroom2Keeping kids in the classroom2
Keeping kids in the classroom2
Charles Semarjian
 
Complete dissertation prospectus
Complete dissertation prospectusComplete dissertation prospectus
Complete dissertation prospectus
juliuswairimu1
 
Achieving the New Normal final
Achieving the New Normal finalAchieving the New Normal final
Achieving the New Normal final
Deborah Howard
 
Dr. Karen Weddle-West & Dr. Rosie Phillips Bingham, University of Memphis
Dr. Karen Weddle-West & Dr. Rosie Phillips Bingham, University of MemphisDr. Karen Weddle-West & Dr. Rosie Phillips Bingham, University of Memphis
Dr. Karen Weddle-West & Dr. Rosie Phillips Bingham, University of Memphis
William Kritsonis
 
Grant Sample
Grant SampleGrant Sample
California's Educational System: A Failing Grade?
California's Educational System: A Failing Grade?California's Educational System: A Failing Grade?
California's Educational System: A Failing Grade?
Geneva Mae Lewis
 
Need For Change V Dupree
Need For Change   V  DupreeNeed For Change   V  Dupree
Need For Change V Dupree
University of Houston-Victoria
 
Foundation Blueprint: Broadening our approach and expanding our impact
Foundation Blueprint: Broadening our approach and expanding our impactFoundation Blueprint: Broadening our approach and expanding our impact
Foundation Blueprint: Broadening our approach and expanding our impact
Andy Pino
 
AP_report
AP_reportAP_report
AP_report
Mary Batiwalla
 
Underrepresented API Populations in Higher Education
Underrepresented API Populations in Higher EducationUnderrepresented API Populations in Higher Education
Underrepresented API Populations in Higher Education
RPM Consulting
 
Grant Proposal for Apsara Studios
Grant Proposal for Apsara StudiosGrant Proposal for Apsara Studios
Grant Proposal for Apsara Studios
Arnold King
 
Grant Proposal for Apsara Studios
Grant Proposal for Apsara StudiosGrant Proposal for Apsara Studios
Grant Proposal for Apsara Studios
Arnold King
 
R_DAY_POSTER_F
R_DAY_POSTER_FR_DAY_POSTER_F
R_DAY_POSTER_F
Reuben Hilliard
 
CALLBOOKLETweb
CALLBOOKLETwebCALLBOOKLETweb
CALLBOOKLETweb
Sean Traigle
 
Brashear Essay
Brashear EssayBrashear Essay
Brashear Essay
Andrew Smith
 
AN INTERIM REPORT ON A PILOT CREDITRECOVERY PROGRAM IN A LAR.docx
AN INTERIM REPORT ON A PILOT CREDITRECOVERY PROGRAM IN A LAR.docxAN INTERIM REPORT ON A PILOT CREDITRECOVERY PROGRAM IN A LAR.docx
AN INTERIM REPORT ON A PILOT CREDITRECOVERY PROGRAM IN A LAR.docx
nettletondevon
 
Bay_Area_Top_Schools_Report_November2015_Web
Bay_Area_Top_Schools_Report_November2015_WebBay_Area_Top_Schools_Report_November2015_Web
Bay_Area_Top_Schools_Report_November2015_Web
Joel Key
 
Samantha Durrance - Do Family Income and Parent Education Explain Racial Diff...
Samantha Durrance - Do Family Income and Parent Education Explain Racial Diff...Samantha Durrance - Do Family Income and Parent Education Explain Racial Diff...
Samantha Durrance - Do Family Income and Parent Education Explain Racial Diff...
Samantha Durrance
 

Similar to Serving the Equity Imperative 7_1 (20)

The State of Higher Educationin CaliforniaLATINOS Bl.docx
The State of Higher Educationin CaliforniaLATINOS Bl.docxThe State of Higher Educationin CaliforniaLATINOS Bl.docx
The State of Higher Educationin CaliforniaLATINOS Bl.docx
 
Research Paper Draft TPOLS496 Internship
Research Paper Draft TPOLS496 InternshipResearch Paper Draft TPOLS496 Internship
Research Paper Draft TPOLS496 Internship
 
Keeping kids in the classroom2
Keeping kids in the classroom2Keeping kids in the classroom2
Keeping kids in the classroom2
 
Complete dissertation prospectus
Complete dissertation prospectusComplete dissertation prospectus
Complete dissertation prospectus
 
Achieving the New Normal final
Achieving the New Normal finalAchieving the New Normal final
Achieving the New Normal final
 
Dr. Karen Weddle-West & Dr. Rosie Phillips Bingham, University of Memphis
Dr. Karen Weddle-West & Dr. Rosie Phillips Bingham, University of MemphisDr. Karen Weddle-West & Dr. Rosie Phillips Bingham, University of Memphis
Dr. Karen Weddle-West & Dr. Rosie Phillips Bingham, University of Memphis
 
Grant Sample
Grant SampleGrant Sample
Grant Sample
 
California's Educational System: A Failing Grade?
California's Educational System: A Failing Grade?California's Educational System: A Failing Grade?
California's Educational System: A Failing Grade?
 
Need For Change V Dupree
Need For Change   V  DupreeNeed For Change   V  Dupree
Need For Change V Dupree
 
Foundation Blueprint: Broadening our approach and expanding our impact
Foundation Blueprint: Broadening our approach and expanding our impactFoundation Blueprint: Broadening our approach and expanding our impact
Foundation Blueprint: Broadening our approach and expanding our impact
 
AP_report
AP_reportAP_report
AP_report
 
Underrepresented API Populations in Higher Education
Underrepresented API Populations in Higher EducationUnderrepresented API Populations in Higher Education
Underrepresented API Populations in Higher Education
 
Grant Proposal for Apsara Studios
Grant Proposal for Apsara StudiosGrant Proposal for Apsara Studios
Grant Proposal for Apsara Studios
 
Grant Proposal for Apsara Studios
Grant Proposal for Apsara StudiosGrant Proposal for Apsara Studios
Grant Proposal for Apsara Studios
 
R_DAY_POSTER_F
R_DAY_POSTER_FR_DAY_POSTER_F
R_DAY_POSTER_F
 
CALLBOOKLETweb
CALLBOOKLETwebCALLBOOKLETweb
CALLBOOKLETweb
 
Brashear Essay
Brashear EssayBrashear Essay
Brashear Essay
 
AN INTERIM REPORT ON A PILOT CREDITRECOVERY PROGRAM IN A LAR.docx
AN INTERIM REPORT ON A PILOT CREDITRECOVERY PROGRAM IN A LAR.docxAN INTERIM REPORT ON A PILOT CREDITRECOVERY PROGRAM IN A LAR.docx
AN INTERIM REPORT ON A PILOT CREDITRECOVERY PROGRAM IN A LAR.docx
 
Bay_Area_Top_Schools_Report_November2015_Web
Bay_Area_Top_Schools_Report_November2015_WebBay_Area_Top_Schools_Report_November2015_Web
Bay_Area_Top_Schools_Report_November2015_Web
 
Samantha Durrance - Do Family Income and Parent Education Explain Racial Diff...
Samantha Durrance - Do Family Income and Parent Education Explain Racial Diff...Samantha Durrance - Do Family Income and Parent Education Explain Racial Diff...
Samantha Durrance - Do Family Income and Parent Education Explain Racial Diff...
 

Serving the Equity Imperative 7_1

  • 1. Serving the Equity Imperative: Intentional Action Toward Greater Student Success 2016 Serving the Equity Imperative: Intentional Action Toward Greater Student Success Katie Zaback, Andrew Carlson, Sophia Laderman and Sharmila Mann State Higher Education Executive Officers and Complete College America July 13, 2016
  • 2. SHEEO-CCA Equity Brief - DRAFT 2 | P a g e Introduction If statesare to achieve theirpostsecondaryeducationattainmentgoals,itisbecomingincreasinglyclear that theymusttake directand immediate actiontoaddressthe equitygapsinpostsecondaryeducation betweenunderservedpopulationsandthe more likelytosucceedwhite andAsianstudents.Notonlyis earninga postsecondarycredential essential forindividualeconomicvitality,butitisnecessarytothe economicvitalityof ourstatesandour nation.AsSteve Murdock, demographerand formerdirectorof the U.S. CensusBureau,hassaid,the economicprosperityof the entire nationhingesonreducingthese gaps,since reducingthemisthe single greatestwayforusto drive economicgrowth1 . Unfortunately,thesestudentsare disproportionatelyimpactedbycomponentsof the educationsystem that consistentlyfail all students. Underserved studentsare overrepresentedinaremedial education systemfromwhich fewstudentseveremerge.Theyare more likelytoattendunder-resourced institutionswithfewerstructuresknowntosupportstudentsuccessand, asa result,accumulate fewer creditsintheirfirstyear.All these factorscontribute tothe gapin completionrates. The data presentedinthispolicybrief supportthe notionthattime is,infact,the enemy andthat for manyunderservedstudentsahighereducationcredentialunnecessarilytakestoolongtocomplete and costs toomuch, ultimatelydrivingdowncompletionratesforthese students.Thesedatashow thatfew gaps existacrossrace/ethnicityforstudentswhosuccessfullycompletethe educationpipeline.Infact, studentswhograduate take aboutthe same amountof time andthe same numberof creditsto geta degree regardlessof theirrace or ethnicstatus.We must addresseachstage of the educationpipeline to make real progressinaddressingthe equitygap. 1 Murdock, Ph.D., Steve, Professor of Sociology,RiceUniversity. Population Changein the United States: Implicationsfor Education and Socioeconomic Development. Presentation at SHEEO Higher Education Policy Conference. August 5, 2015
  • 3. SHEEO-CCA Equity Brief - DRAFT 3 | P a g e Background Establishedin2009, Complete College Americaisanational nonprofit agency withasingle mission:to workwithstatesto significantlyincreasethe numberof Americanswithqualitycareercertificatesor college degreesandtoclose attainmentgapsfortraditionallyunderrepresentedpopulations. As the national associationof statewidegoverning,policy,andcoordinatingboardsforpostsecondary education,the State HigherEducationExecutive Officers Association(SHEEO) isfocusedonincreasing postsecondaryeducationattainment.SHEEO’svisionstatementfocusesonstudentsuccessandsetsan ambitiousgoal of at least60 percentof adultsfromeverysocioeconomicanddemographiccategory completingapostsecondarydegreeorcredential of quality. Both organizationsworkdirectlywiththeirstate membersand,since 2011, have collaboratedtocollect the CCA commoncompletionmetrics.These dataprovide studentsuccesspointsthroughoutthe postsecondaryeducationpipeline.Unlike the federalIntegratedPostsecondaryEducationDataSystem (IPEDS),the CCA datasetincludes informationonremedialeducationandgatewaymathandEnglish courses;student,first-yearcreditaccumulation;andthe time andcreditstodegree.Further,CCA data can be disaggregatedbyrace/ethnicityinadditiontofull-time,part-time andtransferstatus.These data provide apowerful tool forstatesinunderstandingtheirequitygapsandtheyprovide aunique opportunitytolookat these trendsfromanational perspective.
  • 4. SHEEO-CCA Equity Brief - DRAFT 4 | P a g e Equity Challenges and Opportunities through the Postsecondary Education Pipeline Equity Challenge 1: Underserved groups are Over Represented at Less Selective Colleges with Lower Graduation Rates While,asa nation,we are startingto close accessgapsthrough increasing overall college enrollmentsof Hispanic/Latinoandblack/AfricanAmerican students,these studentsare more likelytoenroll inless selectiveinstitutionsdespitedatathatsuggestsmanymore are capable of attendinghighresearch institutions.2 Infactfully60 percentof blackstudents enrolledin2-yearinstitutions whileonly8percent enrolledinhighresearch4-yearinstitutions.Conversely,amuchhigherproportionof Asianstudents enroll inhighresearchinstitutions thananyothergroup. Figure 1. Notes: Bars to not add up to 100% becausethe percent for each sector uses an individual median of state means. AI/PI/NA: American Indian,Native Hawaiian or PacificIslander,NativeAlaskan. 2 Carnevale,Anthony P. and Strohl, J. Separate & Unequal: How Higher Education Reinforces the Intergenerational Reproduction of White Racial Privilege.Georgetown Public Policy InstituteCenter on Education and the Workforce. Retrieved onlineMarch 3, 2016 from https://cew.georgetown.edu/wp- content/uploads/2014/11/SeparateUnequal.FR_.pdf 56% 43% 60% 54% 54% 31% 25% 27% 27% 31% 13% 34% 8% 18% 19% AI/PI/NA Asian Black Hispanic White Distributionof StudentEnrollmentAcross InstitutionSectors Two Year Four Year Four Year Research
  • 5. SHEEO-CCA Equity Brief - DRAFT 5 | P a g e Figure 2. Note: AI: American Indian,Native Hawaiian or Pacific Islander,NativeAlaskan A: Asian B: Black or African American H: Hispanic or Latino W: White At all institution types, Black,HispanicandAmericanIndian,Native HawaiianorPacificIslander,Native Alaskanstudentshave lowergraduationrates andthese differencesare especiallypronouncedatthe typesof institutions whichminoritystudentsare more likelytoattend—community collegesandnon- researchfour-yearinstitutions. Asnotedabove blackstudents are farmore likelyto enroll ina communitycollege andof those whoentered full timeseekingadegree onlysevenpercentgraduated withan associate degree within three years.Another13 to 16 percentgo on totransferto a four-year institutionbefore receivingtheirdegree butonlyaportionof those studentsgoonto complete a degree. Figure 3. Note: Bars to not add up to 100%because the percent for each sector uses an individual median of state means. AI/PI/NA: American Indian,Native Hawaiian or PacificIslander,NativeAlaskan. 9% 38% 61% 16% 50% 72% 7% 31% 57% 12% 41% 63% 15% 50% 72% 0% 50% 100% Associates Bachelors Bachelors Research Graduation Rate in 150% Time (Full Time Students) 12% 5% 7% 6% 4% 39% 23% 36% 39% 32% 55% 73% 59% 57% 63% AI/PI/NA Asian Black Hispanic White Distributionof StudentCompletionsby Degree Type Certificate Associates Bachelors AI A B H WAI A B H WAI A B H W
  • 6. SHEEO-CCA Equity Brief - DRAFT 6 | P a g e Thisdisproportionate enrollment of minoritystudentsinlessselective institutions describedabove,and lack of successat those institutions alsocontributestodisproportionate attainment.The datashowa much smallerproportionof black,Hispanic,andAmericanIndian,Native HawaiianorPacificIslander, Native Alaskan studentsreceive bachelor’sdegreesincomparisonwithAsianandwhite students.While the completionof anypostsecondarycredential providesaboostinearningpotential overhighschool graduationalone,national averagesshow that bachelor’sdegrees,onaverage,conferhigherlifetime earningsthanassociate degreesjustasassociate degreesconferahigherboostthan certificates. If statesare to improve the postsecondaryattainmentratesforunderservedpopulationsitiscritical for themto focus theireffortsonequippingthe openaccessinstitutionsthese studentsattendwith promisingprogramreformstobetterserve all students.Todate,manyeffortshave focusedon improvingstudentchoice andmatching,butthisignoresthe factthatlocationandcost are the primary driversof student’scollege decisions andthatselectiveinstitutionswill neverhave asufficientnumber of seatsto serve all students. Giventhe growingdiversityinthe U.S. population,the equityimperative is clear:We mustclose the gaps inenrollment,completion,andattainment all studentgroups if we wish to have the workforce,wealth,andcivicparticipationwe needfromourcountryinthe 21st century. Thankfully,thereare policiesandpracticesemergingthatshow greatpromise forincreasingattainment ratesfor all students andimprovingoutcomesforunderservedminoritypopulations.Complete College Americacallsthese strategiesthatGame Changersbecause institutionsandstatesimplementingthese reformsare seeing promisinginitial improvementsinstudentsuccess. The Game Changer: Creatingincentivesfor studentsuccessthrough outcomes-basedfunding The firststep to ensuringthatall studentshave the opportunitytosucceedisensuringthatstudent successisthe primarygoal of postsecondaryinstitutions.Formany years,statesfundedinstitutions basedon the numberof studentstheyenrolledbut32 stateshave now shiftedtofundinginstitutions,at leastpartially,oncompletionoutcomesratherthanmerelyenrollmentinputs3 .A well-designed outcomes-basedfundingpolicytiedtoa state’sstrategicplancanhelpcreate the internal conditions necessaryfora state to focuson completionandincreasingattainment.Outcomes-basedfunding programs encourage participatinginstitutionstofocusoncompletionandthe stepsnecessarytoget studentsthere. Thoughoutcomes-basedfundingalone cannotincrease completion,thisinterventionprovidesa financial incentiveforinstitutionstoimproveoutcomes. A growingbodyof researchshowsthese modelsoftenleadtoinstitution-levelimprovementsinaligningwithstate goalstoimprove educational outcomes4 .Stateswhodistributeall ora significantportionof theirstate appropriationsbasedon outcomesratherthan enrollment,suchas TennesseeandOhio, are alsohighly involvedin institution- level reformsthatfocusoninterventions thatshow promise in improvingcompletionandclosing 3 National Conference of State Legislatures onlinePerformanceBased Fundingdashboard.Retrieved February 26, 2016 at: http://www.ncsl.org/research/education/performance-funding.aspx 4 Hearn, James C. (2015). Outcomes-Based Fundingin Historical and ComparativeContext. The Lumina Foundation. Retrieved May 25, 2016 at: https://www.luminafoundation.org/files/resources/hearn-obf-full.pdf
  • 7. SHEEO-CCA Equity Brief - DRAFT 7 | P a g e achievementgaps.Additionally,bothstates includeweightingforbetterservingunderserved populations,includingstudentswhoare older,low income, minority(inOhioonly) andotherwise at-risk. A well-designedfundingformulathatprovidesincentive fundingforcredentialsearnedby blackand Hispanicstudents mayhelpclose equitygapsinpostsecondaryeducation. The U.S. will notachieve itsattainmentgoalsif we merelyavoidincreasingthe equitygapsthatexist betweenstudentsubgroups—we mustclose those gaps.Asstatescontinue toexperimentwith outcomes-basedfunding,we will learnhow touse thislever more effectively tobothclose equitygaps and increase attainmentforall students.Bytrackingthe resultsof various outcomes-basedfunding initiativesinthe states withclose attentionpaidto the equityimperative,we have the opportunityto shape outcomes-basedfundingintoatrue game changerfor highereducationattainmentANDequity. Equity Challenge 2: Far too many students of color are lost in the traditional remediation system Most studentswhoenternon-selectivefour-yearinstitutionsandcommunitycolleges musttake placementtestsinmathandEnglishpriorto registeringforclasses.Thesetestsdetermine if astudent will startincollege level workorbe placedintoremedial ordevelopmental education.Traditionally, studentswhotestbelowcollege levelhave tocomplete aseries of courses,overmultiple semesters that do notcount towarda degree before theycanevenenroll incollege level credit-bearingcourses.For manystudents,these remedial classesare theirfirstandlastexperience incollege.Eventhose who successfullycomplete the remedial sequence fartoooftenfail toevenenroll inthe associatedgateway course5 .It isessential forstudentstocompletethese gatewaycourses earlyintheircareersince they are oftenprerequisiterequirementsforothercoursesrequiredforadegree.What’smore,datasuggest that manyof the studentsplacedinremediationcouldhave successfullycompletedcollege level courseworkif they hadstartedthere,andmany more couldcomplete if providedwithadditional supplemental support6 . While remedialplacementburdensstudentsof all races,the effectsare particularlydire forstudents fromhistoricallyunderservedpopulations. Attwo-yearinstitutions,more than70 percent of black studentsand 60 percentof Hispanicstudentsenroll inatleast one remedialcourse compared tojust over50 percentof white andAsianstudents.Atfour-yearinstitutions,the gapsare evenmore pronounced.Infact, blackstudentsare more than twice as likelytoenroll in remediation.Additionally, bothblack andHispanicstudentsare more likelytoneedremediationin bothmathandEnglish. 5 Bailey,Thomas R., Jeong, Dong W. and Cho, Sung-Woo (2009). Referral, Enrollment and Completion in Developmental Education Sequences in Community Colleges. Economics of Education Review. Volume 29, Issue2. 6 Scott-Clayton, Judith. (2012). Do High-Stakes Placement Exams Predictcollege Success? CCRC WorkingPaper No. 41. Retrieved May 25, 2016 at: http://ccrc.tc.columbia.edu/media/k2/attachments/high-stakes-predict-success.pdf
  • 8. SHEEO-CCA Equity Brief - DRAFT 8 | P a g e Figure 4. Note: Four Year Research institutions arenotincluded sincethese institutions offer very littleremediation. Successinthe firstcollege levelgatewaycourse forthose studentswhocompletethe remedial sequence alsovariesdramaticallybyrace.Inparticular,farfewerblackstudentsgoonto complete the gatewaycourse (orcoursesassociatedwiththeirremedial needs) withintwoyears,whileAsianstudents are highlylikelytocompletethe gatewaycourse.The gapsare lesspronouncedforwhite andHispanic students.Acrossbothrace and subject,fartoo few studentsof nearlyanybackgroundcomplete their associatedgatewaycourseswithintwoyearsof entry,whichsignificantlyimpactstheirabilityto complete adegree ontime. Figure 5. Note: N/A = Sample sizeis too small. Math 17% 20% 25% 27% 11% 24% 20% 15% English 13% 12% 9% 7% 8% 8% 7% 4% Both 22% 39% 30% 20% 6% 19% 12% 5% 0% 25% 50% 75% 100% Asian Black Hispanic White Asian Black Hispanic White Perventof First Time StudentsWho Enroll in Remedial Courses FourYearTwoYear 38% 52% 26% 50% N/A N/A 14% 22% 7% 25% 39% 17% 23% 35% 18% 31% 51% 25%27% 34% 16% 37% 57% 28% 0% 50% 100% Math English Math & English Math English Math & English Percentof Remedial StudentsWhoComplete an AssociatedGateway Course in Two Years Two Year Four Year A B H W A B H WA B H W A B H W B H W B H W
  • 9. SHEEO-CCA Equity Brief - DRAFT 9 | P a g e While these datagive usan overall sense of inequityacrossstudentsubgroups, Figure6highlightsthe overall impactof these trends more clearly.Forevery100 studentsenrollingin college, approximately the same numberof studentswill be successfulinremediation ineachrace/ethnicitycategory. However,since somanymore blackstudentsenroll inremedial educationandsofew completethe associated gateway;twice asmanyblackstudentsfail tocomplete gateway courses aswhite students. Althoughthe successratesfor white andHispanicstudentsare somewhatsimilar, manymore Hispanic students are lostinthe pipeline because so manymore enroll inremedial courses.Asianstudents are not onlylesslikelytoenroll inremedialcourses, theyare more likelytosucceedinremedial courses, meaningthat,unlike foranyothergroup,almostas many Asianstudentswill succeedaswill dropoutof the pipeline. Figure 6. Note: Total length of bars (green + red) represents the number of students who startin remediation These data confirmwhatthe empirical research hasbeenshowingforsome time:the traditional approach to remedial education isnotservingstudents well.These dataalsounderscore the importance of disaggregatingoutcomes byrace and ethnicity.Implicationsformaintainingthe currentsystemare greaterfor blackand Hispanicstudents whoare more likelytoenrollinremedial educationandless likelytosucceed inthe current,statusquo,system. The Game Changer: Corequisite remediation Addressingthisissuemeansabandoningthe systemthatdoesnotworkforsomethingthat continuesto show far betterresults—corequisiteremediation. Withthisapproach,studentsare enrolleddirectlyinto a college level course withadditionalcorequisite supportsystems. Remedial supportsare providedas withcollege courseworkasa corequisite ratherthanbefore collegecourseworkasa prerequisite. Colorado,Indiana,Georgia,Tennessee,andWestVirginiaare seeingdramaticincreasesingateway completionrateswithin one semester(nottwoyears) forstudentsenrolledincorequisite models. -16 -52 -35 -26 10 9 11 9 Asian Black Hispanic White First Year Pipeline for100 EnteringStudentsof Each Race Fail to Complete Gateway Course Complete Gateway Course
  • 10. SHEEO-CCA Equity Brief - DRAFT 10 | P a g e Figure 7. The resultsin Figure 8 come fromthe Tennessee Boardof RegentsCorequisite RemediationPilotStudy7 and showthat minoritystudentssawsimilargainsinoutcomesunderthe corequisitemodelacrossall levelsof preparationandforstudentswithlowerACTscoresgainsare perhapsmore dramatic. Figure 8. 7 Retrieved May 25 at: http://completecollege.org/wp-content/uploads/2016/01/TBR-CoRequisite-Study-Update- Fall-2015-pages-2.pdf 31% 16% 37% 31% 37% 20% 29% 12% 14% 64% 71% 55% 64% 68% 63% 64% 61% 62% 0% 50% 100% Colorado Georgia Indiana Tennessee West Virginia Colorado Georgia Indiana Tennessee West Virginia Percentof Remedial StudentsWhoComplete an AssociatedGateway Course Prerequisite Corequisite English Math N/A
  • 11. SHEEO-CCA Equity Brief - DRAFT 11 | P a g e In lightof these results,six highereducationpolicyorganizationshave endorsedcore principlesfor transformingremediation8 designedtohelpstatesfocusonthe keyelementsneededtoachieve results. Reformingplacementtoinclude multiple measuresandcareerpathways,enrollingstudentsdirectlyinto college-level courseswithadditional support,servingasmall numberof studentswhomaynotsucceed inthe gatewaycourse rightaway,aligninggatewaycourseswithaprogramof study,and trackingdata are the essential principlesthatprovidearoad map forimplementingnew modelsof remediation. Equity Challenge 3: Underserved Students don’t start out on trackfor on time graduation Most Americansbelieve itshouldtake twoyearstocomplete anassociate degree andfouryearsto complete abachelor’sdegree asthisishow these degreesare marketedanddescribed.Still,fartoofew studentscomplete two-yearorfour-yeardegreesontime.9 One reasonforthis issimple math:most associate degreesconsistof 60 credits;most bachelor’sdegreesconsistof 120 credits.To be on track to graduate on time, studentsmustcomplete 30credits peryear. Far toofew studentsmeetthisthreshold. Figure 9. The numberof studentswhocomplete30 or more credits inthe firstyear differsmateriallyacrossraces and institutiontypes.Again,Asianandwhite studentsare more likelytostartoff on-trackthan their blackand Hispaniccounterparts.The difference isespeciallypronouncedattwo-yearand four-yearnon- researchinstitutions,the institutionsthat blackandHispanicstudentsare more likelytoattend.Across the board, toofewstudentsstartout theircollege careerbycompletingthe 30 credithours inthe first 8 www.core-principles.org 9 Complete CollegeAmerica. (2014). The Four-Year Myth. Retrieved OnlineJune 1, 2016 from http://completecollege.org/wp-content/uploads/2014/11/4-Year-Myth.pdf
  • 12. SHEEO-CCA Equity Brief - DRAFT 12 | P a g e yearthat theyneedtobe on track foran on-time degree.Evenatfour-yearresearchinstitutions,almost a full 20 percentof studentsdonotstart out on time,andthe data are worse forblack andHispanic students. It isimportantto note that the acceptedstandardfor full time is24 credits peryear,rather than30, in part due to federal financialaid parameters.Attwo-yearinstitutions,fewerthan40 percentof students whostart full time intheirfirstsemestercompleteafull-time loadintheirfirstyearandfewerthan20 percentof blackstudentscomplete 24creditsintheirfirstyear.Pairthese data withthe fact that 62 percentof blackstudentsare attendingtwo-yearinstitutionsanditisclearthat we needtodo more to encourage full-timeenrollment. The Game Changer: Set the Standard: 15 is Full Time and 30 is On Time Lookingat theirstate level dataatthe 2010 CCA Convening, representativesfromthe UniversitySystem of Hawaii were surprised tosee howfew creditsstudentswereaccumulating.Hawaii looked furtherinto theirdata and foundthat studentswhoenrolledin15 credithoursin theirfirstsemesterwere more successful onmultiple measures. Many students were notencouraged toenroll in15 credits;however these studentsassumedtheywouldgraduate ontime. The Systemmovedforwardwithapublic awarenesscampaigntitled “15to Finish”tohelpbothstudentsandadvisorsunderstandthe importance of enrollingin15 creditsa semester.Todaythe systemhasseennotonlyagrowth increditcompletion but alsoimprovedoutcomesforthe growingnumberof studentsenrollinginmore credits. There are manythingsstatescan do to define full time as15 credits persemesteror30 creditsperyear. As part of a LuminaFoundation-fundedproject,SHEEOinterviewedstaff atthe Universityof Hawaii to understandhowthe programwas implementedsuccessfully.Twokeyfindingarose fromthisinterview. First,institutionswithbandedtuitionpoliciessaw betterresultswithmore studentsattemptingand succeedingin15 credits perterm.These tuitionpoliciesessentiallymade the extracourse (credits13 – 15) free aspart of a tuitionwindow.Those institutionswithlineartuitionstructureschargingforeach credithour saw fewerpositivegains.Second,buy-infrominstitutional leadership—andmore importantly,staff—wascritical tothe successof the implementation;specifically,shiftingthe default definitionof 12 creditsequalsfull timethatalignswiththe federalPelldefinitionto15 for Hawaii’s financial aidcounselors10 . Complete CollegeAmericahasdrawnon thiswork,making “Full time is15” a key game changer, and has workedwithstates (e.g.,Utah, Nevada, KentuckyandIndiana) toimplementtheirownpublic service campaigns andidentifyotherwayspolicymakerscan reduce barriersforstudentstocomplete on time by:  Making the vastmajorityof theirdegrees60 or 120 credits  Encouragingall institutions—notjustselective ones—toadoptbandedtuitionpoliciestomake it more cost effectiveforstudentstoenroll in15 credits persemester  Making 15 credits pertermor 30 credits peryearthe defaultnumberof creditsstudentsare encouragedtoenroll in ratherthan 12 or 24 10 Carlson,Andy, Zaback,Katie. (2014) Moving the Needle: How Financial Aid Policies Can Help States Meet Student Completion Goals.SHEEO Projectwith Lumina Foundation Support.
  • 13. SHEEO-CCA Equity Brief - DRAFT 13 | P a g e  Urging statesas well asthe federal governmenttoprovide bonusesthatallow studentswiththe mostfinancial needtoenroll fulltime These policiesare yielding initial positive resultsintheirfirstyearof implementation.Between2011 and 2012, the Universityof Hawaii Systemsaw the numberof studentsattempting15or more creditsin theirfirstyearrise from 36 percentto 52 percentat four-yearinstitutions.These resultshave remained consistentacrossadditional years withpromisingimprovementsinfactorslike retention,withachange from9 percentto 11 percent.11 These dataalsoshow that underrepresentedminoritypopulations actuallyexperiencedlargergains. Figure 10. By takinga comprehensive approach Indianasaw similartrends.Inadditiontooffering15to Finish campaignresourcestocampuses,the IndianaCommissionof HigherEducation tiedstate financial aid policiesto30 credits peryear byprovidingbonusestostudentswhoenrollinorcomplete 30 credits. Afterthischange,studentsinthe O’Bannonneed-basedaidprogramcompleting30 creditsintheirfirst yearincreasedfrom51 percentto63 percent. The approach doesnothave to be “all or nothing.” Indianahasmaintained24 creditsasthe baseline foritsO’Bannonneed-basedgrantprogram, butoffers bonuspaymentsforstudentscompleting30creditsduringan academicyear. Finally,anumberof institutionsinIndianahave startedtoofferorconsiderofferingbandedtuitiontofurtherfacilitatecredit accumulation,ineffect,making15 creditsa termcost the same as 12. If we are to close the equitygapsinthe highereducationsystemwe mustcreate systemsthatput students ona path to on-time graduationthe momenttheywalkoncampus. 15 to Finishcan be 11 Retrieved May 25, 2016 at: http://15tofinish.com/wp-content/uploads/2015/07/15_to_Finish_4- Yr_Combined_Report-September_2013.pdf and http://15tofinish.com/wordpress/ftf- content/uploads/2015/07/15toFinish_Summary_Fall2014_v1.pdf
  • 14. SHEEO-CCA Equity Brief - DRAFT 14 | P a g e complementedwithotherstructural changessuchas corequisite remediationandelementsof guided pathwaysthathelpensure creditscount. Equity Challenge 4: More students are enrolled part-time and fewer part-time students succeed Studentswhoenroll fulltime are more likelytograduate than are part-time ormixedenrollment students. Studentswhoenroll fulltime completemore credits more quickly,therebydecreasingtheir time to degree andincreasingtheirlikelihoodof success.Students whoenroll full time notonlyhave a clearerpathto success,theyalsohave more access to supportservices suchasfaculty office hours,lab hours,tutoring,counseling,andpeerstudygroups. Finally,full-time enrollmentmaximizesthe returnon investmentbecause the economicbenefitsof the credentialare realizedsooner. Datafromthe National StudentClearinghouseSignature Reports,whichcantrackdata across both institutionsandstates, regularlyshowthatsix-yearcompletionratesare dramaticallyhigherforstudentswhoenroll fulltime all the time.Unfortunately,only40 percentof studentsenroll full time all the time. Data collectedfromCompleteCollegeAmericaAlliance of Statesshow thatthere are few differences withinsectorsacrossrace groups.Onaverage,a little lessthan40 percentof studentsenrolledin communitycollege are enrolledfulltime,70percentof studentsatfour-yearnon-researchinstitutions are enrolledfull time,andclose to85 percentof studentsatresearchinstitutionsare enrolledfull time. The one notable exceptionisthatAsianstudentsenrolledattwo-yearandblackstudentsatfour-year researchinstitutionsare lesslikelytobe enrolledfull time thanstudentsfromothergroups.When combinedwithenrollmentdatafromsectionone thatshows blackand Hispanicstudentsare much more likelytobe enrolledintwo-yearinstitutionsandnon-researchfour-yearinstitutionsitisclearthat to addressthe needsof these studentswe musthelpimprove outcomesforpart-time andmixed enrollmentstudents. Figure 10. 35% 68% 85% 39% 70% 78% 40% 72% 84% 41% 73% 86% 0% 50% 100% Two Year Four Year Four Year Research Percentof StudentsEnrolledFull Time A B H WA B H WA B H W
  • 15. SHEEO-CCA Equity Brief - DRAFT 15 | P a g e The Game Changer: We must provide more structure and clearer pathways for studentsnot enrolledfull time For all studentstobe successful,theyneedanexpectationandpathwayforcompletion.Institutionsand systemsinIndiana,Tennessee,andNew Yorkhave implementedstructuredschedulingwithpromising initial results. Structuredschedulingcreatesclassesofferedinablockduringa specifictime period throughouta degree program.Manyfor-profitandprivate,nonprofitinstitutionsalreadyoffercourses inthisway. The collegesof appliedtechnologyinTennessee have streamlinedthe pathtocompletionby enrollingstudentsinwholeacademicprograms, andhave managedtoattainan average completionrate of 75 percent12 .Atthe CityUniversityof New York(CUNY) StellaandCharlesGuttmanCommunity College studentsparticipateinastructured,cohort-basedprogram.Atthisinstitutionjust under30 percentthe firsttwocohorts have graduatedcomparedtojustover 6 percentfor otherCUNY institutions.13 In2015, the Texaslegislaturepassedabill requiring some healthdegreesandcareerand technical programstoimplementstructuredschedules withhopes theywill yieldsimilaroutcomes. In additiontoincreasingpredictabilityanddecreasingtimetodegree,structuredschedulingwithin degree programsallowsinstitutionstobuildcohortsof studentsworkingtowardacredential together. Providingstudentswithapeergroupas theyprogressthroughtheireducationisone of the highimpact practices measuredbythe National Surveyof StudentEngagementandshowntohave positive outcomes.These practiceshelpall students andearlyresultsindicate thattheyhelpunderserved studentpopulationsmore. Equity Challenge 5: Reaching the End Goal (Time and Credits to Degree) In 2011, Complete College Americareleaseditsreport, Timeis theEnemy, whichhighlighted evidence that studentsare takingfar toolongto graduate,and that those whodograduate have far more credits than theyneedtogettheirdegree.Studentsfromall race groups take more time andearn excess creditsthanwhat is requiredfortheirdegree orcredential. Onaverage,ittakesassociate degree studentswhoenterfull time almosttwice aslongtocomplete andalmostas longas a bachelor’sdegree requires.Forbachelor’sdegreestudents, ittakesstudentsatnon-researchfour-yearinstitutionsan extrayearto complete,andat researchinstitutions,anextrasemestertocomplete. Thoughthere are manyreasonsthat studentstake extratime,excesscreditsare likelyone culprit. Over the time takento earnthe credential,associate degree recipientsearn,onaverage,30percentmore creditsthantheyneed.Bachelor’sdegreerecipientsgraduate withanaverage of 12 percentmore creditsthantheyneed. 12 Based on calculations of data submitted in 2014 to Complete College America. 13 Brown, J. and Kurzweil,M. (20016). Student Success by Design CUNY’s Guttman Community College. Retrieved OnlineJune 28,2016 at: http://www.sr.ithaka.org/wp- content/uploads/2016/02/SR_Case_Study_Student_Success_by_Design_Guttman020416.pdf
  • 16. SHEEO-CCA Equity Brief - DRAFT 16 | P a g e Figure 11. Figure 12. These data are perhapsmostinterestingwhenlookedat throughan equitylens.Inthiscase,whatis mostinterestingisthe lackofdifference across race categories. Infact,Asianstudents are mostlikelyto geta degree butalsotendto stayin the systemthe longerandaccumulate slightlymore credits. In contrast, black students andlesslikelytograduate butforthose whodo so fasterandin manycases withfewercredits.These similaritiessuggestthat,ingeneral,studentsare capable of completingcollege withsimilaroutcomes andtheyoftendo. The Game Changer: Studentsneedto be put on direct pathways from day one We are losingfar toomany students,particularlyblackand Hispanicstudents, inaneducationpipeline that doesnotmeet theirneeds.The systemsandstructuresinourexistinghighereducation system simplydo notmeetthe needsof today’sstudent. If we wantmore studentstocomplete,theymusthave 4.3 5.1 4.8 3.8 4.8 4.4 3.9 4.9 4.5 3.9 5.1 4.5 0 2 4 6 Associates Bachelors Bachelors Research Average Time to Degree for Full Time Students 79 135 135 78 134 134 82 138 138 78 134 136 0 60 120 Associates Bachelors Bachelors Research Average Creditsto Degree for Full Time Students A B H WA B H WA B H W A B H WA B H WA B H W
  • 17. SHEEO-CCA Equity Brief - DRAFT 17 | P a g e the supporttheyneedtokeepthemenrolledandonaclear pathto graduation. We must addressequity by rethinkingandredesigninghighereducationdelivery inwaysthatwill helpclose achievementgaps that clearly exist. Studentsneedsupportstochoose the rightpathwaysandtheyneedtobe put directly on those pathways.Evenif theycannotcomplete on time,theyneedaclearexpectationabouthow much time itwill take, andwhatthey will needtodoto accomplishit. There are manyexamplesof institutions thathave implementedcomprehensive guidedpathwayssystems whichhave yielded unprecedentedresults. For example,overtenyears,FloridaState Universitywasable touse degree mapsandtechnology solutionstoimplementthosemapstoincrease graduationratesto74 percentforall students,77 percentforblack students, and70 percentforHispanicstudents.GeorgiaState hasuseddegree maps, intrusive advisingandotherstrategiestobecome the U.S.Universitythatconfersthe mostdegreesto blackstudentsandtheyhave a 57 percentgraduationrate forAfricanAmericansand66 percentfor Hispanicstudents14 .Strategieslike defaultpathways,informedchoice,meta-majors,academicmaps, milestonecourses,andintrusive advisingcanstandalone or togetherwithothergame changerslike corequisite remediation, fulltime is 15-strategies, andstructured schedules askeycomponentsof a comprehensive guidedpathwaysapproach. 14 Complete CollegeAmerica. (2012) Guided Pathways to Success:Boosting College Completion. Retrieved online May 25, 2016 at: http://www.completecollege.org/docs/GPS_Summary_FINAL.pdf
  • 18. SHEEO-CCA Equity Brief - DRAFT 18 | P a g e Conclusion The CCA datasetallowsusto examine successbyrace/ethnicitycategoryandinstitutiontype throughouteachstepof the postsecondaryeducationfromenrollmentthroughcompletion.Thislevel of detail haspreviouslynotbeenavailable andallowsustodrill downintothe “blackbox”between enrollmentandcompletion/non-completiontoreallyunderstandwhere equitygapsdeveloporgrow. Nationally,the datapresentedhere show thatateachstage of the postsecondarypipeline,blackand Hispanicstudentsare lesslikelytosucceedthantheirwhite andAsianpeers. Overthe course of the pipeline,these effectscompounduponthemselvesandbecome cumulative;the endresultof whichis that blackand Hispanicstudentsare lesslikelytoearna postsecondarycredential. If we are to addressthiscountry’sattainmentgapswe mustaddressourequitygapsat the root.We can no longeraffordtolose studentsinaneducationsystemthatdoes notmeettheirneeds.The game changerscontinue to show promisinginitial resultsinclosingequitygapsthroughoutthe postsecondary educationpipelineand inhelpingstudentscompletetheirdegree orcredential. These earlyresults in pilotstatesare positive and,asthese studentsmove forwardthroughtheircourse of study,the CCA datasetwill provide amore complete picture of the effectof these programs. It isimportantto recognize andacceptthat the earlyresultsfromstatesandinstitutionsimplementing these game changersdidnothappenovernight.Theyare the resultof intentional andcommittedaction to change howstudentsupportsare deliveredandimprove successfortheirunderservedstudent populations.Otherstatesandinstitutionscanrealize similarresultsonce theycommittoimprovingthe likelihoodof successforunderservedpopulations.