1. Carcass Characteristics of Pasture-Raised Meat Goats
Semler*, J.W. 1; Bennett, M. B. 2; Escobar, E. N. 3; Gordon, D. G. 1; Schoenian, S. G. 1; Updike, M. S. 4
1University of Maryland Extension; 2West Virginia University Extension; 3University of Maryland, Eastern Shore, Princess Anne, MD; 4University of Maryland, College Park
Materials & Methods Results
In 2009 (9) and 2010 (10) a subset of the pasture raised
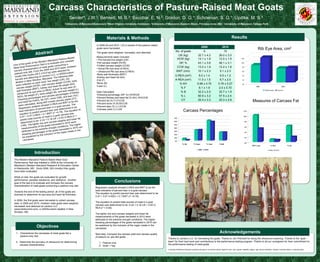
2009 2010
goats were harvested. Rib Eye Area, cm2
The goats were weighed, harvested, and deboned.
No. of goats 9 10
LW (kg) 32.7 ± 4.2 26.0 ± 3.0
Measurements taken included:
• Pre-harvest live weight (LW) HCW (kg) 14.1 ± 1.9 12.5 ± 1.9 12.0
•Hot carcass weight (HCW) DP, % 43.1 ± 3.6 48.1 ± 3.1 10.0
•Chilled carcass weight (CCW)
CCW (kg) 13.2 ± 1.9 12.2 ± 1.8 8.0
• Actual Rib eye area (A-REA)
• Ultrasound Rib eye area (U-REA) BWT (mm) 10.1 ± 2.3 5.1 ± 2.3 6.0
•Body wall thickness (BWT)
U-REA (cm2) 8.0 ± 1.4 6.5 ± 1.2 4.0
•Kidney and heart fat (KH)
•Fat (F) A-REA (cm2) 11.5 ± 1.5 6.7 ± 2.0 2.0
•Bone (B) % KH 0.98 ± 0.70 0.76 ± 0.27 0.0
•Lean (L) 2009 2010
%F 6.1 ± 1.9 2.0 ± 0.70
Ultrasound Carcass
Data Calculated: %B 32.2 ± 2.5 32.7 ± 1.9
•Dressing percentage (DP, %) HCW/LW %L 60.9 ± 3.2 57.5 ± 2.4
•Percent Kidney and heart fat (% KH) KH/CCW
•Percent fat (% F) F/CCW CY 25.4 ± 3.3 25.3 ± 2.8 Measures of Carcass Fat
•Percent bone (% B) B/CCW
•Percent lean (% L) L/CCW
•Carcass yield (Y) L/LW
Carcass Percentages 12.0
10.0
70.0
60.0 8.0
50.0
6.0
40.0
30.0
4.0
20.0
10.0 2.0
0.0
0.0
% fat % bone % lean Yield
BWT, mm % KH % fat
2009 2010 2009 2010
Introduction
The Western Maryland Pasture Based Meat Goat
Performance Test was initiated in 2006 at the University of
Maryland’s Western Maryland Research & Education Center
in Keedysville, MD. Since 2006, 263 (mostly) Kiko goats
have been evaluated.
While on test, the goats are evaluated for growth
performance, parasite resistance, and resilience. Another
goal of the test is to evaluate and compare the carcass
Conclusions
characteristics of meat goats consuming a pasture-only diet.
Regression analysis showed U-REA and BWT to be the
best indicators of percent lean in a goat carcass.
Towards the end of the testing period, all of the goats are
The equation to predict percent lean was determined to be
scanned to determine rib eye area and back fat thickness.
0.47 + 0.07 U-REA + 0.1 BWT (r2 =0.78).
In 2009, the first goats were harvested to collect carcass
The equation to predict total pounds of meat in a goat
data. In 2009 and 2010, nineteen male goats were weighed,
carcass was determined to be -0.22 + 0.18 LW + 4.93 U-
harvested, and deboned at Lambco LLC
REA (r2 = 0.69).
(www.lambcomd.com), a USDA/custom abattoir in New
Windsor, MD.
The lighter live and carcass weights and lower fat
measurements of the goats harvested in 2010 were
attributed to the extreme drought conditions. The higher
dressing percentages of the goats harvested in 2010 can
be explained by the inclusion of the organ meats in the
Objectives carcasses.
1. Characterize the carcasses of meat goats fed a Next step, Compare the carcass yield and carcass quality
Acknowledgements
pasture-only diet. of pasture vs. pen-fed goats.
Thanks to Lambco LLC. for harvesting the goats. Thanks to Jim Pritchard for doing the ultrasound scanning. Thanks to the “goat
2. Determine the accuracy of ultrasound for determining team” for their hard work and contributions to the performance testing program. Thanks to all our consigners for their commitment to
1. Pasture only
carcass characteristics. the performance testing of meat goats.
2. Grain + hay
University of Maryland Extension programs are open to all citizens without regard to race, color, gender, disability, religion, age, sexual orientation, marital or parental status, or national origin.