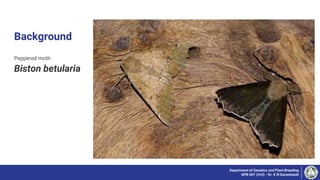
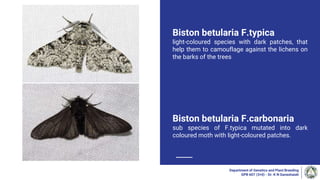
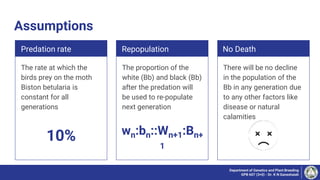
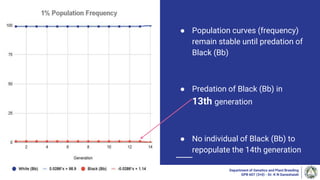
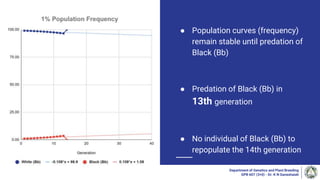
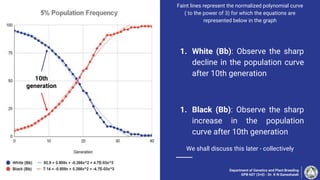
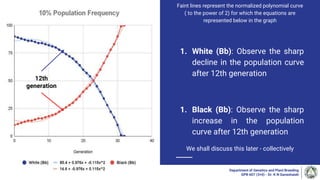
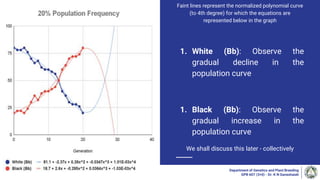
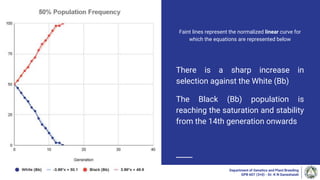
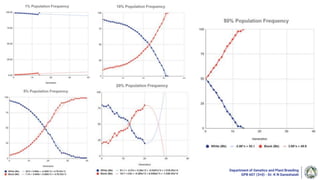
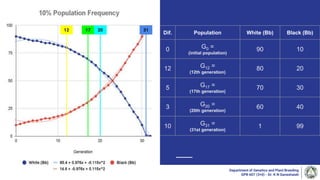
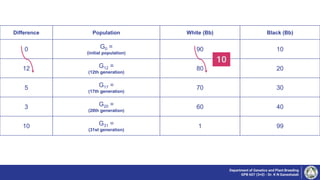
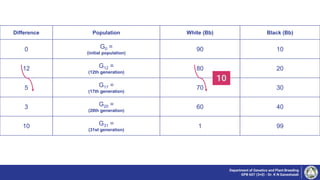
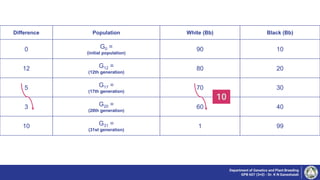
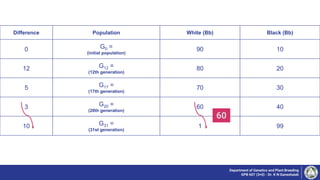
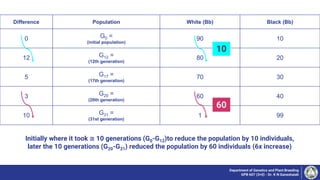
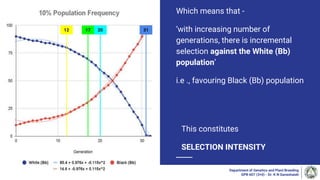
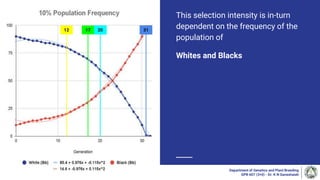
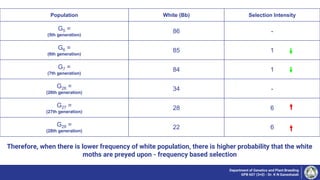
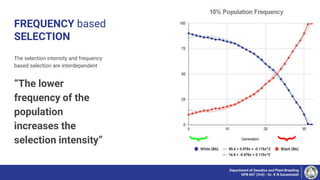
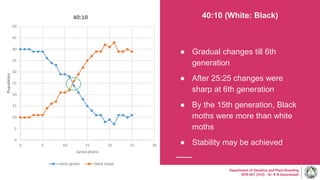
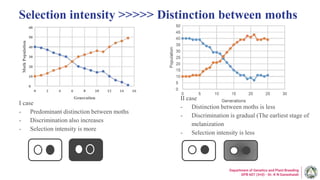
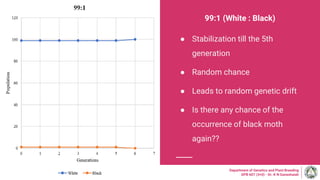
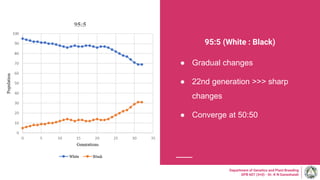
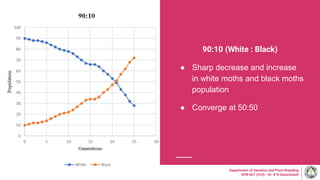
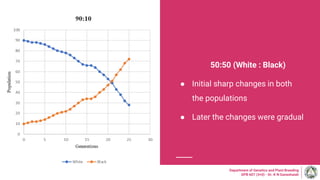
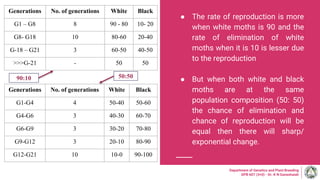
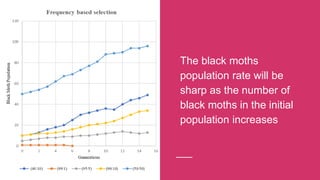
Selection intensity and frequency-based selection are two important concepts in evolutionary biology, particularly in the study of how populations change over time due to various selective pressures. These concepts help explain differences in survival and reproductive success among individuals within a population, which are key to understanding evolutionary dynamics.
population. This concept is used to quantify how much a population's genetic makeup is altered by natural selection for or against a specific trait.
High Selection Intensity: When a trait significantly increases or decreases an organism's chances of survival and reproduction, selection intensity is said to be high. This typically results in rapid changes in allele frequencies within the population, driving quick evolutionary responses.
Low Selection Intensity: Conversely, if the trait has a smaller impact on survival and reproduction, selection intensity is low, resulting in slower evolutionary changes.
Selection intensity can be affected by environmental factors, predation pressures, competition for resources, and changes in population size.
Frequency-based selection (or frequency-dependent selection) occurs when the fitness of a phenotype depends on its frequency relative to other phenotypes in the population. There are two main types:
Positive Frequency-Dependent Selection: Here, the fitness of a phenotype increases as it becomes more common. An example is the selection for common warning colors in poisonous or distasteful animals, where predators more easily recognize and avoid commonly seen patterns.
Negative Frequency-Dependent Selection: In this case, the fitness of a phenotype increases as it becomes rarer. This can help maintain genetic diversity within a population. A classic example is seen in host-parasite interactions, where rare genotypes of the host may be less likely to be recognized and targeted by parasites.
Importance in Evolutionary Biology
Both selection intensity and frequency-based selection are crucial for understanding how populations adapt to their environments and how biodiversity is maintained. Selection intensity helps explain the speed and direction of evolution, while frequency-based selection helps explain the maintenance of diverse phenotypes within populations.
Parent-offspring conflict: evolutionary biology of tension arising between pa...Brahmesh Reddy B R
Parent-offspring conflict is a concept in evolutionary biology that describes the tension arising between parents and their offspring over the allocation of resources. This conflict was first extensively discussed by Robert Trivers in 1974, building on the principles of evolutionary theory. The theory posits that while parents and their offspring share a substantial amount of genetic material, their genetic interests are not perfectly aligned, leading to conflicts of interest.
Theoretical Basis
The theory is based on the principle that both parents and offspring are driven by natural selection to maximize their own inclusive fitness. However, the ways they can maximize their fitness often conflict, especially over the distribution of resources such as food, care, and shelter.
Parents' Perspective: From a parent's standpoint, the optimal strategy typically involves distributing resources equitably among all current and future offspring to maximize the total number of surviving offspring. This means that a parent may withhold some resources from a current offspring if it increases the survival and reproductive prospects of subsequent offspring.
Offspring's Perspective: Each offspring, however, will benefit from obtaining more resources than the siblings to maximize its own survival and reproductive success. This can lead to a situation where the offspring demands more resources than the parent is willing to allocate.
Manifestations of the Conflict
1. Weaning Conflict: This is one of the most common examples of parent-offspring conflict. Offspring may seek to prolong nursing to gain more nutrients, while the mother may attempt to wean them earlier to conserve resources for future offspring or her own survival.
2. Sibling Rivalry: Sibling rivalry can be seen as an extension of parent-offspring conflict where siblings compete for parental attention and resources. Here, the conflict manifests not directly between parent and offspring but mediated through competition among siblings.
3. Reproductive Conflict: In some species, especially birds, offspring may attempt to manipulate parents into providing more care by feigning hunger or weakness. Parents need to discern genuine signals of need from manipulative ones to distribute care optimally among all offspring.
Evolutionary Consequences
Resource Allocation Strategies: Evolution shapes both parental and offspring strategies for resource allocation. Parents evolve mechanisms to detect and counteract manipulation by offspring, while offspring evolve more sophisticated strategies to extract resources.
Impact on Life History Traits: Parent-offspring conflict can influence key life history traits such as growth rates, age at independence, and reproductive strategy. For example, faster growth can be an adaptive strategy for offspring in response to parental underinvestment.
Domestication is a form of artificial selection where humans selectively breed plants and animals for specific traits that are advantageous for agriculture, companionship, work, or other purposes. This process has profound effects on the species being domesticated, often resulting in genetic, morphological, physiological, and behavioral changes. Here's an overview of the effects of domestication in the course of evolution:
Genetic Diversity
Reduction in Genetic Diversity: Domestication typically involves selecting a few individuals with desirable traits to breed the next generation. This selective breeding can reduce genetic diversity because it often excludes a large portion of the population from reproducing. Reduced genetic diversity can make domesticated species more susceptible to diseases and reduce their ability to adapt to changing environmental conditions.
Founder Effect: Many domesticated species originated from a relatively small ancestral population, which can lead to a pronounced founder effect. This effect occurs when a new population (in this case, domesticated species) is established from a small number of individuals, carrying only a fraction of the genetic diversity of the original population.
Morphological Changes
Size and Shape: Domestication often leads to changes in the size and shape of animals and plants. For example, domesticated animals tend to be larger or smaller than their wild counterparts, depending on the use intended by humans. Similarly, domesticated plants often have larger fruit or seeds than their wild relatives.
Neotenization: Domesticated animals often exhibit juvenile characteristics into adulthood, a process known as neotenization. This can include changes such as floppy ears, smaller jaws, and more docile behavior compared to their wild ancestors.
Physiological Changes
Reproductive Changes: Domesticated species often have higher reproductive rates compared to their wild counterparts. For instance, domesticated animals may breed more frequently or produce more offspring per breeding season. In plants, domestication can lead to a loss of natural seed dispersal mechanisms and an increase in seed yield.
Growth Rates: Enhanced growth rates are common in domesticated species, especially in animals bred for meat production, such as chickens and cattle, and in plants with selected traits for increased biomass or yield.
Auxin signal perception begins when auxin molecules bind to their receptor. The primary receptor for auxin is Transport Inhibitor Response 1 (TIR1), which is part of the SCF (SKP1, CUL1, F-box protein) complex, functioning as an E3 ubiquitin ligase. This receptor-ligand interaction is crucial for initiating the auxin response pathway.
Auxin Signal Transduction
Once auxin is bound to TIR1, the signal transduction pathway follows several steps:
Degradation of Aux/IAA Proteins: Auxin binding enhances the affinity of TIR1 for Aux/IAA proteins, which are repressors of auxin-responsive transcription factors called ARFs (Auxin Response Factors). The binding of auxin facilitates the ubiquitination of Aux/IAA proteins by the SCF complex, leading to their degradation via the 26S proteasome.
Activation of ARFs: With the degradation of Aux/IAA proteins, ARFs are released from repression. These transcription factors can then bind to auxin response elements (AuxREs) in the promoters of auxin-responsive genes, activating or repressing their expression.
Gene Expression Changes: The activation or repression of ARFs leads to changes in the expression of numerous genes involved in cell growth, division, and differentiation, as well as other physiological processes. This results in the various developmental and growth responses associated with auxin.
Feedback Regulation: The auxin signaling pathway includes mechanisms for feedback regulation to modulate the sensitivity of the response. For instance, some of the genes activated by ARFs encode Aux/IAA proteins, thus providing a negative feedback loop that adjusts the response to auxin.
CO2 diffusion & concentration: aspects of stomatal conductance and intercellu...Brahmesh Reddy B R
Carbon dioxide (CO2) diffusion and concentration are fundamental aspects of plant physiology, directly influencing photosynthesis, the process by which plants convert light energy into chemical energy. The efficiency of this process affects plant growth, productivity, and carbon cycling in ecosystems.
CO2 moves into the plant primarily through structures called stomata, which are tiny openings usually found on the underside of leaves. The opening and closing of these stomata are regulated by the plant in response to various environmental signals such as light, CO2 concentration, and water availability. Once inside the leaf, CO2 diffuses from the air spaces within the leaf to the site of photosynthesis in the chloroplasts of mesophyll cells.
Within the leaf, the concentration of CO2 is influenced by several factors:
Stomatal conductance: The degree to which stomata allow gas exchange; it controls how much CO2 enters the leaf.
Photosynthetic rate: The rate at which CO2 is consumed in photosynthesis. High rates of photosynthesis can lower internal CO2 concentrations, increasing CO2 diffusion from the atmosphere into the leaf.
Respiration: Plant cells respire, releasing CO2, which can then be reused for photosynthesis or diffuse out of the leaf.
Boundary layer resistance: A thin layer of still air hugging the leaf surface that can impede CO2 diffusion into the stomata.
Internal CO2 Concentration (Ci):
This is the concentration of CO2 within the leaf, which is a dynamic balance between CO2 diffusion into the leaf and its consumption during photosynthesis. The internal CO2 concentration is crucial for understanding photosynthetic efficiency and water use efficiency of plants.
G-protein coupled receptors and crucial roles in cellular signalingBrahmesh Reddy B R
In plants, GPCRs have not been as clearly defined or classified as in animals, partly due to their structural and functional diversity. However, several plant proteins with homology to animal GPCRs have been identified and are implicated in important biological processes. These include the perception of light, hormones, sugars, and other external stimuli.
One well-studied example in plants is the GCR1 (G-protein Coupled Receptor 1). Although its specific ligands and complete range of functions are still under investigation, GCR1 is linked with several signaling pathways that regulate development and responses to environmental changes. Plant GPCRs typically activate a heterotrimeric G protein, leading to a cascade of downstream signals that result in physiological and developmental changes.
Another example includes potential GPCRs involved in abscisic acid (ABA) signaling, which plays a pivotal role in response to stress and developmental processes. These receptors are crucial for plants to cope with adverse conditions such as drought and salinity.
Heat Units in plant physiology and the importance of Growing Degree daysBrahmesh Reddy B R
Heat units, also known as growing degree days (GDD), are a crucial concept in plant physiology and agricultural science, providing a measure of heat accumulation used to predict plant development rates and stages. This measure is particularly useful in understanding and forecasting the growth phases of plants, such as flowering, fruiting, and maturity, which are temperature-dependent.
Key points on the importance of heat units in plant physiology include:
Predicting Phenological Events: Heat units help predict significant events in a plant’s life cycle, such as germination, flowering, and harvest times. This is vital for farmers and gardeners to optimize planting schedules and manage crop cycles efficiently.
Agricultural Planning: By calculating GDDs, agriculturists can decide the best times for planting, irrigating, applying fertilizers, and controlling pests. This can lead to better crop yields and improved management of resources.
Varietal Selection: Different plant varieties have specific heat unit requirements. Understanding these requirements helps in selecting the right varieties for a particular climatic zone, thus maximizing productivity and sustainability.
Climate Change Adaptation: Monitoring heat units over time can provide insights into shifting climate patterns and help in developing strategies to adapt agricultural practices to changing environmental conditions.
Research and Breeding: In plant breeding, heat unit data can help in developing varieties with desired traits such as drought tolerance or shortened growing periods, which are particularly valuable in regions facing climatic stresses.
Isoelectric Focusing for high resolution separation of proteinsBrahmesh Reddy B R
The development of the technique of isoelectric focusing (IEF) represents a major advance in the field of high-resolution separations of proteins and other amphoteric macromolecules. IEF is an equilibrium method in which amphoteric molecules are segregated according to their isoelectric points (pl) in pH gradients. The pH gradients are formed by electrolysis of amphoteric buffer substances known as carrier ampholytes. When introduced into this system, other amphoteric molecules such as proteins migrate to pH zones that correspond to their respective pls where their net charge is zero. By counteracting back-diffusion with an appropriate electrical field the separated molecules can be concentrated into extremely sharp bands. The technique has now been refined to a level that permits the resolution of molecules whose pls differ by as little as 0.005 pH unit or less. This degree of resolution cannot normally be obtained by conventional electrophoretic or chromatographic procedures. In these latter procedures, specially adjusted conditions have to be devised for particular separations. While in contrast, IEF, by virtue of being an equilibrium method has a “built-in” resolution which usually allows one to separate in only one or two experiments all components with measurably different pl values. Further. because it is an equilibrium method, the system is self-correcting and therefore considerably less demanding in terms of experimental technique. IEF is particularly suitable for differentiating closely related molecules and provides a valuable criterion of homogeneity.
This presentation briefly describes the methods by which stem reserve mobilization occurs with some case studies proving the occurrence of stem reserve mobilization. Also trying to explain the mechanism
an insight into the stem cutting propagation in the chickpea crop
-why stem cutting in chickpea
-technique of stem cutting in chickpea
-case study of stem cutting propagation in chickpea
cultivation practices in Potato, true potato seed (TPS)and its commercial usageBrahmesh Reddy B R
the presentation gives in brief idea and in depth information on cultivation practices in the horticultural crop of potato and its production through true potato seed technique. the physiological disorders in potato and irradiation in potato are also been explained
the presentation is a brief information on the different post harvest practices practiced commonly in lndia and the presentation is generalized to the context of the world
Micro RNA genes and their likely influence in rice (Oryza sativa L.) dynamic ...Open Access Research Paper
Micro RNAs (miRNAs) are small non-coding RNAs molecules having approximately 18-25 nucleotides, they are present in both plants and animals genomes. MiRNAs have diverse spatial expression patterns and regulate various developmental metabolisms, stress responses and other physiological processes. The dynamic gene expression playing major roles in phenotypic differences in organisms are believed to be controlled by miRNAs. Mutations in regions of regulatory factors, such as miRNA genes or transcription factors (TF) necessitated by dynamic environmental factors or pathogen infections, have tremendous effects on structure and expression of genes. The resultant novel gene products presents potential explanations for constant evolving desirable traits that have long been bred using conventional means, biotechnology or genetic engineering. Rice grain quality, yield, disease tolerance, climate-resilience and palatability properties are not exceptional to miRN Asmutations effects. There are new insights courtesy of high-throughput sequencing and improved proteomic techniques that organisms’ complexity and adaptations are highly contributed by miRNAs containing regulatory networks. This article aims to expound on how rice miRNAs could be driving evolution of traits and highlight the latest miRNA research progress. Moreover, the review accentuates miRNAs grey areas to be addressed and gives recommendations for further studies.
@@how to Join @occult for money ritual..☎️+2349022657119.RoyaleEaglepriest
Dues are only a small part of what it takes to show us you are committed. If we are to share in the Brotherhood’s honors and rewards, we must each have a stake. You will find the amount to be much less than what many private clubs charge but the benefits gained are much greater. You can benefit physically, spiritually, mentally and materially. Members can progress more in 30 days in the Brotherhood than they would in 10 years elsewhere How long will it take for me to become rich and powerful? royal eagles Brotherhood is about more than just wealth and power, as anyone who observes the often tragic lives of the rich and famous can attest to. Without true wisdom and inner power, the outer trappings of success are all in vain, for spirit is ascendant over matter. That which is eternal is of far greater value than that which turns to dust. royal eagles Brotherhood’s teachings are not aimed merely towards self-aggrandizement but for the greater happiness of the Member and so that they, in turn, may bless and help others upon the path of life.
Natural farming @ Dr. Siddhartha S. Jena.pptxsidjena70
A brief about organic farming/ Natural farming/ Zero budget natural farming/ Subash Palekar Natural farming which keeps us and environment safe and healthy. Next gen Agricultural practices of chemical free farming.
Diabetes is a rapidly and serious health problem in Pakistan. This chronic condition is associated with serious long-term complications, including higher risk of heart disease and stroke. Aggressive treatment of hypertension and hyperlipideamia can result in a substantial reduction in cardiovascular events in patients with diabetes 1. Consequently pharmacist-led diabetes cardiovascular risk (DCVR) clinics have been established in both primary and secondary care sites in NHS Lothian during the past five years. An audit of the pharmaceutical care delivery at the clinics was conducted in order to evaluate practice and to standardize the pharmacists’ documentation of outcomes. Pharmaceutical care issues (PCI) and patient details were collected both prospectively and retrospectively from three DCVR clinics. The PCI`s were categorized according to a triangularised system consisting of multiple categories. These were ‘checks’, ‘changes’ (‘change in drug therapy process’ and ‘change in drug therapy’), ‘drug therapy problems’ and ‘quality assurance descriptors’ (‘timer perspective’ and ‘degree of change’). A verified medication assessment tool (MAT) for patients with chronic cardiovascular disease was applied to the patients from one of the clinics. The tool was used to quantify PCI`s and pharmacist actions that were centered on implementing or enforcing clinical guideline standards. A database was developed to be used as an assessment tool and to standardize the documentation of achievement of outcomes. Feedback on the audit of the pharmaceutical care delivery and the database was received from the DCVR clinic pharmacist at a focus group meeting.
Characterization and the Kinetics of drying at the drying oven and with micro...Open Access Research Paper
The objective of this work is to contribute to valorization de Nephelium lappaceum by the characterization of kinetics of drying of seeds of Nephelium lappaceum. The seeds were dehydrated until a constant mass respectively in a drying oven and a microwawe oven. The temperatures and the powers of drying are respectively: 50, 60 and 70°C and 140, 280 and 420 W. The results show that the curves of drying of seeds of Nephelium lappaceum do not present a phase of constant kinetics. The coefficients of diffusion vary between 2.09.10-8 to 2.98. 10-8m-2/s in the interval of 50°C at 70°C and between 4.83×10-07 at 9.04×10-07 m-8/s for the powers going of 140 W with 420 W the relation between Arrhenius and a value of energy of activation of 16.49 kJ. mol-1 expressed the effect of the temperature on effective diffusivity.
Genetic diversity and association analysis for different morphological traits...Open Access Research Paper
Capsicum annuum L. is the extensively cultivated species of peppers (chilies) in all over the world. Its fruits are used for spiciness (capsaicin) and color (capsanthin) in our daily foods. Pakistan is the leading chili consuming country. Genetic divergence among 25 accessions (local and exotic) collected from Ayub Agriculture Research Institute (AARI) Faisalabad, Pakistanwas estimated from the data collected during the year 2014 in the Department of Plant Breeding and Genetics, University of Agriculture Faisalabad, Pakistan for different morphological and growth parameters viz fruit width, fruit length, peduncle length, number of primary branches, inter nodal length, plant height, seed index, 1000 seed weight, fresh and dry fruit weight, pericarp thickness, leaf area and seeds per fruit. Based on this characterization the plants were grouped into 5 clusters and diversity among accessions was indicated by the wide range of D2 values whereas phenotypic correlation for all the characters was found significant. Five components were selected as principle components with Eigen values > 1. These components exhibited 77.2% of the variation. The first principal component (PC I) explained 27.2% of total variation in original data, second component (PC II) explained 18.9%, and third principal component (PC III) explained 12.5% of variation. The other principal components (PC IV and PC V explained an additional 18.6% of the variation (a total 77.2% of explained variation. Accessions with distinct identity were marked, which are likely to be quite suitable for breeding through hybridization by combining desirable traits. High estimates of broad sense heritability (90%) for all the characters except peduncle length predicted that selection could be awarding in late segregating generations and above accessions could be utilized in hybridization programme for C. annuum crop improvement.
Use of Raffias’ species (Raphia spp.) and its impact on socioeconomic charact...Open Access Research Paper
Raffias’ species are used in handcrafts, constructions, food processing etc. But in Benin, any quantitative ethnobotanical study was not evaluated for their use and socioeconomic impact of uses on average income. This study investigated the importance of use of raffias’ species and the impact of socioeconomic characteristics of informants on the household income. Ethnobotany quantitative approach was used and data on use, products prices and the quantity sold were collected using a semi-structured questionnaire administered during an interview. The result showed that raffias’ species in Benin are used principally for craft (CI = 1.41 for R. hookeri and 1.68 for R. sudanica), but R. hookeri was most important for people in Guinean zone than those in soudanian and soudano-guinean zones. The frequently uses were the beds, mats, baskets and roofs. The most part of the plant used is the rachis for both species and the less used is the nut. Education level, gender and main activities were socioeconomic variable which influenced the annual income from exploitation of raffias species. The uneducated, men and farmers took more income from raffias’ species than others. Also, the development level of areas where the species are found, influence the income from their exploitations. To evaluate better the contribution of raffias’ species to regional and national gross product, it will be necessary to study the value chain of the main products, but also take into account the informant categories defined in this study regarding operators.
5. Biston betularia F.typica
light-coloured species with dark patches, that
help them to camouflage against the lichens on
the barks of the trees
Biston betularia F.carbonaria
sub species of F.typica mutated into dark
coloured moth with light-coloured patches.
Department of Genetics and Plant Breeding
GPB 607 (3+0) - Dr. K N Ganeshaiah
6. The proportion of the
white (Bb) and black (Bb)
after the predation will
be used to re-populate
next generation
Assumptions
Predation rate
The rate at which the
birds prey on the moth
Biston betularia is
constant for all
generations
Repopulation No Death
There will be no decline
in the population of the
Bb in any generation due
to any other factors like
disease or natural
calamities
10% wn:bn::Wn+1:Bn+
1
Department of Genetics and Plant Breeding
GPB 607 (3+0) - Dr. K N Ganeshaiah
7. BIRD ‘A’
Results of demonstration / experiment conducted by group A
Department of Genetics and Plant Breeding
GPB 607 (3+0) - Dr. K N Ganeshaiah
8. Study - 1% Frequency
How selection against white (Bb)
increased black (Bb) proportion
Department of Genetics and Plant Breeding
GPB 607 (3+0) - Dr. K N Ganeshaiah
9. ● Population curves (frequency)
remain stable until predation of
Black (Bb)
● Predation of Black (Bb) in
13th generation
● No individual of Black (Bb) to
repopulate the 14th generation
Department of Genetics and Plant Breeding
GPB 607 (3+0) - Dr. K N Ganeshaiah
10. ● Population curves (frequency)
remain stable until predation of
Black (Bb)
● Predation of Black (Bb) in
13th generation
● No individual of Black (Bb) to
repopulate the 14th generation
Department of Genetics and Plant Breeding
GPB 607 (3+0) - Dr. K N Ganeshaiah
11. Study - 5%Frequency
How selection against white (Bb)
increased black (Bb) proportion
Department of Genetics and Plant Breeding
GPB 607 (3+0) - Dr. K N Ganeshaiah
12. Department of Genetics and Plant Breeding
GPB 607 (3+0) - Dr. K N Ganeshaiah
Faint lines represent the normalized polynomial curve
( to the power of 3) for which the equations are
represented below in the graph
1. White (Bb): Observe the sharp
decline in the population curve
after 10th generation
1. Black (Bb): Observe the sharp
increase in the population
curve after 10th generation
We shall discuss this later - collectively
10th
generation
13. Study - 10% Frequency
How selection against white (Bb)
increased black (Bb) proportion
Department of Genetics and Plant Breeding
GPB 607 (3+0) - Dr. K N Ganeshaiah
14. Department of Genetics and Plant Breeding
GPB 607 (3+0) - Dr. K N Ganeshaiah
Faint lines represent the normalized polynomial curve
( to the power of 2) for which the equations are
represented below in the graph
1. White (Bb): Observe the sharp
decline in the population curve
after 12th generation
1. Black (Bb): Observe the sharp
increase in the population
curve after 12th generation
We shall discuss this later - collectively
12th
generation
15. Study - 20% Frequency
How selection against white (Bb)
increased black (Bb) proportion
Department of Genetics and Plant Breeding
GPB 607 (3+0) - Dr. K N Ganeshaiah
16. Faint lines represent the normalized polynomial curve
(to 4th degree) for which the equations are
represented below in the graph
1. White (Bb): Observe the
gradual decline in the
population curve
1. Black (Bb): Observe the
gradual increase in the
population curve
We shall discuss this later - collectively
Department of Genetics and Plant Breeding
GPB 607 (3+0) - Dr. K N Ganeshaiah
17. Study - 50% Frequency
How selection against white (Bb)
increased black (Bb) proportion
Department of Genetics and Plant Breeding
GPB 607 (3+0) - Dr. K N Ganeshaiah
18. Department of Genetics and Plant Breeding
GPB 607 (3+0) - Dr. K N Ganeshaiah
Faint lines represent the normalized linear curve for
which the equations are represented below
There is a sharp increase in
selection against the White (Bb)
The Black (Bb) population is
reaching the saturation and stability
from the 14th generation onwards
20. Collective discussion
Department of Genetics and Plant Breeding
GPB 607 (3+0) - Dr. K N Ganeshaiah
Trying to explain
SELECTION INTENSITY and
FREQUENCY based SELECTION
21. Department of Genetics and Plant Breeding
GPB 607 (3+0) - Dr. K N Ganeshaiah
12
Dif. Population White (Bb) Black (Bb)
0 G0 =
(initial population)
90 10
12 G12 =
(12th generation)
80 20
5 G17 =
(17th generation)
70 30
3 G20 =
(20th generation)
60 40
10 G31 =
(31st generation)
1 99
17 20 31
22. Difference Population White (Bb) Black (Bb)
0 G0 =
(initial population)
90 10
12 G12 =
(12th generation)
80 20
5 G17 =
(17th generation)
70 30
3 G20 =
(20th generation)
60 40
10 G31 =
(31st generation)
1 99
Department of Genetics and Plant Breeding
GPB 607 (3+0) - Dr. K N Ganeshaiah
10
23. Difference Population White (Bb) Black (Bb)
0 G0 =
(initial population)
90 10
12 G12 =
(12th generation)
80 20
5 G17 =
(17th generation)
70 30
3 G20 =
(20th generation)
60 40
10 G31 =
(31st generation)
1 99
Department of Genetics and Plant Breeding
GPB 607 (3+0) - Dr. K N Ganeshaiah
10
24. Difference Population White (Bb) Black (Bb)
0 G0 =
(initial population)
90 10
12 G12 =
(12th generation)
80 20
5 G17 =
(17th generation)
70 30
3 G20 =
(20th generation)
60 40
10 G31 =
(31st generation)
1 99
Department of Genetics and Plant Breeding
GPB 607 (3+0) - Dr. K N Ganeshaiah
10
25. Difference Population White (Bb) Black (Bb)
0 G0 =
(initial population)
90 10
12 G12 =
(12th generation)
80 20
5 G17 =
(17th generation)
70 30
3 G20 =
(20th generation)
60 40
10 G31 =
(31st generation)
1 99
Department of Genetics and Plant Breeding
GPB 607 (3+0) - Dr. K N Ganeshaiah
60
26. Difference Population White (Bb) Black (Bb)
0 G0 =
(initial population)
90 10
12 G12 =
(12th generation)
80 20
5 G17 =
(17th generation)
70 30
3 G20 =
(20th generation)
60 40
10 G31 =
(31st generation)
1 99
Department of Genetics and Plant Breeding
GPB 607 (3+0) - Dr. K N Ganeshaiah
60
10
Initially where it took ≅ 10 generations (G0-G12)to reduce the population by 10 individuals,
later the 10 generations (G20-G31) reduced the population by 60 individuals (6x increase)
27. Which means that -
‘with increasing number of
generations, there is incremental
selection against the White (Bb)
population’
i.e ., favouring Black (Bb) population
Department of Genetics and Plant Breeding
GPB 607 (3+0) - Dr. K N Ganeshaiah
12 17 20 31
This constitutes
SELECTION INTENSITY
28. This selection intensity is in-turn
dependent on the frequency of the
population of
Whites and Blacks
Department of Genetics and Plant Breeding
GPB 607 (3+0) - Dr. K N Ganeshaiah
12 17 20 31
29. Population White (Bb) Selection Intensity
G5 =
(5th generation)
86 -
G6 =
(6th generation)
85 1
G7 =
(7th generation)
84 1
G26 =
(26th generation)
34 -
G27 =
(27th generation)
28 6
G28 =
(28th generation)
22 6
Department of Genetics and Plant Breeding
GPB 607 (3+0) - Dr. K N Ganeshaiah
Therefore, when there is lower frequency of white population, there is higher probability that the white
moths are preyed upon - frequency based selection
30. FREQUENCY based
SELECTION
{
The selection intensity and frequency
based selection are interdependent
“The lower
frequency of the
population
increases the
selection intensity”
{
Department of Genetics and Plant Breeding
GPB 607 (3+0) - Dr. K N Ganeshaiah
31. BIRD ‘B’
Results of demonstration / experiment conducted by group B
Department of Genetics and Plant Breeding
GPB 607 (3+0) - Dr. K N Ganeshaiah
32. 20% Population frequency
10% Selection intensity
Department of Genetics and Plant Breeding
GPB 607 (3+0) - Dr. K N Ganeshaiah
40 (White):10 (Black)
I case
White – Chickpea
Black - Horsegram
II case
White – Chickpea
Black - Soybean
33. 40:10 (White: Black)
● Gradual changes till 6th
generation
● After 25:25 changes were
sharp at 6th generation
● By the 15th generation, Black
moths were more than white
moths
● Stability may be achieved
Department of Genetics and Plant Breeding
GPB 607 (3+0) - Dr. K N Ganeshaiah
34. Selection intensity >>>>> Distinction between moths
I case
- Predominant distinction between moths
- Discrimination also increases
- Selection intensity is more
II case
- Distinction between moths is less
- Discrimination is gradual (The earliest stage of
melanization
- Selection intensity is less
Department of Genetics and Plant Breeding
GPB 607 (3+0) - Dr. K N Ganeshaiah
35. Study - 1% Frequency
99 (White):1 (Black)
Department of Genetics and Plant Breeding
GPB 607 (3+0) - Dr. K N Ganeshaiah
36. 99:1 (White : Black)
● Stabilization till the 5th
generation
● Random chance
● Leads to random genetic drift
● Is there any chance of the
occurrence of black moth
again??
Department of Genetics and Plant Breeding
GPB 607 (3+0) - Dr. K N Ganeshaiah
37. Study - 5% Frequency
95 (White):5 (Black)
Department of Genetics and Plant Breeding
GPB 607 (3+0) - Dr. K N Ganeshaiah
38. 95:5 (White : Black)
● Gradual changes
● 22nd generation >>> sharp
changes
● Converge at 50:50
Department of Genetics and Plant Breeding
GPB 607 (3+0) - Dr. K N Ganeshaiah
39. Study - 10% Frequency
90 (White):10 (Black)
Department of Genetics and Plant Breeding
GPB 607 (3+0) - Dr. K N Ganeshaiah
40. 90:10 (White : Black)
● Sharp decrease and increase
in white moths and black moths
population
● Converge at 50:50
Department of Genetics and Plant Breeding
GPB 607 (3+0) - Dr. K N Ganeshaiah
41. Study - 50% Frequency
50(White):50 (Black)
Department of Genetics and Plant Breeding
GPB 607 (3+0) - Dr. K N Ganeshaiah
42. 50:50 (White : Black)
● Initial sharp changes in both
the populations
● Later the changes were gradual
Department of Genetics and Plant Breeding
GPB 607 (3+0) - Dr. K N Ganeshaiah
43. ● The rate of reproduction is more
when white moths is 90 and the
rate of elimination of white
moths when it is 10 is lesser due
to the reproduction
● But when both white and black
moths are at the same
population composition (50: 50)
the chance of elimination and
chance of reproduction will be
equal then there will sharp/
exponential change.
Department of Genetics and Plant Breeding
GPB 607 (3+0) - Dr. K N Ganeshaiah
Generations No. of generations White Black
G1 – G8 8 90 - 80 10- 20
G8- G18 10 80-60 20-40
G-18 – G21 3 60-50 40-50
>>>G-21 - 50 50
Generations No. of generations White Black
G1-G4 4 50-40 50-60
G4-G6 3 40-30 60-70
G6-G9 3 30-20 70-80
G9-G12 3 20-10 80-90
G12-G21 10 10-0 90-100
90:10 50:50
44. The black moths
population rate will be
sharp as the number of
black moths in the initial
population increases
45. THANK YOU
Department of Genetics and Plant Breeding
GPB 607 (3+0) - Dr. K N Ganeshaiah
Brahmesh Reddy B R
Aishwarya G
Sinchana K
PhD Scholars
UAS,GKVK, Bangalore