Selected graphs from the etui's European Works Councils database, June 2015
•
0 likes•271 views

Data source: ETUI, Europea Works Councils database, June 2015 This set of graphics shows a number of basic statistics in European Works Councils: number of EWC bodies created and disappeared per year, involvement of employees or observers from new EU memberstates and applicant countries, EWCs active by sector, by country of headquarters, etc. other language versions and more info on EWCs: http://www.ewcdb.eu/statistics_graphs.php

Recommended
Recommended
More Related Content
What's hot
Viewers also liked
Similar to Selected graphs from the etui's European Works Councils database, June 2015
Similar to Selected graphs from the etui's European Works Councils database, June 2015 (20)
Recently uploaded
Recently uploaded (20)
Selected graphs from the etui's European Works Councils database, June 2015
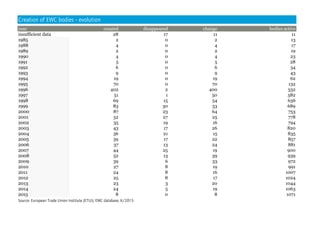
- 1. year created disappeared change bodies active insufficient data 28 17 11 11 1985 2 0 2 13 1988 4 0 4 17 1989 2 0 2 19 1990 4 0 4 23 1991 5 0 5 28 1992 6 0 6 34 1993 9 0 9 43 1994 19 0 19 62 1995 70 0 70 132 1996 402 2 400 532 1997 51 1 50 582 1998 69 15 54 636 1999 83 30 53 689 2000 87 23 64 753 2001 52 27 25 778 2002 35 19 16 794 2003 43 17 26 820 2004 36 21 15 835 2005 39 17 22 857 2006 37 13 24 881 2007 44 25 19 900 2008 52 13 39 939 2009 39 6 33 972 2010 27 8 19 991 2011 24 8 16 1007 2012 25 8 17 1024 2013 23 3 20 1044 2014 24 5 19 1063 2015 8 0 8 1071 Source: European Trade Union Institute (ETUI), EWC database, 6/2015 Creation of EWC bodies - evolution FR DE NL ES IT PL
- 2. Total EWC bodies currently active 1071 281 77 10 35 Source: European Trade Union Institute (ETUI), EWC database, 6/2015 Active EWC bodies and involvement of employees or observers from new EU member states and applicant countries EWCs including one or more representatives from a new EU member state (2004) EWCs including one or more representatives from a new EU member state (2007: BG, RO) EWCs including one or more representatives from EU applicant countries (ME, MK,RS, TR) EWCs including one or more representatives from a new EU member state (2013: HR)
- 3. Source: European Trade Union Institute (ETUI), EWC database, 6/2015 EWC bodies currently active, by sector of activity 0 50 100 150 200 250 300 350 400 450 Building & Woodwork Chemicals Food, HORECA, Agriculture Metal Services commerce Services finance Graphical & Packaging IT & Services Other services Public services Textile Transport Other EWC SE WC
- 4. Source: European Trade Union Institute (ETUI), EWC database, 6/2015 EWC bodies currently active, by country of headquarters 0 20 40 60 80 100 120 140 160 180 200 220 240 Greece Portugal Czechrepublic Poland Slovenia Cyprus Hungary Luxembourg&Liechtenstein Ireland Spain Austria Norway Denmark Belgium Finland Italy Netherlands Sweden UnitedKingdom France Germany SouthAfrica Australia Canada other Japan Switzerland UnitedStates EWC SE WC
- 5. EWC SE WC Source: European Trade Union Institute (ETUI), EWC database, 6/2015 EWC bodies currently active, by category of employment in EEA 97 359 159 357 employment unknown or insufficient data small companies (< 5000 employees in EEA) medium companies (between 5000 and 10000 employees in EEA) large companies (more than 10000 employees in EEA) 47 32 9 11
- 6. EWC SEWC Source: European Trade Union Institute (ETUI), EWC database, 6/2015 EWC bodies currently active, by category of internationalisation (number of EEA countries in which the companies have operations) 46 151 255 520 insufficient data less than 5 countries between 5 and 10 countries more than 10 countries 12 40 27 20
- 7. Source: European Trade Union Institute (ETUI), EWC database, 6/2015 EWC bodies currently active, by installation type 358 52 534 5 10 3 96 13 art.13EWC art.3EWC(UK-IE basedpre-direct.) art.6EWC typetobespecified information& consultation procedure SEinformation& consultation procedure SEWC subsidiary requirements
- 8. Source: European Trade Union Institute (ETUI), EWC database, 6/2015 EWC bodies, by country of headquarters 1 1 1 1 1 1 1 5 6 14 21 22 27 40 41 41 57 72 111 118 134 2 4 6 11 25 45 163 Greece Portugal Cyprus Czechrepublic Hungary Poland Slovenia Luxembourg&… Ireland Spain Austria Norway Denmark Belgium Finland Italy Netherlands Sweden UnitedKingdom France Germany SouthAfrica Australia Canada other Japan Switzerland UnitedStates disappeared bodies active
- 9. Source: European Trade Union Institute (ETUI), EWC database, 6/2015 SE WC bodies, by country of headquarters 1 1 1 1 1 2 2 2 9 78 1 Ireland Sweden Cyprus Hungary Luxembourg&Liechtenstein Austria Netherlands UnitedKingdom France Germany Japan disappeared bodies active