

Recommended
Recommended
More Related Content
Recently uploaded
Recently uploaded (20)
Featured
Featured (20)
Seadrill technical analysis charts
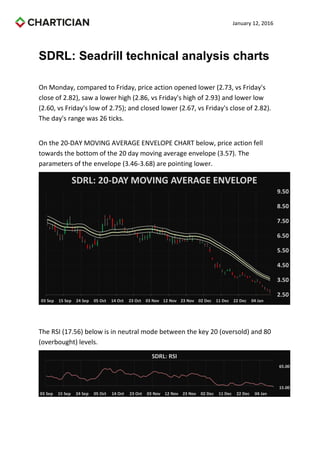
- 1. January 12, 2016 SDRL: Seadrill technical analysis charts On Monday, compared to Friday, price action opened lower (2.73, vs Friday's close of 2.82), saw a lower high (2.86, vs Friday's high of 2.93) and lower low (2.60, vs Friday's low of 2.75); and closed lower (2.67, vs Friday's close of 2.82). The day's range was 26 ticks. On the 20-DAY MOVING AVERAGE ENVELOPE CHART below, price action fell towards the bottom of the 20 day moving average envelope (3.57). The parameters of the envelope (3.46-3.68) are pointing lower. The RSI (17.56) below is in neutral mode between the key 20 (oversold) and 80 (overbought) levels.
- 2. January 12, 2016 The MACD 12 day moving average is above the MACD 26 day moving average; both are above zero and falling. The Slow Stochastics, below, are in negative mode, with the K line below the D line. The Commodity Channel Index (-163.53), below, is in positive mode above the oversold -200 level. On the DAILY BOLLINGER BANDS CHART below, Monday represents the 1st consecutive close below the bottom Bollinger Band (2.68). The Bollinger Bands (2.68-4.46) are pointing lower; and widened from a width of 171 ticks on Friday to a width of 178 ticks on Monday.
- 3. January 12, 2016 On the 5 AND 20 DAY MOVING AVERAGES CHART below, the 5 day moving average (2.93, moving down) is below the 20 day moving average (3.57, moving down); in negative mode. The 3-50 day strip of moving averages ranges from the 3 day moving average (2.79) at the bottom of the range to the 50 day moving average (5.09) at the top of the range. The Parabolic Stop and Reverse (3.45) below is in the 10th day of sell mode.
- 4. January 12, 2016 On the WEEKLY BOLLINGER BANDS CHART below, last week represents the 5th consecutive close below the middle of the Bollinger Bands envelope (5.63). The Bollinger Bands (2.53-8.73) are pointing lower; expanding from a width of 586 ticks on Friday to a width of 620 ticks on Monday.