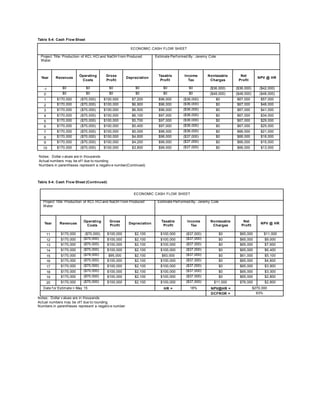
Dr. Wayne Seames
308 Harrington Hall
241 Centennial Dr. Stop 7101
Grand Forks, ND 58202-7101
March 21, 2016
Title: Produced Water Treatment and Conversion of Brine to Valuable Products
Dr. Seames,
Enclosed is a scoping study recommending a process for a wastewater treatment facility that is
designed to treat a feed of produced water and generate a concentrated brine from which
valuable chemical products are produced. The report includes recommended and alternative
processes that treat a feed of 10,000 bbls/day of produced water and produce a variety of
products. The scoping study includes input/output diagrams, block flow diagrams, process flow
diagrams, and a description of the process for each alternative. Also included for each
alternative is: a preliminary schedule, major equipment list, raw material requirements, utility
requirements, catalyst and chemical requirements, product lists, a safety and environmental
impact statement, and an economic assessment. Additionally, a hazards analysis was
performed and is included for the recommended process.
The recommended process produces 30 lb/min of KCl, 610 lb/min of NaOH, 970 lb/min of water,
and 1400 lb/min of HCl from a produced water feed. The produced water feed goes through a
series of unit operations that remove its organic pollutants and solid wastes and the KCl is
recovered using a froth flotation unit. The process stream is then reacted in an electrolytic
diaphragm cell and NaOH, Cl2 and H2 are produced. The hydrogen and chlorine are reacted to
produce HCl while the NaOH is concentrated to produce a 50 wt% NaOH product and a potable
water product. The project requires a total capital investment of $84 million. The project has a
NPV@18% of $270 million 40% and a DCFROR of 63% over a 20-year project lifetime at a 95%
operating factor.
The alternative process uses the same main unit operations as the recommended process
minus the HCl synthesis unit. Therefore, the products of the alternative process are: 30 lb/min of
KCl, 610 lb/min of NaOH, 1900 lb/min of water, 15 lb/min of H2, and 540 lb/min of Cl2. The
alternative project requires a total capital investment of $110 million with a NPV@18% of $180
million ± 40% and a DCFROR of 46% over a 20-year project lifetime.
The recommended process has a higher NPV and DCFROR and was shown to be favorable
using an incremental economic analysis to compare the processes.
The recommended process was chosen over the alternative based on economics, sustainability,
and safety. The alternative process had no distinct advantages.
A meeting has been scheduled for Wednesday March 23, 2016 at 3 PM in Harrington Hall to
discuss the processes described in the enclosed scoping study report. Please feel free to
contact us with any questions or concerns.
Sincerely,
Leah Althoff Jeremy Cole Katie Randazzo
Budget Brief
Proposal to Fund
Title: Produced Water Treatment and Conversion of Brine to Valuable Products
Funding Requested: $84,000,000
Project Duration: 21 months (actual project duration may vary)
Project Description: Valuable products such as KCl, HCl, NaOH and potable water will
be produced from a produced water feedstock of 10,000 bbls/day. The produced water
feed is supplied by a company working under contract with AE2S. All the products will
be sold to generate revenue including the potable water, which will be sold back to the
oil industry for reuse. The produced water feedstock is sent through a series of unit
operations that remove its organic pollutants and solid wastes. 30 lb/min of KCl is
recovered using a froth flotation unit and following these unit operations the feed is
reacted in an electrolytic diaphragm cell. The reaction in the cell produces hydrogen,
chlorine, and dilute NaOH. The hydrogen and chlorine are reacted to produce 1400
lb/min of a 35% HCl solution, while water is evaporated from the NaOH to produce 610
lb/min of a 50% NaOH solution and 970 lb/min of potable water.
Present Situation: Currently, produced water is being handled as a waste product and
oil companies are paying to dispose of it or are injecting it underground. The company
AE2S is working for would like to determine the feasibility of using this waste as a raw
material.
Justification: The process eliminates the need to handle produced water as a waste
and instead uses it to produce revenue-generating products such as KCl, HCl, NaOH
and potable water.
Economic Justification: The NPV@18% is $270 million ± 40%. The DCFROR is 63%
over the 20-year lifecycle of the plant.
Alternative: The alternative process uses the same main unit operations as the
recommended process minus the HCl synthesis unit used to react the hydrogen and
chlorine. Therefore, the process produces 15 lb/min of hydrogen, 540 lb/min of chlorine,
30 lb/min of KCl, 610 lb/min of a 50 wt% NaOH solution, and 1900 lb/min of potable
water. The NPV@18% for the alternative process is $180 million ± 40% and the
DCFROR is 46% over the 20-year lifecycle. The recommended process was shown to
be favorable on the platforms of economics, sustainability, and safety. The alternative
process had no distinct advantages.
Hazards: Hazards to the project investment include: the gross margin for selling prices
of HCl and NaOH, the FCI, and electricity cost. If the gross margin was to fall to one
standard deviation below the median historical value at $220/metric ton, the NPV@18%
would fall to $220 million ± 40%. If the FCI was 40% higher at $100 million, the
NPV@18% would fall to $220 million ± 40%, and if the electricity cost was one standard
deviation from the basis price higher at $0.088/kWh, the NPV@18% would fall to $250
million ± 40%. The gross margin has never been below the breakeven point for any of
the hazards. The gross margin poses the most significant economic risk, but no risk to
the investment is great enough to make the project uneconomic.
Table of Contents
1. Introduction............................................................................................................... 1
1.1 Technology/Process Background........................................................... 1
1.2 Economic Background ............................................................................. 2
2. Present Situation..................................................................................................... 3
3. Scope of Work ........................................................................................................ 4
4. Recommended Process Project Description...................................................... 4
4.1 Recommended Process Description..................................................... 4
4.2 Preliminary Schedule................................................................................ 10
4.3 Major Equipment List ............................................................................... 10
4.4 Raw Materials............................................................................................ 10
4.5 Utility Requirements.................................................................................. 10
4.6 Chemical and Catalyst Requirements.................................................... 10
4.7 Product Lists.............................................................................................. 10
4.8 Statement of Expected Safety................................................................ 10
4.9 Environmental Impact Statement ........................................................... 11
5. Recommended Process Economic Assessment............................................... 11
5.1 Broad Cost Estimate ................................................................................ 11
5.2 Operating Cost Summary........................................................................ 11
5.3 Revenues.................................................................................................... 12
5.4 Taxes .......................................................................................................... 13
5.5 Overall Profitability.................................................................................... 13
6. Hazards Analysis..................................................................................................... 13
7. Pros and Cons of the Recommended Process in Comparison to the Alternative
Process............................................................................................................. 14
8. Justification and Recommendations..................................................................... 14
9. References............................................................................................................... 15
Table 4-1: Recommended Process Major Equipment List................................... 22
Table 4-2: Recommended Process Raw Material List.......................................... 30
Table 4-3: Recommended Process Utility Requirements...................................... 31
Table 4-4: Recommended Process Chemical and Catalyst Requirements ....... 32
Table 4-5A: Recommended Process Water Product List..................................... 33
Table 4-5B: Recommended Process KCl Product List ......................................... 33
Table 4-5C: Recommended Process HCl Product List......................................... 33
Table 4-5D: Recommended Process NaOH Product List .................................... 33
Table 5-1: Capital Cost Summary............................................................................. 34
Table 5-2: Operating Cost Summary........................................................................ 43
Table 5-3: Recommended Process Revenues ....................................................... 44
Table 5-4: Cash Flow Sheet...................................................................................... 45
Figure 4-1 Preliminary Schedule............................................................................... 47
Figure 6-1 Gross Margin of NaOH and HCl Products for
Recommended Project................................................................................... 48
Figure 6-2 Economic Sensitivity to Gross Margin for
Recommended Project .................................................................................. 49
Figure 6-3 Economic Sensitivity to the FCI for Recommended Project ............. 50
Figure 6-4 Historical Prices for the Cost of Electricity........................................... 51
Figure 6-5 Economic Sensitivity to the Cost of Electricity for
Recommended Project................................................................................... 52
Dwg 00-A-001/1 Recommended Process Input/Output Diagram ....................... 53
Dwg 00-A-002/1 Recommended Process Block Flow Diagram.......................... 54
Dwg 00-A-002/2 Recommended Process Block Flow Diagram.......................... 55
Dwg 00-A-002/3 Recommended Process Block Flow Diagram.......................... 56
Dwg 00-A-003/1 Recommended Process Process Flow Diagram ..................... 57
Dwg 00-A-003/2 Recommended Process Process Flow Diagram ..................... 58
Dwg 00-A-003/3 Recommended Process Process Flow Diagram ..................... 59
Dwg 00-A-003/4 Recommended Process Process Flow Diagram ..................... 60
Dwg 00-A-003/5 Recommended Process Process Flow Diagram ..................... 61
Dwg 00-A-003/6 Recommended Process Process Flow Diagram ..................... 62
Dwg 00-A-003/7 Recommended Process Process Flow Diagram ..................... 63
Dwg 00-A-003/8 Recommended Process Process Flow Diagram ..................... 64
Dwg 00-A-003/9 Recommended Process Process Flow Diagram ..................... 65
Dwg 00-A-003/10 Recommended Process Process Flow Diagram ................... 66
Dwg 00-A-004/1 Recommended Process Supplemental
Process Flow Diagram................................................................................... 67
Dwg 00-A-004/2 Recommended Process Supplemental
Process Flow Diagram................................................................................... 68
Dwg 00-A-005/1 Recommended Process Supplemental
Process Flow Diagram................................................................................... 69
Appendix A: Alternative Process .............................................................................. A-1
A.1 Alternative Process Project Description ........................................................... A-1
A.1.1 Alternative Process Description.......................................................... A-1
A.1.2 Preliminary Schedule............................................................................ A-6
A.1.3 Major Equipment List............................................................................ A-7
A.1.4 Raw Materials........................................................................................ A-7
A.1.5 Utility Requirements.............................................................................. A-7
A.1.6 Chemical and Catalyst Requirements................................................ A-7
A.1.7 Product Lists.......................................................................................... A-7
A.1.8 Statement of Expected Safety............................................................. A-7
A.1.9 Environmental Impact Statement........................................................ A-7
A.2. Alternative Process Economic Assessment.................................................... A-8
A.2.1 Broad Cost Estimate............................................................................. A-8
A.2.2 Operating Cost Summary..................................................................... A-8
A.2.3 Revenues................................................................................................ A-9
A.2.4 Taxes....................................................................................................... A-9
A.2.5 Overall Profitability................................................................................ A-9
Table A.1-1: Alternative Process Major Equipment List........................................ A-10
Table A.1-2: Alternative Process Raw Material List .............................................. A-19
Table A.1-3: Alternative Process Utility Requirements.......................................... A-20
Table A.1-4: Alternative Process Chemical and Catalyst Requirements............ A-21
Table A.1-5A: Alternative Process Water Product List.......................................... A-22
Table A.1-5B: Alternative Process KCl Product List.............................................. A-22
Table A.1-5C: Alternative Process NaOH Product List......................................... A-22
Table A.1-5D: Alternative Process H2 Product List................................................ A-22
Table A.1-5E: Alternative Process Cl2 Product List............................................... A-22
Table A.2-1: Capital Cost Summary......................................................................... A-23
Table A.2-2: Operating Cost Summary.................................................................... A-34
Table A.2-3: Alternative Process Revenues............................................................ A-35
Table A.2-4: Cash Flow Sheet .................................................................................. A-36
Figure A.1-1 Preliminary Schedule ........................................................................... A-38
Dwg 00-A-006/1 Alternative Process Input/Output Diagram................................ A-39
Dwg 00-A-007/1 Alternative Process Block Flow Diagram .................................. A-40
Dwg 00-A-007/2 Alternative Process Block Flow Diagram .................................. A-41
Dwg 00-A-008/1 Alternative Process Process Flow Diagram.............................. A-42
Dwg 00-A-008/2 Alternative Process Process Flow Diagram.............................. A-43
Dwg 00-A-008/3 Alternative Process Process Flow Diagram.............................. A-44
Dwg 00-A-008/4 Alternative Process Process Flow Diagram.............................. A-45
Dwg 00-A-008/5 Alternative Process Process Flow Diagram.............................. A-46
Dwg 00-A-008/6 Alternative Process Process Flow Diagram.............................. A-47
Dwg 00-A-008/7 Alternative Process Process Flow Diagram.............................. A-48
Dwg 00-A-008/8 Alternative Process Process Flow Diagram.............................. A-49
Dwg 00-A-008/9 Alternative Process Process Flow Diagram.............................. A-50
Dwg 00-A-008/10 Alternative Process Process Flow Diagram ........................... A-51
Dwg 00-A-008/11 Alternative Process Process Flow Diagram ........................... A-52
Dwg 00-A-008/12 Alternative Process Process Flow Diagram ........................... A-53
Dwg 00-A-008/13 Alternative Process Process Flow Diagram ........................... A-54
Dwg 00-A-009/1 Alternative Process Supplemental
Process Flow Diagram................................................................................... A-55
Dwg 00-A-009/2 Alternative Process Supplemental
Process Flow Diagram................................................................................... A-56
Dwg 00-A-0010/1 Alternative Process Supplemental
Process Flow Diagram................................................................................... A-57
Appendix B: Pros and Cons of the Recommended Process in Comparison to the
Alternative Process......................................................................................... B-1
B.1 Economics............................................................................................................. B-1
B.2 Maintainability........................................................................................................ B-1
B.3 Operability.............................................................................................................. B-1
B.4 Constructability...................................................................................................... B-1
B.5 Environmental Impact .......................................................................................... B-1
B.6 Safety ................................................................................................................ B-2
B.7 Conclusion............................................................................................................. B-2
Table B.1-1: Incremental Modified Cash Flow Sheet............................................ B-3
Table B.7-1: Qualitative Comparison of the Recommended and Alternative Process
B-5
Appendix C: Rejected Alternatives............................................................................ C-1
Appendix D: ChemCAD Simulation Summary........................................................ D-1
Appendix E: Sample Calculations ............................................................................. E-1
Appendix F: Intermediate Results ............................................................................. F-1
Appendix G: Assumptions List.................................................................................. G-1
Appendix H: Communication Records..................................................................... H-1
Appendix I: References for Appendices .................................................................. I-1
Appendix J: Bibliography of Resources ................................................................... J-1
Table 5-4: Cash Flow Sheet
Notes: Dollar v alues are in thousands
Actual numbers may be of f due to rounding
Numbers in parentheses represent a negativ e number(Continued)
Table 5-4: Cash Flow Sheet (Continued)
ECONOMIC CASH FLOW SHEET
Project Title: Production of KCl, HCl and NaOH f rom Produced
Water
Estimate Perf ormed By : Jeremy Cole
Year Revenues
Operating
Costs
Gross
Profit
Depreciation
Taxable
Profit
Income
Tax
Nontaxable
Charges
Net
Profit
NPV @ HR
11 $170,000 ($70,000) $100,000 $2,100 $100,000 ($37,000) $0 $65,000 $11,000
12 $170,000 ($70,000) $100,000 $2,100 $100,000 ($37,000) $0 $65,000 $9,000
13 $170,000 ($70,000) $100,000 $2,100 $100,000 ($37,000) $0 $65,000 $7,600
14 $170,000 ($70,000) $100,000 $2,100 $100,000 ($37,000) $0 $65,000 $6,400
15 $170,000 ($78,000) $95,000 $2,100 $93,000 ($37,000) $0 $61,000 $5,100
16 $170,000 ($70,000) $100,000 $2,100 $100,000 ($37,000) $0 $65,000 $4,600
17 $170,000 ($70,000) $100,000 $2,100 $100,000 ($37,000) $0 $65,000 $3,900
18 $170,000 ($70,000) $100,000 $2,100 $100,000 ($37,000) $0 $65,000 $3,300
19 $170,000 ($70,000) $100,000 $2,100 $100,000 ($37,000) $0 $65,000 $2,800
20 $170,000 ($70,000) $100,000 $2,100 $100,000 ($37,000) $11,000 $76,000 $2,800
Date f or Estimate = May 15 HR = 18% NPV@HR = $270,000
DCFROR = 63%
Notes: Dollar v alues are in thousands
Actual numbers may be of f due to rounding
Numbers in parentheses represent a negativ e number
ECONOMIC CASH FLOW SHEET
Project Title: Production of KCl, HCl and NaOH f rom Produced
Water
Estimate Perf ormed By : Jeremy Cole
Year Revenues
Operating
Costs
Gross
Profit
Depreciation
Taxable
Profit
Income
Tax
Nontaxable
Charges
Net
Profit
NPV @ HR
-1 $0 $0 $0 $0 $0 $0 ($36,000) ($36,000) ($42,000)
0 $0 $0 $0 $0 $0 $0 ($48,000) ($48,000) ($48,000)
1 $170,000 ($70,000) $100,000 $7,200 $96,000 ($36,000) $0 $67,000 $57,000
2 $170,000 ($70,000) $100,000 $6,900 $96,000 ($36,000) $0 $67,000 $48,000
3 $170,000 ($70,000) $100,000 $6,500 $96,000 ($36,000) $0 $67,000 $41,000
4 $170,000 ($70,000) $100,000 $6,100 $97,000 ($36,000) $0 $67,000 $34,000
5 $170,000 ($70,000) $100,000 $5,700 $97,000 ($36,000) $0 $67,000 $29,000
6 $170,000 ($70,000) $100,000 $5,400 $97,000 ($36,000) $0 $67,000 $25,000
7 $170,000 ($70,000) $100,000 $5,000 $98,000 ($36,000) $0 $66,000 $21,000
8 $170,000 ($70,000) $100,000 $4,600 $98,000 ($37,000) $0 $66,000 $18,000
9 $170,000 ($70,000) $100,000 $4,200 $99,000 ($37,000) $0 $66,000 $15,000
10 $170,000 ($70,000) $100,000 $3,800 $99,000 ($37,000) $0 $66,000 $13,000

Scoping Study Sample

  • 1.
    Dr. Wayne Seames 308Harrington Hall 241 Centennial Dr. Stop 7101 Grand Forks, ND 58202-7101 March 21, 2016 Title: Produced Water Treatment and Conversion of Brine to Valuable Products Dr. Seames, Enclosed is a scoping study recommending a process for a wastewater treatment facility that is designed to treat a feed of produced water and generate a concentrated brine from which valuable chemical products are produced. The report includes recommended and alternative processes that treat a feed of 10,000 bbls/day of produced water and produce a variety of products. The scoping study includes input/output diagrams, block flow diagrams, process flow diagrams, and a description of the process for each alternative. Also included for each alternative is: a preliminary schedule, major equipment list, raw material requirements, utility requirements, catalyst and chemical requirements, product lists, a safety and environmental impact statement, and an economic assessment. Additionally, a hazards analysis was performed and is included for the recommended process. The recommended process produces 30 lb/min of KCl, 610 lb/min of NaOH, 970 lb/min of water, and 1400 lb/min of HCl from a produced water feed. The produced water feed goes through a series of unit operations that remove its organic pollutants and solid wastes and the KCl is recovered using a froth flotation unit. The process stream is then reacted in an electrolytic diaphragm cell and NaOH, Cl2 and H2 are produced. The hydrogen and chlorine are reacted to produce HCl while the NaOH is concentrated to produce a 50 wt% NaOH product and a potable water product. The project requires a total capital investment of $84 million. The project has a NPV@18% of $270 million 40% and a DCFROR of 63% over a 20-year project lifetime at a 95% operating factor. The alternative process uses the same main unit operations as the recommended process minus the HCl synthesis unit. Therefore, the products of the alternative process are: 30 lb/min of KCl, 610 lb/min of NaOH, 1900 lb/min of water, 15 lb/min of H2, and 540 lb/min of Cl2. The alternative project requires a total capital investment of $110 million with a NPV@18% of $180 million ± 40% and a DCFROR of 46% over a 20-year project lifetime. The recommended process has a higher NPV and DCFROR and was shown to be favorable using an incremental economic analysis to compare the processes. The recommended process was chosen over the alternative based on economics, sustainability, and safety. The alternative process had no distinct advantages. A meeting has been scheduled for Wednesday March 23, 2016 at 3 PM in Harrington Hall to discuss the processes described in the enclosed scoping study report. Please feel free to contact us with any questions or concerns. Sincerely, Leah Althoff Jeremy Cole Katie Randazzo
  • 2.
    Budget Brief Proposal toFund Title: Produced Water Treatment and Conversion of Brine to Valuable Products Funding Requested: $84,000,000 Project Duration: 21 months (actual project duration may vary) Project Description: Valuable products such as KCl, HCl, NaOH and potable water will be produced from a produced water feedstock of 10,000 bbls/day. The produced water feed is supplied by a company working under contract with AE2S. All the products will be sold to generate revenue including the potable water, which will be sold back to the oil industry for reuse. The produced water feedstock is sent through a series of unit operations that remove its organic pollutants and solid wastes. 30 lb/min of KCl is recovered using a froth flotation unit and following these unit operations the feed is reacted in an electrolytic diaphragm cell. The reaction in the cell produces hydrogen, chlorine, and dilute NaOH. The hydrogen and chlorine are reacted to produce 1400 lb/min of a 35% HCl solution, while water is evaporated from the NaOH to produce 610 lb/min of a 50% NaOH solution and 970 lb/min of potable water. Present Situation: Currently, produced water is being handled as a waste product and oil companies are paying to dispose of it or are injecting it underground. The company AE2S is working for would like to determine the feasibility of using this waste as a raw material. Justification: The process eliminates the need to handle produced water as a waste and instead uses it to produce revenue-generating products such as KCl, HCl, NaOH and potable water. Economic Justification: The NPV@18% is $270 million ± 40%. The DCFROR is 63% over the 20-year lifecycle of the plant. Alternative: The alternative process uses the same main unit operations as the recommended process minus the HCl synthesis unit used to react the hydrogen and chlorine. Therefore, the process produces 15 lb/min of hydrogen, 540 lb/min of chlorine, 30 lb/min of KCl, 610 lb/min of a 50 wt% NaOH solution, and 1900 lb/min of potable water. The NPV@18% for the alternative process is $180 million ± 40% and the DCFROR is 46% over the 20-year lifecycle. The recommended process was shown to be favorable on the platforms of economics, sustainability, and safety. The alternative process had no distinct advantages. Hazards: Hazards to the project investment include: the gross margin for selling prices of HCl and NaOH, the FCI, and electricity cost. If the gross margin was to fall to one standard deviation below the median historical value at $220/metric ton, the NPV@18% would fall to $220 million ± 40%. If the FCI was 40% higher at $100 million, the NPV@18% would fall to $220 million ± 40%, and if the electricity cost was one standard deviation from the basis price higher at $0.088/kWh, the NPV@18% would fall to $250 million ± 40%. The gross margin has never been below the breakeven point for any of the hazards. The gross margin poses the most significant economic risk, but no risk to the investment is great enough to make the project uneconomic.
  • 3.
    Table of Contents 1.Introduction............................................................................................................... 1 1.1 Technology/Process Background........................................................... 1 1.2 Economic Background ............................................................................. 2 2. Present Situation..................................................................................................... 3 3. Scope of Work ........................................................................................................ 4 4. Recommended Process Project Description...................................................... 4 4.1 Recommended Process Description..................................................... 4 4.2 Preliminary Schedule................................................................................ 10 4.3 Major Equipment List ............................................................................... 10 4.4 Raw Materials............................................................................................ 10 4.5 Utility Requirements.................................................................................. 10 4.6 Chemical and Catalyst Requirements.................................................... 10 4.7 Product Lists.............................................................................................. 10 4.8 Statement of Expected Safety................................................................ 10 4.9 Environmental Impact Statement ........................................................... 11 5. Recommended Process Economic Assessment............................................... 11 5.1 Broad Cost Estimate ................................................................................ 11 5.2 Operating Cost Summary........................................................................ 11 5.3 Revenues.................................................................................................... 12 5.4 Taxes .......................................................................................................... 13 5.5 Overall Profitability.................................................................................... 13 6. Hazards Analysis..................................................................................................... 13 7. Pros and Cons of the Recommended Process in Comparison to the Alternative Process............................................................................................................. 14 8. Justification and Recommendations..................................................................... 14 9. References............................................................................................................... 15 Table 4-1: Recommended Process Major Equipment List................................... 22 Table 4-2: Recommended Process Raw Material List.......................................... 30 Table 4-3: Recommended Process Utility Requirements...................................... 31 Table 4-4: Recommended Process Chemical and Catalyst Requirements ....... 32 Table 4-5A: Recommended Process Water Product List..................................... 33 Table 4-5B: Recommended Process KCl Product List ......................................... 33 Table 4-5C: Recommended Process HCl Product List......................................... 33 Table 4-5D: Recommended Process NaOH Product List .................................... 33 Table 5-1: Capital Cost Summary............................................................................. 34 Table 5-2: Operating Cost Summary........................................................................ 43 Table 5-3: Recommended Process Revenues ....................................................... 44 Table 5-4: Cash Flow Sheet...................................................................................... 45 Figure 4-1 Preliminary Schedule............................................................................... 47 Figure 6-1 Gross Margin of NaOH and HCl Products for Recommended Project................................................................................... 48 Figure 6-2 Economic Sensitivity to Gross Margin for
  • 4.
    Recommended Project ..................................................................................49 Figure 6-3 Economic Sensitivity to the FCI for Recommended Project ............. 50 Figure 6-4 Historical Prices for the Cost of Electricity........................................... 51 Figure 6-5 Economic Sensitivity to the Cost of Electricity for Recommended Project................................................................................... 52 Dwg 00-A-001/1 Recommended Process Input/Output Diagram ....................... 53 Dwg 00-A-002/1 Recommended Process Block Flow Diagram.......................... 54 Dwg 00-A-002/2 Recommended Process Block Flow Diagram.......................... 55 Dwg 00-A-002/3 Recommended Process Block Flow Diagram.......................... 56 Dwg 00-A-003/1 Recommended Process Process Flow Diagram ..................... 57 Dwg 00-A-003/2 Recommended Process Process Flow Diagram ..................... 58 Dwg 00-A-003/3 Recommended Process Process Flow Diagram ..................... 59 Dwg 00-A-003/4 Recommended Process Process Flow Diagram ..................... 60 Dwg 00-A-003/5 Recommended Process Process Flow Diagram ..................... 61 Dwg 00-A-003/6 Recommended Process Process Flow Diagram ..................... 62 Dwg 00-A-003/7 Recommended Process Process Flow Diagram ..................... 63 Dwg 00-A-003/8 Recommended Process Process Flow Diagram ..................... 64 Dwg 00-A-003/9 Recommended Process Process Flow Diagram ..................... 65 Dwg 00-A-003/10 Recommended Process Process Flow Diagram ................... 66 Dwg 00-A-004/1 Recommended Process Supplemental Process Flow Diagram................................................................................... 67 Dwg 00-A-004/2 Recommended Process Supplemental Process Flow Diagram................................................................................... 68 Dwg 00-A-005/1 Recommended Process Supplemental Process Flow Diagram................................................................................... 69 Appendix A: Alternative Process .............................................................................. A-1 A.1 Alternative Process Project Description ........................................................... A-1 A.1.1 Alternative Process Description.......................................................... A-1 A.1.2 Preliminary Schedule............................................................................ A-6 A.1.3 Major Equipment List............................................................................ A-7 A.1.4 Raw Materials........................................................................................ A-7 A.1.5 Utility Requirements.............................................................................. A-7 A.1.6 Chemical and Catalyst Requirements................................................ A-7 A.1.7 Product Lists.......................................................................................... A-7 A.1.8 Statement of Expected Safety............................................................. A-7 A.1.9 Environmental Impact Statement........................................................ A-7 A.2. Alternative Process Economic Assessment.................................................... A-8 A.2.1 Broad Cost Estimate............................................................................. A-8 A.2.2 Operating Cost Summary..................................................................... A-8 A.2.3 Revenues................................................................................................ A-9 A.2.4 Taxes....................................................................................................... A-9 A.2.5 Overall Profitability................................................................................ A-9 Table A.1-1: Alternative Process Major Equipment List........................................ A-10 Table A.1-2: Alternative Process Raw Material List .............................................. A-19 Table A.1-3: Alternative Process Utility Requirements.......................................... A-20
  • 5.
    Table A.1-4: AlternativeProcess Chemical and Catalyst Requirements............ A-21 Table A.1-5A: Alternative Process Water Product List.......................................... A-22 Table A.1-5B: Alternative Process KCl Product List.............................................. A-22 Table A.1-5C: Alternative Process NaOH Product List......................................... A-22 Table A.1-5D: Alternative Process H2 Product List................................................ A-22 Table A.1-5E: Alternative Process Cl2 Product List............................................... A-22 Table A.2-1: Capital Cost Summary......................................................................... A-23 Table A.2-2: Operating Cost Summary.................................................................... A-34 Table A.2-3: Alternative Process Revenues............................................................ A-35 Table A.2-4: Cash Flow Sheet .................................................................................. A-36 Figure A.1-1 Preliminary Schedule ........................................................................... A-38 Dwg 00-A-006/1 Alternative Process Input/Output Diagram................................ A-39 Dwg 00-A-007/1 Alternative Process Block Flow Diagram .................................. A-40 Dwg 00-A-007/2 Alternative Process Block Flow Diagram .................................. A-41 Dwg 00-A-008/1 Alternative Process Process Flow Diagram.............................. A-42 Dwg 00-A-008/2 Alternative Process Process Flow Diagram.............................. A-43 Dwg 00-A-008/3 Alternative Process Process Flow Diagram.............................. A-44 Dwg 00-A-008/4 Alternative Process Process Flow Diagram.............................. A-45 Dwg 00-A-008/5 Alternative Process Process Flow Diagram.............................. A-46 Dwg 00-A-008/6 Alternative Process Process Flow Diagram.............................. A-47 Dwg 00-A-008/7 Alternative Process Process Flow Diagram.............................. A-48 Dwg 00-A-008/8 Alternative Process Process Flow Diagram.............................. A-49 Dwg 00-A-008/9 Alternative Process Process Flow Diagram.............................. A-50 Dwg 00-A-008/10 Alternative Process Process Flow Diagram ........................... A-51 Dwg 00-A-008/11 Alternative Process Process Flow Diagram ........................... A-52 Dwg 00-A-008/12 Alternative Process Process Flow Diagram ........................... A-53 Dwg 00-A-008/13 Alternative Process Process Flow Diagram ........................... A-54 Dwg 00-A-009/1 Alternative Process Supplemental Process Flow Diagram................................................................................... A-55 Dwg 00-A-009/2 Alternative Process Supplemental Process Flow Diagram................................................................................... A-56 Dwg 00-A-0010/1 Alternative Process Supplemental Process Flow Diagram................................................................................... A-57 Appendix B: Pros and Cons of the Recommended Process in Comparison to the Alternative Process......................................................................................... B-1 B.1 Economics............................................................................................................. B-1 B.2 Maintainability........................................................................................................ B-1 B.3 Operability.............................................................................................................. B-1 B.4 Constructability...................................................................................................... B-1 B.5 Environmental Impact .......................................................................................... B-1 B.6 Safety ................................................................................................................ B-2 B.7 Conclusion............................................................................................................. B-2 Table B.1-1: Incremental Modified Cash Flow Sheet............................................ B-3 Table B.7-1: Qualitative Comparison of the Recommended and Alternative Process B-5 Appendix C: Rejected Alternatives............................................................................ C-1
  • 6.
    Appendix D: ChemCADSimulation Summary........................................................ D-1 Appendix E: Sample Calculations ............................................................................. E-1 Appendix F: Intermediate Results ............................................................................. F-1 Appendix G: Assumptions List.................................................................................. G-1 Appendix H: Communication Records..................................................................... H-1 Appendix I: References for Appendices .................................................................. I-1 Appendix J: Bibliography of Resources ................................................................... J-1
  • 7.
    Table 5-4: CashFlow Sheet Notes: Dollar v alues are in thousands Actual numbers may be of f due to rounding Numbers in parentheses represent a negativ e number(Continued) Table 5-4: Cash Flow Sheet (Continued) ECONOMIC CASH FLOW SHEET Project Title: Production of KCl, HCl and NaOH f rom Produced Water Estimate Perf ormed By : Jeremy Cole Year Revenues Operating Costs Gross Profit Depreciation Taxable Profit Income Tax Nontaxable Charges Net Profit NPV @ HR 11 $170,000 ($70,000) $100,000 $2,100 $100,000 ($37,000) $0 $65,000 $11,000 12 $170,000 ($70,000) $100,000 $2,100 $100,000 ($37,000) $0 $65,000 $9,000 13 $170,000 ($70,000) $100,000 $2,100 $100,000 ($37,000) $0 $65,000 $7,600 14 $170,000 ($70,000) $100,000 $2,100 $100,000 ($37,000) $0 $65,000 $6,400 15 $170,000 ($78,000) $95,000 $2,100 $93,000 ($37,000) $0 $61,000 $5,100 16 $170,000 ($70,000) $100,000 $2,100 $100,000 ($37,000) $0 $65,000 $4,600 17 $170,000 ($70,000) $100,000 $2,100 $100,000 ($37,000) $0 $65,000 $3,900 18 $170,000 ($70,000) $100,000 $2,100 $100,000 ($37,000) $0 $65,000 $3,300 19 $170,000 ($70,000) $100,000 $2,100 $100,000 ($37,000) $0 $65,000 $2,800 20 $170,000 ($70,000) $100,000 $2,100 $100,000 ($37,000) $11,000 $76,000 $2,800 Date f or Estimate = May 15 HR = 18% NPV@HR = $270,000 DCFROR = 63% Notes: Dollar v alues are in thousands Actual numbers may be of f due to rounding Numbers in parentheses represent a negativ e number ECONOMIC CASH FLOW SHEET Project Title: Production of KCl, HCl and NaOH f rom Produced Water Estimate Perf ormed By : Jeremy Cole Year Revenues Operating Costs Gross Profit Depreciation Taxable Profit Income Tax Nontaxable Charges Net Profit NPV @ HR -1 $0 $0 $0 $0 $0 $0 ($36,000) ($36,000) ($42,000) 0 $0 $0 $0 $0 $0 $0 ($48,000) ($48,000) ($48,000) 1 $170,000 ($70,000) $100,000 $7,200 $96,000 ($36,000) $0 $67,000 $57,000 2 $170,000 ($70,000) $100,000 $6,900 $96,000 ($36,000) $0 $67,000 $48,000 3 $170,000 ($70,000) $100,000 $6,500 $96,000 ($36,000) $0 $67,000 $41,000 4 $170,000 ($70,000) $100,000 $6,100 $97,000 ($36,000) $0 $67,000 $34,000 5 $170,000 ($70,000) $100,000 $5,700 $97,000 ($36,000) $0 $67,000 $29,000 6 $170,000 ($70,000) $100,000 $5,400 $97,000 ($36,000) $0 $67,000 $25,000 7 $170,000 ($70,000) $100,000 $5,000 $98,000 ($36,000) $0 $66,000 $21,000 8 $170,000 ($70,000) $100,000 $4,600 $98,000 ($37,000) $0 $66,000 $18,000 9 $170,000 ($70,000) $100,000 $4,200 $99,000 ($37,000) $0 $66,000 $15,000 10 $170,000 ($70,000) $100,000 $3,800 $99,000 ($37,000) $0 $66,000 $13,000