Download to read offline


![Sciences of Europe # 147, (2024) 5
ities of gleyey-yellow soils having unsatisfactory indi-
cations is one of the most important issues in order to
plant crops [8,15,16]. Closeness of underground water
to surface along with prolonged and mostly incorrect
cultivation and development gleying process strongly
decreased agronomical value of these soils. The tem-
perature systematically rises beginning from early
spring to summer,but strongly reduces in autumn in the
podzol-gleyey-yellow soils of the bresearch zone. Es-
pecially, strong humidity (in December-January) and
severe aridity of soil in summer indicate its negative ef-
fect very much, it strongly changed ecological fertility
parameters depending on seasons.So, recently it was
determined that the soil fertility strongly decreases and
soil cover degrades and the desertification process in-
tensifies as a result of the human’s incorrect farming
activity.
OBJECT AND METHODS OF THE
RESEARCH
The researches were performed in the experi-
mental-research areas selected in Lankaran in 2021-
2024. The experiments were performed in foothill and
plain areasof the Lankaran-Astara region, in the Lanka-
ran Tea branch and Hirkan farming zones of the Azer-
baijan Fruit-growing and Tea-growing Scientific-Re-
search Institute. Non-eroded and averagely washed
podzol-gleyey-yellow soils (in WRB Gleyic Livosols)
of the Lankaran-Astara region were selected as a re-
search object. A main aim of the research is to investi-
gate measures system of the agrochemical and ag-
rophysical character of gleyey –yellow soils under tea
plant which widespread in the Lankaran-Astara zone
and are intensively used in agricultural production and
work out measures system for fertility improvement.
The following principles are taken as a basis: complex
investigation (natural-historical conditionof soil type,
main indicators and rational use of fertility, agroecolog-
ical assessment); comparatively investigation (compar-
ison of agrophysical-agrochemical indices and ecolog-
ical control in non-degraded and averagely degraded
soils); economical investigation (economical rational-
ity of use from soil area).
The research method was referred to the methodi-
cal recommendations worked out in 70-80 years of the
last years and V.R.Volobuyev [1953], G.Sh.Mamma-
dov [1992], S.Z. Mammadova [2005] and other re-
searchers’ methods. The work was fulfilled in three
stages: field works, laboratorial and generalyzed works.
The following work was realized in the field experi-
ments: the soil temperature was measured by Savvinov
thermometer, the field humidity by weight method (it
was dried at 105 0
C for 5 hours) in thermostat and a
bulky weight of soil was calculated for Vasilyev cylin-
der. For this purpose, the soil sections more than 20
were applied in the different depths of the characteristic
places in the research zone, the samples were taken on
genetic layers and laboratorial analyses were per-
formed. The GPS coordinates of each soil section were
registered and used in researches. M.P.Babayev and
E.A.Gurbanov’s methods (2008) were used in evalua-
tion of degradation degrees. The chemical analysis and
mathematical methods were used for generally ac-
cepted method. Exactness of the obtained results in
cameral works (mathematical calculation of the crop
and information indications) were performed mathe-
matical-dispersion analysis (B.A.Dospekhov,1978,;
E.A.Dimitriyev 2009), the correlative relations among
the indications were fulfilled in Excel 2007 program.
The experiments were performed on the following
schemes with 5 versions, 3 repititions, 100 m2
area of
each section: non-eroded soils: 1) Control (without
fertilizer); 2) P150K120
+20 t/h compost (background); 3)
background +N100 ;4)Background +N180, 5) Back-
ground +N250; Averagely eroded soil: 1) Control
(without fertilizer); 2) P150K120+30 t/h compost (back-
ground); 3) background +N100 4) background +N180 5)
background +N250.
Mineral fertilizer were used in the experiment:
ammonium-sulfate (affected nitrogen 21%); Super-
phosphate (affected phosphorus 18%), potassium sul-
fate (affected potassium 46%). Components of “Lanka-
ran” compost: 50% manure, 26% remnants of the veg-
etable and tea plants, 10% bird manure, 8% wastes of
the tea and vegetable industry, 4% acidifying (by add-
ing 2% simple superphosphate and ammonium sulfate)
substances; Chemical composition of compost: nitro-
gen-1,50%, phosphorus-0,80 %; potassium -1,85%, or-
ganic substance -25%.
DISCUSSION AND ANALYSIS
Incorrect use from fertilization and irrigation sys-
tem decreased potential and effective fertility of these
soils for a long time. Up to now, comparative study of
agro-physical and agro-chemical characters of different
degradation kinds of the tea podzol-gleyey-yellow soils
was the center of attention, but it wasn’t sufficiently
learnt depending on soil complexity.
A quantity of total humus in the samples taken to
study the agro-chemical characters of the soil and its
factual initial quantity vibrated by 0,85-1,60 % at 0-
100cm layer. It was potentially determined that total ni-
trogen is 0,07-0,13 % at 0-100 cm (0-30, 30-60, 60-100
cm), total phosphorus -0,05-0,12 %, total potassium-
0,60-2,10 %. An amount of nutrients in the soil which
easily assimilated by the plant: absorbed ammoniac is
6,50-10,65 mg/kg, easily hydrolyzed nitrogen is 28-85
mg/kg, nitrate nitrogen is 2,4-6,3 mg/kg, gross phos-
phorus-9,15-24,35 mg/kg, exchangeable potassium -
108-140 mg/kg at 0-100 cm of the soil layer. The soil
with neutral pH –index, or weak and moderate degree
of acid reaction can be selected for citrus plants. Ac-
cording to the adopted gradation in the Republic
(A.N.Gulahmadov, F.H.Akhundov, S.Z.Ibrahimov-
1980), the podzol-clayey-yellow soils are poorly pro-
vided with nutrients. An amount of the same elements
on the upper layer of the averagely washed soils is little
[9, 10, 13, 14] compared to unwashed soils. Therefore,
application of organic, mineral fertilizers is necessary
to get high, qualitative yield from tea plant and restore
natural fertility of soil. A quantity of total humus, total
NPK and nutrients easily assimilated by the plant at
1cm layer of soil in the basic development phases of the
vegetation period have been studied for years. As it is
seen from Table 1, an amount of gross forms of nutri-
ents increased under the influence of fertilizers in the
research years (Table-1). On average a quantity of total
humus vibrates on 1,3-2,9 % at 1m layer of the non-](https://image.slidesharecdn.com/sciencesofeuropeno1472024-240901173407-6df3454c/75/Sciences-of-Europe-No-147-2024-5-2048.jpg)
![6 Sciences of Europe # 147, (2024)
degraded tea soils for 4 years. Total nitrogen is 0,10-
0,16 %, total phosphorus -0,13-0,18 %, potassium-
2,65-2,54 %, they belong to potential fertility on profile
in these soils. Ammoniac dissolved in water is 5,8-12,5
, absorbed ammoniac-31,6-61,4, nitrate nitrogen -1,5-
5,4 mg/kg, gross phosphorus -98,0-113,0 mg/kg, ex-
changeable potassium – 115,0-170,0 mg/kg in 1 kg of
soil.
According to the performed laboratorial and field
researches we can come to such conclusion that physi-
cal-chemical, water-physical characters of soil im-
prove, a quantity of gross nutrients rises under the in-
fluence of organic and mineral fertilizers in soil profile
(Table-1) as a result of coagulation of dispersion parti-
cles and exchangeable reaction in averagely degraded
soils.
Table 1
Agro-chemical character of the soils in the experimental area (on average in 4-years - 2021-2024) Non-degraded
soils (moderately degraded soils)
Depth,
cm
Humus,%
Total
nitrogen,
%
Nitrogen Phosphorus Potassium
Ph-
water
Ph-
salt
Absorbed
N/NH
3,
mg/kg
Dissolved
N/NH
3,
mg/kg
N/NO
3,
mg/kg
Total
phosphorus,%
Gross
(P
2
0
5
),
mg/kg
Total,
%
Exchangeable,
mg/kg
Non-degraded soils
0-30 2,9 0,16 61,4 12,5 5,4 0,18 113,0 2,54 170,0 5,5 4,6
30-60 2,4 0,12 50,8 10,8 3,8 0,15 114,6 2,28 136,0 5,4 4,6
60-100 1,3 0,10 31,6 5,8 1,5 0,13 98,0 2,65 115,0 5,6 4,7
moderately degraded soils
0-30 1,6 0,08 23,6 7,3 3,2 0,11 72,5 1,55 93,0 5,5 4,2
30-60 1,5 0,06 14,7 5,4 2,8 0,11 34,7 1,57 65,0 6,4 4,0
60-100 1,0 0,05 10,8 4,2 1,6 0,10 24,5 1,43 63,0 6,0 4,5
Table2
Agro-physical character of podzol-clayey-yellow soils (on average in 4-years 2021-2024) Non-degraded soils
(moderately degraded soils)
Section
№
Depth,cm
Bulky weight, g/cm
before cultivation
Bulky
weight,g/cm3
Special
weight, g/cm3 Porosity, %
Non-degraded soils
1
0-30 1,28 1,25 2,45 51,0
30-60 1,44 1,23 2,54 49,0
60-100 1,37 1,26 2,63 47,0
moderately degraded soils
2
0-30 1,47 1,33 2,68 49,5
30-60 1,36 1,30 2,73 48,7
60-100 1,49 1,48 2,80 48,6
This is 1,37-1,28 g/cm3
in non-degraded soils and
1,47-1,49 g/cm3
in averagely degraded soils at 0-30 cm
layer before agro-cultivated soils under tea plant. The
bulky weight rises towards the lower layers. This in-
crease is clearly shown in “B” layer. So, sometimes the
bulky weight vibrates by 1,33-1,48 g/cm3
at 0,6-1 m
depth layer in non-degraded and moderately degraded
soils under tea plant. It is seen from experiments that
the porosity decreased 1,5 %, but the bulky mass in-
creased 0,05 g/cm3
in the sowing layer (0-30 cm) of the
moderately degraded soils compared to degraded soils.
When the structure of fertile soils is higher, the degra-
dation process is poor there.
The water-physical porosity and structure of soil
are closely related to its fertility. The erosion and slid-
ing processes intensify as a result of deterioration of
these indicators [12]. Destruction of the structure under](https://image.slidesharecdn.com/sciencesofeuropeno1472024-240901173407-6df3454c/75/Sciences-of-Europe-No-147-2024-6-2048.jpg)
![Sciences of Europe # 147, (2024) 7
the influence of natural factors or bad cultivation of soil
reduces total porosity. Application of organic fertilizers
mostly affects its porosity [3]. The soil structure, poros-
ity is strongly disturbed as a result of decrease of hu-
mus, organic remnants in the degraded soils. The at-
mospheric waters can’t soak, much water loss occurs,
the plants suffer from drought in such condition. As a
rule, the moisture is lack in the degraded soils. As a re-
sult, the plants can’t use the nutrients in composition of
soil and applied fertilizers in the soil that lacks moisture
[4]. Our experimental versions in some objects of de-
graded clayey-yellow soils indicated that application of
different mechanical, physical-chemical, biological and
hydro-technical methods is important in increase of fer-
tility efficiency of soils. This circumstance in moder-
ately degraded soils is explained that the surplus water
which remained on the soil surface can’t intensively
soak in soil. That’s why claying layer between “B” and
“C” layers is deeply softened with different softeners.
Some researchers [1, 2] widely explained rational-
ity of application of nitrogen fertilizers in the tea plan-
tations with their experiments according to the research
direction. It was determined that ammonium nitrogen is
weakly absorbed in very surplus humid yellow-podzol
soils. Though the absorbing coefficient of nitrogen is
higher than phosphorus and potassium, this index isn’t
more than 40-50%. However, the fertilizers with am-
monium can be leached to a depth of 15-20 cm from the
place of application [5, 11]. But washing of ammonium
nitrogen is weaker in comparison with nitrate nitrogen.
So, nitrate nitrogen is more at 0-16 m layer of these
soils and it gradually rises in July, August and relatively
decreases in September, October and moves to the deep
layers (20-50 cm). Ammoniac nitrogen decreases from
the beginning to the end of vegetation [4]. Special ex-
periments have been performed to study separate appli-
cation dose of nitrogen fertilizers and their ratio to each
other. For this purpose, the stationary experiments were
applied to use norms and ratios of the different kinds of
mineral and organic fertilizers depending on nitrogen
fertilizer norms and improvement of the tea soil fertility
in Lankaran Tea Experimental Farm of the Azerbaijan
Scientific –Research Institute of Fruit-growing and
Tea-growing in 2021-2024. Application of ammonium
fertilizer forms of nitrogen in plants was considered
necessary to intensify nourishment of the plants with
nitrogen in the degraded soils. During the experiment,
application of PK+20 tons of “Lankaran” compost (in
background) in nitrogen fertilizer affects well its root
system and leaf apparatus and was a reason for obtain-
ing of high green tea leaf (Table 3).
Table 3
Impact of different nitrogen forms on productivity of the green tea leaf (Hirkan settlement, non-degraded podzol-
clayey-yellow soils)
№ Variants
Productivity (4 year average)
Productivity, kg/ha
Growth, ha
kg %
1 Control (no fertilizer) 1680 - -
2
P150K120 +20t/ha compost (back-
ground)
3230 1550 92,3
3 background+N100 3820 2140 167,0
4 background+N180 4480 2800 127,4
5 background+N250 5160 3480 207,0
It is seen from Table 4 that this indicator slightly
increased (1870 kg/h) in the “Lankaran” compost
(background) variant with PK+30 tons, if the crop
amount was 1060 kg/h in the control version of moder-
ately degraded soil without fertilizer (1870 kg/h). The
highest yield was obtained in the variant with back-
ground +N250 among the versions with the separate ni-
trogen fertilizer doses. So, the best result was in the var-
iant with background +N250, 3700 kg of yield was ob-
tained from a hectare, and it means an increase of
2640kg or 249.0 % compared to the non-fertilized con-
trol option. Increase of prodductivity in the variant with
250 kg nitrogen is 3480 kg or 20,7% compared to con-
trol option while an annual norm of nitrogen increased
from 100 kg to 250 kg in the non-degraded podzol-
clayey-yellow soils of the Hirkan settlement.
Table 4.
Influence of nitrogen fertilizers with different norms on productivity of the green tea leaves (moderately de-
graded soils, Lankaran Tea branch)
№ Variants
Productivity (4 year average)
Productivity, kg/ha
Growth, ha
kg %
1 Control (no fertilizer) 1060 - -
2 P150K120+30 t/ha compost (background) 1870 810 76,4
3 background +N100 2730 1670 157,5
4 background +N180 3620 2560 241,5
5 background +N250 3700 2640 249,0](https://image.slidesharecdn.com/sciencesofeuropeno1472024-240901173407-6df3454c/75/Sciences-of-Europe-No-147-2024-7-2048.jpg)
![8 Sciences of Europe # 147, (2024)
But it is necessary to note that an efficiency of ni-
trogen fertilizers applied in different doses is various
depending on degrading degree of soils. The 4-year re-
searches indicate that an annual norm of nitrogen (in
phosphorus and potassium background) the moderately
degraded podzol-yellow –clayey soils were provided
with nutrients as a result of denitrification and washing,
the highest additional yield was obtained when an an-
nual norm of nitrogen (in phosphorus and potassium
background) is increased from 100 kg to 250 kg and
250 kg of nitrogen fertilizer is applied per hectare. Ap-
plication of background +N250 of fertilizers in the area
with moderately washed soil increased the productivity
of the green tea leaf 2 times compared to the area with-
out fertilization. It should be noted that the crop ob-
tained from fertilized area was equal to the yield in the
area with unfertilized and unwashed soil. So, while ap-
plying 250 kg of nitrogen per hectare, the yield of the
green tea leaf is 2640 kg (249,0 %) in comparison with
the control and 970 kg more than the variant with 100
kg of nitrogen (Table 4).
Lack of nitrogen,one of the nutrients necessary for
plant development is reason for decrease in productiv-
ity. The plants absorb 50 % of nitrogen in the soil. 25
% of nitrogen evaporates in gaseous form as a result of
denitrification. The rest parts are washed and mix with
underground and surface waters. So, application of 250
kg nitrogen in 1 hectare of old tea plantations in podzol-
clayey-yellow soils of the Lankaran-Astara region sig-
nificantly increases productivity and quality of green
tea leaf yield. The qualitative indicators of the tea plant
also have a great importance along with its productivity
[6, 7]. Nitrogen fertilizer increases productivity of tea
plant and improves its quality. The taste, aroma, etc. of
a low-quality product is low. During the period when
nitrogen was applied against the background of ammo-
nium-sulphate, phosphorus and potassium from ferti-
lizer forms, the calculated dose (N250) in the given op-
tions (Table 5).
From 4-year researches in the podzol-clayey-yel-
low soils it was determined that the qualitative indica-
tors of the crop were in the version with the back-
ground+N250 along with the highest productivity of the
green tea leaf in the non-degraded and moderately de-
graded soils. It can be clearly seen in the variants with-
out fertilizer in the moderately degraded soils and in the
variants with mineral fertilizers (Table 5).
Table 5
Effect of nitrogen fertilizer applied in different norm on the quality of green tea leaf yield. In 4 years moderate.
(Non-degraded soils)
№ Variants Tannin Extractives
1 Control (no fertilizer) 20,3 35,2
2 P150K120+30 t/ha compost (background) 22,7 37,0
3 background +N100 23,4 38,5
4 background +N180 23,5 43,6
5 background +N250 23,7 43,8
It is recommended to apply an effective fertilizer
dose of 260 kg/h to old tea plantations and 180 kg/h ton
young plantations. The researches show that the com-
bined supply of nitrogen to tea plantations against the
background of organic and mineral fertilizers increases
the cold resistance and productivity of the plant. The
general development of the tea plants is provided,
productivity increases while applying 30-40 tons of
manure, nitrogen at the expense of 180 -250 kg of ac-
tive substance and 150 kg of phosphorus, 120 kg of po-
tassium per hectare every 2-3 years. It is considered ap-
propriate to give N250 kg of nitrogen per hectare in pod-
zol-clayey-yellow soils with mechanical content, heavy
granules, and less clay, and N180 kg per hectare in rela-
tively clayey-sandy shales and sandy soils. On the basis
of the experiments it was determined that 180-250 kg
of nitrogen should be applied per hectare while a width
and length of 18-20 old bushes is 80-100 x 100-120 cm.
CONCLUSION
We can come to such conclusion from the per-
formed 4-year researches:
The productivity of plants reduces and crop qual-
ity decreases because the nutrients in the eroded pod-
zol-clayey-yellow soils are washed. Therefore the ap-
plication of mineral and organic fertilizers together is
of great importance in order to restore fertility of
washed podzol-clayey-yellow soils and increase plant
productivity and quality.
If an amount of the yield was 1060 kg/h in the con-
trol variant of moderately degraded soils in the Lanka-
ran tea branch, this index slightly increased (1870 kg/h)
in the variant of PK+30 tons “Lankaran” (background)
compost. The best result among the increase norms of
nitrogen was got 3700 kg yield from each hectare in the
variant of background +N250, this means an increase of
2640 kg or 249,0 % compared to the control option
without fertilizer.
Increase is 3480 kg or 20,7 % compared to the
control variant with nitrogen productivity of 250 kg
while increasing the annual norm from 100 kg to 250
kg per hectare in the non-degraded podzol-gleyey-yel-
low soils of the Hirkan settlement. It is advisable to give
nitrogen fertilizers in the form of ammonium sulphate
in weakly acidic soils with yellow-podzol spread in the
Lankaran zone, where there is a lot of precipitation. So,
30 kg of nitrate nitrogen is washed from each hectare
under an influence of precipitations in these soils. Ap-
plication of nitrogen fertilizers with nitrate to the tea
soils in the terrace sowings isn’t good. On the other
hand tea plantations grown on podzol –yellow and pod-
zol-gleyey-yellow and other types of yellow soils,
which constitute the main soil fund of Lankaran region,](https://image.slidesharecdn.com/sciencesofeuropeno1472024-240901173407-6df3454c/75/Sciences-of-Europe-No-147-2024-8-2048.jpg)

![10 Sciences of Europe # 147, (2024)
ECONOMIC SCIENCES
THEORETICAL APPROACHES ON THE FORMATION OF ELECTRONIC GOVERNMENT
Hajiyev N.
Ph.D. in Economics, Department of Digital Technologies and Applied Informatics, Azerbaijan State Uni-
versity of Economics, Baku, Azerbaijan
DOI: 10.5281/zenodo.13382520
ABSTRACT
The article discusses the study of theoretical approaches on the stages of electronic government development.
For this purpose, the approaches of native and foreign scientists have been analyzed in the research work. Also,
the results of the research of some presitigious international organizations regarding the development stages of e-
government and the factors affecting its formation have also been investigated. The important mechanisms of e-
government technologies have been listed, as well as the advantages obtained due to the operation of e-government
are summarized.
Keywords: E-government, ICT, state, stage, network, service.
Introduction
In the modern world we live in one of the main
directions in public administration is e-government. At
this time of rapid development of ICT e-government
has a great importance in the realization of the necessity
of reconstruction of mutual relations between states and
citizens. Thus, this process ensures people with effi-
cient and accessible services provided by government.
At the same time, application of ICT and its widespread
usage increases transparency, accountability and citi-
zen participation in public administration.
Theoretical approaches on the formation of e-
government
E-government has gone through several stages in
order to reach its current level. Different approaches
have been proposed regarding the number and types of
these stages. We are going to analyze ideas of native
and foreign scientsts:
A.D.Huseynova assumes that electronic govern-
ment goes through 4 stages in its evolution process: ex-
istence stage, interactive stage, transaction stage and re-
newal stage [4, p.69].
Other scientists also present four-stage model in
the formation process of e-government: information
placement stage, feedback-interactive interaction stage,
transaction stage and transformation stage of state
structure [12; 14].
However, G.A.Kulkayev and his coauthors
claim 6 stages in the process of electronic government
formation:
✓ formation of information portals in public ad-
ministration;
✓ creation of state-population, state-business
and state-state communication channels;
✓ automation of the process of providing public
services;
✓ ensuring the work of state data processing cen-
ters;
✓ application of big data analysis system for pre-
diction and planning of development;
✓ gradual transfer of decision-making authori-
ties on simple issues to the neural network [6, p.9].
According to the approach of other researchers,
the formation of e-government takes a long time and
this process goes through 4 stages [21, p.158]:
the first stage covering the years 2000-2005.
In this period, electronic government is reflected in the
network as a state. At this stage all the information
needed by the citizens is placed on the state websites.
Services to the population are provided offline with
minimal use of ICT.
the second stage covering the years 2005-
2010. In this period electroniv government gradually
moves to the second stage. At this stage, mutual rela-
tions between citizens and government bodies are per-
formed online, the use of ICT is expanding, interaction
is carried out through e-mail and special state websites.
Documentation is done electronically, but most govern-
ment services are provided using the old model. It is for
the reason that citizens are just beginning to use new
technologies.
the third stage covering the years 2010-2012.
Electronic government is more represented in the net-
work, most services are provided online, electronic au-
thentication is emerging.
the fourth stage covering the years 2012-2015.
At this stage transformation of a complex system
emerges, an all-encompassing government is estab-
lished and services to the population are served via a
single site by several departments and gradually trans-
forming according to the network principle [11,
pp.120-135].
World experience shows that the sequence of these
stages is not required in the establishment of electronic
government.
The researches of a several prestigious interna-
tional organizations regarding the development stages
of e-government, as well as the factors affecting its for-
mation are of great improtance.
According to the version by the United Nations
(UN), 5 stages are distinguished in the evolution pro-
cess of electronic government. These are: Emerging
Presence, Enhanced Presence, Interactive Presence,
Transactional Presence and Networked Presence
stages.
In the stage of Emerging Presence, the work of
state structures is one-sided, citizens provided by the
information even in a limited form. Information is not
transferred from citizens to state structures. Limited in-
formation is displayed on rarely updated websites. Var-
ious ministries and organizations create information](https://image.slidesharecdn.com/sciencesofeuropeno1472024-240901173407-6df3454c/75/Sciences-of-Europe-No-147-2024-10-2048.jpg)
![Sciences of Europe # 147, (2024) 11
pages where they place information about themselves.
At this stage, portals created by state bodies are not
combined into a single portal.
In the stage of Enhanced Presence documents and
normative acts posted on the created sites can be ob-
tained.
In the stage of Interactive Presence it is possible
to transfer protected files and establish mutual relations
with citizens. It becomes possible to use e-mail and
electronic digital signature. The sites are updated regu-
larly.
In the stage of Transactional Presence online
transactions are carried out, including issuing docu-
ments, payments, etc.
In the fifth stage called Networked Presence ser-
vices are integrated to provide knowledge, information
and services, as well as forums, surveys and consulta-
tions with citizens can be conducted online [20, p.13].
Scientific researches conducted by the UN, the
World Bank (WB), the Organization for Economic Co-
operation and Development (OECD) and other interna-
tional organizations on the development of e-govern-
ment have revealed the important role of a number of
factors. Conventionally, these factors can be divided
into 5 groups [1, pp.347-348]:
1. The first group of factors characterizes the
characteristics of technical development. Security, pri-
vacy and infrastructure status are among these men-
tioned features. It is the success of economic and tech-
nological development that creates the basic conditions
for the formation of e-government.
As a result of one of the studies based on the eval-
uations conducted by applying the correlation method
in the sample of 150 countries, it was concluded that
there is a positive and close relationship between the
online services index, which measures the quality of
services provided by the state, and the Electronic par-
ticipation index, which studies the level of use of elec-
tronic services by the population. Based on the analysis,
it can be concluded that the countries with a high score
in the online services index have a strong online service
infrastructure. In order to improve provision of services
by governments digital technologies are widely used in
the developed countries (eg. Finland, the USA, Japan,
Estonia, South Korea, Singapore, New Zealand, Aus-
tralia).
However, at the current development stage of dig-
ital transformation there are still countries that can not
provide accessible, secure services and they can not
provide people with the effectively useage of digital
technologies. These are mainly underdeveloped, poor
countries with a low standard of living (for example,
Somalia, Afghanistan, the Democratic Republic of the
Congo, Sudan, the Democratic People’s Republic of
Korea, the Central African Republic, Eritrea) [16,
pp.42-43; p.55].
2. The second group of factors includes financial
resources. Design and implementation of many projects
related to technological development, especially large-
scale reforms, mainly depends on technological possi-
bilities. Thus, there is a positive correlation between the
level of countries’ income and the Electronic Govern-
ment Development Index (EGDI): the EGDI index of
high-income countries is higher than of low-income
countries [9, p.13].
Some researchers also [5, pp.31-52; 19, p.429]
note the correlation between country’s economic devel-
opment and the level of development of e-government.
However, “even countries with limited resources can
succeed in the development of e-government and
providing online services if they are supported in other
ways (for example, by wise leadership, a favorable po-
litical environment or by international cooperation)” [9,
p.24]. Even in countries with a low Online Service In-
dex (OSI) there is progress in the provision of these ser-
vices. Thus, the number of online services provided in
countries with a low OSI level increased from 1in 2018
to 4.5 in 2022. In these countries mainly 5 services are
provided online: registering a business, applying for a
building permit, applying for a birth, death or marriage
certificate [10, p.26].
Liu Zhenmin, Deputy Secretary General of the UN
notes that, although the e-government development rat-
ing correlates with a country’s income level, financial
resources are not the only factor. Here, of course, stra-
tegic leadership and commitment to advanced elec-
tronic services is of great importance [10].
3. The third group includes organizational-man-
agement factors. Thus, support of a high-level manage-
ment hierarchy, resistance to the transition to electronic
forms at work, or a favorable attitude, the presence of
professional staff and trainers, an ideal infrastucture of
mutual relations and general management principles
between agencies and departments, etc. such issues be-
long to this group.
4. The fourth group includes social and socio-cul-
tural factors. These factors indicate the possibilities of
using electronic services by groups with different inter-
ests and by numerous people. Factors included into this
group reflect people’s cultural level, differences in in-
come and education, the presence or absence of “digital
divide”, and misunderstanding of consumer needs and
expectations.
As the UN Deputy Secretary-General Li Junhua
noted, “in connection with the COVID-19 pandemic, in
the last two years, 90% of member states have created
special portals for the provision of public services and
problem solving or have reserved space on their na-
tional portals” [10]. The COVID-19 pandemic has
shown the current state of affairs in this field as litmus
paper, once again proving that e-government plays an
important role in providing public services and innova-
tion services. For all these reasons, in modern times, the
application of innovation methods in healthcare, online
education, employment and communication (contact)
issues in regulation and solution is increasing year by
year [10].
5. The fifth group includes factors that indicate the
characteristics of political institutions and government
organizations. It is political institutions and govern-
ment organizations that determine the openness or
closeness of the decisions made, the accountability of
the government and whether it helps or hinders devel-
opment. This group of factors shows the quality of pub-
lic sphere regulation and state self-management. It is
these last two factors that allow determining the per-
spective of the development of e-government.](https://image.slidesharecdn.com/sciencesofeuropeno1472024-240901173407-6df3454c/75/Sciences-of-Europe-No-147-2024-11-2048.jpg)
![12 Sciences of Europe # 147, (2024)
Although the role of these factors mentioned
above in the formation of e-government is clearly visi-
ble, in this field there are a number of other factors of
importance which are neglected. For instance, state
structure and degree of centralization. Thus, the most
developed countries (for example, Denmark, Estonia,
the Republic of Korea, Singapore) in the establishment
of e-government are not very large, and they are unitary
and highly technologically developed countries.
However, in countries with federal governance
and significant decentralization these processes are
slow and complicated for a number of reasons: agreeing
on decisions on e-government requires additional ef-
forts and time, interactions between different bodies of
government, as well as a number of issues need to be
agreed at all levels. Such factors have led to relatively
slow formation of e-government in a highly developed
country like Germany. However, the high level of e-
government in federal countries like the USA and Aus-
tralia show that this factor does not always play a deci-
sive role [1, p.348].
It should be noted that the influence of countries’
political regimes and level of democracy on the for-
mation of e-government is not entirely clear. Surely, in
the establishment of e-government successful results
are achieved in democratic countries. Hence, in these
countries the authorities prefer transparent and interac-
tive relations with citizens in their interactions. How-
ever, in the last decade even in countries with autocratic
regime, technological innovation in governance and ad-
ditional tools in the fight against corruption are used.
Normally, China and the Persian Gulf countries are set
as an example in the rapid development of e-govern-
ment [17, p.554].
Advantages of e-government
Several important mechanisms of e-government
technologies attract attention:
➢ The first is the formation of electronic docu-
ment circulation. Establishment of electronic manage-
ment system-IDM (Integrated Document management)
with the help of technologies.
➢ The second is establishment of a single au-
thentication and authorization system that gives equal
rights to all electronic government participants.
➢ The third is stimulating citizen initiative and
citizen participation in the development and implemen-
tation of state decisions and creating an appropriate
platform.
➢ The fourth is forming an all-encompassing
government that provides public services through a sin-
gle window. The single portal is one of the most im-
portant successes of e-government [3].
Summarizing the results of some researchers,
it is possible to group the advantages of electronic gov-
ernment as follows:
❖ effective operation of executive bodies in-
creases; administrative and industrial delays related to
state apparatus are reduced; expenses spent on inter-or-
ganizational interactions are reduced; the transparency
of information within the bureaucratic system increases
and due to the eliminitaion of “ring” reduncancy the in-
tra-organizational opportunism of employees disap-
pears; speed of reaction of the bureaucratic apparatus to
the needs of the society increases; management adapts
to internal and external conditions and becomes more
flexible, paper workflow is replaced by electronic cir-
culation;
❖ the quality of services provided to the popula-
tion and business increases significantly. Internet tech-
nologies reduce transaction delays of population and
businesses in services received from government or-
ganizations. Also, increasing the speed and the quality
of gathering information about consumers’ needs lead
to the success in this field;
❖ The efficiency of the ownership activity of the
population and business increases and the cost of infor-
mation decreases. Information asymmetry causes inter-
vals in the market-based economy. That is why one of
the important tasks of government bodies in the terms
of the concept of e-government is to help businesses by
increasing the transparency of information about the
quality of services and goods for all interested parties.
One of the important issues is to create information re-
sources for the state, to provide population and business
with the necessary information;
❖ in order to create public welfare in the society
citizens’ participation is ensured;
❖ unlimited access to the servers at any time of
the day;
❖ online multi-channel accessibility through
various platforms (computer, smartphone, TV) and
technologies (internet, mobile communication) is avail-
able;
❖ secure usage – data protection, verification of
the user’s data, the possibility of stable feedback;
❖ It is possible by the user transparently control
the personal data submitted to the standard procedure;
❖ easy handling – getting important information
conveniently and convenient communication with offi-
cials is provided;
❖ reduction of corruption occurs due to the min-
imization of communication with service officials and
intermediaries;
❖ automation of service provision processes, in-
creasing efficiency of service providers’ activities;
❖ citizens’ desire to participate in public admin-
istration increases;
❖ the relations between government and citizens
are improving at a radical speed;
❖ people’s satisfaction with public services in-
creases;
❖ accessibility to public services by enterprises
and population increases;
❖ the population’s trust in government in-
creases;
❖ government institutions increase transparency
and accountability in decision-making;
❖ the improvement of management mechanisms
helps to realize upcoming economic and political goals;
❖ supports the realization of reforms imple-
mented in the country;
❖ integration of technologies, information and
knowledge improves the existing system of internal
networks between the state and society, builds new
multiple communication networks;
❖ helps to achieve success in the areas such as
health, education, security and social insurance;
❖ also, ICT is expanding to cover all areas of so-
cial life [4, pp.69-70; 2, pp.104-109; 8, p.26; 7, p.1504;
13, pp.449-450].](https://image.slidesharecdn.com/sciencesofeuropeno1472024-240901173407-6df3454c/75/Sciences-of-Europe-No-147-2024-12-2048.jpg)
![Sciences of Europe # 147, (2024) 13
It should be noted that, efficiency of provided pub-
lic services has a positive effect on the potential of e-
government, and the usefulness of e-services is the
most important indicator of the efficiency of e-govern-
ment [18, pp.303-311].
Researches conducted in 191 countries show that,
e-government increases the efficiency of national gov-
ernment and strengthens the fight against corruption
[15, pp.155-173].
Conclusion
On the whole, I would like to conclude that the
purpose of the article is to analyze theoretical attitudes
towards the formation of e-government and to research
various theories and opinions in this field. The theoret-
ical views included in the research, explain various as-
pects and goals of the formation of e-government. In
the article, the stages of e-government development and
advantages obtained as a result of e-government opera-
tion were discussed. The stages of e-government devel-
opment represent the evolution of services provided by
the government through ICT.
References
1. Авдонин В.С., Мелешкина Е.Ю. Электрон-
ное правительство: от сервисных технологий к но-
вой парадигме управления // Политическая экспер-
тиза: ПОЛИТЭКС. 2021. Т.17. №4. с.341-359.
[https://doi.org/10.21638/spbu23.2021.402].
2. Бачило И.Л. Электронное правительство и
инновации в области государственных функций и
государственных услуг // Электронная Россия: про-
блемы и суждения. 2019. №1. с.104-109.
3. Беденкова А.С. Цифровое правительство
как концептуальное развитие электронного прави-
тельства // Полилог/Polylogos. 2021. T.5. №3. [URL:
https://polylogos-journal.ru/s258770110015808-0-1/.
DOI: 10.18254/S258770110015808-0].
4. Гусейнова А.Д. Тенденции развития элек-
тронных услуг. Science, Technologies, Innovations.
2019, №4, с.68-74.
[http://nti.ukrintei.ua/?page_id=2421&lang=en].
5. Добролюбова Е.И. Оценка цифровой зре-
лости государственного управления. Информаци-
онное Общество. 2021. №2. с.31-52.
[http://WWW.INFOSOC.IIS.RU].
6. Кулькаев Г.А., Мозалева Н.И., Леонтьев
Д.Н. Анализ отечественного и зарубежного опыта
проектного управления в сфере реализации концеп-
ции электронного правительства. Государственное
управление. Электронный вестник. Выпуск №92.
Июнь 2022. с.7-23.
[https://spajournal.ru/index.php/spa/article/view/205].
7. Макушова О.М. Положительный опыт и
проблемы функционирования электронного прави-
тельства в России. Вопросы Инновационной Эко-
номики. Т.10 №3, Июль-сентябрь. 2020. ISSN 2222-
0372. Russian Journal of Innovation Economics,
с.1495-1508.
8. Малик Е.Н., Шедий М.В., Пикалов Б.В.
«Электронное правительство» как интегративная
платформа предоставления государственных услуг
// Управленческое консультирование. 2020. №9. с.
19-30. [DOI 10.22394/1726-1139-2020-9-19-30].
9. ООН. Электронное Правительство 2020.
Цифровое правительство в десятилетии действий
по достижению устойчивого развития. Нью-Йорк.
2020. 324 с.
[https://publicadministration.un.org/egovkb/Portals/eg
ovkb/Documents/un/2020-Survey/2020%20UN%20E-
Government%20Survey%20-%20Russian.pdf].
10. ООН. Электронное Правительство 2022.
Будущее Цифрового Правительства. Нью-Йорк.
2022. 280 с.
11. Павлютенкова М.Ю. Электронное прави-
тельство vs цифровое правительство в контексте
цифровой трансформации // Мониторинг обще-
ственного мнения: Экономические и социальные
перемены. 2019. №5. с.120-135.
12. Стырин Е.М. Электронное правительство:
стратегии формирования и развития: диссертация.
кандидата социологических наук: 22.00.08. Москва,
2006. 164 с.
[https://www.dissercat.com/content/elektronnoe-
pravitelstvo-strategii-formirovaniya-i-razvitiya].
13. Тагаров Б.Ж. Aнализ современного состоя-
ния электронного правительства в Pоссии. Т.12,
№4, апрель, 2018. Journal of Creative Economy,
с.447-458.
14. Accenture. eGovernment Leadership – Realizing
the Vision//The Government Executive Series, April
2002, 88 p. [https://afyonluoglu.org/PublicWeb-
Files/eGovBenchmark/ACC/2002-Accenture.pdf].
15. Chen L., Aklikokou A.K. Relating e-govern-
ment development to government effectiveness and
control of corruption: a cluster analysis // Journal of
Chinese Governance. 2019. №6(1). pp.155-173.
16. Fataliyeva G. Digital transformation in Azer-
baijan – 2023 Bulletin. Baku, 2024. “Science and
Knowledge” publishing house. 64 p. [https://econom-
ics.org.az/administrator/uploads/media/Gulya-
bul2024.pdf].
17. Kneuer M., Harnisch S. Diffusion of e-gov-
ernment and e-participation in democracies and autoc-
racies // Global Policy Journal. 2016. Vol.7, №4.
pp.548-556.
18. Mensah I.K. Impact of Government Capacity
and E-Government Performance on the Adoption of E-
Government Services // International Journal of Public
Administration. 2019. №43(4). pp.303-311.
19. Osman I.H., Zablith F. Re-evaluating elec-
tronic government development index to monitor the
transformation toward achieving sustainable develop-
ment goals. Journal of Business Research, Volume 131,
July 2021. pp.426-440.
20. UN Global E-Government Survey 2003. 112
p. [https://www.un-ilibrary.org/con-
tent/books/9789210041614].
21. Veit D., Huntgeburth J. Foundations of digital
government: Leading and Managing in the Digital Era.
Springer Verlag, 2014. 158 p.](https://image.slidesharecdn.com/sciencesofeuropeno1472024-240901173407-6df3454c/75/Sciences-of-Europe-No-147-2024-13-2048.jpg)


![Sciences of Europe # 147, (2024) 17
MEDICAL SCIENCES
PROTON PUMP INHIBITORS IN CHILDREN WITH GASTROESOPHAGEAL REFLUX DISEASE
Bodnar G.
Bukovinian State Medical University, Professor, MD, Professor
Bodnar O.
Bukovinian State Medical University
Doctor-intern of the department of anesthesiology and resuscitation
DOI: 10.5281/zenodo.13382560
ABSTRACT
Gastroesophageal reflux disease is a prevalent condition in pediatric patients, characterized by the backward
flow of stomach contents into the esophagus, leading to symptoms such as heartburn and regurgitation. Proton
pump inhibitors are widely used in the management of gastroesophageal reflux disease in children due to their
effectiveness in reducing gastric acid production and promoting esophageal healing. This review summarizes the
current literature on the use of proton pump inhibitors s in pediatric gastroesophageal reflux disease over the past
decade, focusing on their mechanism of action, pharmacokinetics, efficacy, safety concerns, and clinical guide-
lines. While proton pump inhibitors are effective in controlling symptoms and improving esophageal health, their
long-term use is associated with potential risks, including respiratory infections, gastrointestinal infections, and
nutrient malabsorption. The article emphasizes the importance of individualized treatment plans, cautious use, and
regular monitoring to optimize the benefits of proton pump inhibitors therapy while minimizing potential adverse
effects in pediatric patients. Future recommendations include personalized dosing, exploring alternative therapies,
and ongoing research into the long-term safety of proton pump inhibitors in children.
Keywords: gastroesophageal reflux disease, proton pump inhibitors, children.
Gastroesophageal reflux disease (GERD) is a
common condition in pediatric patients, characterized
by the backflow of stomach contents into the esopha-
gus, causing symptoms such as heartburn, regurgita-
tion, and discomfort. Proton pump inhibitors (PPIs)
have become a mainstay in the management of GERD
in children due to their efficacy in reducing gastric acid
production. This review aims to summarize the current
literature on the use of PPIs in pediatric GERD over the
past decade.
Mechanism of action and pharmacokinetics. PPIs
function by irreversibly inhibiting the hydrogen-potas-
sium ATPase enzyme system (proton pump) in the gas-
tric parietal cells, thereby reducing acid secretion. This
class of drugs includes omeprazole, esomeprazole, lan-
soprazole, and pantoprazole. The pharmacokinetics of
PPIs can vary in children due to differences in metabo-
lism, with factors such as age, weight, and genetic pol-
ymorphisms playing a role in drug efficacy and safety
[2, p. 77; 4, p. 263].
Efficacy of PPIs in pediatric GERD. Several stud-
ies have evaluated the efficacy of PPIs in treating
GERD symptoms in children. A meta-analysis by
Tighe et al. (2014) found that PPIs significantly im-
prove symptom control and esophageal healing com-
pared to placebo [8, p. e1123]. Moreover, a randomized
controlled trial by Omari et al. (2015) demonstrated
that children treated with omeprazole showed greater
improvement in esophageal pH levels compared to
those receiving H2-receptor antagonists [3, p. 727; 5, p.
6671; 6, p.517].
Safety concerns and adverse effects. Despite their
efficacy, long-term use of PPIs in children has raised
safety concerns. Prolonged PPI therapy has been asso-
ciated with an increased risk of respiratory infections,
gastrointestinal infections, and nutrient malabsorption,
particularly calcium, magnesium, and vitamin B12
(Yang & Chen, 2017). A study by Malchodi et al.
(2019) also indicated a potential association between
PPI use in infancy and an increased risk of bone frac-
tures later in childhood [1, p. 71; 10, p. 10; 7, p. 524].
Clinical guidelines recommend the cautious use of
PPIs in pediatric patients, emphasizing the importance
of accurate diagnosis and appropriate dosing. Accord-
ing to the North American Society for Pediatric Gastro-
enterology, Hepatology, and Nutrition (NASPGHAN),
PPIs should be prescribed for the shortest duration nec-
essary, and their use should be re-evaluated regularly
(Vandenplas et al., 2018) [9, p. 516-519].
In the current stage of medical advancement,
where treatment approaches are becoming increasingly
personalized, the development of guidelines for the use
of proton pump inhibitors (PPIs) in children is of par-
ticular importance. This relevance is underscored by
several key factors.
High prevalence of GERD in children. GERD is
one of the most common gastrointestinal issues in pe-
diatrics. Considering that this condition can signifi-
cantly impact a child’s quality of life and lead to serious
complications, effective and safe treatment is crucial.
Effectiveness of PPIs: PPIs have long proven their
effectiveness in treating GERD, especially in cases
where other therapies have not produced the desired re-
sults. They reduce the acidity of gastric juice, which
helps heal the esophageal lining and alleviate the symp-
toms of the disease.
Risks associated with long-term use. In recent
years, there has been growing concern about the poten-
tial risks of long-term PPI use, particularly in children.
Studies indicate a link between prolonged PPI therapy
and adverse outcomes such as respiratory infections, in-
testinal dysbiosis, impaired absorption of micronutri-
ents (e.g., calcium and magnesium), and an increased
risk of bone fractures. These findings underscore the](https://image.slidesharecdn.com/sciencesofeuropeno1472024-240901173407-6df3454c/75/Sciences-of-Europe-No-147-2024-17-2048.jpg)


![Sciences of Europe # 147, (2024) 23
INFLUENCE OF VAZAVITAL ON INDICATORS OF COGNITIVE FUNCTIONS IN PATIENTS
WITH DYSCIRCULATORY ENCEPHALOPATHY
Zhukovskyi O.
MD, PhD
Bukovinian State Medical University, Chernivtsi, Ukraine
DOI: 10.5281/zenodo.13382570
ABSTRACT
The influence of the drug "Vazavital" on the indicators of cognitive functions in patients with dyscirculatory
encephalopathy stage II was studied. It was established that after the treatment, the severity of subjective and
objective neurological symptoms in patients decreased, the indicators of attention and working memory probably
improved. The data of clinical observations and neuropsychological testing were confirmed by the results of an
electrophysiological study - cognitive evoked potential P300.
Keywords: vascular encephalopathy, vazavital, cognitive functions.
Introduction. Changes in higher brain functions in
patients with cerebrovascular insufficiency are consid-
ered to be one of the most reliable clinical criteria for
the diagnosis of various, especially early, stages of
dyscirculatory encephalopathy (DE). The pathological
process in DE is not clinically manifested as an isolated
complex of neurological and neuropsychological syn-
dromes, some of them may remain subclinical until a
certain time, being detected only when special tests and
samples are used [8]. Vascular damage to the brain
leads to a significant decrease in cognitive functions,
and in the later stages, the ability to self-care of patients
can also be impaired [3]. Chronic cerebrovascular in-
sufficiency is accompanied by hypoxia and a change in
the energy level of processes that store and reproduce
information, which causes memory impairment.
Memory impairment is one of the earliest and cardinal
symptoms of DE. The neuropsychological defect in
early DE is, as a rule, partial, and only separate pages
of mental activity (cognitive, intellectual, affective
sphere, etc.) are used. It is at this stage of the disease
that the directed medicinal action can be particularly ef-
fective and cause compensation of the defect [3].
An objective criterion for assessing impairment of
higher brain functions is a neurophysiological study, in-
cluding the method of evoked potentials (EP). The fea-
sibility of using the EP method in the comprehensive
examination of patients with DE is justified by the fact
that a decrease in cerebral blood flow and fully progres-
sive ischemia of the brain can accompany changes in
afferent conduction and indicators of EP. Cognitive, or
endogenous, event-related potentials reflect electrical
processes that are caused by the brain's own activity,
mental cognitive functions: expectation, recognition,
memory, information processing, decision-making,
choice, etc. Cognitive potentials reflect the higher brain
integrative processes of central processing of infor-
mation and are objective indicators of the mechanisms
of impairment of mental functions in a person [4].
For the purpose of complex pathogenetic correc-
tion of ischemic damage in DE, a large number of var-
ious drugs are used (antiaggregants, neuroprotective
agents, nootropics, angiоprotectors, neurotrophic fac-
tors, etc.) [9]. However, an additional task of treatment
tactics is to limit polypharmacy, it is desirable to use
drugs with a complex, versatile mechanism of action
that can effectively affect various pathogenetic links.
Among such drugs is Vazavital - a complex cytoprotec-
tor consisting of natural metabolites of substances and
vitamins, containing nicotinic acid (niacin, vitamin B3,
vitamin PP), riboflavin (vitamin B2), pollen, pyridox-
ine (vitamin B6), rutin, thiamine (vitamin B1), ascorbic
acid (vitamin C) and ginkgo biloba leaves, with antihy-
poxemic, antioxidant, neuro- and energy-protective ef-
fects. To date, the effectiveness of vazavital in patients
with acute vascular pathology has been more studied,
there is limited data on its effect on cognitive functions
in patients with chronic insufficiency of cerebral circu-
lation.
The purpose of the study. To study the effect of
vazavital on the indicators of cognitive functions in pa-
tients with DE II stage.
Materials and methods. An examination of 28 pa-
tients with DE stage II, which developed against the
background of cerebral atherosclerosis (CA) and the
combination of CA with hypertension aged 52 to 72
years, was conducted. The diagnosis of DE was made
according to the classification of vascular diseases of
the brain [6]. Patients with gross motor or sensory dis-
orders, with severe somatic diseases, with other clini-
cally significant neurological or mental diseases were
not included in the study. The patients were not pre-
scribed other drugs that affect cognitive functions (cen-
tral cholinesterase inhibitors, nootropics).
All patients were randomly divided into two
groups. 12 patients of the I group received standardized
medical treatment without the use of nootropic drugs,
and 16 patients of the II group received Vazavital in a
dose of 1 capsule 3 times a day for 2 months. All pa-
tients were examined for their neurological status using
a score. The neuropsychological study included: the
study of attention using the "Searching for numbers ac-
cording to Schulte's tables" technique with an assess-
ment of the task completion time; research of mental
capacity according to the "Serial Score 100-7" method
with an assessment of the test execution time and the
number of errors; memory research using the "Memo-
rization of ten words" method [5].
The state of cognitive evoked potentials was stud-
ied with the help of the multifunctional computer com-
plex "Neuro-MVP". The electrodes were located ac-
cording to the international "10-20" scheme. For the
study of cognitive EPs, the subjects were instructed to
count the number of "significant" stimuli (sound signals
with a tone frequency of 2000 Hz and a probability of
delivery of up to 30%), not paying attention to "insig-
nificant" ones with a tone frequency of 1000 Hz and a
probability of delivery of 70% or more. When obtain-
ing the results, the shape of the curve, the presence of](https://image.slidesharecdn.com/sciencesofeuropeno1472024-240901173407-6df3454c/75/Sciences-of-Europe-No-147-2024-23-2048.jpg)

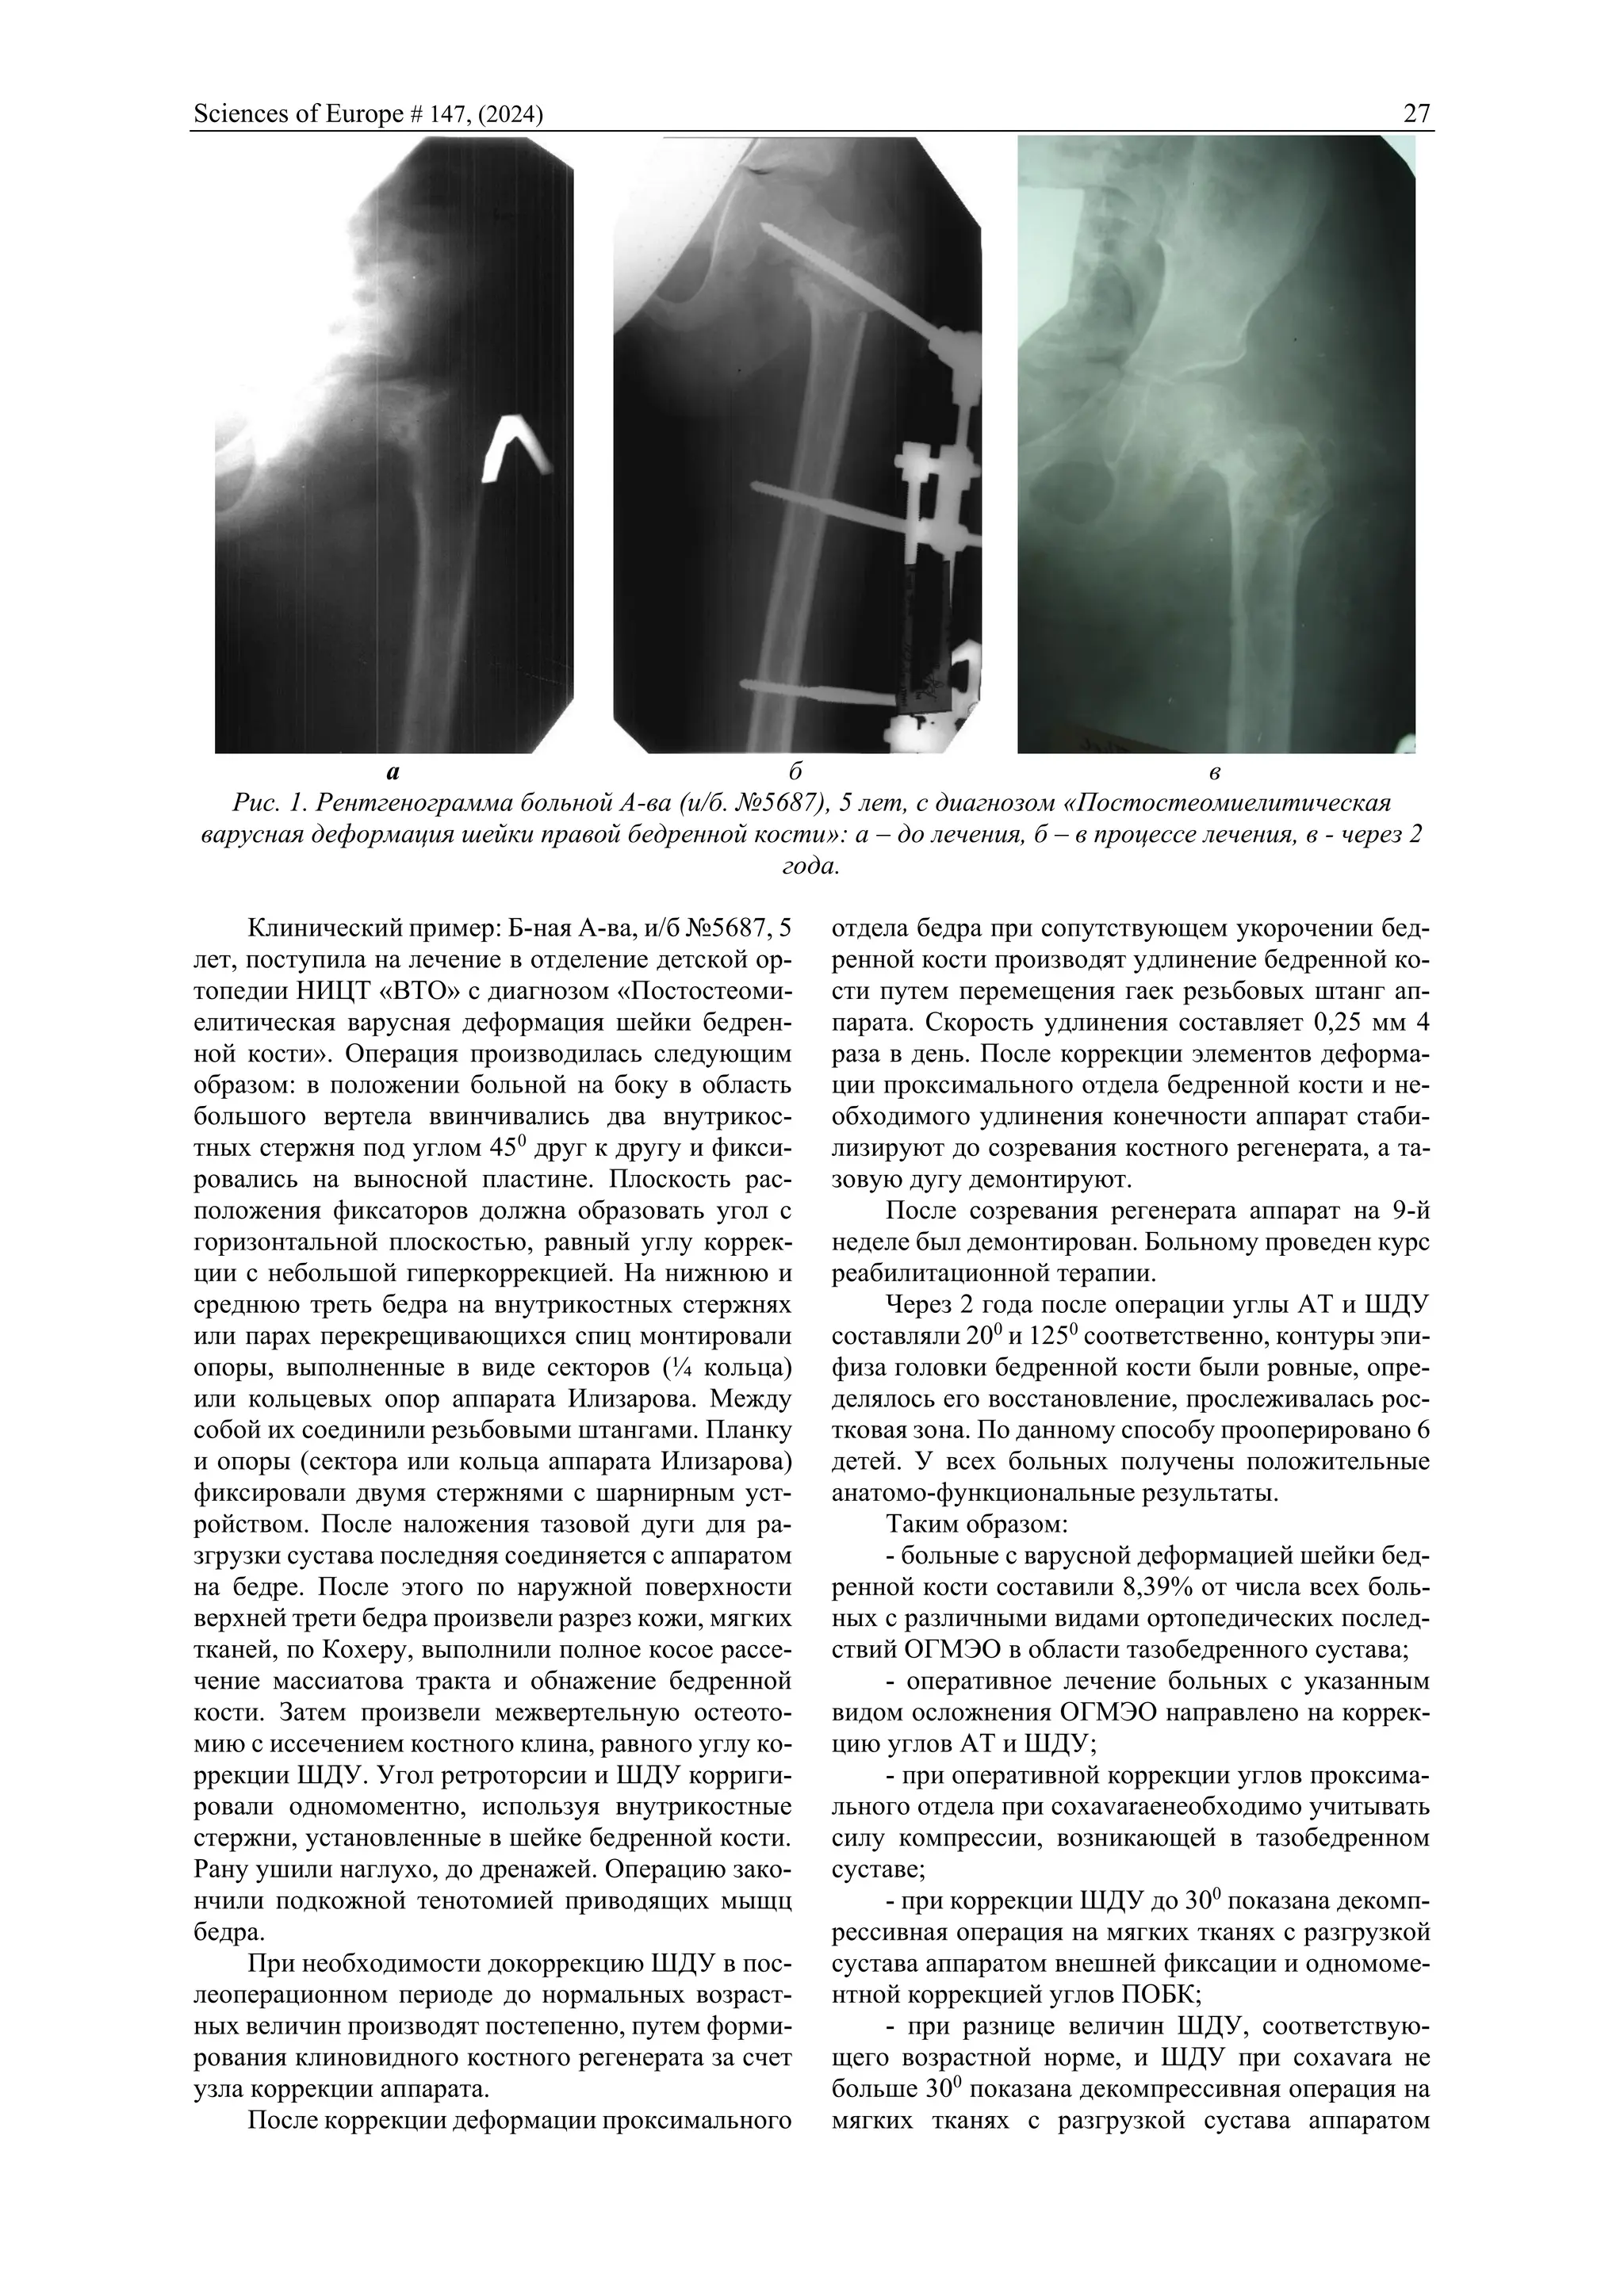
![26 Sciences of Europe # 147, (2024)
величин ШДУ, соответствующего возрастной норме, и ШДУ при coxavaraeбольше 300
показана декомп-
рессивная операция на мягких тканях с разгрузкой сустава аппаратом внешней фиксации, наложением
тазовой опоры и постепенным формированием углов ПОБК.
ABSTRACT
Patients with varus deformity of the femoral neck accounted for 8.39% of all patients with various types of
orthopedic consequences of acute hematogenous metaepiphyseal osteomyelitis (OGMEO) in the hip joint area.
Surgical treatment of these patients with this type of complication of OGMEO is aimed at correcting the angles of
AT and SDU, and when surgically correcting the angles of the proximal section in coxa varae, it is necessary to
take into account the force of compression occurring in the hip joint. Thus, when correcting the SDU up to 300,
decompressive surgery on soft tissues is indicated with unloading of the joint with an external fixation device and
simultaneous correction of the angles of the side. When the difference in the values of the SDU corresponding to
the age norm and the SDU with coxa varae is greater than 300, decompressive surgery on soft tissues is indicated
with the unloading of the joint with an external fixation device, the imposition of pelvic support and the gradual
formation of lateral angles.
Ключевые слова: варусной деформации шейки бедренной кости, аппарат Илизарова, тазовая опора,
ортопедических последствий, острый гематогенный метаэпифизарный остеомиелит, шеечно-диафизарный
угол (ШДУ).
Keywords: varus deformity of the femoral neck, Ilizarov apparatus, pelvic support, orthopedic consequences,
acute hematogenous metaepiphyseal osteomyelitis, cervical-diaphyseal angle (SDU).
Основным биомеханическим нарушением при
варусной деформации шейки бедренной кости яв-
ляется уменьшение шеечно-диафизарного угла, что
служит причиной относительного укорочения ко-
нечности, недостаточности ягодичных мышц и не-
правильной установки головки во впадине. Дефор-
мация шеечно-диафизарной области проксималь-
ного отдела бедра и связанная с этим децентрация
головки бедренной кости в вертлужной впадине яв-
ляются причиной развития деформирующего арт-
роза [1, с. 18]. Кроме уменьшения ШДУ при варус-
ной деформации после перенесенного остеомие-
лита возникает торсионная патология в виде
отклонения головки кзади от фронтальной плоско-
сти. После исправления варусной деформации
бедра наличие избыточного угла ретроверсии или
ретрофлексии приводит к недостаточности отводя-
щих мышц бедра [2, с. 154]. Кроме этого, при опе-
ративной коррекции углов проксимального отдела
при coxavaraeнеобходимо учитывать силу компрес-
сии, возникающей в тазобедренном суставе. Это
объясняется тем, что при формировании coxavarae
наступает ретракция почти всех групп тазобедрен-
ных мышц вследствие сближения их точек при-
крепления. Поэтому вмешательство по коррекции
углов ПОБК дополняется подкожной тенотомией
приводящих мышц бедра и рассечением массиа-
това тракта [2, с. 178]. Если разница величин ШДУ,
соответствующего возрастной норме, и ШДУ при
coxavara нe больше 300
, то декомпрессивная опера-
ция на мягких тканях дополняется разгрузкой су-
става аппаратом внешней фиксации с наложением
тазовой опоры. Это особенно необходимо, если в
остеомиелитический процесс вовлекалась (кроме
ПОБК) вертлужная впадина, с осложнением в виде
её скошенности при ацетабулярном индексе более
250
ввиду возникновения вывиха бедра при коррек-
ции ШДУ.
Применяемый в настоящее время накостный
остеосинтез при лечении coxavaraeявляется в боль-
шинстве своем травматичным и достаточно слож-
ным, требующим значительного отслоения
надкостницы, широкого разреза мягких тканей, по-
вторных операций для удаления металлофиксато-
ров, длительной гипсовой иммобилизации.
В отделении детской ортопедии и травматоло-
гии травмцентра ГАУЗ РКБ МЗ РТ для лечения ука-
занных больных применяется чрескостный остео-
синтез как аппаратами Илизарова, так и аппаратами
стержневой фиксации (рис. 1 а, б, в).](https://image.slidesharecdn.com/sciencesofeuropeno1472024-240901173407-6df3454c/75/Sciences-of-Europe-No-147-2024-26-2048.jpg)


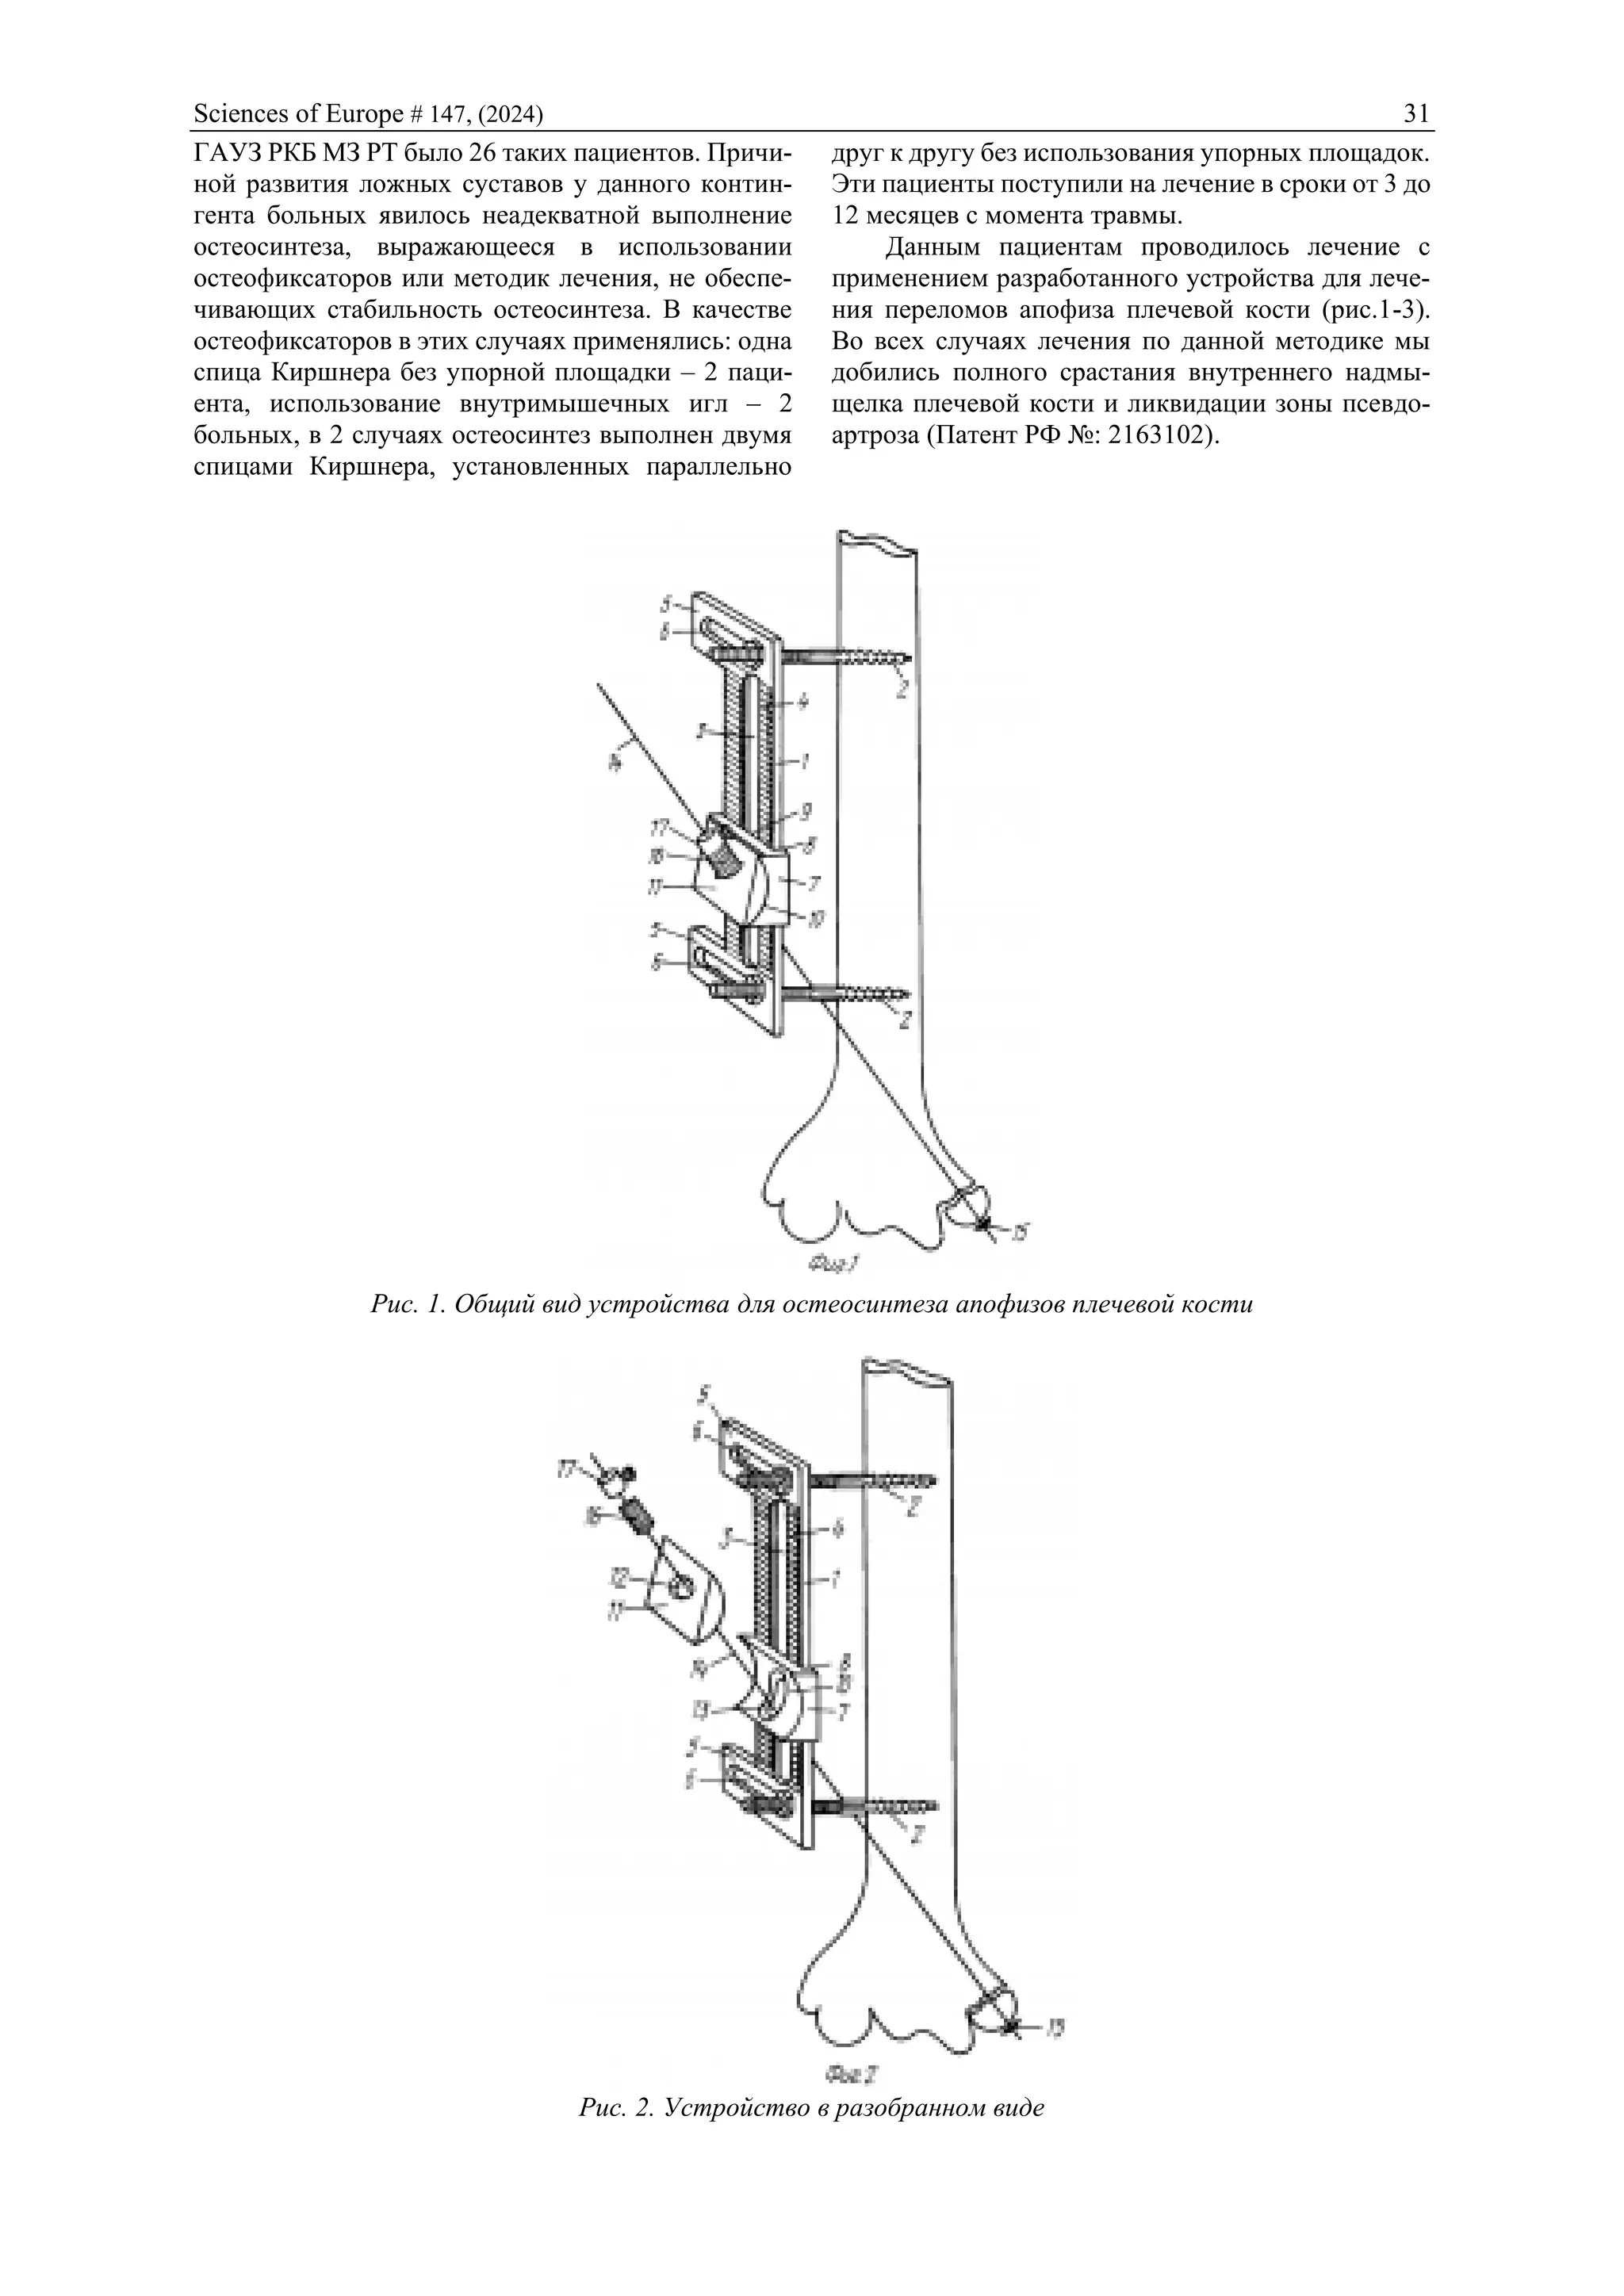
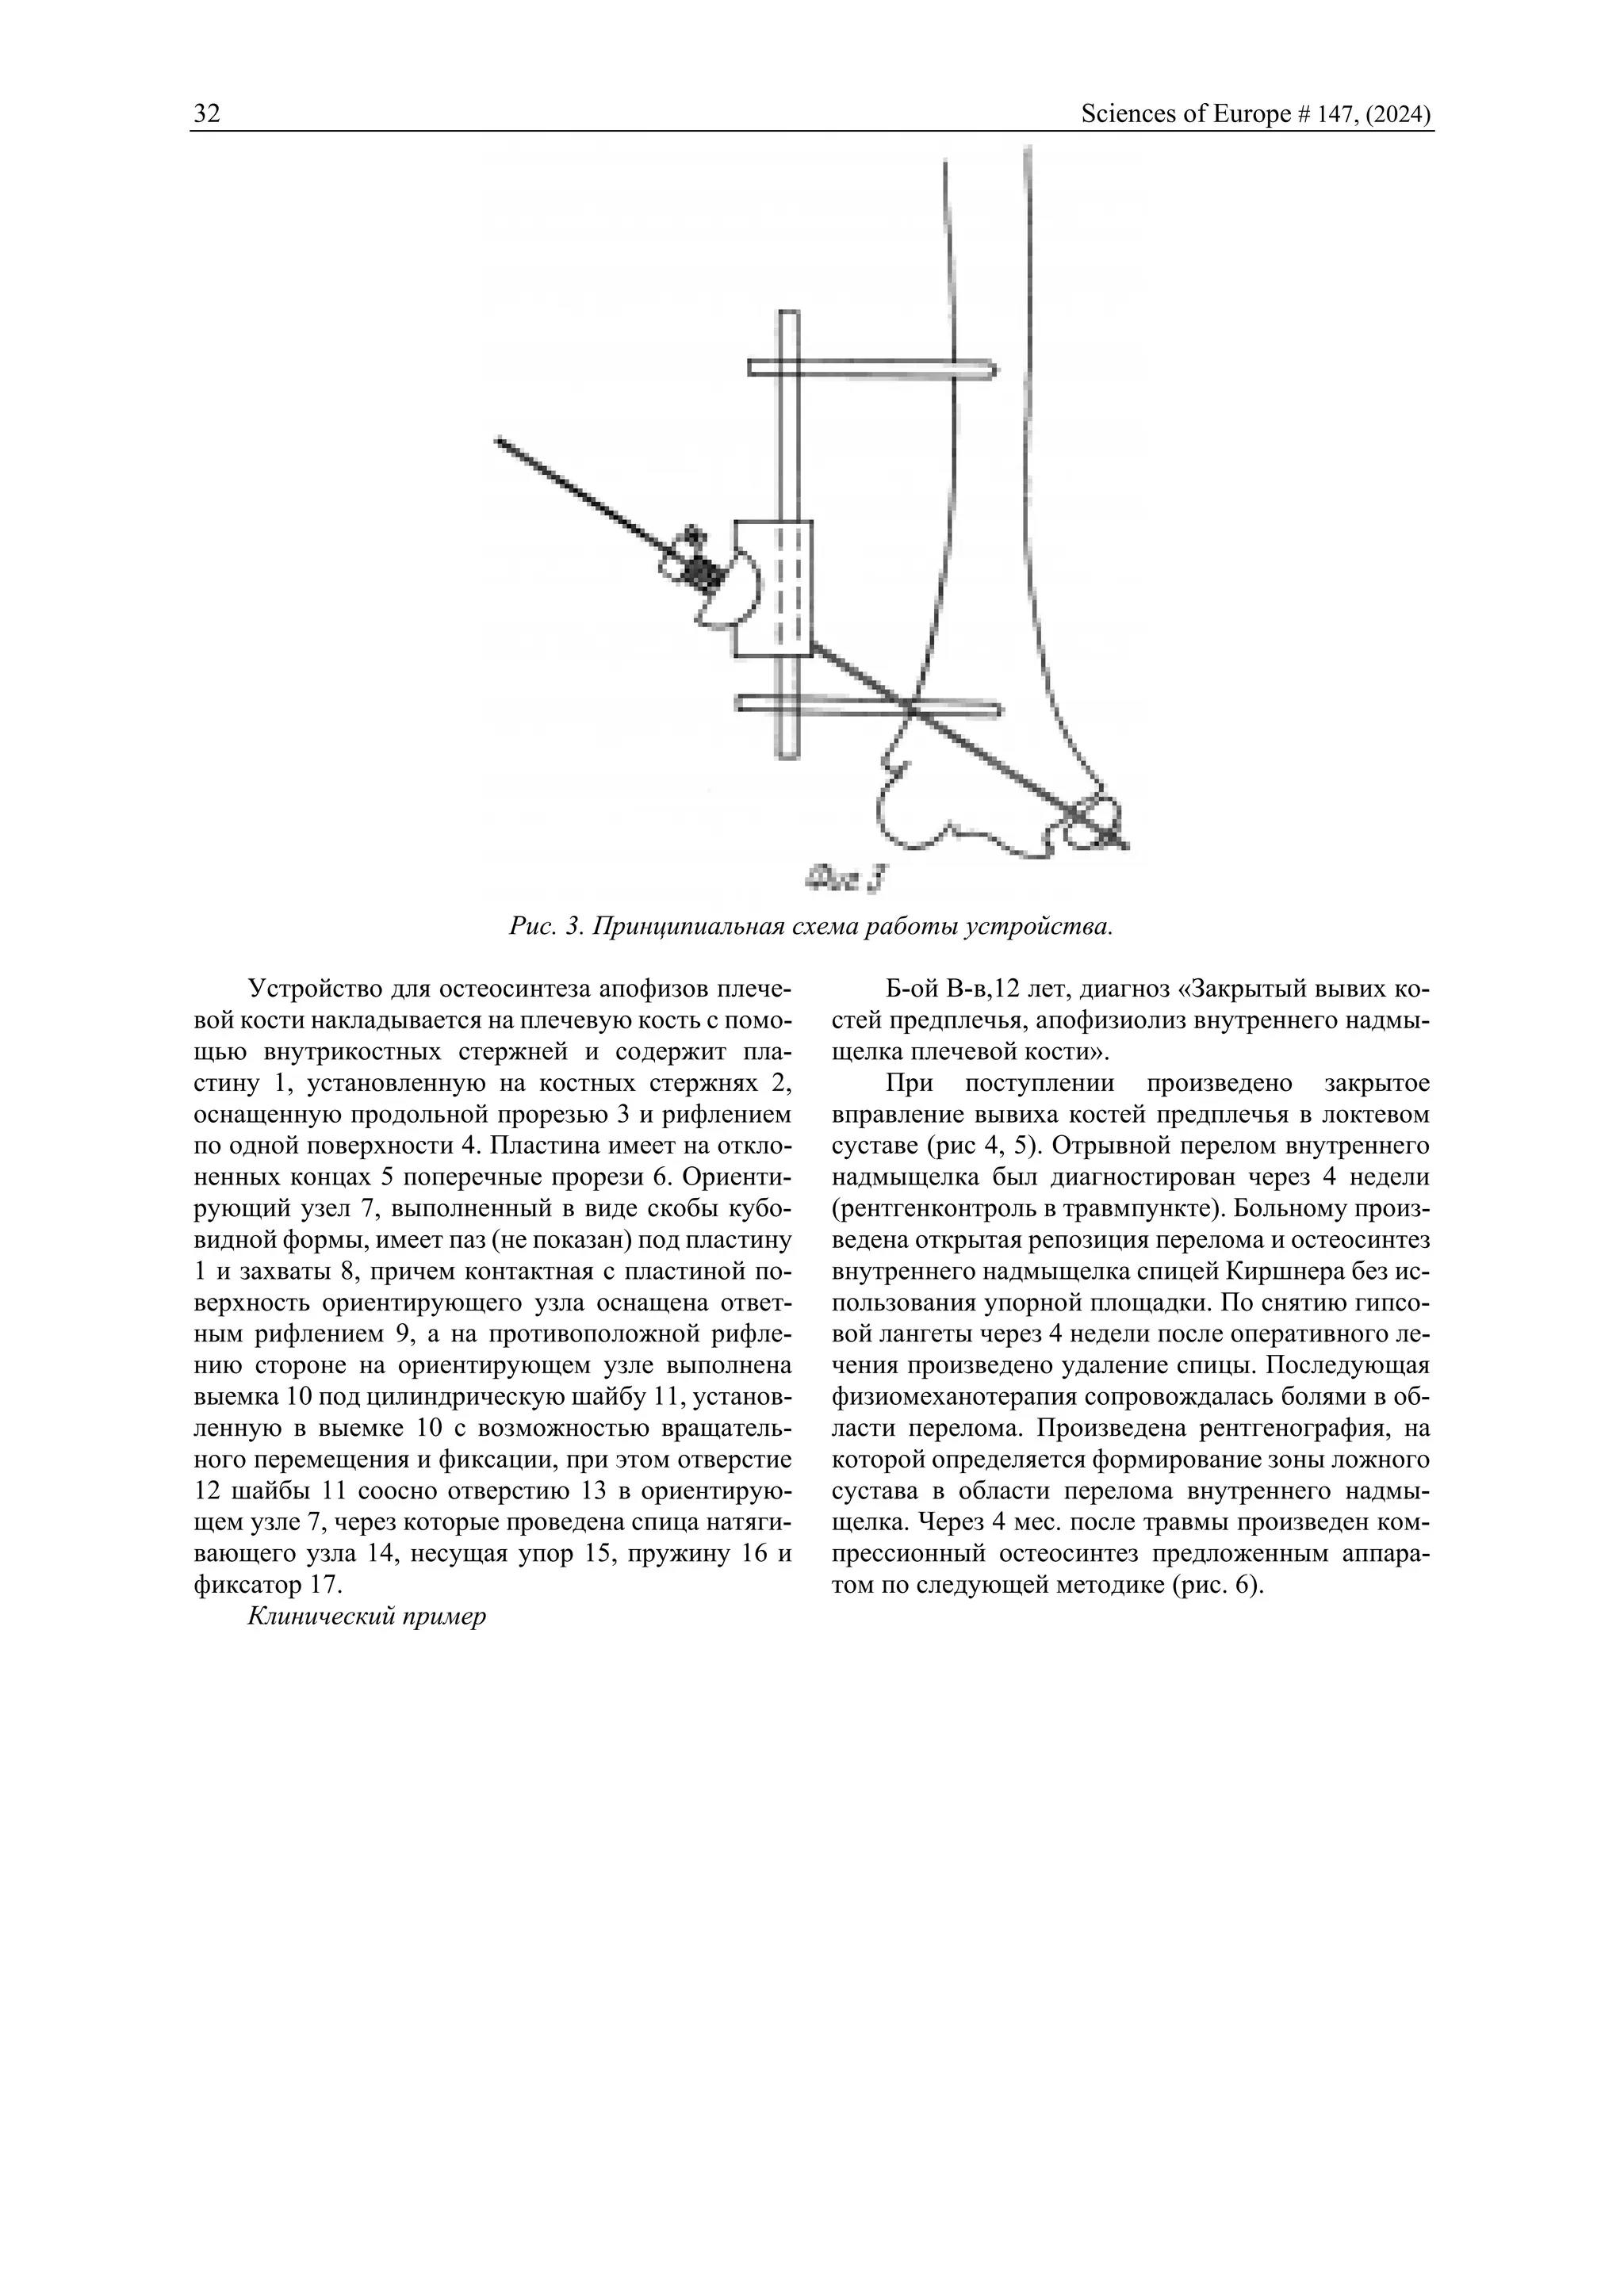
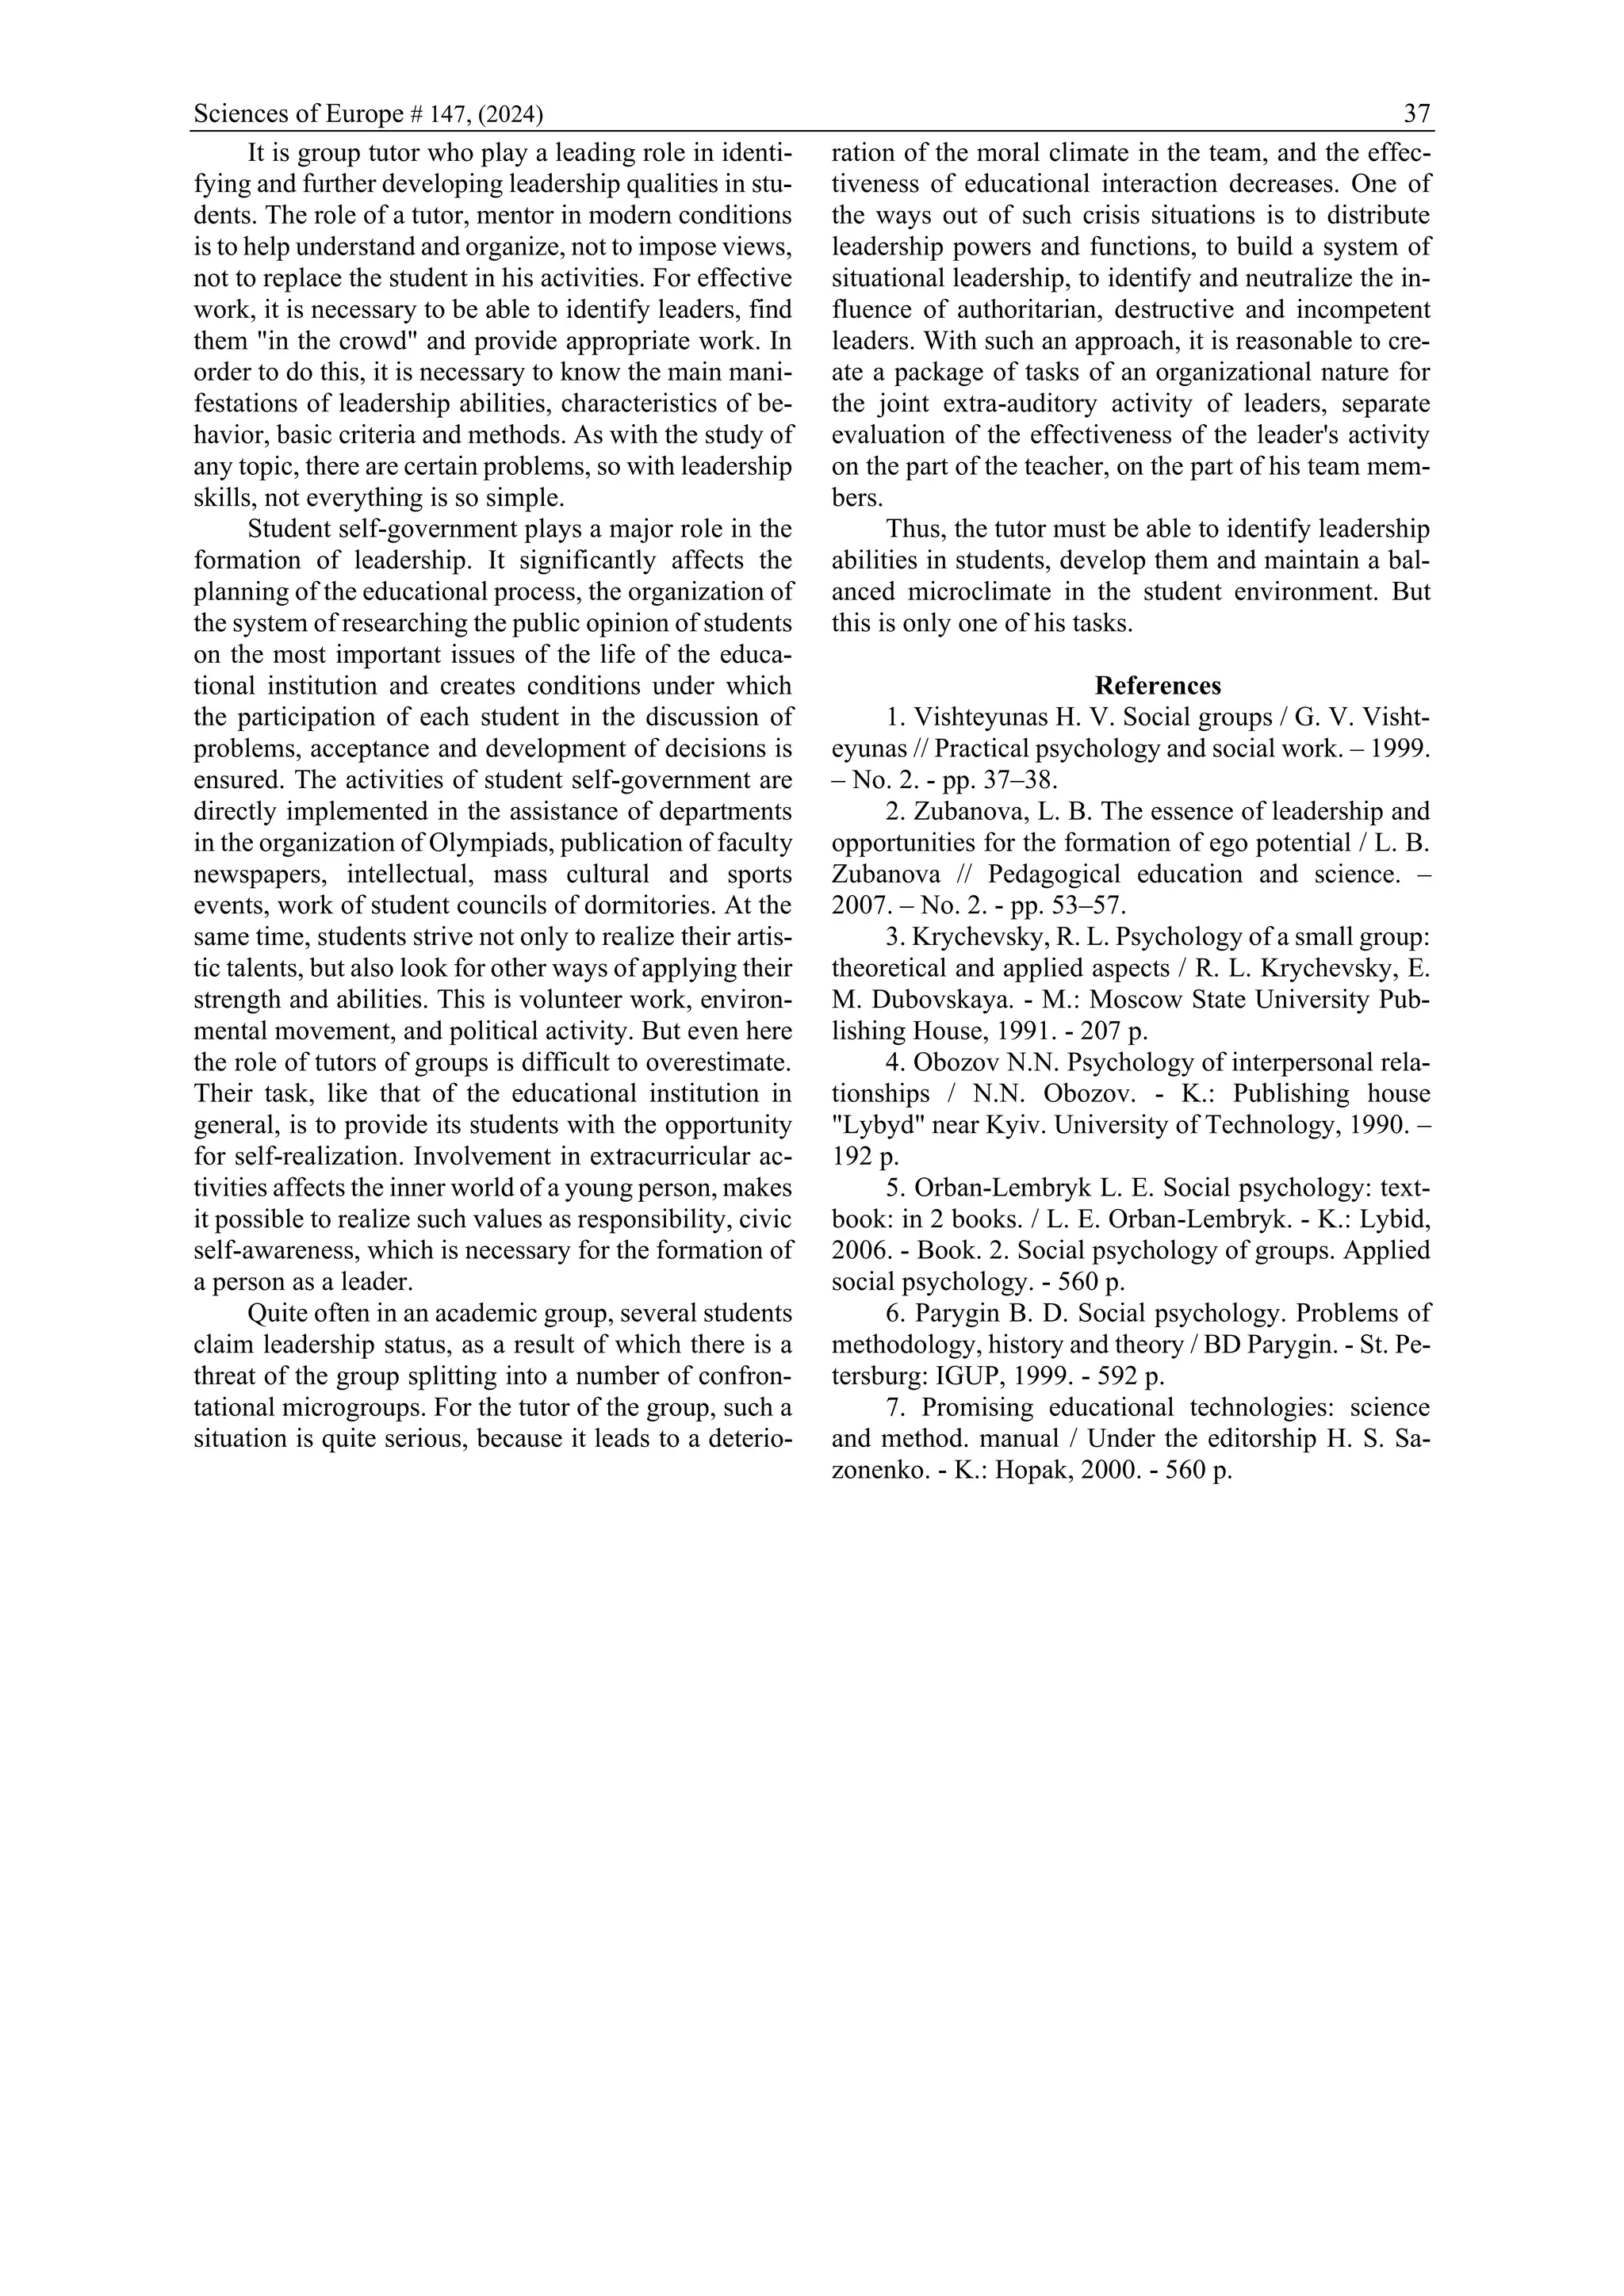
![30 Sciences of Europe # 147, (2024)
При лечении застарелых, неправильно срастающихся переломов внутреннего надмыщелка плечевой
кости, а также их псевдоартрозов у детей показано применение методов лечения обеспечивающих ста-
бильную фиксацию и раннюю функцию в локтевом суставе. Предложенный способ лечения малотравма-
тичен, обеспечивает условия срастания перелома и раннее восстановление функции в локтевом суставе.
ABSTRACT
One of the current problems of childhood trauma is metaepisal fractures of the humerus. They make up 25-
30% of the total structure of all fractures of extremity bones in childhood.
In the treatment of old, improperly healing fractures of the internal epicondyle of the humerus, as well as their
pseudarthrosis in children, the use of treatment methods that provide stable fixation and early function in the elbow
joint is indicated. The proposed method of treatment is low-traumatic, provides conditions for fracture healing and
early restoration of function in the elbow joint.
The authors present the methodology and materials of the analysis of treatment of 26 patients with pseudar-
throsis of the internal epicondyle of the humerus from 2015 to 2024. in the children's traumatology and orthopedic
department of the State Autonomous Institution of Healthcare of the Republican Clinical Hospital of the Ministry
of Health of the Republic of Tatarstan.
In the treatment of old, improperly healing fractures of the internal epicondyle of the humerus, as well as their
pseudarthrosis in children, the use of treatment methods that provide stable fixation and early function in the elbow
joint is indicated. The proposed method of treatment is low-traumatic, provides conditions for fracture healing and
early restoration of function in the elbow joint.
Ключевые слова: внутренний надмыщелок плечевой кости, псевдоартроз, компрессионный остео-
синтез, спица Киршнера, упорная площадка.
Keywords: internal epicondyle of the humerus, pseudarthrosis, compression osteosynthesis, Kirschner wire,
thrust pad.
Введение
Одной из актуальных проблем детской травмы
являются метаэпизарные переломы плечевой ко-
сти. Они составляют 25-30% в общей структуре
всех переломовкостейконечностей в детском воз-
расте [1, с. 316; 3, с. 651; 5, с. 35]. В25% случаев они
локализуются проксимальном отделе и в 54-90 %в
дистальном отделе плечевой кости [2, с. 126; 4, с.
13].
В настоящее время нет единой точки зрения о
сроках и методах лечениявнутри и околосуставные
переломы проксимального и особенно дистального
отдела плечевой кости,что неизбежно ведёт к труд-
ностям выбора метода лечения. Несвоевременная
диагностика, неадекватный выбор способа и метода
лечения может привести к таким осложнениям как
неправильное срастание перелома, асептическому
некрозу, ложному суставу, контрактурам, осевым
деформациям конечности [6, с. 171], поэтому паци-
енты с дистальными метаэпифизарными перело-
мами плечевой кости требуют особого внимания и
оказания квалифицированной медицинской по-
мощи.
Использование классических методов диагно-
стики (клинического и рентгенологического) в не-
которых случаях не позволяет получить достаточ-
ную информацию о характере внутри и околосу-
ставного перелома плечевой кости.
Консервативное лечение гипсовыми повяз-
ками или методом скелетного вытяжения не позво-
ляет достичь точного восстановления анатомии ди-
стального отдела плечевой кости, конгруэнтности
суставных поверхностей, стабильной фиксации от-
ломков, начать раннее восстановление движений в
локтевом суставе, нередко приводят к вторичному
смещению отломков и удлинению сроков реабили-
тации [7, с. 126]. Длительная иммобилизация лок-
тевого сустава приводит к атрофии мышц конечно-
сти, развитию контрактур локтевого сустава. Ис-
пользование аппаратов внешней фиксации имеет
преимущества по сравнению с вышеперечислен-
ными методами лечения [7, с. 126].
Всё это требует индивидуального подхода к
выбору методов консервативного и хирургического
лечения внутри и околосуставных переломов ди-
стального отделов плечевой кости в зависимости от
возраста ребенка, уровня и вида перелома, харак-
тера смещения отломков и сроков давности получе-
ния травмы [8, с. 164].
Цель исследования
Провести анализ пациентов госпитализирован-
ных в отделение травматолого-ортопедическое дет-
ское ГАУЗ РКБ МЗ РТ с метаэпизарными перело-
мами плечевой кости у детей с 2015 по 2024 гг. Вы-
явить осложнения переломов данной локализации
и найти способы решения данных осложнений.
Материал и методы исследования
Нами проведен анализ пациентов госпитализи-
рованных в травматолого-ортопедическое (дет-
ское) отделение ГАУЗ РКБ МЗ РТс внутри и около-
суставными переломами проксимального и ди-
стального отделов плечевой кости у детейс 2015 по
2024 гг. Данные пациенты разделены на группы: с
переломами проксимального отдела плечевой ко-
сти наблюдалось 70 (14,6%) пациентов, а с дисталь-
ными повреждениями плечевой кости было 445 па-
циентов (86,4%), из которых с отрывными перело-
мами внутреннего надмыщелка плечевой кости со
смещением было 94 больных.
Из общего количества пациентов с перело-
мами дистального отдела плечевой кости заслужи-
вает особое внимание осложнения отрывных пере-
ломов внутреннего надмыщелка плечевой кости у
детей в виде замедленно срастающихся переломов
с формированием псевдоартроза внутреннего
надмыщелка плечевой кости. С2015 по 2024 гг.в от-
деление травматолого-ортопедическое детское](https://image.slidesharecdn.com/sciencesofeuropeno1472024-240901173407-6df3454c/75/Sciences-of-Europe-No-147-2024-30-2048.jpg)


![36 Sciences of Europe # 147, (2024)
PEDAGOGICAL SCIENCES
FORMATION LEADERSHIP QUALITIES OF STUDENTS: WHO CAN HELP?
Zhukovskyi O.
MD, PhD
Bukovinian State Medical University, Chernivtsi, Ukraine
DOI: 10.5281/zenodo.13382633
ABSTRACT
This article presents materials on leadership qualities of students, their development and maintaining a bal-
anced microclimate in the student environment.
Keywords: leadership qualities of students, tutor.
The modern period of social development in our
country opens up wide opportunities for updating the
content of education, which makes it possible to form a
spiritually rich nation. This determines a new approach
to education of student youth. Currently, there is an ur-
gent need for the formation of a creative personality of
a future specialist who would be able to solve both daily
and large-scale tasks that ensure not just survival, but
the progress of the nation. Our current realities require
a modern student to have a wide range of opportunities,
a developed intellect, the ability for constant self-edu-
cation and self-improvement, and a focus on creative
self-realization. Today, in the context of reforming the
education system in Ukraine, the need to develop lead-
ership qualities of students is considered one of the im-
portant tasks of higher education.
The problems of developing leadership qualities in
students and leadership in general are among the most
studied. Among the scientific theories and concepts de-
veloped to explain the phenomenon of leadership, one
should single out the behavioral theory (R. Blake, S.
Jibb, R. Likert, R. Tannenbaum, E. Halpin), attributive
theories (D. Joya, H. Sims, F. Fiedler); situational the-
ories (J. Brown, F. Fiedler, E. Wesbur), theory of ex-
change and transact analysis (J. March, G. Simon, J.
Thibault, J. Homans); value models of leadership (K.
Hodgkison, G. Fairholm). The main idea that deter-
mines the directions of research in this area is the di-
lemma: should a leader be born or can one become one?
According to researchers who adhere to the first direc-
tion, a leader can be formed through the necessary psy-
chological attitudes and exercises. Representatives of
another opinion believe that leadership is an innate abil-
ity that cannot be learned.
Social psychology interprets the term "leader" as:
1) a member of the group, for whom it recognizes the
right to make final decisions; 2) the individual who is
endowed with the greatest value potential in the group;
3) an entity that plays a leading role in organizing the
group's activities; 4) a person who has a certain influ-
ence on individual members of the group and on the
group as a whole, regulates relations in it [1, p. 37; 2, p.
54; 5, p. 330]. As in any team, the activity of the leader
in the student group is one of the most important factors
that determine the styles of joint activity and its result.
By virtue of his status, the leader influences the nature
of interpersonal relations, which, in turn, determines
the state of the psychological climate in the group. The
group leader can perform the functions of an initiator
and coordinator of actions, a generator and selector of
ideas, a person who guides joint activities and moti-
vates individual members of the group [7, p.233].
In social psychology, a number of classifications
of types of leaders have been developed according to
several characteristics. According to the nature of the
activity, the following are distinguished: 1) a universal
leader (one who shows his leadership qualities con-
stantly); 2) situational leader (shows leadership quali-
ties depending on the situation). According to the con-
tent of the activity, the following types are distin-
guished:
I. 1) business leader (one who organizes and man-
ages the activities of the group); 2) a motivational
leader (one who directs the group's activities, encour-
ages action); 3) an emotional leader (one who deter-
mines the emotional atmosphere in the group) (accord-
ing to the typology of R. L. Krychevskyi and O. M.
Dubovskaia) [3, p. 105];
II. 1) an inspiring leader who determines the activ-
ity program; 2) executive leader who organizes the im-
plementation of the already set program; 3) a leader
who is both an inspirer and an organizer (according to
B. D. Parygin's typology) [6];
III. 1) an intellectual leader who dominates the
field of intellectual activity; 2) an emotional and com-
municative leader who dominates the sphere of leisure;
3) practical leader, the one who leads the implementa-
tion of practical activities; 4) universal leader (accord-
ing to the typology of M. M. Obozov) [4, p. 43].
According to the management style, the following
are distinguished: 1) an authoritarian leader (one who
has concentrated the leadership on himself, puts him-
self above the group); 2) democratic (one that shares
leadership with other group members, places itself
within the group); 3) deviant (one who has distanced
himself from the leadership, places himself outside the
group). By activity style: leader-creator, leader-fighter,
leader-diplomat, leader-advisor, etc.
The leading place of the leader in the system of
interpersonal relations within the group necessitates a
careful study by the tutor of the students' leadership
qualities. It is necessary to periodically determine the
degree of coincidence of the awareness of the leader-
ship role with the real influence on decision-making
and the contribution to the achievement of the result of
joint activities, which is denoted by the concept of "ac-
curacy of the perception of leadership".](https://image.slidesharecdn.com/sciencesofeuropeno1472024-240901173407-6df3454c/75/Sciences-of-Europe-No-147-2024-36-2048.jpg)
![38 Sciences of Europe # 147, (2024)
PHYSICS AND MATHEMATICS
FROM THE SPECIAL THEORY OF RELATIVITY IT FOLLOWS THAT THE INVISIBLE
AFTERLIFE WORLD, WHERE GODS AND SOULS OF THE DEAD DWELL, REALLY EXISTS1
Antonov A.
PhD, HonDSc, H.Prof.Sci
Independent researcher, Kiev, Ukraine
DOI: 10.5281/zenodo.13382639
ABSTRACT
Rightly recognized as a great scientific achievement of physics of the XX century, the special theory of rela-
tivity (SRT), however, turned out to be incorrect, because at that time there was no experimental knowledge nec-
essary for its creation, which had to be replaced by postulates. But not everything was guessed. And this is quite
natural. All new theories are always subsequently refined and corrected. However, none of the many subsequent
corrections and experimental refutations of SRT was not accounted for and still is not taken into account. As a
result, SRT has remained uncorrected.
It is in this form that SRT is now studied in all physics textbooks, used in the educational process even in the
most prestigious universities.
However, a corrected version of SRT has already been created, in which instead of the in-correct principle of
non-exceeding the speed of light, the experimentally proven principle of physical reality of imaginary numbers,
which refuted this postulate, is used. The corrected version of SRT has allowed to solve many unsolved in the
noncorrected version of SRT problems. And from relativistic formulas of the corrected version of SRT follows the
existence of numerous mutually invisible parallel universes. In the corrected version of SRT also it is explained
that these invisible universes about which it is spoken in all religions, and are invisible afterlife world in which
Gods and souls of dead dwell.
Keywords: imaginary numbers; complex numbers, hypercomplex numbers, WMAP, Planck, special theory
of relativity, invisible parallel universes and antiuniverses, Multiverse, Hyperverse, portals, Gods, invisible after-
life world, souls of dead.
Introduction
Created in the twentieth century by the works of
Joseph Larmor [1], Nobel Prize winner Hendrik Anton
Lorenz [2], Jules Henri Poincaré [3], Nobel Prize win-
ner Albert Einstein [4] and other outstanding scientists,
the special theory of relativity (SRT) [5]-[7] because of
its use of the principle of relativity is rightly considered
a very great scientific achievement. However, in the
XXI century it was proved that this theory is incorrect,
because:
• the relativistic formulas obtained in it are not
correct;
• they've been incorrectly explained using the
wrong principle of light speed non-exceedance;
• from them were made incorrect conclusions
about physical unreality of discovered 400 years before
creation of SRT by Scipione Del Ferro, Niccolo Fon-
tana Tartaglia, Gerolamo Cardano, Lodovico Ferrari
and Rafael Bombelli2
[8] imaginary numbers and the
existence in nature of our only visible universe, in
which all measurements are carried out only using real
numbers.
As can be seen from the graphs (see Fig. 1a,b,c) of
relativistic formulas of this version of SRT
(1)
1 This is a reprint of the author's article "It follows from the experimentally proven principle of the physical reality of imaginary
numbers that the invisible afterlife mentioned in all religions really exists" published in the Norwegian Journal for the Devel-
opment of International Sciences No 138.
2
And perhaps even before them imaginary numbers were discovered by Paolo Valmes [9], who was burned alive at the stake
by the Spanish Inquisitor Tomas de Torquemada.
(2)
(3)
where 0
m is the rest mass of the moving body;
m - relativistic mass of the moving body;
0
t
- rest time of a moving body;
t
- relativistic time of a moving body;
0
l - rest length of a moving body;
l - relativistic length of a moving body;
v is the velocity of the moving body;
c - speed of light;
in the range of pre-light speeds v<c all these quan-
tities take values measured by real numbers, in the
range of superluminal speeds v>c take values measured
by imaginary numbers, and at the speed equal to the
speed of light v=c, the function )
v
(
m has a gap.
Therefore, in the pre-light speed range formulas (1)-(3)
have been explained. And in the superluminal range of
speeds the results of calculations in the form of imagi-
nary numbers the creators of SRT could not explain.](https://image.slidesharecdn.com/sciencesofeuropeno1472024-240901173407-6df3454c/75/Sciences-of-Europe-No-147-2024-38-2048.jpg)
![Sciences of Europe # 147, (2024) 39
And in modern textbooks of physics they are not ex-
plained till now. After all, what is 5 meters, 6 grams and
7 seconds is clear to everyone, but what is 5i meters, 6i
grams and 7i seconds, where 1
−
=
i , and now no
one can explain.
Moreover, as can be seen from the graphs of for-
mulas (1)-(3), in the superluminal range of velocities
v>c (see Fig. 1a,b,c) these formulas correspond to
physically unstable processes that cannot exist in nature
at all.
Indeed, let us assume that the material body in the
range c
v for some reason began to move faster.
Then its mass according to the function graph )
v
(
m in
Fig. 1a will decrease. But because of this lighter body
will move faster. This, according to the graph of the
function, will lead to a further decrease in the mass
)
v
(
m of the moving body. And this will again lead to
an increase in the velocity v
Fig. 1. Graphs of functions )
v
(
m , )
v
(
t
and )
v
(
l corresponding to the existing and the corrected versions
of the STR in the subluminal c
v and superluminal c
v ranges
of the material body. And so on. Therefore, in the
end this material body with zero mass and infinitely
high speed flies to 'nowhere'.
And assuming that the material body on the graph
of the function )
v
(
m in the range c
v for some
reason began to move slower and reasoning in a similar
way, we will come to the conclusion that this material
body moving slower and slower, will overcome the
point of astrophysical singularity v=c and, being in the
range v<c will, stop.
So, at any point in the range c
v on the graph
of the function )
v
(
m the ongoing process will indeed
be unstable and therefore cannot exist.
And so the fate of SRT hung in the balance. After
all, no one would not need a theory that even its authors
could not explain. But SRT was saved by the fact that
in it introduced a postulate called the principle of non-
exceeding the speed of light, the meaning of which is
clear from its name. And from this postulate followed
that the formulas (1)-(3) in the superluminal range of
speeds c
v do not need to be explained, since im-
aginary numbers allegedlydo not describe any pro-
cesses that do not exist in nature.
So the fate of the SRT hung in the balance. After
all, no one would not need a theory that even its authors
could not explain. But SRT was saved by the fact that
it introduced a postulate called the principle of non-ex-
ceeding the speed of light, the meaning of which is clear
from its name. And from this postulate followed that
formulas (1)-(3) in the superluminal range of speeds
could not be explained, as imaginary numbers no exist-
ing in nature processes are allegedly not described.
Here in such a form the uncorrected SRT is studied in
all textbooks of physics up to now.
Nevertheless, at the initial stage of creation of SRT
such variant of its statement was quite acceptable,
though it obviously contained, as well as all new theo-
ries, some misconceptions. However, at present, when
it has been found out the fallacy of some assumptions
used by its authors a hundred years ago, which are fur-
ther explained, ignoring these circumstances is no
longer justified. All the more that now such a corrected
interpretation of SRT already hinders the development
of the whole science.
Physical reality of imaginary numbers
But there are other sciences besides physics. In-
cluding electrical engineering and radio engineering
created before SRT. And in these sciences the theory of
linear electric circuits of alternating current is used, in
which the fundamental is the Ohm's law discovered in
1893 in the interpretation of Steinmetz [10]. And a sim-
pler version of this law for DC electric circuits [11],
[12], studied now in school physics textbooks, was dis-
covered by Ohm himself in 1826, when no electrical](https://image.slidesharecdn.com/sciencesofeuropeno1472024-240901173407-6df3454c/75/Sciences-of-Europe-No-147-2024-39-2048.jpg)
![40 Sciences of Europe # 147, (2024)
measuring device existed yet. About the physics of that
time, the professor of the Imperial Moscow University,
Alexander Grigorievich Stoletov wrote: "...physics es-
pecially seduced natural philosophers. What a grateful
theme for the most unbridled fantasies were electrical
phenomena... Beautiful and vague deductions were in
the foreground: painstaking work of the experimenter,
precise mathematical analysis were not in honor; they
seemed superfluous and harmful in the study of na-
ture...". Therefore, in 1828 Om was dismissed from his
job by the Minister of Education for publishing about
the law he had discovered. The high-ranking official
believed that the use of mathematics and experimental
research in natural philosophy was inadmissible.
And Ohm's law as interpreted by Steinmetz is now
used daily in practice by millions of electrical and radio
engineers all over the world. Thereby, of course, con-
firming that it is true.
But in SRT the existence of this law is ignored,
because from the postulate about the non unexceeded
speed of light the conclusion about physical unreality
of imaginary numbers is made, which is obligatory not
only for physics but also for all other sciences. Includ-
ing electrical and radio engineering. After all, mathe-
matics is the common language of all exact sciences.
Therefore, mathematics cannot be one in physics and
another in electrical and radio engineering. And in SRT
it is stated (although it is not written anywhere) that
Ohm's law as interpreted by Steinmetz is wrong, be-
cause it follows from this law that electrical resistances
of capacitors and inductors (also called inductance
coils) are measured by imaginary numbers, and only re-
sistances of resistors are measured by real numbers.
Due to
Fig. 2. In any radio-technical laboratory there are devices called frequency response meters, which prove the
physical reality of imaginary and complex numbers by their mere existence
this circumstance imaginary resistances of capac-
itors and inductors SRT proposes to consider actually
imaginary, i.e. physically non-existent.
Note - the formulation of Ohm's law in Steinmetz's
interpretation states that imaginary resistances are
measurable. And in fact, any electrical and radio labor-
atory has been using commercially available devices
for measuring imaginary resistances and other imagi-
nary electrical quantit- ies for many decades (Fig. 2)
But everything that can be measured always ex-
ists. This is the fundamental position of any science. If
people in their activities did not use instruments, and
relied on knowledge obtained only from their sensa-
tions, then science would not exist. And physicists can't
help but know this. And since in electrical and radio
engineering the resistances of capacitors and inductors,
which someone unsuccessfully called imaginary, are in
fact measured by existing devices, then they are not im-
aginary at all, but the most real physically existing ones.
Nevertheless, in SRT, in accordance with the prin-
ciple of non-exceeding the speed of light, it is actually
asserted that imaginary resistances of capacitors and in-
ductors, since they are called imaginary, should not re-
ally exist. Therefore, electrical and radio engineering
also should not exist [13]-[32].
In fact they existed even before the creation of
SRT by publications of Einstein and Poincaré in 1905.
But physicists of that time probably did not know
and/or did not understand these sciences. They don't
want to understand them now, since the theory of linear
AC electric circuits is not taught to physics students.
Nevertheless, since in electrical and radio engi-
neering the used imaginary quantities - resistances,
transfer functions, etc. - correspond to real physical en-
tities (since they are measured), it proves in the most
indisputable way that the named imaginary numbers
contrary to the postulate of SRT about non-exceeding
the speed of light not only in electrical and radio engi-
neering, but always and everywhere in all sciences are
physically real. And it is time to realize that mathemat-
ics cannot be one for Einstein, another for Steinmetz,
another for someone else. So imaginary numbers are
physically real in all sciences. Textbooks on different
sciences (for example, physics textbooks and radio en-
gineering textbooks) should not contradict each other.
And it is unethical to teach schoolchildren and students
using such text-books.
There are other experimental proofs of the general
scientific principle of the physical reality of imaginary
numbers [33]-[44]. And no experiments are never re-
futed by postulates. And since the following from the
postulate about not exceeding the speed of light SRT
statement about physical unreality of imaginary num-
bers turned out to be incorrect, this postulate itself is
incorrect. Therefore the generally accepted version of
the SRT itself also turned out to be incorrect. There are
also other proofs of the incorrectness of the version of
SRT [45]-[65] still studied in all physics textbooks.
Corrected version of SRT
Since the principle of the physical reality of imag-
inary numbers has been experimentally proven in the
most indisputable way, the relativistic formulas must
now be explained for the super- luminal speed range](https://image.slidesharecdn.com/sciencesofeuropeno1472024-240901173407-6df3454c/75/Sciences-of-Europe-No-147-2024-40-2048.jpg)
![Sciences of Europe # 147, (2024) 41
[66]-[73]. But for these relativistic formulas to be ex-
plainable, they must first be corrected. To their graphs
in the superluminal speed range c
v (Fig. 1a, b, c)
were similar to the graphs of the same quantities in the
sublight speed range v c
, as shown in Fig. 1d,e,f.
And for this, it is necessary to introduce the factor
into formulas (1)-(3). After which they will take the
form
(4)
(5)
(6)
where q(v)=⌊v/c⌋ is the “floor” function of discrete
mathematics of the argument
Fig. 3. Graphs of functions and , illustrating the meaning of the “floor” function of discrete
mathematics
Fig. 4. Structure of the hidden Multiverse corresponding to the principle of physical reality of complex numbers](https://image.slidesharecdn.com/sciencesofeuropeno1472024-240901173407-6df3454c/75/Sciences-of-Europe-No-147-2024-41-2048.jpg)
![42 Sciences of Europe # 147, (2024)
v/c (its graph is shown in Fig. 3a), which is the
fourth spatial dimension;
w(v)=v-qс is the local velocity for each universe
(its graph is shown in Fig. 3b).
Therefore, the function for successive values
of q(v) equal to 0,1,2, 3,4,5,... takes the values +1,+i,-
1, -i,+1,+i,... And the value q(v)=0 in formulas (1)-(3)
for the speed range v c
corresponds to our visible
universe, which for definiteness we will call the tar-
dyon universe. The value q(v)=1 in the speed range
c
v corresponds to the invisible universe, since it
is beyond the event horizon. For definiteness, we will
call it tachyon. The value q(v)=2 will then correspond
to an invisible tardyon antiuniverse, the value q(v)=3
will correspond to an invisible tachyon antiuniverse,
the value q(v)=4 will correspond to another (and there-
fore also invisible) tardion universe, the value q( v)=5
will correspond to another tachyon universe. Etc.
Thus, from the corrected relativistic formulas (4)-
(6) it follows that in reality in nature there exists a Mul-
tiverse, which contains, in addition to our visible uni-
verse, also many other mutually invisible parallel (since
they do not intersect) universes3
, since relative to each
other they are all located beyond the event horizon. And
such a Multiverse, which we will therefore call hidden,
has an openended screw structure (as, for example, in
Fig. 4).
How to calculate the function for non-inte-
ger argument values?
But the function which was very convenient
and understandable in the presentation of the previous
section, is not currently used in the theory of functions
of a complex variable. Therefore, it is useful to clarify
this situation. The function is not used because it is
now known how to calculate it only for integer values
of the argument - you just need to multiply by i the orig-
inal value, equal to one, q times. But in the case of non-
integer values of q, this algorithm does not work. That's
all.
Nevertheless, this situation is completely solvable.
After all, the values +1,+i,-1,-i, etc. are the same as the
function for integer argument values 0,1,2,3, etc. in
function also accepts in Euler’s formula eiqπ/2
=
cos(iqπ/2)+ isin(iqπ/2), which allows you to calculate
its values for non-integer values of the argument.
Therefore, it is acceptable to assume that these two for-
mulas and тare identically equal to each
other. And then we get the formula
(7)
by which for the function one can find its val-
ues for both integer and non-integer values of the argu-
ment q.
Thus, the last mathematical operation from alge-
bra, which until now was not feasible in the theory of
functions of a complex variable, has now also become
feasible.
3
In other dimensions, therefore on Earth invisible
Analysis of experimental data obtained by the
WMAP and Planck spacecraft
In order to obtain more information about the pos-
sible structure of the hidden Multiverse and to verify
that it is correct, we will analyze the data obtained by
the WMAP [74] spacecraft, launched in 2001 by the
National Aeronautics and Space Administration
(NASA), which operated until 2010, and Planck [75],
launched by the European Space Agency (ESA) in
2009, which operated until 2013.
According to the data obtained by the WMAP
spacecraft, the entire universe (in fact, the entire hidden
Multiverse) consists of 4.6% baryonic matter, 22.4%
dark matter, and 73.0% dark energy. And according to
more recent data obtained by the Planck spacecraft, the
entire universe (again, in fact, the entire hidden Multi-
verse) consists of 4.9% baryonic matter, 26.8% dark
matter, and 68.3% dark energy. As you can see, these
results differ little from each other, which proves their
truth. But what dark matter and dark energy themselves
are has never been explained.
It is for this incomprehensibility that these physi-
cal entities were called dark. Therefore, Stephen Wil-
liam Hawking wrote: “The missing link in cosmology
is the nature of dark matter and dark energy.”
And since it was proven above in the most indis-
putable way that in nature there is not a monoverse, but
a hidden Multiverse, then dark matter and dark energy
must somehow be present in it [76]-[80]. Consequently,
the structure of the hidden Multiverse discussed above,
shown in Fig. 4, must be accordingly corrected.
But how? To do this, we will abandon the asser-
tion of the version of STR presented in textbooks that
explanations for the phenomena of dark matter and dark
energy must certainly be sought in our visible Universe.
And we will look for them in the hidden Multiverse,
since its existence has been proven. Let us assume that
these phenomena are somehow generated by the very
structure of the hidden Multiverse and are caused by the
mutual influence of invisible parallel universes on each
other. And then it’s possible it is quite clear and con-
vincing to explain the hitherto inexplicable main fea-
tures of these phenomena - their invisibility and unde-
tectability of corpuscular contents:
• dark matter and dark energy are actually not
some kind of material physical entities, but just phe-
nomena (presumably a gravitational shadow) generated
by the existence, in addition to our visible tardion uni-
verse, of other invisible ones parallel universes of the
hidden Multiverse;
• мoreover, dark matter is a phenomenon gener-
ated by the existence of invisible parallel universes of
the hidden Multiverse adjacent to our visible universe;
• and dark energy is a phenomenon generated by
the existence of the rest, in addition to our visible uni-
verse and the invisible universes adjacent to it, the re-
maining invisible parallel universes of the hidden Mul-
tiverse;
• and precisely because dark matter and dark en-
ergy are just phenomena, they have no material content,
as a result of which they themselves are invisible.](https://image.slidesharecdn.com/sciencesofeuropeno1472024-240901173407-6df3454c/75/Sciences-of-Europe-No-147-2024-42-2048.jpg)
![Sciences of Europe # 147, (2024) 43
Then it becomes obvious that some unusual mate-
rial content in dark matter and in dark energy in nature
probably does not actually exist. Just as there is no ma-
terial content in our shadow on a sunny day. Therefore,
attempts to detect some subatomic particles of dark
matter and dark energy by the ongoing research at the
Large Hadron Collider are probably not very promis-
ing.
This explanation of these phenomena also makes
it possible to clarify the structure of the hidden Multi-
verse. Indeed, assuming the mass of different invisible
parallel universes in the hidden Multiverse with a high
degree of accuracy due to the presence between them
of a large number of portals that have existed for bil-
lions of years is almost identical4
, it is possible to de-
termine:
• how many parallel universes form the hidden
Multiverse. And in accordance with the above data ob-
tained by the WMAP spacecraft, their number is 100%
/ 4.6% = 21.74. And in accordance with the data ob-
tained by the Planck spacecraft, their number is 100% /
4.9% = 20.41. Consequently, their real number is equal
to 20...22 universes. Those in addition to our visible
universe, there are also 19...21 invisible universes.
• how many parallel universes are neighboring our
universe and give rise to the phenomenon of dark mat-
ter. According to data obtained by the WMAP space-
craft, their number is 22.4% / 4.6% = 4.87. And in ac-
cordance with the data,. received by the Planck space-
craft, their number is 26.8% / 4.9% = 5.47. Therefore,
their real number is most likely equal to 5...6 parallel
universes.
• how many parallel universes give rise to the phe-
nomenon of dark energy. And in accordance with the
data obtained by the WMAP spacecraft, their number is
73.0% / 4.6% = 15.87. And according to data obtained
by the Planck spacecraft, their number is 68.3% / 4.9%
= 13.94. Consequently, their real number is presumably
equal to 14...16 parallel universes.
Corrected version of SRT (continued)
As can be seen, the experimental data obtained by
the WMAP and Planck spacecraft did not confirm the
above conclusions about the structure of the hidden
Multiverse, since our visible universe in this structure
should have not two neighboring invisible universes -
more precisely, one tachyon universe and one tachyon
antiuniverse - but five or six.
Therefore, it is logical to assume that there was
some error in the previous reasoning. And this error is
that earlier, for the sake of simplicity, we assumed in
the hidden Multiverse5
the existence of only one addi-
tional dimension q and, consequently, its correspond-
ence to physically real complex numbers containing
only one imaginary unit. And in order for our universe
to be neighbors of six other parallel universes6
- three
tachyon universes and three tachyon antiuniverses - it
is necessary to have three additional dimensions q, r, s,
which will determine their position in space. Conse-
quently, the space of such a hidden Multiverse will be
six-dimensional (see Fig. 5). And its structure will cor-
respond to quaternions 1 1 2 2 3 3
i i i
+ + + , i.e.
hypercomplex numbers [81], containing three imagi-
nary units 1
i , 2
i , 3
i , which are related to each other by
the relations
2 2 2
1 2 3 1
i i i
= = = − (8)
1 2 3 2 3 1 3 1 2 1
ii i i i i i ii
= = = − (9)
1 3 2 2 1 3 3 2 1 1
ii i i ii i i i
= = = (10)
In such a quaternion structure of the hidden Mul-
tiverse [82], [83] the distribution of material content in
each three-dimensional parallel universe will be deter-
mined by some the function and the
quantities 1
i q, 2
i r и 3
i s and are the coordinates of
these universes. Those. the structure of the hidden Mul-
tiverse is described by the formula
. This is ex-
actly what Lisa Randall predicted: “We could be living
in a three-dimensional slit of higher dimensional
space.”
And therefore the relativistic formulas (4)-(6)
must be corrected once again as follows
0 1 2 3
2
( , , )
1 [ ( )]
q r s
m i i i
m q r s
v q r s
c
=
− − + +
(11)
2
0 1 2 3
( , , ) 1 [ ( )]
q r s v
t q r s t i i i q r s
c
= − − + + (12)
4
according to the law of communicating vessels
5
Just like in the single visible universe in the generally ac-
cepted version of STR
6
Or less. Then some parallel universes of our hidden Multi-
verse may be absent and replaced by universes of neighboring
Multiverses.](https://image.slidesharecdn.com/sciencesofeuropeno1472024-240901173407-6df3454c/75/Sciences-of-Europe-No-147-2024-43-2048.jpg)
![44 Sciences of Europe # 147, (2024)
Fig. 5. Six-dimensional space of the hidden Multiverse, where q, r, s are the coordinates of invisible paral-
lel universes, and x, y, z are the coordinates of the matter content in each parallel universe
2
0 1 2 3
( , , ) 1 [ ( )]
q r s v
l q r s l i i i q r s
c
= − − + + (13)
Information about the helical structure of such a
hidden Multiverse is contained in formulas (11)-(13). It
follows from them that it is possible to move from a
tardion universe to a tardion antiuniverse and from a
tardion antiuniverse to a tardion universe in different
ways, but not in an arbitrary way, but only in such a
way (see Fig. 6) that the quantity 1
q
i 2
r
i 3
s
i will succes-
sively take on the values +1,+ ⨁+ ⨁+ ,-1, - ⨁- ⨁-
,+1,… etc., where ⨁ is the symbol of the logical oper-
ation of discrete mathematics ‘exclusive OR’. In this
case, different trajectories of movement from one uni-
verse (or antiuniverse) to another can differ only due to
the replacement of some tachyon universes 1
q
i 2
r
i 3
s
i
with others and some tachyon antiuniverses 1
q
i 2
r
i 3
s
i
with others. Consequently, the tachyon universes 1
q
i
2
r
i 3
s
i in the hidden Multiverse are located parallel to
each other. The tachyon antiuniverses 1
q
i 2
r
i 3
s
i for the
same reasons are also located parallel to each other.
And therefore, in the hidden Multiverse, when moving
from any tardyon universe to a tardyon antiuniverse and
then to another tardyon universe, parallel universes and
anti-universes must alternate in the following sequence
– ‘tardyon universe’, ‘one of the tachyon universes’,
‘tardyon anti-universe’, ‘one of the tachyon anti-uni-
verses’, ‘tardyon universe’, ‘one of the tachyon uni-
verses’, etc.](https://image.slidesharecdn.com/sciencesofeuropeno1472024-240901173407-6df3454c/75/Sciences-of-Europe-No-147-2024-44-2048.jpg)

![46 Sciences of Europe # 147, (2024)
In Fig. 6 all these transitions are shown. Moreover,
since the data obtained by the WMAP and Planck
spacecraft correspond to the open spring-like structures
of our hidden Multiverse, united through the corre-
sponding portals with other Multiverses, then all to-
gether they form the Hyperverse.
And there may be many other similar structures.
And to clarify which of them really exists in our hidden
Multiverse, additional experimental research is natu-
rally necessary.
Physical reality of invisible universes
But this is not the main thing for us now.
The main thing is to prove experimentally, in an
indisputable way, that there is a Multiverse in nature,
and not the only visible universe in nature, as it is as-
serted not only in the generally recognized version of
SRT, but also in string theory and in quantum physics.
And for this purpose, without wasting time on an-
alyzing complex theories, it is necessary to prove ex-
perimentally that invisible universes corresponding to
the corrected version of SRT, actually exist in nature.
And it is possible to do it, if to see on a starry sky cor-
responding to them other constellations [84]-[89]. But
that can only be done where no one has ever seen them
before. And these other constellations8
(invisible out-
side the portals) can be seen in the starry sky in the por-
tals, i.e. in the transitions between our visible universe
and neighboring invisible universes. Similarly, as it is
possible to see neighboring with our visible room, in
which we are now, neighboring invisible room (or at
least its edge to be convinced of its existence), only if
you go into the corridor between the rooms. Portal are
such corridor between universes.
And for this purpose, without wasting time on the
analysis of these complex theories, let us try to prove
experimentally that invisible universes corresponding
to the corrected version of SRT, actually exist in nature.
Then theoretical considerations on this subject will be-
come unnecessary. And it can be done, if to see on a
starry sky corresponding to other universes other con-
stellations. But this can only be done where no one has
ever seen them before. And these other constellations
(invisible outside the portals) can be seen in the starry
sky in the portals, i.e. in the transitions between our vis-
ible universe and neighboring invisible universes. Sim-
ilarly, as it is possible to see neighboring to our visible
room, in which we are now, the neighboring invisible
room (or at least its edge to make sure of its existence),
only if you go into the corridor between these rooms.
Such corridors between universes are portals [90]-[92].
And the entrances to the portals are the so-called anom-
alous zones, of which there are many on our planet -
more than a hundred thousand [93]-[96]. And in some
of these anomalous zones even already placed observa-
tories. As, for example, the Main Astronomical Obser-
vatory of the National Academy of Sciences of
Ukraine, which is located in the Goloseevsky forest just
12 km. from the center of the capital of Ukraine, Kiev.
Fig. 7. Scheme of an astronomical experiment to detect invisible universes
But people avoid going into portals. And rightly
so, because portals are invisible labyrinths. That's why
it's almost impossible to get out of them after acci-
dentally entering them. But it is possible to create
equipment for orientation in portals. It is also possible
to use unmanned remote-controlled robotic means to
explore portals. You just need to want to do all this.
It is even possible not to go far into the portals, but
to limit ourselves to the use of anomalous zones (e.g.,
the above-mentioned Main Astronomical Observatory
of the National Academy of Sciences of Ukraine). Alt-
hough in anomalous zones, i.e., at the very edge of the
portals, the change in the appearance of familiar con-
stellations is very small, they can still be detected with
8
During the transition from one universe to another, the map
of the starry sky in the portal, continuously changing all the
time, smoothly transforms from the map of one universe into
modern equipment, comparing on the computer (Fig. 6)
observations of the same areas of the starry sky by dif-
ferent observatories located both in the anomalous
zones and outside the anomalous zones in the same re-
gion.
After all, the English astrophysicist Sir Arthur
Stanley Eddington [97] was able to his famous experi-
ment, similar to the one described above in Fig. 7, back
in 1919 to confirm the predicted by the general theory
of relativity deviation of light rays in the gravitational
field of the Sun. That's what it means to actually want
to.
Why hasn't this experiment been done yet?
the map of the neighboring universe. But at the same time it
will naturally differ from the map of the starry sky on the
Earth outside the portal at any place in the portal](https://image.slidesharecdn.com/sciencesofeuropeno1472024-240901173407-6df3454c/75/Sciences-of-Europe-No-147-2024-46-2048.jpg)
![Sciences of Europe # 147, (2024) 47
So why hasn't this simple and very low-cost exper-
iment has not yet been done? Even though in case of a
positive result one could hope for a Nobel Prize for the
discovery of invisible universes neighboring our visible
universe. And in the case of a negative result, one could
hope to get a very authoritative proof that Einstein and
his theory were right. That is, any result of such an ex-
periment is very important for science.
And because astronomers don't need the first re-
sult at all, so as not to complicate their relations with
relativistic physicists. It is more important for them
than even the Nobel Prize. And the second result, as
they themselves realize, is very unlikely. But after real-
ization of such experiment all scientific disputes about
whether the version of SRT studied in physics text-
books is correct or incorrect, and also any references to
string theory, to quantum physics and to nothing else
will not be taken into account any more, as on this ques-
tion will be received indisputably correct answer. And
this answer is most likely to prove unambiguously the
infidelity of the generally recognized version of SRT.
Even physicists themselves are sure of it. After all,
if physicists hoped that this experiment would confirm
the truth of the existing version of SRT, it would have
been done long ago.
Civilizations and supercivilizations
But even if there were only our visible universe,
then, despite the big bang theory, when exploring the
cosmos it is impossible not to take into account that dif-
ferent stars with their planets arose in our visible uni-
verse at different times. And they still continue to arise.
According to modern estimates, the number of galaxies
in our visible universe alone is about 2E11. And each
galaxy contains about 1E8 stars. Of these, at least 8E9
contain Earth-like planets on which life is possible.
And the ages of the stars are very different. For exam-
ple, the star HE1523-0901 is 13.2E9 years old, the Sun
is 4.6E9 years old, Sirius is 2.3E8, and the recently dis-
covered star SwiftJ1818.0-1607 is only about 240 years
old. For comparison, recall that the age of our visible
universe is about 13.8E9 years. In the invisible uni-
verses of the hidden Multiverse and Gi-universe this di-
versity is surely even greater. And even the invisible
universes themselves, contrary to the Big Bang theory,
probably did not appear in nature at the same time. Con-
sequently, at least on some planets, the age of the super-
civilizations existing there exceeds the age of our
earthly human civilization by billions of years. And
comparing our civilization of the XXI century with the
human civilization, for example, of the IXХ century,
i.e. existing only 200 years ago9
it is not difficult to un-
derstand how much our civilization is surpassed by su-
per-civilizations.
Therefore, the inhabitants of supercivilizations are
real all-powerful Gods for us. And some information
about these supercivilizations is contained (though in a
in allegorical form to be somehow understandable to
people) in the church books of all world religions.
But other civilizations also exist on Earth. These
are numerous communities of living beings - mammals,
9
When russian writers A. S. Pushkin and M. Yu. Lermontov
lived, there were no computers, no Internet, no cars, no rail
birds, dolphins, even ants and bees - which form hier-
archical structures united by common vital interests and
coordinate their activities for the benefit of the whole
community as a result of exchange by information be-
tween these living beings. Only these civilizations, un-
like human civilization, are not machine civilizations.
Although primitive human civilizations, still existing
now according to some reports in some remote areas of
the Earth, are not machine civilizations either.
And these non-machine civilizations are also of
great interest for people, because due to the fact that
other living beings have sensory organs different from
those of humans, they possess knowledge about nature
unknown to humans. For example, cats feel geopatho-
genic zones, which are not registered by any existing
equipment. Consequently, there are some other physi-
cal fields unknown to people in the nature, besides elec-
tromagnetic and gravitational fields known to people.
Cats can also cure people in some unknown way. But
people don't know how they do it. And how to learn it
from them.
Fermi paradox, which proves the existence of
supercivilizations in other spatial dimensions.
The Fermi paradox is a statement of a seemingly
paradoxical situation in which, on the one hand, it is
known that there are many star systems suitable for life
in the cosmos, and on the other hand, despite all the ef-
forts of scientists, no signs of life have been found in
this cosmos. And it would seem very strange [98]-
[100].
But in fact there is nothing strange about this. Af-
ter all, what are we looking for? What signs of life do
we expect to see? The same as on Earth now? So that
the same radio stations as on Earth would work, which,
when transmitting signals, would spend most of their
energy on transmitting signals to nowhere due to the
use of a non-optimal directional diagram? So that, in
addition, these radio stations would also spend a con-
siderable part of their energy on out-of-band radiation?
So that aliens would detonate atomic and hydrogen
bombs? And so on.
But first of all, these are all defects of our imper-
fect civilization, which supercivilizations have long
ago got rid of. And that's why they're invisible. And
secondly, why not assume that we do not see their ships
in space also because they have different logistics as a
result of using their super knowledge. Even on Earth,
people on their way to work in big cities often use the
subway. And then their movement underground cannot
be detected from space. But then it is necessary to rec-
ognize the existence of invisible parallel universes, por-
tals between them and admit that the generally accepted
version of SRT is wrong.
Besides, they certainly know stealth technology or
some other super stealth technology. So the cost of all
the searches for signs of life in space is money wasted.
And finally, why do we assume that as soon as
people want to establish contacts with the inhabitants
of supercivilizations, for example, on the Moon or on
Mars, their inhabitants will immediately want to con-
transport, no aviation, and many other things that have be-
come familiar to us in the 21st century.](https://image.slidesharecdn.com/sciencesofeuropeno1472024-240901173407-6df3454c/75/Sciences-of-Europe-No-147-2024-47-2048.jpg)
![48 Sciences of Europe # 147, (2024)
tact us? Always and everywhere to be or not to be con-
tacts are decided by the masters of the situation. To be
sure of it try to meet your director or minister at least.
That is why in this situation the inhabitants of superciv-
ilizations make decisions, not us. After all, we also do
not seek contact neither with wild animals, nor with in-
sects, nor with snakes that try to get into our dwellings.
For example, rats are very smart and even in some sit-
uations, out of gratitude for the fact that the miners fed
them, they sometimes saved their lives. Nevertheless,
no one keeps rats as pets. And we lock our houses even
from people we don't need.
And the inhabitants of supercivilizations are per-
fectly capable of protecting themselves to protect them-
selves from unnecessary human contact, even on Earth.
For example, presumably in Shambhala. Or Antarctica.
Or at the bottom of the oceans.
And another thing. Why do we seek contact with
supercivilizations? We won't understand anything. Af-
ter all, they have been sending us messages in the form
of crop circles for centuries. But we don't have enough
intelligence to read them. So we should not try to solve
problems that are beyond human intellect. We need to
increase our intelligence. And first we have to read the
crop circles in the margins. And what to do next will be
clear late
The phenomenon of déjà vu, which proves the
existence of super civilizations in other time dimen-
sions
This is an extremely interesting phenomenon
[101]. Déjà vu from French translates as "already seen".
There have even been 84 films made on this topic at
different times and in different countries. The essence
of the phenomenon is that practically every person
(more precisely, about 97% of people) sooner or later,
at least once in his life, found himself in a situation in
which he had already been once before. Or so it seems
to him. Psychologists have offered many medical ex-
planations for this phenomenon. But all of them are not
very convincing, since science does not know of any
disease, much less a mental one, with which 97% of the
world's population could have been infected (and
how?).
So let's offer another explanation, but this time a
physical one. It is also quite unusual. Let's assume that
this phenomenon is explained by interference in our life
by our descendants from the distant future, who have
unusually perfect computers capable of calculating our
behavior down to the smallest detail, as well as time
machines, with the help of which our descendants can
move both to the past and future time. Which is plausi-
ble. And then these descendants of ours, in order to cor-
rect their existence in their future, go by time machines
(and for them it is easier and cheaper than other variants
of obtaining the same result) to our past and correct this
past by algorithms created by supercomputers of the fu-
ture (for example, Hitler's mother is married to another
man). Then the inhabitants of the future, naturally, get
to another future, which they like better. And in order
not to lose any of their relatives, who have many other
relatives and friends, etc., they have to interfere in the
lives of all the people currently living on Earth. That is
why the above-mentioned figure of 97% appeared.
Fig. 8. Explanation of the phenomenon of déjà vu occurring as a result of intersection of timelines “going back
in time” and “past time” with the formation of a “loop of time”
And people of our time on Earth because of this
interference in our lives of aliens from the future make
a journey through a time loop (see Fig. 8). Which they
then forget. Or our descendants from the distant future
erase it from our memory. But because of the existence
of the time loop, they have to actually visit the 'déjà vu'
point twice. And this is not erasable from their memory.
The invisible afterlife world, where the Gods
and souls of the dead dwell, really exists
But religions, unlike many modern scientific hy-
potheses that have not been confirmed ex-perimentally,
which for some reason in the twentieth century unrea-
sonably began to be called theories, do not try to de-
ceive people. At least because all world religions, with-
out collusion, actually tell people about the same thing.
That there are Gods. Well, it's true. It was ex-
plained above that the Gods are all-powerful inhabit-
ants of super-civilizations in star systems that appeared
billions of years before our solar system. And who help
humans to become more civilized and advanced. Gods
also through Religions somehow allegorically (and oth-
erwise people would not understand anything and this
information was not preserved to the next generations)
explain to us the structure of the world in which they
and we actually live. Church books are therefore inval-
uable teaching aids for us to learn the science of the
distant future. They also try to instill in us a more hu-
mane morality of these super-civilizations (e.g., in the
form of Christ's commandments), in contrast to the far
from perfect morality that people live by today. And
largely due to the efforts of Religions, people are be-
coming more and more humane.
But Gods and the souls of the dead also have to be
somewhere. The invisible world in which they dwell in
religions is called beyond the grave. And as it is shown
above in the hidden Multiverse and Giperuniverse there](https://image.slidesharecdn.com/sciencesofeuropeno1472024-240901173407-6df3454c/75/Sciences-of-Europe-No-147-2024-48-2048.jpg)
![Sciences of Europe # 147, (2024) 49
are many (perhaps even infinitely many) mutually in-
visible parallel universes in which there are inevitably
super-civilizations. Which therefore may be this invis-
ible afterlife world.
Religions also tell us that people have an immortal
soul that passes into this afterlife world after death.
There are many testimonies of this from people who
have been in a state of clinical death. And the author
believes that this is also true. Therefore, the author is
happy that after his death he will be able to reunite with
his beloved parents, his wife and his wife's parents.
But in the version of STR, studied in physics text-
books, the existence of an invisible afterlife is denied
for quite understandable reasons. It and its inhabitants
- Gods, souls of the dead and others - simply have no
place in this, the only one existing in nature according
to the generally accepted version of STR, our visible
Universe.
Conclusion
Thus, in the article it is experimentally proved and
theoretically explained that up to now studied in all
textbooks of physics the version of SRT, created in the
XX century, is incorrect, because:
• the relativistic formulas obtained in it are in-
correct;
• these formulas are incorrectly explained using
the incorrect postulate called the principle of non-ex-
ceeding of the speed of light;
• from these formulas wrong conclusions about
physical unreality of imaginary numbers and about ex-
istence in the nature of our only visible universe in
which everything is measured only by real numbers are
made.
But in the XXI century, a corrected version of the
STR was created, in which, instead of the incorrect pos-
tulate about not exceeding the speed of light, an exper-
imentally proven principle of the physical reality of im-
aginary numbers is used. And the physical reality of
such numbers is proven by the existence of not only
electrical engineering, radio engineering and computer
technology (which was written about above), but also
by the existence of the natural phenomenon of tsunamis
and even swings swinging on playgrounds, as well as
music created by pianos and other musical instruments.
What more convincing refutations are needed? After
all, these refutations have not been refuted by anyone.
Thus, naturally, the postulate of the generally ac-
cepted version of STR about not exceeding the speed of
light, from which this conclusion about the physical un-
reality of imaginary numbers was made, is also experi-
mentally refuted. For the same reasons, the conclusion
about the existence in nature of our only visible uni-
verse is also refuted. And instead, it is asserted that in
fact, in addition to our visible universe, there are many
other mutually invisible parallel universes. The cor-
rected version of STR also explains that the existence
of these invisible universes can be experimentally
proven by astronomical observations in the starry sky
in the portals of constellations that are invisible outside
the portals.
But the significance for science of the principle of
physical reality of imaginary numbers is not limited to
the possibility of correcting the generally recognized
version of SRT. From this principle follows the neces-
sity of corresponding correction in exact sciences of all
theories and hypotheses in which imaginary numbers
are used.
It also follows from this principle that around us
there exists not only the visible world known and clear
to us, but also a much larger almost completely un-
known and not yet completely cognized by us invisible
world [102]-[111]. Including the invisible afterlife
world [112]-[123], where Gods, souls of the dead and
numerous other inhabitants of supercivilizations dwell.
The author hopes that the realization of all this will
encourage Science and Religion to cooperate mutually
beneficially in their activities for the benefit of people.
Acknowledgments
The author sincerely thanks his wife Olga
Ilyinichna Antonova for her participation in the discus-
sion, understanding and valuable advice, with whose
support he also wrote the book “A Corrected Version
of the Special Theory of Relativity”. And for its publi-
cation he is now looking for a sponsor and publisher
References
1. Larmor J.J. (1897). A Dynamical Theory of the
Electric and Luminifer1.ous Medium. Part III. Rela-
tions with Material Media. Philosophical Transactions
of the Royal Society A: Mathematical, Physical and
Engineering Sciences. 190, 205-300.
2. Lorentz H.A. (1899). Simplified Theory of
Electrical and Optiсal Phenomena in Moving Systems.
Proceedings of the Nether-lands Academy of Arts and
Science. Amsterdam. 1, 427-442.
3. Poincaré H. (1905). On the Dynamics of the
Electron. Comptes Rendus. 140. 1504-1508.
4. Einstein A. (1905). Zur Elektrodynamik
bewegter Korper. Annals of Physic. 17. 891-921.
5. Einstein A. (1920). Relativity: The Special and
General Theory. H. Holt and Company. NY.
6. Bohm D. (2006). The Special Theory of Rela-
tivity. Routledge, Abingdon on Thames.
7. Penrose R. (2010). The Nature of Space and
Time. Princeton University Press. Princeton.
8.Weinstein E.W. (2005). The CRC Concise En-
cyclopedia of Mathematics. 3-rd ed. CRS Press. Roca
Raton. FL.
9. Beckmann P. (1976). A history of π. 3rd edi-
tion. St. Martin Press. NY.
10. Steinmetz C. P. (2010). Theory and Calcula-
tion of Electric Circuit. Nabu Press.
11. Ohm G. S. (2014). Die galvanische Kette. Ver-
lag Der Wissen-schaften. Ohm Göttingen.
12. Ohm G. S. (2015). Gesammelte Abhand-
lungen. Severus Verlag, Hamburg.
13. Antonov A. A. (2021). The version of STR
stated in physics textbooks is incorrect because it de-
nies the existence of radio engineering. 82nd Interna-
tional Scientific Conference of the Eurasian Scientific
Association "Scientific result in theory and practice".
Moscow. ESA. 11-15. https://esa-confer-
ence.ru/sborniki/?y=2021
14. Antonov A. A. (2022). The version of STR
presented in physics textbooks is incorrect, since it fol-](https://image.slidesharecdn.com/sciencesofeuropeno1472024-240901173407-6df3454c/75/Sciences-of-Europe-No-147-2024-49-2048.jpg)


![52 Sciences of Europe # 147, (2024)
61. Antonov A. A. (2021). Experimental evidence
of the incorrectness of the STR version studied in phys-
ics textbooks. Annali d’Italia. 25(1). 32-41.
https://www.anditalia.com/
62. Antonov A. A. (2021). The incorrectness of
the STR version presented in physics textbooks proven
experimentally. Norwegian Journal of development of
the International Science. 74(1). 3-7. DOI:
10.24412/2453-9875-2021-74-53-62.
63. Antonov A. A. (2021). Experimental refuta-
tions of the generally accepted version of the SRT stud-
ied in physics textbooks. International independent sci-
entific journal. 34(1). 23-32. http://www.iis-jour-
nal.com
64. Antonov A. A. (2021). Experimental refuta-
tions of the SRT version in the physics textbooks. Jour-
nal of science. Lyon. 26(1). 29-37.
https://www.joslyon.com/
65. Antonov A. A. (2021). Experimental evi-
dences for the fallacy of the STR version in physics
textbooks. Sciences of Europe (Praha, Czech Repub-
lic). 82(2). 19-28. DOI: 10.24412/3162-2364-2021-82-
2-19-28
66. Antonov A.A. (2023). The Corrected Version
of the Special Theory of Relativity. European Journal
of Applied Sciences. Services for Science and Educa-
tion. UK. 11(5). 68-83. DOI:10.14738/aivp.115.15474
67. Antonov A. A. (2023). Corrected special the-
ory of relativity. Journal of science. Lyon. 48. 27-36.
https://doi.org/10.5281/zenodo.10277156
68. Antonov A. A. (2023). Corrected special the-
ory of relativity. Annali d’Italia. 49, 25-35. DOI:
10.5281/zenodo.10214679
69. Antonov A. A. (2023). The Corrected Version
of the Special Theory of Relativity. The scientific her-
itage. (Budapest, Hungary). 123. 72-81,
70. Antonov A. A. (2023). The Corrected Version
of the Special Theory of Relativity. Norwegian Journal
of development of the International Science. 118. 40-
49. https://doi.org/10.5281/zenodo.10009500
71. Antonov A. A. (2023). Alternative Version of
the Special Theory of Relativity. Sciences of Europe.
(Praha, Czech Republic). 128. 62-71.
72. Antonov A. A. (2023). Special Theory of Rel-
ativity. German International Journal of Modern Sci-
ence. 67. 64-73. DOI: 10.5281/ zenodo.10966458
73. Antonov A. A. (2023). Corrected Version of
the Special Theory of Relativity. Danish Scientific
Journal. 77. 88-97. https://doi.org/10.5281/ze-
nodo.10054677
74. Hinshaw G., Larson D., Komatsu E., et al.
(2013) Nine Year Wilkinson Anisotropy Probe
(WMAP) Observations: Cosmological Parameter Re-
sults. arXiv:1213.5226 [astro-ph/CO].
75. Adam R., Ade P.A.R., Aghanim N., et al.
(2015). Plank 2015 Results. 1. Overview of Products
and Scientific Results. arXiv:1502.01582v2 [astro-
ph.CO].
76. Antonov A. A. (2015). Hidden Multiverse. In-
ternational Journal of Advanced Research in Physical
Science. 2(1). 25-32
http://doi.org/10.17686/sced_rusnauka_2015-903.
77. Antonov A.A. (2015). The astrophysical phe-
nomenon of dark matter and dark energy proves the ex-
istence of the hidden Multiverse. American Journal of
Modern Physics. 4(4). 180-188. DOI:
10.11648/j.jamp.20150404.14
78. Antonov A. A. (2015). Hidden Multiverse: ex-
planation of dark matter and dark energy phenomena.
International Journal of Physics. 3(2). 84-87.
doi:10.12691/ijp-3-2-6
79. Antonov A. A. (2015). Principles and structure
of the real Multiverse: explanation of dark matter and
dark energy phenomena. American Journal of Modern
Physics. 4(1). 1-9. doi: 10.11648/j.ajmp.20150401.11
80. Antonov A. A. (2016). Hypothesis of the Hid-
den Multiverse: Explains Dark Matter and Dark En-
ergy. Journal of Modern Physics. 7(10), 1228- 1246.
doi: 10.4236/jmp.2016.710111
81. Kantor I. L., Solodovnikov A. S. (1989). Hy-
percomplex Numbers: An Elementary Introduction to
Algebras. Springer-Verlag
82. Antonov A. A. (2015). Quaternion structure of
the hidden Multiverse: explanation of dark matter and
dark energy. Global Journal of Science. Frontier Re-
search A: Physics and Space Science. 15(8). 8-15.
https://globaljournals.org/GJSFR_Volume15/2-
Quaternion-Structure-of-the-Hidden.Pdf
83. Antonov A. A. (2016). Verifiable Multiverse.
Global Journal of Science Frontier Research: A Physics
and Space Science. 16(4) 4-12. doi: 10.17406/GJSFR
84. Antonov A. A. (2020). How to See Invisible
Universes. Journal of Modern Physics. 11(05), 593-
607. DOI: 10.4236/jmp.2020.115039
85. Antonov A. A. (2020). Can invisible universes
be seen? International independent scientific journal.
21(2). 51-60. http://www.iis-journal.com
86. Antonov A. A. (2020), How to discover invis-
ible universes. Norwegian Journal of development of
the International Science. 42(1). 36-48.
http://www.njd-iscience.com
87. Antonov A. A. (2020). Universes Being Invis-
ible on Earth outside the Portals Are Visible in Portals.
Natural Science. 12(8). 569-587.
https://doi.org/10.4236/ns.2020.128044
88. Antonov A. A. (2020). Invisible universes can
be seen in anomalous zones. Danish Scientific Journal.
43(1). 9-24. http://www.danish-journal.com
89. Antonov A. A. (2021). Invisible universes can
be seen in anomalous zones. International independent
scientific journal. 23(1). 28-44.
90. Chernobrov, V. (2000). Encyclopedia of mys-
terious places of the Earth. Veche Publishing House.
Moscow. (In Russian).
91. Chernobrov, V. (2004). Encyclopedia of mys-
terious places of Russia. Veche Publishing House.
Moscow. (In Russian).
92. Chernobrov, V. (2007). Encyclopedia of mys-
terious places of the Earth and space. Veche Publishing
House. Moscow. (In Russian).
93. Chernobrov, V. (2009). Encyclopedia of mys-
terious places of Moscow and Moscow region. Helios
ARV Publishing House. Moscow. (In Russian).](https://image.slidesharecdn.com/sciencesofeuropeno1472024-240901173407-6df3454c/75/Sciences-of-Europe-No-147-2024-52-2048.jpg)


![Sciences of Europe # 147, (2024) 55
INFLUENCE OF ULTRASONIC RADIATION ON INTERCALATION OF GRAPHITE WITH
MICROCLUSTER WATER
Yurov V.
Candidate of phys.-mat. sciences, associate professor
KarTU, Karaganda, Kazakhstan
Zhangozin K.
Candidate of phys.-mat. sciences, associate professor
TSK Vostok LLP, Ust-Kamenogorsk, Republic of Kazakhstan,
Kargin D.
Candidate of Physical and Mathematical Sciences, Associate Professor
NAO "L.N. Gumilyov Eurasian National University",
Astana, Kazakhstan
DOI: 10.5281/zenodo.13382647
ABSTRACT
The article presents a model of the thickness of the surface layer of water, from which its cluster structure
flows. The presence of vibrations or ultrasound leads to the stratification of graphite into thin plates or flakes. The
magnitude of these effects depends on their power and the surface tension of the liquid. A model of the splitting
of graphite with water is constructed as a Stefan problem with a moving phase boundary.
Keywords: Graphite, graphene, surface layer, nanostructure, ultrasound, delamination, crystal.
Introduction
To obtain graphene, graphite must be split. The
first successful splitting of graphite by ultrasonic treat-
ment was achieved in the organic solvent N-methylpyr-
rolidone [1]. It was also proposed to exfoliate graphite
by ultrasonic treatment in the presence of surface-ac-
tive substances (surfactants). This was first reported in
[2], where dodecylbenzenesulfonate was used as a sur-
factant. In [3, 4], it was shown that graphene structures
obtained by ultrasonic treatment of graphite and its de-
rivatives contain a lot of oxygen. In [5], multilayer gra-
phene was obtained by ultrasonic splitting of graphite
microparticles in a surface-active solvent, a mixture of
nonane and water, a surface-active surfactant was se-
lected that ensures dispersion of graphene in hydro-
philic systems. In [6], a technology was developed for
obtaining polymers modified with graphene structures
using ultrasonic dispersion (Fig. 1). A complete review
of methods for obtaining graphene by splitting graphite
is given in [7-10].
а) b)
Figure 1. Schematic (a) and external view (b) of the ultrasonic unit of the setup for liquid-phase exfoliation of
graphite [6].
The aim of this article is a theoretical model of
graphite intercalation with microcluster water in ultra-
sound.
Intercalation of graphite with microcluster wa-
ter
We obtained graphene nanoflakes by intercalation
of graphite with microcluster water (MKW) (Fig. 1)
[11-13].](https://image.slidesharecdn.com/sciencesofeuropeno1472024-240901173407-6df3454c/75/Sciences-of-Europe-No-147-2024-55-2048.jpg)
![56 Sciences of Europe # 147, (2024)
а) b)
Figure 2. Intercalation of graphite MKW (a); graphene nanoflakes (b).
The essence of this process is as follows: MKW is
obtained using the method described in [14, 15]; then
the MKW is introduced into the interlayer space of
graphite, followed by the production of graphene
flakes. Let us first consider the structure of cluster wa-
ter.
Cluster water
Graphite practically does not react in pure water.
Its layered structure does not allow water molecules to
penetrate between the graphite layers. Therefore,
graphite remains stable and does not dissolve [16]. In
1993, Ken Jordan proposed his own versions of stable
"water quanta" consisting of 6 of its molecules [17].
Subsequent experiments and ab initio calculations
made it possible to find out more about the cluster
structure of water [18-20]. In their opinion, the compo-
sition of water clusters consists of 3 to 50 water mole-
cules each (Fig. 3). A review of the cluster structure of
water is given in [21].
Figure 3. Clusters in the structure of water [21].
Two Patents (Lorenzen L.H.) more than 20 years
ago described the process of obtaining microcluster wa-
ter [14, 15]. First, the source water is boiled to produce
steam. Next, the steam is passed through a magnetic
field and the steam is condensed at a temperature above](https://image.slidesharecdn.com/sciencesofeuropeno1472024-240901173407-6df3454c/75/Sciences-of-Europe-No-147-2024-56-2048.jpg)
![Sciences of Europe # 147, (2024) 57
0 °C in the presence of light in the range from far infra-
red to ultraviolet spectrum. At least one metasilicate
salt stabilizer and a food additive template are added to
the condensed steam. The concentration of the food ad-
ditive is about 1%. The condensed steam is subjected to
a pressure of more than 1 atm., and then the pressure is
released to produce microcluster water. Microcluster
water gives a resonance NMR signal 170 at 115 HZ,
has a conductivity of at least 3.7 μS/cm and a surface
tension of less than 61 dynes/cm.
Dr. Hidemitsu Hayashi [22] in February 2023 pub-
lished an article against the cluster structure of water.
The most commonly used evidence is the results of nu-
clear magnetic resonance (NMR) [14, 15]. The idea is
that the larger the width of its band, the larger the water
cluster. At first glance, this seems quite convincing.
However, the problem is that the width of the band de-
pends on the pH [22], not on the size of the cluster. Any
deviation from neutral pH in either direction will lead
to a similar result [22]. Dr. Hidemitsu Hayashi argues
that so far there has been no convincing evidence from
a physical and chemical point of view for the existence
of stable water microclusters, and research in this field
has consistently refuted this claim, which is not surpris-
ing, since this claim contradicts the basic and funda-
mental principles of chemistry.
What do we assume about cluster water in this ar-
ticle? According to Rusanov A.I., the thickness of the
surface layer should be understood as a layer of water
that is electrically neutral and has a size of 1-2 nm [23].
According to Ken Jordan's idea [17], this layer of water
consists of 6 of its molecules (6x0.193 = 1.15 nm). In
[24], we obtained R(I) = 1.1 nm for the thickness of the
surface layer of water. This means that the number of
monolayers in the layer R(I) is equal to n = R(I)/a (a =
0.193 nm is the radius of the water molecule) ≈ 6. We
can conclude that the thickness of the surface layer of
water meets the condition of Rusanov A.I. [23] and the
clusters of Ken Jordan [19]. In other words, the cluster
structure of water, like all liquids, is a physical phenom-
enon caused by the difference in the interaction of at-
oms on the surface and in the volume. For liquids, mix-
ing of layers leads to a cluster structure of most of it.
Intercalation of graphite with MKW with a
centrifuge
The experiment (Fig. 4) consisted of centrifuging
the samples at 4000 rpm. Graphite powder (natural
graphite grade GL-1) weighing 6 g was poured into
both vessels, MKW was poured into one vessel, and
distilled [11] into the second vessel. The result is shown
in Fig. 5.
Figure 4. Scheme of the experiment with a centrifuge [11].](https://image.slidesharecdn.com/sciencesofeuropeno1472024-240901173407-6df3454c/75/Sciences-of-Europe-No-147-2024-57-2048.jpg)
![58 Sciences of Europe # 147, (2024)
а) b)
Figure 5. Vessels before (a) and after (b) centrifugation: left (MKW)
and right (distilled water)
After centrifugation for 60 minutes, the level of
the microcrystalline oxide decreases. Fig. 5b shows the
vessels after centrifugation. It is evident that the level
of the microcrystalline oxide has decreased signifi-
cantly, to 12 mm. The intercalation process occurs in a
certain sequence. At first, the adsorption of intercalated
particles on the outer plane of graphite occurs, which is
accompanied by a charge transfer from the carbon
plane to the adsorbed particle. The layers adjacent to
the outer surface are the first to open for intercalation;
their filling leads to the opening of adjacent layers and
their filling with intercalants. Thus, intercalation is a
staged process that occurs along the normal to the base
plane of graphite. Centrifugation accelerates this inter-
calation process.
Ultrasound in the “water-graphite” system
Ultrasonic (US) dispersion of natural [25] and ther-
mally expanded graphite [26, 27] in the “liquid-graphite”
system was carried out in solvents – water, acetonitrile,
toluene, orthoxylene (Fig. 6).
а) b)
Figure 6. Dependences of the time of 50% sedimentation of nanographite particles in different solvents on the
time of ultrasonic treatment (a); SEM image of nanographite (b) [25].
It is evident from Fig. 6 that the optimal system is
the "water-graphite" system, which we will discuss fur-
ther. The source was an ultrasonic bath PSB-Gals (with
a piezoceramic transducer) with an operating frequency
of 50 kHz, a specific power of ultrasonic action of 0.03
W/ml. The suspension was processed for 60 min at a
temperature of 22±2 °C. The main effect of ultrasonic
action on water is cavitation. Acoustic cavitation can
cause both isotropic and anisotropic collapse of bubbles
in water, which leads to shock waves and microjets
(Fig. 7) [28, 29]. Compared with mechanical stirring,
ultrasonic short-term cavitation (bubble collapse) can
generate microjets with a speed of about 110 m/s and
also with a large impact force.](https://image.slidesharecdn.com/sciencesofeuropeno1472024-240901173407-6df3454c/75/Sciences-of-Europe-No-147-2024-58-2048.jpg)
![Sciences of Europe # 147, (2024) 59
Figure 7. Schematic diagram of a shock wave (a) and a microjet (b) formed during the collapse of a cavitation
bubble [28, 29].
Let us consider this issue theoretically as a Stefan
problem, using the analytical solution of the non-sta-
tionary problem obtained by us in [30, 31]. Let us con-
sider a model of the transport flow of an aqueous solu-
tion through graphite placed in a cylindrical glass in an
ultrasonic field.
Let us choose boundary conditions in the simplest
periodic form. In this case, the diffusion problem has
the boundary conditions:
( ) ( )
( ) ( )
( ) ( )
( ) ( ) .
sin
sin
2
,
2
,
,
,
sin
sin
1
,
1
0
,
,
,
sin
sin
0
,
,
,
,
0
,
,
1
2
2
кr
кr
кr
t
C
t
r
t
z
t
z
r
C
t
C
t
r
z
t
z
r
C
t
C
t
z
R
t
t
z
r
C
z
r
t
t
z
r
C
r
C
r
r
r
z
C
Ä
t
C
=
=
=
=
=
=
=
=
=
=
=
+
=
(1)
where C0, C1, C2 are the concentrations of the
graphite substance on the side walls of the water-graph-
ite system and on the moving phase boundary, respec-
tively; ω, k are the cyclic frequency of the disturbing
ultrasonic field and the wave vector.
We have given a general solution to this problem
in [30, 31]:
( ) ( )
( )
( ) ( ) ( )
( )
( )
( )
( ) ( )
( )
( )
( )
( ) .
4
1
4
1
)
,
(
2
)
,
(
2
1
,
,
2
4
0
2
3
1
4
0
2
3
4
0 0
1
0
0
0
4
0
0
2
2
2
2
−
−
+
−
+
+
−
+
=
−
−
−
−
−
−
−
−
−
−
=
d
K
e
t
Ä
z
d
K
e
t
Ä
z
d
e
e
t
d
Ä
R
RI
d
rdr
r
I
r
x
x
dt
e
Ä
e
r
J
t
z
r
C
t
Ä
z
t
t
Ä
z
t
t
Ä
z
Ät
t
ok
ok
t
Ät
z
ę
Ät
îę
(2)
On the z-axis and at r=0, we have](https://image.slidesharecdn.com/sciencesofeuropeno1472024-240901173407-6df3454c/75/Sciences-of-Europe-No-147-2024-59-2048.jpg)
![60 Sciences of Europe # 147, (2024)
( )
( )
( )
( ) ( )
( )
( )
( )
( ) .
4
1
, 2
4
0 2
3
1
4
0 2
3
2
2
−
−
+
−
=
−
−
−
−
−
d
K
e
t
Ä
z
d
K
e
t
Ä
z
t
z
Ń t
Ä
z
t
t
Ä
z
t
(3)
Taking β(τ)=H (i.e. for a finite cylinder of depth H
and radius R), calculating K1(τ) and K2(τ), for the axial
concentration gradient we have:
( )
2
1
4
)
( 2
8
Ń
Ń
e
Ä
z
Ń
t
Ä
h
z
+
=
−
−
.
(4)
where υ, λ are the speed and wavelength of the al-
ternating field; h is the distance to the horizontal plane
coinciding with the average cross-section of the source
of the excited field.
Let us designate:
( )
2
1
8
C
C
Ä
W +
= . (5)
Finally, we can write:
t
Ä
h
z
e
W
z
Ń 4
)
( 2
−
−
=
. (6)
From formula (6) it follows that the presence of
periodic boundary conditions simulating periodic ultra-
sonic action on the “water-graphite” system leads to an
exponential law of change in the vertical component of
concentration, where:
=
2
. (7)
In other words, graphite intercalation will increase
in the system +liquid-graphite" with an increase in the
ultrasound power ~ υ and the surface tension of the liq-
uid ~ γ. The latter dependence follows from equation
(5). According to the classical Newtonian theory [32],
D = ν, where ν is the kinematic viscosity coefficient.
We have shown [13] that ν ~ 1/γ and therefore W ~ γ1/2
.
Let us present some values of γ for some liquids [32].
Table 1.
Surface tension of liquids at 20 ºС
Liquid γ, 10-3
N/m Liquid γ, 10-3
N/m Liquid γ, 10-3
N/m
water 72,75 glycerol 63,40 chloroform 27,14
acetonitrile 26,64 phenol 40,90 benzene 28,88
toluene 28,40 acetone 23,70 ethyl acetate 23,60
orthoxylene 30,10 ethanol 22,80 mercury 465,0
It follows from Table 1 that water has the highest
γ value (except mercury) and surpasses all liquids in the
ultrasonic splitting of graphite (Fig. 6a) for the purpose
of obtaining graphene plates from it. To determine the
thickness of graphene plates, it is necessary to use Ra-
man scattering and the corresponding equipment. Ul-
trasonic splitting of graphite is similar to the effect of a
centrifuge (Figs. 4 and 5), but it is much more effective
since it is possible to use the effect of cavitation of wa-
ter bubbles.
Conclusion
The effect of ultrasound on graphite splitting is far
from complete. Particular attention should be paid to
the theory of cavitation and its nonlinearity. Graphite
splitting is the destruction of solids, where it is neces-
sary to apply the theory of catastrophes. When graphite
splits, many new planes appear that differ significantly
from the properties of bulk graphite. This list can be
continued, but the main thing is to obtain graphene
plates or flakes suitable for their practical application.
This scientific article was published as part of
grant funding for 2024-2026, IRN No. AR32488258
“Development of innovative technology for producing
graphene by intercalating graphite with microcluster
water and modifying HTSC ceramics with graphene”
(the research is funded by the Science Committee of the
Ministry of Science and Higher Education of the Re-
public of Kazakhstan).
References
1. Hernandez Y., Nicolosi V., Lotya M., Blighe
F.M., Sun Z.Y., De S., McGovern I.T., Holland B.,
Byrne M., Gun'ko Y.K., Boland J.J., Niraj P., Duesberg
G., Krishnamurthy S., Goodhue R., Hutchison J., Scar-
daci V., Ferrari A. C. High-yield production of gra-
phene by liquid-phase exfoliation of graphite // Nature
Nanotechnology, 2008, V. 3, № 9. - P. 563-568.
2. Lotya M., Hernandez Y., King P.J., Smith R.J.,
Nicolosi V., Karlsson L.S., Blighe F.M., De S., Wang
Z.M., McGovern I.T., Duesberg G.S., Coleman J.N. Liq-
uid Phase Production of Graphene by Exfoliation of
Graphite in Surfactant/Water Solutions // Journal of the
American Chemical Society, 2009, V. 131, № 10. - P.
3611-3620.
3. Skaltsas T., Ke X.X., Bittencourt C., Tag-
matarchis N. Ultrasonication Induces Oxygenated Spe-
cies and Defects onto Exfoliated Graphene // Journal of
Physical Chemistry C., 2013, V. 117, № 44. - P. 23272-
23278.
4. Bracamonte M.V., Lacconi G.I., Urreta S.E.,
Torres L. On the Nature of Defects in Liquid-Phase Ex-
foliated Graphene // Journal of Physical Chemistry C.,
2014, V. 118, № 28. - P. 15455-15459.
5. Denisyuk I.Yu., Logushkova K.Yu., Fokina
M.I., Uspenskaya M.V. FT-IR spectra of multilayer
graphene and its composition with a surfactant // Optics
and Spectroscopy, 2019, Vol. 126, Issue 2. – P. 177-
179.
6. Rubanik V.V., Savitsky V.O., Rubanik
V.V.ml., Lutsko V.F., Nikiforova I.V., Bui H.T., Doan
D.F. Obtaining graphene structures and nanopolymers
using ultrasonic vibrations // Vector of Science TSU.
2021. No. 3. - P. 74-83.
7. Sattler K.D. (Editor). Сarbon nanomaterials
sourcebook. Graphene, Fullerenes, Nanotubes and
Nanodiamonds. - CRC Press. - 2016. - 561 р.](https://image.slidesharecdn.com/sciencesofeuropeno1472024-240901173407-6df3454c/75/Sciences-of-Europe-No-147-2024-60-2048.jpg)
![62 Sciences of Europe # 147, (2024)
DEFORMATION OF GRAPHENE SHEETS
Yurov V.
TSK Vostok LLP, Candidate of phys.-mat. sciences, associate professor,
Kazakhstan, Karaganda
Zhangozin K.
TSK Vostok LLP, Candidate of phys.-mat. sciences, associate professor,
Kazakhstan, Astana
Kargin D.
NAO "L.N. Gumilyov Eurasian National University", Candidate of phys.-mat. sciences, associate professor,
Kazakhstan, Astana
DOI: 10.5281/zenodo.13382651
ABSTRACT
The article analyzes the issue of warping of graphene sheets in a suspended state. Various mechanisms for
the formation of corrugations, wrinkles and folds on graphene sheets have been proposed. A new model of gra-
phene warping has been proposed. Its essence lies in the fact that graphene is obtained, in most cases, from graph-
ite, where significant internal stresses are present, and in the graphite nanolayer all physical (thermal, etc.) and
chemical (adsorption, etc.) parameters of graphene change.
Keywords: graphite; graphene; nanolayer; mesolayer; warping.
Introduction
Graphene, discovered 20 years ago [1-2], is an
amazing material used in various fields of human activ-
ity (Fig. 1) [3-5]. Today, the global graphene market is
only just forming (Figure 2a) and is represented by
companies in various countries (Figure 2b), where
China and the USA are leaders. The methods for ob-
taining graphene are quite diverse. They are reviewed
in [2-5]. In [7-9], an original innovative method for ob-
taining graphene using microcluster water in combina-
tion with ultrasound and an electric field is proposed.
However, it is not possible to obtain large-sized
graphene due to the warping of graphene sheets.
Figure 1. Graphene and its applications [6].
Global Graphene Market Dynamics in Million USD
(Source: Grand View Research)](https://image.slidesharecdn.com/sciencesofeuropeno1472024-240901173407-6df3454c/75/Sciences-of-Europe-No-147-2024-62-2048.jpg)
![Sciences of Europe # 147, (2024) 63
The purpose of this article is to review previous
work on graphene warping and propose a mechanism
for developing this process.
Review of previous works
In [10], individual graphene sheets suspended
freely on a microframe in vacuum or air were studied.
The results demonstrate internal microscopic rough-
ness, such that the surface normal varies by several de-
grees, and out-of-plane deformations reach 1 nm.
Figure 3a shows a bright-field TEM image of a
suspended graphene membrane. Its central part (the ho-
mogeneous and featureless region indicated by arrows)
is a monolayer graphene. Electron diffraction images
from different parts of the flake show that this is a sin-
gle crystal without domains. The work notes the twisted
upper and lower edges of the graphene. Warping (the
appearance of elastic corrugations) of the graphene
sheets is noted, which is associated with the high mo-
bility of charge carriers in graphene.
Theoretical calculation of this warping of gra-
phene sheets using the Monte Carlo method showed
[11] that the ripples (corrugations) (Figure 3b) sponta-
neously appear due to thermal fluctuations with a size
distribution peaking at about 80 Å, which is compatible
with the conclusions (50-100 Å) of [10].
а) b)
Figure 3. Suspended graphene membrane (a) [10]; sample configuration N = 8640 at T = 300 K. Red arrows
have a length of ~ 80 Å (b) [11]
However, the conclusions of [11] were criticized
in [12], where it was theoretically shown that edge
stresses introduce internal ripples (warping) into free-
standing graphene sheets [10] even in the absence of
any thermal effects (Figure 4).
Figure 4. Shapes of deformed graphene sheets [12]
A review [13] describes various mechanisms of
wrinkle, ripple and fold formation (Figure 5), as well as
the interaction between wrinkle and ripple attributes
(wavelength/width, amplitude/height, length/size and
bending radius) and the electronic properties of gra-
phene and other mechanical, optical, surface and chem-
ical properties.](https://image.slidesharecdn.com/sciencesofeuropeno1472024-240901173407-6df3454c/75/Sciences-of-Europe-No-147-2024-63-2048.jpg)
![64 Sciences of Europe # 147, (2024)
Figure 5. Corrugated (a), wrinkled (b) and crumpled (c) graphene [13]
In the review [13], various mechanisms of wrin-
kle, ripple and wrinkling formation in graphene are de-
scribed, such as (a) thermal vibrations of the two-di-
mensional lattice, (b) edge instability, defects and dis-
locations, (c) negative thermal expansion (in contrast to
positive thermal expansion for the substrate); (d) evap-
oration/removal of the trapped solvent, (e) relaxation of
the prestrained substrate, (f) anchoring on the substrate,
(g) surface potential of the substrate and (h) surface ten-
sion of the solvent. The deformation of graphene is con-
trolled by its mechanical properties (Young's modulus,
interfacial energy and number of layers), and the result-
ing corrugations change its electronic structure (open-
ing of the band gap (potentially > 1 eV), pseudomag-
netic field in bilayers, formation of electron-hole pud-
dles and charge carrier transport). These, in turn, can be
used to modify graphene's wettability, transmittance,
chemical potential, expansion for energy storage, and
conductivity. In the near future, it is important to (a)
control the physical properties of these corrugations;
(b) carefully study the effects of the ripples on the elec-
tronic, optical, mechanical, and chemical properties;
and (c) study these effects on other 2D nanomaterials.
In [14], molecular dynamics (MD) simulations were
performed to study the effect of ripples on the Poisson's
ratio of graphene. Due to the atomic-scale thickness of
graphene, out-of-plane ripples are generated in free-
standing graphene with topological defects (e.g., hepta-
gons and pentagons) to release in-plane strain energy.
Using MD simulations, it was found that the Poisson's
ratio of rippled graphene decreases with increasing its
aspect ratio η (wavelength amplitude). For the rippled
graphene sheet with η = 0.188, a negative Poisson's ra-
tio of 0.38 is observed for a tensile strain of up to 8%,
while the Poisson's ratio for η = 0.066 is almost zero.
Under uniaxial tension, the ripples gradually become
flat, so the Poisson's ratio of the rippled graphene is de-
termined by the competing factors of the intrinsic posi-
tive Poisson's ratio of graphene and the negative Pois-
son's ratio due to the wrinkle-smoothing effect. In ad-
dition, the rippled graphene exhibits excellent tensile
strength and toughness. Due to the combination of its
acoustic and excellent mechanical properties, the rip-
pled graphene may have potential for applications in
nanodevices and nanomaterials. Illustrations of five
rippled graphene sheets are shown in Figure 6.](https://image.slidesharecdn.com/sciencesofeuropeno1472024-240901173407-6df3454c/75/Sciences-of-Europe-No-147-2024-64-2048.jpg)
![Sciences of Europe # 147, (2024) 65
Figure 6. Illustrations of five corrugated graphene sheets with aspect ratios
η = (h/l) = 0.066 (a), η = 0.086 (b), η = 0.116 (c), η = 0.166 (d), η = 0.188 (e)
In Figure 6, heptagonal and pentagonal defects are
marked in red and blue. (f) Side view η = 0.188, where
h is the amplitude and l is the wavelength.
We note the latest work [15] on graphene on a sim-
ilar issue. Using the MD method, the features of the de-
formation behavior and the process of destruction of
graphene containing dislocation dipoles with different
shoulders were analyzed. Warping of graphene during
deformation was taken into account, which greatly re-
duces its strength.
It was found that an increase in temperature has
little effect on the mechanical properties of graphene
with dislocation dipoles, in contrast to defect-free gra-
phene and graphene with a Stone-Wales defect. It was
shown that a change in the distance between disloca-
tions in a dipole does not have a noticeable effect on the
elastic modulus and strength of graphene, however, the
presence of dislocation dipoles can affect the warping
of graphene during stretching.
Our model
Let's turn to our model. Let's start with graphite,
which is an allotropic modification of carbon (Figure
7a). If you split off one monolayer from graphite, you
get graphene (Figure 7b).
а) b)
Figure 7. Crystal structure of graphite (a) and graphene (b)
In works [16-17] for the thickness of the surface
layer R(I) of a solid (including graphite) the formula
was obtained:
(m)
υ
10
0,17
R(I) 9
−
= . (1)
The model is shown schematically in Figure 8a.
Equation (1) shows that the thickness of the surface
layer R(I) is determined by one parameter – the molar
(atomic) volume of the element (υ = M/ρ, M is the mo-
lar mass (kg/mol), ρ is the density (kg/m3
)), which pe-
riodically changes in accordance with the table of D. I.
Mendeleyev (Figure 8b).](https://image.slidesharecdn.com/sciencesofeuropeno1472024-240901173407-6df3454c/75/Sciences-of-Europe-No-147-2024-65-2048.jpg)
![66 Sciences of Europe # 147, (2024)
а) б)
Figure 8. Schematic representation of the surface layer (a), periodic change in the atomic volume of elements (b)
The parameters of graphite and graphene are given
in Table 1. In Table 1: Tm is the melting temperature; γ
is the surface energy (surface tension) on the a and c
faces.
Table 1.
Parameters of graphite and graphene
Carbon ρ, g/sm3
Tm, К R(I)a, nm R(I)c, нм γа, mJ/m2
γс, mJ/m2
Graphite 2,26 3970 0,90 (3) 2,46 (3) 2779 591
Graphene 2,23 4510 0,246 (1) 0,14 (1) 3157 -
In work [18] it is shown that the surface energy of
a bulk metal γ2 with an accuracy of up to 3% is equal
to:
],
[J/m
T
10
0,7 2
m
3
2
=
−
(2)
where Tm is the melting temperature of the metal
(K). In the R(I) layer, the size effect must be taken into
account and the surface energy of the R(I) layer be-
comes equal to γ1 [19]:
,
3
,
0
)
)
(
/
)
(
1
( 2
2
1
+
−
=
h
I
R
I
R (3)
where γ12 is the surface energy at the phase bound-
ary, which is negligibly small due to the second-order
phase transition.
To separate the R(I) layer from the rest of the crys-
tal, energy must be expended, which is called the adhe-
sion energy [20]:
.
2
1
12
2
1
+
−
+
=
a
W (4)
Internal stresses σis between phases γ1 and γ2 can
be calculated using the formula [20]:
,
)
(
/ I
R
Ĺ
Wa
is
=
(5)
where E is the Young's modulus of elasticity.
Using equations (1) - (5), we calculate the elastic
parameters for graphite and graphene (table 2). In [21],
it is shown that even small deformations of graphene
within 10% are sufficient for warping of its surface
Table 2.
Elastic parameters of graphite and graphene
Carbon Waа, J/m2
Waс, J/m2
σisа, GPа σisс, GPа Еа, GPа Ес, GPа
Graphite 2,853 1,690 4,9 1,36 7,59 3,48
Graphene 3,448 - 118,4 1000 -
Significant internal stresses σisа in graphene defi-
nitely lead to warping of graphene sheets. If in Table 2
we take σisа = 118.4 GPa for 100% for graphene, and
σisа = 4.9 GPa for x% for graphite, then during the for-
mation of graphene we will obtain a graphene defor-
mation of 4%, which is slightly lower than the men-
tioned 10%.
The work [22] can be cited on the warping of the
graphene surface due to internal stresses. It shows an
AFM image of the graphene surface, from which it is
evident that the surface consists of domains measuring
20 x 50 nm, oriented in one direction and forming
“folds” on the graphene surface with a height of 1 nm
(see the work [10] above). In this case, the roughness
value on an area of 0.5 x 0.5 μm is Ra = 0.25 nm.
In Table 1, the number of monolayers n = R(I)/a
(a is the lattice constant) is given in brackets; for graph-
ite n = 3, for graphene n = 1. Thus, graphite has three
monolayers, which are confirmed in [23, 24] (Figure 9).](https://image.slidesharecdn.com/sciencesofeuropeno1472024-240901173407-6df3454c/75/Sciences-of-Europe-No-147-2024-66-2048.jpg)
![Sciences of Europe # 147, (2024) 67
а) b)
Figure 9. Change in atomic voltage (red line) and maximum average pressure (green line) depending on the
number of graphene layers (a) [23]; dependence of the thermal conductivity coefficient of films composed of
several graphene layers on their number (b) [24]
Both figures clearly show that the R(I) layer for
graphite contains three layers, which indicates the va-
lidity of model (1). More than three layers of graphene
transform into graphite and the values of the quantities
in Figure 9 cease to depend on the number of layers.
The first monolayer of graphite - graphene, has
strong covalent σ-bonds C-C in the plane of the gra-
phene sheet in combination with π-electrons outside it
determines the unique physicochemical properties of
graphene, such as a large theoretical specific surface
area (~ 2600 m2
/g), high mobility of charge carriers (~
200,000 cm2
/V•s), high Young's modulus (~ 1000
GPa), thermal conductivity (~ 5000 W/ m K), optical
transparency (~ 97.7%), mechanical strength, etc. [1-
5].
Bilayer graphene differs from single-layer gra-
phene and graphite. It is actively studied [25] due to its
controlled band gap. The analogue of bilayer graphene
is Stone-Wales graphene or SW graphene, which is
more stable in structure than graphene [26]. Three-layer
graphene differs from the latter two in its mobility and
conductivity [27]. After its magic angle twisting, it de-
velops superconductivity, which withstands magnetic
fields 2-3 times greater than the Pauli limit for spin-sin-
glet pairing [28]. The following equations follow from
equation (1) and Figure 8a [16]:
),
(
0
,
)
(
)
(
1
)
(
)
(
)
(
,
)
(
1
A
A(r)
0
0
I
R
r
r
I
R
I
R
A
r
A
II
R
r
I
R
r
I
R
+
−
=
−
=
(6)
where A(r) is a property of the nano- and
mesolayer; A0 is a property of the volume; r = z (Figure
8a).
The size effects in the R(I) layer are determined by
the entire collective of atoms in the system (collective
processes). Such size effects are observed only in nano-
particles and nanostructures [29]. In the nanostructured
R(I) layer with solid atoms, reconstruction or relaxation
occurs, associated with the restructuring of the surface
[30]. This is one of the variants of graphene warping.
The R(I) surface layer is a synergetic system, the fun-
damental properties of which are subject to self-regula-
tion and self-organization. At h = R(I), a second-order
phase transition (according to Ehrenfest) occurs, where
a jump in heat capacity occurs (Figure 8a). We consid-
ered this effect in [31]. The R(II) layer, which we will
call the mesostructure (Figure 5a), extends to approxi-
mately the size h ≈ 9 R(I), where the bulk phase begins.
From this size (< 9 R(I)) size effects of a different type
begin. The difference between mesostructures and
nanostructures and the bulk phase is that only in these
systems are flicker noises with a spectrum of the 1/fb
type observed [32]. In the R(II) layer, there should be
many size effects associated with temperature [33],
magnetism [34], optics [35], and other properties. In the
R(I) nanolayer, all its physical parameters change, in-
cluding the graphene monolayer. They lead to a viola-
tion of the basic laws, in particular, to a violation of the
Wiedemann-Franz law (Figure 10) [36]. If we take the
Lorentz number L(h) included in equation (6) as the
physical property A(h), then at 1-R(I)/R(I)+h ≈ exp[-
(R(I)/R(I)+h)] in the nanolayer it will be = L0/exp[-
(R(I)/R(I)+h)]. After this, the Lorentz number, that is,
at h = 0 and at h = R(I) will be equal to: L(h=0) = L0/e;
L[h= R(I)] = L0/e0.5
. The Lorentz number decreases on
the metal surface by 2.72 times, and at the boundary of
the R(I) layer – by 1.65 times. All this is shown in Fig-
ure 10a. In the mesolayer, the Lorentz number will de-
pend on formula 1 in equation (6), while 1-R(I) ≈ exp(-
R(I)/h). Then L[R(I)/9R(I)] = L0 (1/e0.9
) ≈ L0 and the
Lorentz number will look like in Figure 10b.](https://image.slidesharecdn.com/sciencesofeuropeno1472024-240901173407-6df3454c/75/Sciences-of-Europe-No-147-2024-67-2048.jpg)
![68 Sciences of Europe # 147, (2024)
а) b)
Figure 10. Lorentz number in the nanolayer (a) and in the mesolayer (b) [36]
Figure 10a shows that the Lorentz number in the nanolayer R(I) decreases in a stepwise manner, proving its
quantum structure.
Large graphene sheets have only been obtained by
depositing it on pure copper and nickel foils [3-4]. If we
take into account that according to formula (1): for cop-
per R(I) = 1.2 (3) nm; for nickel R(I) = 1.1 (3) nm and
compare these values with those indicated in Table 1,
then the conclusion follows that they have close R(I)
values and also contain three nanolayers. This corre-
spondence opens the way to creating larger graphene
sizes, which is relevant for surface engineering of this
amazing material.
Conclusion
Thus, the warping of graphene sheets is due to the
fact that it is obtained, in most cases, from graphite,
where significant internal stresses are present, and in
the graphite nanolayer all physical (thermal, etc.) and
chemical (adsorption, etc.) parameters of graphene
change.
This scientific article was published as part of
grant funding for 2024-2026, IRN No. AR32488258
“Development of innovative technology for producing
graphene by intercalating graphite with microcluster
water and modifying HTSC ceramics with graphene”
(the research is funded by the Science Committee of the
Ministry of Science and Higher Education of the Re-
public of Kazakhstan).
References
1. Novoselov K.S., Geim A.K., Morozov S.V.,
Jiang D., Zhang Y., Dubonos S.V., Grigorieva I.V.,
Firsov A.A. Electric field effect in atomically thin car-
bon films // Science, 2004, V. 306, № 5696. - P. 666-
669.
2. Novoselov K.S. Graphene: materials of Flat-
land // UFN, 2011, Vol. 181, No. 12. - P. 1299-1311.
3. Baimova Yu.A., Mulyukov R.R. Graphene,
nanotubes and other carbon nanostructures. - M.: Rus-
sian Academy of Sciences, 2018. - 212 p.
4. Zhang T. Graphene. From Theory to Applica-
tions. - Springer, 2022. - 142 р.
5. Gupta R.K. (Editor) 3D Graphene. Fundamen-
tals, Synthesis and Emerging Applications. - Springer,
2023. – 441 р.
6. Garshev A.V. Monitoring the development
and implementation of technologies for obtaining gra-
phene, its derivatives, other 2D crystals and the produc-
tion of products based on 2D crystals in the Russian
Federation and the world. - M .: RF Report, 2019. - 396
p.
7. Zhangozin K.N., New method for obtaining
graphene by intercalation of graphite with microcluster
water. - Almaty: Darkhan, 2023. – 102 p.
8. Yurov V.M., Zhangozin K.N., Zhanabergenov
T.K., Kargin D.B. Surface phenomena in graphite and
obtaining graphene from it // Science News of Kazakh-
stan, 2024, No. 1. - P. 11-23.
9. Meyer J.C., Geim A.K., Katsnelson M.I., No-
voselov K.S., Booth T.J. & Roth S. The structure of
suspended graphene sheets // Nature, 2007, Vol. 446. –
P. 60-63.
10. Fasolino A., Los J.H., Katsnelson M.I. Intrin-
sic ripples in graphene // Nature Mater., 2007, Vol. 6. –
P. 858-861.
11. Shenoy V.B., Reddy C.D., Ramasubramaniam
A., Zhang Y.W. Edge-Stress-Induced Warping of Gra-
phene Sheets and Nanoribbons // Phys. Rev. Lett.,
2008, Vol. 101, 245501.
12. Deng S., Berry V. Wrinkled, rippled and
crumpled graphene: an overview of formation mecha-
nism, electronic properties, and applications // Mater.
Today, 2016, Vol. 19. – Р. 197-212.
13. Qin H., Sun Y., Liu J.Z., Li M., Liu Y. Nega-
tive Poisson’s ratio in rippled graphene // Nanoscale,
2017, Vol. 9. - Р. 4135-4142.
14. Akhunova A.Kh., Baimova Yu.A. Influence
of dislocation dipoles with different shoulders on the
deformation behavior of graphene: molecular dynamics
// Journal of Technical Physics, 2023, vol. 93, issue. 4.
– P. 445-452.
15. Yurov V.M. Surface layer thickness of atomi-
cally smooth crystals // Physicochemical aspects of the
study of clusters, nanostructures and nanomaterials,
2019, issue 11. - P. 389-397.
16. Yurov V., Zhangozin K. Аbout the mecha-
nism of graphite splitting // International independent
scientific journal, 2024, №58. – Р. 29-40.
17. Rekhviashvili S.Sh., Kishtikova E.V., Karmo-
kova R.Yu. On the calculation of Tolman's constant //
Letters to the Journal of Technical Physics. - 2007. -
Vol. 33. - Issue 2. - P. 1–7.
18. Yurov V.M., Goncharenko V.I., Oleshko V.S.
Study of primary nanocracks of atomically smooth
metals // Letters to JTF, 2023, vol. 49, issue 8. - P. 35-
38.
19. Zimon A.D. Adhesion of films and coatings //
M.: Chemistry, 1977. – 352 p.
20. Katin K.P. Effect of mechanical deformations](https://image.slidesharecdn.com/sciencesofeuropeno1472024-240901173407-6df3454c/75/Sciences-of-Europe-No-147-2024-68-2048.jpg)

![70 Sciences of Europe # 147, (2024)
PSYCHOLOGICAL SCIENCES
ASSESSMENT OF DENTISTS’ SELF-REPORTED LEVELS OF INCOME AND BURNOUT
DIMENSIONS: A PRELIMINARY INVESTIGATION
Avramova N.
DDS, PhD, MPH, Associate Professor, Department of Dental Public Health, Faculty of Dental Medicine,
Medical University – Sofia, Bulgaria
DOI: 10.5281/zenodo.13382663
ABSTRACT
The aim of this preliminary investigation was to assess dental professionals’ income satisfaction and its re-
lated levels of burnout dimensions: EE, DP, and PA. An anonymous descriptive cross-sectional survey was held
among 156 dentists working in the capital of Republic of Bulgaria, Sofia. The questionnaire consisted of demo-
graphic data and the Maslach Burnout Inventory-Human Services Survey (MBI-HSS) sections. A total of 136
dentists provided duly completed questionnaires (RR = 90.7%), of which 56 (41.2%) were males. Surprisingly,
almost a quarter – 32 (23.5%), reported having unsatisfactory income from dentistry contrary to the notion that
this occupation was considered well paid and providing security in this regard. This group of dentists demonstrated
higher levels of burnout than those with good or excellent income. They exhibited higher scores mainly in EE and
reduced PA subscales. Therefore, recommendations for positive outcomes of dental procedures which are crucial
for patient well-being and satisfaction, might have a key role in evaluation of achieved results, including their
financial aspect. Ultimately, better compensation, motivation and performance could effectively help reduce the
risk of burnout.
Keywords: dentists, dentistry, burnout, income satisfaction, MBI-HSS.
Introduction
One of the most widely used definitions of burnout
given by Maslach and Jackson determines burnout as a
syndrome of emotional exhaustion, depersonalization
and a feeling of dissatisfaction with self-realization [1-
3]. Emotional exhaustion (EE) refers to depletion of
emotional resources caused by the presence of conflicts
of a different nature – internal, interpersonal, etc. De-
personalization (DP) refers to development of a nega-
tive, heartless and cynical attitude towards service re-
cipients. The term depersonalization can cause some
confusion because it is used in psychiatry to refer to ex-
treme alienation from oneself and the world. However,
in Maslach and Jackson’s definition, depersonalization
refers to an impersonal and dehumanizing treatment of
recipients rather than oneself. Finally, the failure to
achieve the desired personal realization gives rise to a
tendency to evaluate the work with the recipients as
negative. Thus, among “burned out” professionals, the
feeling of unachieved goals is accompanied by low pro-
fessional self-esteem [2,4].
Regarding dentistry, a very well-documented fact
has been the association of burnout and career satisfac-
tion rates with dental professionals’ quality of life and
respectively, the quality of dental services provided [5].
In this aspect, studies focusing on evaluation of burnout
predictors might be of great significance for both den-
tists’ and patients’ physical and psychological well-be-
ing. Multiple lines of evidence have suggested a posi-
tive relationship between chronic occupational distress
and burnout levels [6-8]. Zhang et al. reported that fac-
tors associated with psychological distress for dentists
were lower income, career-choice regret, lack of suffi-
cient personal time, etc. [9]. According to Wasoski eco-
nomic factors such as the cost of a dental education or
the start-up costs of a practice might be significant
stressors if not considered as a career investment [8].
Ciğerim et al. found that monthly income was inversely
associated with depression [10]. Therefore, ensuring
adequate and equitable financial income could be iden-
tified as an effective strategy for affecting job motiva-
tion, career satisfaction, and burnout levels [5,11].
The aim of this preliminary investigation on burn-
out rates among Bulgarian dentists was to assess dental
professionals’ income satisfaction and its related levels
of burnout dimensions: EE, DP, and PA.
Material and methods
An anonymous descriptive cross-sectional survey
was held among 156 dentists working in the capital of
Republic of Bulgaria, Sofia. Inclusion criteria for all
study participants were: 1) to be dentists with least one-
year practical experience; 2) to be working in individ-
ual or group practices for primary or specialized dental
care, dental or medical and dental centers; 3) to be vol-
untary consent to take part in the present study.
Questionnaires were administered at the dental of-
fices of the participants and the latter were not offered
any additional incentives or rewards for taking part in
the study. Dentists were informed about the purpose of
the study, the methods used, and were given precise in-
structions prior to filling out the surveys. Additionally,
they were kindly asked to answer all questions anony-
mously and honestly. Respondents were assured that
their anonymity and data confidentiality would be pre-
served. Voluntary completion of the questionnaire was
accepted as a form of individual written informed con-
sent to participate in the study. Furthermore, the latter
was conducted in full accordance with the ethical stand-
ards of the Ethics research committee at the MU-Sofia
and the WMA Declaration of Helsinki as revised in
2013.
The main research instrument consisted of two
parts: 1. Socio-demographic profile and characteristics
of the workplace; 2. Standard burnout research meth-
odology, through the Maslach Burnout Inventory
(MBI-HSS; Maslach & Jackson, 1996). The first part](https://image.slidesharecdn.com/sciencesofeuropeno1472024-240901173407-6df3454c/75/Sciences-of-Europe-No-147-2024-70-2048.jpg)
![Sciences of Europe # 147, (2024) 71
contained 20 questions, grouped into three sections, re-
lated to collecting information on dentists’ socio-demo-
graphic characteristics, working environment factors,
dentists’ self-assessment about the income received
from the dental practice, the presence of activities not
related to work (hobbies or side interests); presence of
unhealthy stereotypes related to lifestyle (smoking, al-
cohol abuse, sedative medications, antidepressants or
sleeping pills, as well as insomnia) and issues related to
professional planning and the desire to work after re-
tirement. The questions were close ended, some of
them with an option to specify more than one answer.
The second part of the questionnaire contained 22 state-
ments to measure the three aspects of burnout – emo-
tional exhaustion – EE (nine items); depersonalization
– DP (five items) and personal accomplishment – PA
(eight items). Answers to the questions in the three sub-
scales of the MBI-HSS were assessed on a seven-point
Likert scale with codes from 0 to 6: 0 – no, never; 1 –
very rare; 2 – rarely; 3 – sometimes; 4 – often; 5 – very
often; 6 – always (Maslach & Jackson, 1986) [12]. The
Bulgarian translation of the questionnaire was validated
and used by medical personnel in Bulgaria by B. Tse-
nova (1991, 2002, 2004) [13]. The internal consistency
reliability of the entire questionnaire was good – 0.757.
For the EE, DP and PA subscales, it was 0.926, 0.726
and 0.816, respectively [14]. Finally, dentists’ self-re-
ported level of income was assessed by using a 3-point
scale: excellent, good and unsatisfactory.
Data were processed with the statistical package
IBM SPSS Statistics v.25.0. Standard descriptive sta-
tistics was used to present demographic data of the
study sample as well as the levels of EE, DP and PA in
the context of respondents’ self-perceived level of in-
come. Results were presented as frequency distribu-
tions (number, percentage).
Results and discussion
A total of 156 questionnaires were initially distrib-
uted, 5 were excluded as more of the questions were left
unanswered, 1 dentist refused to participate. Subse-
quently, there were left 150 surveys, of which 136 were
duly completed (RR = 90.7%). Of these, 56 (41.2%)
were males and 80 (58.8%) were females. Further de-
mographic data of the sample can be seen in Table 1.
Table 1
Demographic characteristics of the study sample (n=136)
Variables N %
Age
25-40 years 32 23.5
41-55 years 72 53.0
56+ 32 23.5
Gender
Male 56 41.2
Female 80 58.8
Years in practice
Up to 15 years 48 35.3
16-30 years 56 41.2
30+ years 32 23.5
Type of dental practice
Individual 80 58.8
Group 56 41.2
Ownership of dental office
Own dental office 80 58.8
Rented dental office 40 29.4
Own + rented dental office 16 11.8
In this study dentists’ self-assessment regarding
the amount of their income from dental practice was in-
vestigated by using a three-point scale – excellent, good
and unsatisfactory. The results suggested that more
than half of the respondents – 72 (53%) – defined their
income from the dental practice as good. Almost a
quarter – 32 (23.5%) indicated that they had very good
(excellent) income. However, the remaining one quar-
ter of respondents – 32 (23.5%), reported having unsat-
isfactory income from dentistry contrary to the notion
that this occupation was considered well paid and
providing security in this regard.
When analyzing burnout dimensions and levels of
income, data revealed that in the group of dentists with
very good and good income, moderate and low levels
of emotional exhaustion prevailed while high levels of
EE were more prevalent among dentists with unsatis-
factory income (table 2).](https://image.slidesharecdn.com/sciencesofeuropeno1472024-240901173407-6df3454c/75/Sciences-of-Europe-No-147-2024-71-2048.jpg)
![72 Sciences of Europe # 147, (2024)
Table 2
Frequency distribution of dentists by income and emotional exhaustion (EE)
EE
Income
Low level
(n, %)
Moderate
level (n, %)
High level
(n,%)
Very high
level (n, %)
Total
(n, %)
Excellent 8(14.3%) 16(50%) 8(25%) 0(0%) 32(23.5%)
Good 32(57.1%) 16(50%) 8(25%) 16(100%) 72(53%)
Unsatisfactory 16(28,6%) 0(0%) 16(50%) 0(0%) 32(23.5%)
Total (n, %) 56(100%) 32(100%) 32(100%) 16(100%) 136(100%)
Regarding depersonalization subscale, we found
that respondents with good income predominantly
demonstrated moderate levels of DP. There were no
prevailing trends among the other two groups of exam-
ined subjects with respect to this dimension of burnout
(Table 3). Finally, assessment of data concerning the
third aspect of burnout syndrome showed that dentists
having excellent and good levels of self-reported in-
come mainly exhibited moderate level of reduced per-
sonal accomplishment (PA). High level of reduced PA
was primarily registered in the group of dentists that re-
ported having unsatisfactory income from dentistry
(Table 4).
Table 3
Frequency distribution of dentists by income and depersonalization (DP)
DP
Income
Low level
(n, %)
Moderate
level (n, %)
High level
(n,%)
Very high
level (n, %)
Total
(n, %)
Excellent 8(33.3%) 8(16.7%) 8(33.3%) 8(20%) 32(23.5%)
Good 8(33.3%) 32(66.6%) 8(33.3%) 24(60%) 72(53%)
Unsatisfactory 8(33.3%) 8(16.7%) 8(33.3%) 8(20%) 32(23.5%)
Total (n, %) 24(100%) 48(100%) 24(100%) 40(100%) 136(100%)
Table 4
Frequency distribution of dentists by income and personal accomplishment (PA)
Reduced PA
Income
Low level
(n, %)
Moderate
level (n, %)
High level
(n,%)
Very high
level (n, %)
Total
(n, %)
Excellent 8(25%) 16(28.6%) 0(0%) 8(50%) 32(23.5%)
Good 16(50%) 40(71.4%) 16(50%) 0(0%) 72(53%)
Unsatisfactory 8(25%) 0(0%) 16(50%) 8(50%) 32(23.5%)
Total (n, %) 32(100%) 56(100%) 32(100%) 16(100%) 136(100%)
Conclusion
Dentists that reported having unsatisfactory in-
come from their dental practice demonstrated higher
levels of burnout than those with good or excellent in-
come. They exhibited higher scores mainly in EE and
reduced PA subscales. Therefore, recommendations for
positive outcomes of dental procedures which are cru-
cial for patient well-being and satisfaction, might have
a key role in evaluation of achieved results, including
their financial aspect. Ultimately, better compensation,
motivation and performance could effectively help re-
duce the risk of burnout.
Statement of conflict of interest
The author declares that there is no conflict of in-
terest with this research article.
References
1. Avramova N. Burnout syndrome and dental
practice - essence, prerequisites, symptoms and coping
strategies. In: "Public dental health - achievements,
challenges, perspectives", Sofia, 2016, 120-131 [Pub-
lished in Bulgarian].
2. Harizanova S, Stoyanova R. Burnout syn-
drome. A practical guide to diagnosis, assessment and
prevention. Lax book, Plovdiv, 2017, 66 p. [Published
in Bulgarian].
3. Della Valle E, De Pascale G, Cuccaro A, Di
Mare M, Padovano L, Carbone U, Farinaro E. Burnout:
rising interest phenomenon in stressful workplace. Ann
Ig. 2006 Mar-Apr; 18(2):171-7 [Article in Italian].
4. Harizanova S. Burnout syndrome in prison
workers. PhD Thesis. Plovdiv, 2014 [Published in Bul-
garian].
5. Antoniadou M. Quality of Life and Satisfac-
tion from Career and Work-Life Integration of Greek
Dentists before and during the COVID-19 Pandemic.
Int J Environ Res Public Health. 2022 Aug
10;19(16):9865. doi: 10.3390/ijerph19169865.
6. Choy HB, Wong MC. Occupational stress and
burnout among Hong Kong dentists. Hong Kong Med
J. 2017 Oct;23(5):480-8. doi: 10.12809/hkmj166143
7. Avramova N. Self-Perceived Sources of Stress
and Burnout Determinants in Dentistry - A Systematic
Review. Galician medical journal. 2023; 30(1):
E202317. doi: 10.21802/gmj.2023.1.7.
8. Wasoski RL. Stress, professional burnout and
dentistry. J Okla Dent Assoc. 1995 Fall;86(2):28-30.](https://image.slidesharecdn.com/sciencesofeuropeno1472024-240901173407-6df3454c/75/Sciences-of-Europe-No-147-2024-72-2048.jpg)
![Sciences of Europe # 147, (2024) 73
9. Zhang Y, Yan L, Long H, Yang L, Wang J,
Liu Y, Pu J, Liu L, Zhong X, Xin J. Occupational Dif-
ferences in Psychological Distress Between Chinese
Dentists and Dental Nurses. Front Psychol. 2022 Jul
1;13:923626. doi: 10.3389/fpsyg.2022.923626.
10. Ciğerim L, Orhan ZD, Doğru İ, Kahraman
NH, Hussein A, Baş H. Factors Influencing Burnout
Syndrome and Depression in Dentists across Various
Institutions. Medicina (Kaunas). 2024 Mar
21;60(3):517. doi: 10.3390/medicina60030517.
11. Sabitova A, Hickling LM, Toleubayev M, Jo-
vanović N, Priebe S. Job morale of physicians and den-
tists in Kazakhstan: a qualitative study. BMC Health
Serv Res. 2022 Dec 10;22(1):1508. doi:
10.1186/s12913-022-08919-x.
12. Maslach C. Job Burnout: New Directions in
Research and intervention. Current Directions in psy-
chology science. 2003; 5: 189-192.
13. Yankova GT. Healthcare and Burnout Syn-
drome in the Context of Occupational Activity. [PhD
thesis] Medical University-Sofia, 2016 [Published in
Bulgarian]
14. Avramova N. Medico-psychological problems
in dental practice and their impact on the personality
and professional activity of the dentist. Direct Services
Ltd, Sofia, 2021, 218 pp. [Published in Bulgarian]](https://image.slidesharecdn.com/sciencesofeuropeno1472024-240901173407-6df3454c/75/Sciences-of-Europe-No-147-2024-73-2048.jpg)
![74 Sciences of Europe # 147, (2024)
TECHNICAL SCIENCES
ANALYSIS OF FISHERIES IN THE KYRGYZ REPUBLIC IN MODERN CONDITIONS:
CHALLENGES AND OPPORTUNITIES
Aksupova A.
Kyrgyz State Technical University named after. I. Razzakova
Bishkek Center for Testing, Certification and Metrology of the Center for Standardization and Metrology
under the Ministry of Economy and Commerce of the Kyrgyz Republic
Dzhamakeeva A.
Kyrgyz State Technical University named after. I. Razzakova
Aksupova A.
Limited Liability Company "Testing and Certification Center"
DOI: 10.5281/zenodo.13382673
ABSTRACT
The article examines the current state of fisheries in the Kyrgyz Republic and analyzes the key challenges
and opportunities facing this industry. The study used data on production indicators, export and import of fish
products, as well as environmental aspects of fish farming. Particular attention is paid to the impact of climate
change, environmental problems and economic factors affecting the development of fisheries. Based on the anal-
ysis, recommendations were proposed to improve the management of fisheries resources and increase their sus-
tainability in a changing environment.
Keywords: fisheries, aquaculture.
Purpose of the study:
Conduct an analysis of fisheries in the Kyrgyz Re-
public in modern conditions to identify challenges and
opportunities in this secto.
Research objectives:
1. Assess the current state of fisheries: Analyze the
existing structures, processes and results of fisheries in
the country.
2. Identify key challenges: Identify the problems
and difficulties faced by fisheries, including environ-
mental, economic and technical aspects.
3. Analyze opportunities: Explore potential oppor-
tunities for fisheries development, including the intro-
duction of new technologies, improved resource man-
agement and expanded markets.
4. Assess the influence of environmental and eco-
nomic factors: Investigate how changes in environmen-
tal and economic conditions affect fisheries and their
productivity.
5. Develop recommendations: Based on the anal-
ysis, offer recommendations for improving the condi-
tion of fisheries, increasing their efficiency and sustain-
ability.
6. Determine staffing needs: Assess the need to
train qualified specialists in the field of fish production
and propose measures for training and advanced train-
ing of personnel
Materials and methods.
To analyze fisheries in the Kyrgyz Republic in
modern conditions, the following materials and meth-
ods can be used:
- statistical data, Official reports and statistics
from government agencies, scientific research and pub-
lications.
- data analysis, comparative analysis.
SWOT-анализ:
• Assess the strengths, weaknesses, opportuni-
ties and threats of fisheries in the Kyrgyz Republic.
• Field research:
• Conducting surveys and interviews with fish
farm owners and workers.
• Monitoring and assessing the condition of
fisheries facilities on site.
• Analysis of the environmental situation:
• Assess the condition of water bodies and eco-
systems in which fishing is carried out in order to iden-
tify environmental risks and problems.
Results and discussion.
Fisheries and aquaculture play an important role in
the economy and food security of the Kyrgyz Republic.
In the context of a changing climate, socio-economic
changes and growing demand for fish as a source of
protein, analyzing the current state of fisheries in Kyr-
gyzstan, as well as identifying the challenges and op-
portunities facing the industry, is an urgent task.
The fishing industry in the Kyrgyz Republic has
never played a major role due to the lack of opportuni-
ties for its development. The fish was produced only
fresh and sluggish, since the volume of fishing did not
allow the organization of round-the-clock production of
other types of products. For example, for the continu-
ous operation of small shops, such as the smoking shop
at the Grigorievsky fish processing plant, sea fish was
imported.
The history of fishing on Lake Issyk-Kul begins at
the end of the 19th century (Berg, 1930), when from
174 to 1048 quintals of fish were caught per year. Until
1930 (according to Lindberg, 1935), the fish catch did
not exceed 1000 centners per year.
However, with the creation of the Issyk-Kul fish
processing plant in 1931, fish catches in Issyk-Kul be-
gan to grow and by the 1960s reached 11-12 thousand
centners per year, of which 90% were chebachek (Leu-
ciscus bergi), a mass-produced low-value fish. [1]
According to the Law of the Kyrgyz Republic “On
Aquaculture, Fisheries and Protection of Aquatic Bio-
logical Resources” dated March 17, 2021, a state fish-](https://image.slidesharecdn.com/sciencesofeuropeno1472024-240901173407-6df3454c/75/Sciences-of-Europe-No-147-2024-74-2048.jpg)
![Sciences of Europe # 147, (2024) 75
ery register is maintained for the purpose of state ac-
counting in the field of fisheries. The procedure for
forming and maintaining the register is approved by the
Government of the Kyrgyz Republic and the authorized
state fisheries management body - the Department of
Pastures, Livestock and Fisheries of the Ministry of
Agriculture, Food Industry and Land Reclamation of
the Kyrgyz Republic.
The register contains information:
1. About fisheries entities.
2. About fishery reservoirs used for the purposes
of aquaculture, fish farming or fishing.
3. On the quantity of commercial fish caught and
grown and fish farm products.
4. About commercial fish and fish-breeding prod-
ucts imported into the territory of the Kyrgyz Republic
or exported beyond its borders.
The register is posted on the official website of the
authorized body in the field of fisheries and is an open
and accessible source of information. [2,4]
However, there are also those who are not in-
cluded in the state register. These are, for example,
those who built a fish farm in their yard and did not
register it anywhere, or rented plots in forest and pas-
ture areas and opened fish pools there. The Fishing In-
dustry Association of the Kyrgyz Republic estimates
that such illegal fish farms have an impact on the export
of products.
Fishing entities, regardless of their form of owner-
ship, are required to keep records and provide the au-
thorized body with information:
1. On the volumes of commercial fish and fish
farming products grown, caught and sold.
2. On the volume of juvenile fish released into wa-
ter bodies for the purpose of stocking water bodies with
fish. [2]
Fishery reservoirs of national importance include
natural and artificial reservoirs (lakes, reservoirs, rivers
and their sections), which:
1. Are used or can be used for fishing activities.
2. They are important for the reproduction of fish
stocks. /
Such reservoirs include lakes Issyk-Kul, Son-Kul
and Toktogul, Bazar-Korgon, Kirov, Orto-Tokoy reser-
voirs. Lake Issyk-Kul is a fishery reservoir of national
importance with the zoning of the biosphere territory
"Issyk-Kol" into separate zones (core zone, buffer zone,
transition zone, remediation zone) with a special re-
gime of protection and use. [2]
To date, more than 2,700 reservoirs suitable for
growing fish are being studied in Kyrgyzstan. Of these,
274 registered fish farms have started official opera-
tions. It is noteworthy that 73% of these farms are lo-
cated in the Chui region. According to the law, all pub-
lic water bodies are water bodies of state importance,
and the main user of fishery water bodies is the Minis-
try of Agriculture and Water Resources of the Republic
represented by the Department of Fisheries.
In the Issyk-Kul region, 11 fishery entities are reg-
istered, of which only the Tonsky Branch fish farm
(Bokonbaevo village) is state-owned and financed by
the budget. The rest have been privatized, transformed
into LLCs or private enterprises. All fishing entities are
located on the territory of the Issyk-Kul and Ton re-
gions and in the city of Karakol. There are currently no
fisheries activities (except for poaching) in the
Ortotokoy Reservoir.
In the Issyk-Kul region, reservoirs are divided into
natural and natural, which, in addition, are divided into
fishing and general reservoirs.
The Law “On Fisheries”, adopted by the Legisla-
tive Assembly of the Jogorku Kenesh of the Kyrgyz Re-
public on June 13, 1997, includes Lake Issyk-Kul and
the Ortotokoy Reservoir as fishery reservoirs in the re-
gion, while others are public water bodies. The reser-
voirs of the region are home to 35-37 species of fish.
The only commercial fish of Lake Issyk-Kul are: carp,
carp, marinka, osman, bream, trout, whitefish, pike
perch, chebak and chebak (out of 28 species registered
to date). [2]
Pond fishing in the Kyrgyz Republic is the main
and most productive area of modern aquaculture. To-
day, the area of the pond water fund is about 1020 hec-
tares, including 825 hectares intended for feeding, 195
hectares for cultivation.
This form of fishing is based on multicultural ap-
proaches, including the farming of rainbow trout, carp
and plant fish species. The main fish farming facilities
are the Issyk-Kul, Chui and Osh regions, where to-
gether more than 75 species of fish are produced in the
country.
Garden fish farming is a promising area of the
fishing industry in the Kyrgyz Republic, which has
high economic efficiency.
The best conditions for its development are Lake
Issyk Kul, reservoirs of the Naryn Cascade of the hy-
droelectric power station, as well as other water bodies.
[3]
In the nine months of 2023, 2,994 tons of fish
products were exported from the Kyrgyz Republic,
which is much more than 2,000 tons in the same period
of the previous year. In 2022, 9 companies decided to
deliver; in 2023, 5 companies unloaded 3 thousand tons
of cargo.
This confirms the development of exports, which
continue under strict compliance with veterinary and
sanitary requirements, as well as regulations on fish
products.[5]
In 2019, 33,398 fishing cards and tickets were is-
sued for a total amount of 1,057,989 soms. (Table 1) [5]](https://image.slidesharecdn.com/sciencesofeuropeno1472024-240901173407-6df3454c/75/Sciences-of-Europe-No-147-2024-75-2048.jpg)
![76 Sciences of Europe # 147, (2024)
Table 1
Information on tickets and cards issued for 9 months of 2019 in the Kyrgyz Republic
№ Name of fish
Number of issued
fish cards and tickets
(pcs)
Amount (som) note
1 For river trout 22625 884625-00
2 On the river toman 380 90060-00
3
For large fish (pike, pike perch, catfish,
carp)
100 28700-00
4
into small pieces (crucian carp, sabre-
fish).
293 54604-00
total 33398 1 057 989
[6]
The reduction in average annual fish catches in
Lake Issyk-Kul since the 70s was mainly due to a de-
crease in the number of chebak and the almost complete
loss of carp, marinka, and naked osman from the fish-
ery. Experts consider the following factors to be the
reasons for the decline in the numbers of chebak and
catches in general:
fishing for chebak and other fish during the
spawning period by-catch of immature juveniles.
• increase in the number of predators.
• disproportionate load on fishing areas.
• prohibited fishing gear.
• poaching, recreational fishing
In the Issyk-Kul region, partly in the Naryn region,
there is a reservoir of the Orto Tokoy type, with an area
of 23.20 hectares at the oil refinery, the depth of the
dam is 40 meters. Experts believe that the water is suit-
able for stocking trout and whitefish, the choice of
which depends on the characteristics of the fishery.
At one time, it produced producers of naked Otto-
mans, carp and Issyk-Kul trout. The original predators
- marinkas, Tien Shan loaches, minnows, river forms of
naked osmans - have little value in fishing, but can
serve as a food source for large fish.
The reservoir can be used as a reservoir for feeding
fish farming, and for cage rearing of juveniles and com-
mercial fish. [1.5]
For the artificial reproduction of commercial fish
on the southern shore of Lake Issyk-Kul, the Ton fish
hatchery was launched in 1964, and then the Karakol
one. They specialize in artificial breeding of trout, os-
man and whitefish, since the natural reproduction of
these species, especially salmon and whitefish, is com-
plicated by the conditions of spawning and rearing of
juveniles.
The production capacity of these factories was
quite large. From 1965 to 1985, 99.3 million units were
obtained from them. trout larvae, 142.0 million pieces.
whitefish larvae and 67.5 million pieces. naked otto-
man fry. In recent years, the productivity of factories
has decreased; in 1997, only 500 thousand trout larvae
were obtained at the Ton fish hatchery. The Karakol
plant is practically destroyed; there is no fish farming
going on there.
However, if we do not continue work on the arti-
ficial reproduction of valuable commercial fish - trout,
whitefish, peled, naked osman - then their numbers in
the lake will gradually lose their commercial im-
portance. Scientists have paid sufficient attention to the
artificial breeding of Issykul fish. There are detailed in-
structions for breeding trout, whitefish, and osman.
[1.5]
Fish farming standards for biotechnical methods
of reproduction and cultivation of different types of fish
largely depend on the temperature regime of the envi-
ronment.
To clarify the zonal division of commercial fish
farms in the Kyrgyz Republic, natural climate factors
in one or another territory of commercial fish farms are
indicated: duration of the growing season, predominant
soil types, productivity indicators of reservoirs that are
sources of water supply. [6]
The Orto-Tokoy reservoir in the Issyk-Kul region
(partly in the Naryn region) has an area of 2320 hec-
tares and a depth of 40 m at the dam. Experts believe
that it is suitable for breeding trout and whitefish. Na-
ked Osman, carp and Issyk-Kul trout have already been
released into it. The ichthyofauna is of little commer-
cial value, but can be a food source for large fish. The
reservoir is suitable for feeding fish farming and cage
farming.
Fish farming and biological standards depend on
temperature conditions. The zonal division of fish
farms in the Kyrgyz Republic is determined by natural
and climatic factors. Planting material is obtained at
Boru-Bashsky, Karakolsky and Tonsky fish breeding
enterprises. The lakes of the Issyk-Kul basin are classi-
fied as whitefish and whitefish-trout. The profitability
of fish farming is achieved by growing polycultures and
using scientific advances.
Fishing in rivers is amateur in nature. The rivers
of the Issykul region are used for raising juvenile trout
and osman, as well as for spawning trout, marinka and
osman. The lake's tributaries can support up to 4 million
juveniles. [1]
The lack of qualified specialists in the field of fish
production leads to ineffective solutions to problems
related to fish treatment, its cultivation and other as-
pects. This creates risks for the food safety of fish pro-
duced in the regions of the Kyrgyz Republic. Therefore,
it is important to pay attention to the need to train qual-
ified personnel and organize training in this area to im-
prove the efficiency and safety of fisheries.
SWOT analysis of fisheries in the Kyrgyz Re-
public
Strengths:](https://image.slidesharecdn.com/sciencesofeuropeno1472024-240901173407-6df3454c/75/Sciences-of-Europe-No-147-2024-76-2048.jpg)
![78 Sciences of Europe # 147, (2024)
6. Integration with agriculture: Development of
polyculture and integration of fisheries with agricul-
tural production can improve the efficiency and sus-
tainability of the industry.
7. Protection and restoration of ecosystems: Tak-
ing measures to protect fish migration routes, habitats
and spawning grounds will help preserve and restore
fish stocks, as well as maintain the ecosystem of water
bodies.
References
1. FISHERIES [Electronic resource] - Access
mode: https://rus.gateway.kg/analiticheskie-materi-
aly/biosfernaya-territoriya-ysyk-kyol-1998/ (access
date 07/17/2024). [Published in English]
2. LAW OF THE KYRGYZ REPUBLIC dated
March 17, 2021 No. 35 On aquaculture, fisheries and
protection of aquatic biological resources [Electronic
resource] Access mode: https://base.spin-
form.ru/show_doc.fwx?rgn=131324 [Published in
Russian]
3. Resolution of the Government of the Kyrgyz
Republic dated October 15, 2019 Action plan for the
implementation of the Fisheries and Aquaculture De-
velopment Program in the Kyrgyz Republic for 2019-
2023 /ru [Electronic resource] - Access mode
https://cbd.minjust.gov.kg › edition [Published in Rus-
sian]
4. Unified State Fisheries Register of the Kyrgyz
Republic. [Electronic resource] - Access mode:
https://agro.gov.kg/bfd_download (accessed
07/17/2024). [Published in English]
5. Protection of fish stocks [Electronic resource] -
Access mode: https://agro.gov.kg/bfd_download (ac-
cess date 07/17/2024). [Published in English]
6. Order of the Ministry of Agriculture [Electronic
resource] - Access mode: farms,
https://cbd.minjust.gov.kg/200324/edi-
tion/929270/ru/22.07.2024 [Published in Russian]](https://image.slidesharecdn.com/sciencesofeuropeno1472024-240901173407-6df3454c/75/Sciences-of-Europe-No-147-2024-78-2048.jpg)
![Sciences of Europe # 147, (2024) 79
НЕСУЧА ЗДАТНІСТЬ ПРИ КРУЧЕННІ ЗАЛІЗОБЕТОННИХ ЕЛЕМЕНТІВ З
НОРМАЛЬНИМИ ТРІЩИНАМИ
Азізов Т.Н.
докт. техн. наук, проф.
Уманскьий державний педагогічний університет імені Павла Тичини,
Умань, Україна
Кочкарьов Д.В.
докт. техн. наук, проф.
Національний університет водного господарства та природокористування, Рівне, Україна
TORSIONAL STRENGTH OF REINFORCED CONCRETE ELEMENTS WITH NORMAL CRACKS
Azizov T.
Professor, DSc
PavloTychyna Uman State Pedagogical University, Uman, Ukraine
Kochkarev D.
Professor, DSc
National University of Water and Environment Engineering, Rivne, Ukraine
DOI: 10.5281/zenodo.13382680
АНОТАЦІЯ
Наведено методику визначення міцності при крученні поперечного перерізу залізобетонного елеме-
нта за наявності нормальних тріщин. При цьому враховані напруження від чистого кручення ділянки бе-
тону без тріщин та від зсуву цієї ділянки при повороті відносно центру жорсткості перерізу. Методика
дозволяє визначати граничне значення нагельної сили в арматурі без залучення умов деформацій у цій
арматурі.
ABSTRACT
A method for determining the torsional strength of a cross-section of a reinforced concrete element in the
presence of normal cracks is presented. Stresses from pure torsion and from shear during rotation relative to the
center of rigidity are taken into account. The technique makes it possible to determine the boundary value of the
dowel force in reinforcement without involving the conditions of deformation in this reinforcement.
Ключові слова: кручення, нормальна тріщина, дотичні напруження, міцність при крученні, крути-
льна жорсткість.
Keywords: torsion, normal crack, shear stress, torsional strength, torsional rigidity.
Аналіз досліджень і постановка задачі.
Відомо, що сприйняття зусиль в просторових
залізобетонних системах суттєво залежить від їх мі-
цності і жорсткості при згині та крученні [16-18].
Відомо також, що при розгляданні питання міцно-
сті та жорсткості залізобетонних елементів при кру-
ченні практично завжди передбачається наявність
спіральних тріщин [5-8, 13-15]. Як показано в робо-
тах авторів [2, 3], нормальні тріщини також суттєво
впливають як на міцність, так і жорсткість залізобе-
тонних елементів при крученні. В цих роботах за-
пропоновані різні методики визначення жорсткості
при крученні залізобетонних елементів з нормаль-
ними тріщинами і показано, що найскладнішим за-
вданням в цьому питанні є правильне визначення
нагельної сили в поздовжній арматурі.
Існують методики, в яких переміщення арма-
тури від сили, прикладеної перпендикулярно, зале-
жить від діаметра арматури та модуля пружності
бетону [16, 17]. Але це переміщення суттєво зале-
жить і від багатьох інших факторів, таких, як захи-
сний шар бетону, наявність поперечної арматури
тощо [9]. В документі [4] приведена формула визна-
чення максимальної поперечної сили, яку спромо-
жна сприйняти арматура. При цьому вже врахована
наявність захисного шару, а також напруження в
арматурі від осьової сили. Однак і тут не врахова-
ний плив поперечної арматури, її діаметру, кроку,
відстані до нормальної тріщини, що розглядається.
Для врахування всіх факторів, що впливають,
на деформативність і міцність поздовжної арма-
тури при дії сили, прикладеної перпендикулярно її
осі, слід було б провести широкомасштабний ком-
плекс експериментальних досліджень. Але зважа-
ючи на кількість факторів, що описані вище, це б
вимагало дуже велику кількість експерименталь-
них зразків.
Експериментальні дослідження [16-18] показу-
ють, що руйнування залізобетонних елементів з но-
рмальними тріщинами при дії крутного моменту в
переважній кількості випадків відбувається не від
сколювання поздовжньої арматури, а від руйну-
вання саме стиснутої (від згину) зони бетону. Тому
рішення задачі визначення несучої спроможності
поперечного перерізу з нормальною тріщиною при
дії крутного моменту можна розглянути з точки
зору визначення максимального крутного моменту
від втрати міцності стиснутої зони бетону.
З огляду на вищесказане метою цієї статі є ро-
зроблення методики визначення несучої здатності
залізобетонного елемента з нормальною тріщиною
за дії крутного моменту.
Викладення основного матеріалу.
Розглянемо поперечний переріз залізобетон-
ного елемента з нормальною тріщиною з одиноч-
ною арматурою (суть пропонованої методики від](https://image.slidesharecdn.com/sciencesofeuropeno1472024-240901173407-6df3454c/75/Sciences-of-Europe-No-147-2024-79-2048.jpg)
![80 Sciences of Europe # 147, (2024)
наявності декількох арматурних стрижнів не змі-
нюється). Схема поперечного перерізу приведена
на рис. 1.
Рис.1. Поперечний переріз елемента з нормальною тріщиною
На рис. 1 через h, i d позначені відповідно ви-
сота стиснутої (від згину) зони і відстань від центру
ваги арматури до верхньої грані елемента. Як було
сказано в роботі [1] поворот поперечного перерізу
відбувається відносно центру кручення C, відстань
до якого Xc легко визначити, знаючи механічні ха-
рактеристики бетону та арматури. При цьому зовні-
шній крутний момент M сприймається крутним мо-
ментом Mt від чистого кручення стиснутої зони ро-
змірами bxh, а також опором зсуву стиснутої зони
при повороті відносно центру кручення C. На поча-
тку крутний момент, який сприймається за рахунок
чистого кручення визначається за відомою форму-
лою [10]
𝑀𝑡 = 𝜃(𝐺𝐽𝑐 + 𝐺𝐽𝑠) (1)
де GJc та GJs – крутильна жорсткість стиснутої
зону бетону та арматури відповідно; θ – відносний
кут закручування.
Зважаючи на те, що нелінійна робота бетону
сприяє зміненню модуля зсуву бетону, розрахунок
слід проводити ітераційно змінюючи цей показник.
При цьому положення центру жорсткості C також
буде змінюватись.
Для розрахунку розіб’ємо стиснуту зону на
елементарні прямокутники і приймемо систему ко-
ординат за методикою [10] (рис. 2).
Рис. 2. Схема розбиття стиснутої зони для визначення напружень і модулів зсуву в елементах
](https://image.slidesharecdn.com/sciencesofeuropeno1472024-240901173407-6df3454c/75/Sciences-of-Europe-No-147-2024-80-2048.jpg)
![Sciences of Europe # 147, (2024) 81
Дотичні напруження в кожному і-тому елеме-
нті визначаються як сума напружень від чистого
кручення відносно центру перерізу стиснутої зони і
напружень від зсуву при повороті стиснутої зони
відносно центру жорсткості C. Напруження від чи-
стого кручення на кожній стадії ітерації визнача-
ються за теорією кручення для прямокутного пере-
різу bxh [10]. Напруження зсуву визначаються за
формулою:
𝜏𝑠,𝑖 = 𝜃 ∙ 𝑅𝑖 ∙ 𝐺𝑖 (2)
де θ – відносний кут закручування; Ri – відс-
тань від центру жорсткості до центру ваги і-того
елемента (див. рис. 2); Gi – модуль зсуву і-того еле-
мента на розглядуваній стадії ітерації.
В пропонованій методиці розрахунку прийняті
наступні гіпотези, які ґрунтуються на підході плас-
тичного кручення [12]: Приймається діаграма зсуву
бетону у вигляді діаграми Прандтля; Модуль зсуву
кожного і-того елемента визначається з діаграми
зсуву за формулою
𝐺𝑖 = 𝐺𝑐 ∙ [𝜏]/𝜏𝑚 (3)
де [τ] – граничне значення дотичних напру-
жень для бетону; Gc – початковий модуль зсуву бе-
тону; τm – головні напруження, які визначаються за
формулою [12]:
𝜏𝑚 = √𝜏𝑔𝑜𝑟
2 + 𝜏𝑣𝑒𝑟𝑡
2
(4)
τgor, τvert – відповідно дотичні напруження від-
повідно в горизонтальному (на рис. 2) та вертика-
льному напрямку. Причому τvert визначаються за
формулами теорії кручення від дії крутного моме-
нту Mt, а τgor – це сума дотичних напружень від чи-
стого кручення моментом Mt і напружень від зсуву
τs,i, які визначаються за формулою 2.
Слід зазначити, що величина модуля зсуву Gc
в формулі (3) приймається як початковий модуль
зсуву тільки на першій ітерації. На кожній наступ-
ній ітерації приймається модуль зсуву, отриманий
на попередній ітерації.
Наведемо алгоритм розрахунку.
1.Визначаємо початкове положення центру
жорсткості C за відомою формулою опору матеріа-
лів [19].
2. Задаємось величиною відносного кута за-
кручування θ.
3. В залежності від положення центра жорст-
кості C визначаємо всі відстані Ri від центрів ваги
елементів до центру жорсткості (див. рис. 2), а та-
кож відстані в горизонтальному напрямку yi.
4. Визначаємо крутний момент, що сприйма-
ється бетонною частиною елемента Mt:
𝑀𝑡 = 𝜃 ∙ 𝐽𝑐𝐺𝑐, (5)
де Jc – момент інерції стиснутої зони при кру-
ченні; Gc – модуль зсуву бетону.
5. Визначаємо в кожному елементі горизонта-
льні τgor,i і вертикальні τvert,i напруження від моменту
Mt за формулами теорії кручення [10] в залежності
від відстані від центру ваги кожного елемента до
центру системи координат (див. рис. 2).
6. Визначаємо в кожному елементі горизонта-
льні напруження зсуву τs,i від повороту перерізу за
формулою (2).
7. Визначаємо сумарні горизонтальні напру-
ження τtot,i = τgor,i + τs,i
8. Визначаємо головні напруження τm,i:
𝜏𝑚,𝑖 = √𝜏𝑡𝑜𝑡,𝑖
2
+ 𝜏𝑣𝑒𝑟𝑡,𝑖
2
(6)
9. Якщо τm,i ≤[τ], то величина модуля зсуву і-
того елемента Gi залишається на попередньому рі-
вні. Якщо τm,i >[τ], то визначається нова величина
модуля зсувуGi,k:
𝐺𝑖,𝑘 = 𝐺𝑖,𝑘−1 ∙ [𝜏]/𝜏𝑚,𝑖, (7)
де Gi,k-1 – модуль зсуву і-того елемента на по-
передній k-1-й ітерації.
10. Визначаємо середній модуль зсуву на і-й
ітерації за формулою:
𝐺𝑚𝑖𝑑 =
∑ 𝐺𝑖
𝑛
𝑖=1
𝑛
, (8)
де n – загальна кількість прямокутних елемен-
тів, на яку розділено стиснуту зону.
11. Визначаємо нове значення моменту Mt,iter,
що сприймає стиснута зона:
𝑀𝑡,𝑖𝑡𝑒𝑟 = 𝜃 ∙ 𝐽𝑐𝐺𝑚𝑖𝑑 (9)
12. Повторюємо розрахунок з пункту 5 цього
алгоритму.
Якщо різниця між моментом Mt,iter на останній
і попередній ітерації не більше, ніж наперед задана
похибка, то переходимо до наступного кроку, якщо
ні – повторюємо ітерації.
Таким чином, ми отримаємо розподіл напру-
жень і модулів зсуву по поперечному перерізу сти-
снутої зони.
13. Визначаємо нове положення центра жорст-
кості Xc зі зміненими модулями зсуву Gi за форму-
лою:
∑ 𝐴𝑖𝐺𝑖𝑥𝑖
𝑛
𝑖=1
∑ 𝐴𝑖𝐺𝑖
𝑛
𝑖=1 +𝐴𝑠∙𝛼∙𝐺𝑐
, (10)
де Ai – площа і-того елементарного прямокут-
ника, xi – відстань від центра ваги і-того елемента
до центра ваги арматури, α – відношення модулів
зсуву арматури і бетону; Gc – початковий модуль
зсуву бетону.
14. Повторюємо з пункту 3 цього алгоритму.
Якщо різниця положення центру жорсткості Xc на
останній і попередній ітерації менше за попередньо
задану похибку, то процес закінчується. Якщо ні –
процес ітерацій продовжується.
Таким чином подвійним ітераційним процесом
ми спочатку уточнюємо момент Mt, що сприйма-
ється стиснутою зоною бетону, а потім положення
центру жорсткості Xc. При цьому всі модулі зсуву
Gi будуть мати такі значення, що головні напру-
ження τm,i, визначені за п. 8 алгоритму (формула 6),
не будуть перевищувати величину граничних доти-
чних напружень [τ].
В цьому полягає подібність з розрахунку на чи-
сте пластичне кручення [12] з приведеним вище ро-
зрахунком при крученні зі зсувом відносно центру
жорсткості.
Після закінчення ітераційного процесу крут-
ний момент визначається за формулою:
[𝑀] = 𝑀𝑣𝑒𝑟𝑡 + 𝑀𝑔𝑜𝑟 + 𝑀𝑠 (11)
де Mvert, Mgor, Ms – відповідно крутні моменти
від вертикальних дотичних напружень τvert, горизо-
нтальних дотичних напружень τgor і від нагельної](https://image.slidesharecdn.com/sciencesofeuropeno1472024-240901173407-6df3454c/75/Sciences-of-Europe-No-147-2024-81-2048.jpg)
![82 Sciences of Europe # 147, (2024)
сили в поздовжній арматурі Ns, які визначаються за
формулами:
𝑀𝑣𝑒𝑟𝑡 = ∑ 𝜏𝑣𝑒𝑟𝑡,𝑖𝐴𝑖𝑦𝑖
𝑛
𝑖=1 ; 𝑀𝑔𝑜𝑟 = ∑ 𝜏𝑡𝑜𝑡,𝑖𝐴𝑖𝑅𝑖
𝑛
𝑖=1 ;
𝑀𝑠 = 𝑁𝑠𝑋𝑐 (12)
В формулі (12) через yi позначена відстані від
центру ваги і-того елемента до середини стиснутої
зони по горизонталі (див. рис. 2); Ns – нагельна сила
в поздовжній арматурі, яка прикладена перпенди-
кулярно її осі і яка з умов рівноваги на вісь y на рис.
2 дорівнює сумарним горизонтальним силам:
𝑁𝑠 = ∑ 𝜏𝑡𝑜𝑡,𝑖𝐴𝑖
𝑛
𝑖=1 (13)
Алгоритм, наведений вище, легко реалізову-
ється в будь-який програмі. Автори склали про-
граму в Excel з застосуванням Visual Basic.
Поступовим збільшенням величини віднос-
ного кута θ отримуємо діаграму M-θ, з якої легко
визначати внутрішній момент за будь якого зна-
чення θ, включаючи його значення, яке відповідає
граничному моменту [M].
Перевагою запропонованого методу є факт, що
нагельну силу в арматурі Ns можна визначити (в
граничній стадії) без врахування перерахованих
вище факторів, які впливають на деформації арма-
тури поперек її осі. Знаючи величину нагельної
сили и граничний крутний момент можна за мето-
дикою авторів [3, 11] визначити крутильну жорст-
кість залізобетонного елемента з нормальною трі-
щиною також в граничній стадії. Далі застосову-
ючи гіпотезу лінійності жорсткості можна
отримати графік зміни крутильної жорсткості от
початкової (без тріщин) і до граничної.
Відомо, що граничний момент в припущенні
повністю пластичної роботи стиснутої зони визна-
чається за формулою (див. рис. 1):
𝑀𝑝𝑙 = 𝑏 ∙ ℎ ∙ [𝜏] ∙ (𝑑 −
ℎ
2
) (14)
Розрахунки показують, що величина гранич-
ного крутного моменту, отриманого за розробле-
ною вище методикою (формула 11), відрізняється
від граничного моменту в припущенні пластичного
стану всієї стиснутої зони бетону (формула 14). Ця
різниця залежить від відношення b/h стиснутої
зони, відстані до центру жорсткості. Момент за фо-
рмулою 11 менший за момент за формулою 14. І це
є цілком логічним, тому що розгляд пластичної ро-
боти бетону за наведеним алгоритмом показує, що
не у всіх елементах з’являються граничні напру-
ження [τ]. Такий результат можна порівняти з пла-
стичним чистим крученням [12], де розглядається
так звана аналогія з купою піску і не в усіх точках
поперечного перерізу дотичні напруження досяга-
ють граничних значень, в результаті чого гранич-
ний момент менший, ніж в припущенні повної пла-
стичності в перерізі. Розрахунки за наведеною
вище методикою показали, що в середньому грани-
чний момент за формулою 11 менший за граничний
момент за формулою 14 приблизно на 30%. Тому в
інженерних розрахунках можна визначити гранич-
ний момент за формулою 14 і розділити його на ко-
ефіцієнт 1.3. Це дозволить отримати орієнтовне
значення несучої спроможності поперечного пере-
різу без застосування програми з ітераційним роз-
рахунком. Для точного розрахунку слід виконувати
розрахунок за наведеним в статті алгоритмом.
В розрахунках за наведеним алгоритмом реко-
мендується слідкувати за тим, щоб величина Ns, ви-
значена за формулою (13), не перевищувала вели-
чини Fud – несучої здатності поздовжньої арматури,
до якої прикладена сила, перпендикулярна її осі за
методикою Eurocode [4]. При цьому завжди можна
підібрати такий кут θ, який відповідає значенню Ns,
що дорівнює Fud.
Висновки і перспективи досліджень.
Рішення задачі визначення несучої спромож-
ності поперечного перерізу з нормальною тріщи-
ною при дії крутного моменту можна розглянути з
точки зору визначення максимального крутного
моменту від втрати міцності стиснутої зони бетону.
В статті наведена методика визначення граничного
стану поперечного перерізу залізобетонного елеме-
нта з одиночною арматурою з врахуванням напру-
жень від чистого кручення і напружень зсуву від
повороту перерізу відносно центру жорсткості сти-
снутої від згину зони. Ітераційний розрахунок по-
казує, що не в усіх точках стиснутої зони з’явля-
ються граничні дотичні напруження. Це узгоджу-
ється при порівнянні пластичного стану при
чистому крученні за аналогією з купою піску. Ме-
тодика дозволяє визначати граничне значення наге-
льної сили в арматурі без залучення умов деформа-
цій в цій арматурі.
В перспективі планується експериментальна
перевірка розробленої методики розрахунку.
Література
1. Azizov T. Accounting The Shift Of The Com-
pressed Area Of Concrete In Two Directions In The
Torsion Of A Reinforced Concrete Element With Nor-
mal Cracks // Sciences of Europe. – Vol 1, № 73(2021).
– P. 42-46.
2. Azizov T.N. Determination of Displacement of
a Reinforced Concrete Element in a Normal Crack //
Sciences of Europe. – Vol 1, № 62(2021). – P. 34-38.
3. Azizov, T., Jurkowska, N., Kochkarev, D. Basis
of calculation on torsion for reinforced concrete
structures with normal cracks (2019) Proceedings of
the fib Symposium 2019: Concrete - Innovations in
Materials, Design and Structures, pp. 1718-1725.
4. CEB-FIP Model Code. Lausanne, 1993. – 120
p.
5. Collins M.P., Rahal N.R. Experimental Evalua-
tion of ACI and AASHNO-LRFD Design Provisions
for Combined Shear and Torsion. ACI Structural Jour-
nal, Vol. 100, №3, 2003. – pp.277-282.
6. Cowan H.J. and Armstrong S. Experiments on
the Strength of Reinforced and Prestressed Concrete
Beams and of Concrete-Encased Steel Joints in Com-
bined Bending and Torsion/ Magazine of Concrete Re-
search, Vol.6, No.19//U.K.: London, 1955. - pp. 3-20
7. Cowan H.J. Torsion of a rectangular elastic iso-
tropic beam reinforced with rectangular helices of an-
other material// Applied Scientific Research, Section A
Volume 3, Issue 5, September 1952. – pp. 344-348.
8. Mohammed Sirage Ibrahim, Esayas Ge-
breyouhannes, Abdulkerim Muhdin, Abrham Gebre.
Effect of concrete cover on the pure torsional behavior](https://image.slidesharecdn.com/sciencesofeuropeno1472024-240901173407-6df3454c/75/Sciences-of-Europe-No-147-2024-82-2048.jpg)

![84 Sciences of Europe # 147, (2024)
INFLUENCE OF LASER RADIATION ON METAL MELTING AND FORMATION OF SEAMS IN
ARC WELDING (REVIEW)
Bozhok O.
E.O. Paton Electric Welding Institute, National Academy of Sciences of Ukraine, Kyiv, Ukraine
Xinxin Wang
Corresponding author
Guangdong Provincial Key Laboratory of Advanced Welding Technology, China-Ukraine Institute of Weld-
ing, Guangdong Academy of Sciences,
Guangzhou, China
Korzhyk V.,
Khaskin V.,
Guangdong Provincial Key Laboratory of Advanced Welding Technology, China-Ukraine Institute of Weld-
ing, Guangdong Academy of Sciences,
Guangzhou, China
E.O. Paton Electric Welding Institute, National Academy of Sciences of Ukraine, Kyiv, Ukraine
Bushma O.,
Aloshin O.,
Aloshin A.,
E.O. Paton Electric Welding Institute, National Academy of Sciences of Ukraine, Kyiv, Ukraine
Dolianovskaia O.
National Technical University of Ukraine «Igor Sikorsky Kyiv Polytechnic Institute», Kyiv, Ukraine
DOI: 10.5281/zenodo.13382687
ABSTRACT
Research articles devoted to the development of laser-plasma processes in the last two decades are considered.
It has been established that modern directions of scientific research of laser-plasma welding processes are mainly
aimed at studying the features of the joint action on steel and alloys of compressed arc plasma and laser radiation
with a wavelength of 1.03-1.07 microns (primarily fiber laser), and as well as studying the physical foundations
of the manifestation of the synergistic (hybrid) effect in such an action and determining the possibilities of its
practical application. In particular, it was determined that the increase in the effectiveness of the manifestation of
the synergistic effect is associated with the improvement of the burning conditions of the plasma arc in the zone
of the ionized vapor torch, which is formed under the action of focused laser radiation, as well as the simplification
of the formation of the laser keyhole due to the pressure of the plasma arc.
Keywords: arc welding, laser-plasma welding, synergistic effect, process efficiency, steels, aluminum alloys.
The joining of steel sheets and aluminum alloys is
becoming more and more important in modern produc-
tion. Traditional arc welding methods create a ther-
mally affected zone (HAZ) of considerable size, which
is characterized by reduced mechanical characteristics
and, first of all, strength [1]. The issue of HAZ minimi-
zation is especially important for welding aluminum al-
loys [2]. One of the ways to eliminate this shortcoming
is the use of highly concentrated sources of energy,
such as laser radiation. The combination of laser radia-
tion with arc welding sources allows not only to reduce
the size of the HAZ, but also to increase the technolog-
ical parameters of welding [3].
At the beginning of the 21st century Acad. I.V.
Krivtsun claimed [4-6] that the main factors determin-
ing the nature of metal penetration during combined la-
ser-arc welding are the thermal and dynamic effects of
the used heat sources on the surface of the welding bath.
Therefore, he developed a system of equations to de-
scribe the process of metal vaporization under the ac-
tion of a multicomponent plasma formed above the
welding bath during laser-plasma welding [7]. Such a
system forms the basis for calculating the characteris-
tics of thermal and dynamic effects of arc, laser or com-
bined plasma on the surface of the welding bath for the
appropriate methods of welding in shielding gases. In
the next step, he investigated the peculiarities of metal
penetration during laser-arc welding using the
Nd:YAG-laser [8]. The developed mathematical model
of thermal processes during laser-arc welding using an
Nd:YAG-laser and an argon arc made it possible to cal-
culate the penetration profiles under the combined ef-
fect of a laser beam and an electric arc on the product,
taking into account their interaction on the metal sur-
face. The calculations showed the presence of a syner-
gistic (hybrid) effect, which is contained in a non-addi-
tive increase in the volume of metal remelted by the la-
ser-plasma method, compared to the volumes of metal
remelted separately by laser and plasma methods.
In order to analyse the effect of synergistic cou-
pling that occurs during the process, laser-plasma weld-
ing can be divided into three zones [9]: (I) plasma
above the surface, (II) the surface of the weld pool, and
(III) the occurrence of interaction directly below the
surface. Factors such as the common welding source,
the mutual location of the laser and plasma sources, as
well as the role and influence of the welding parame-
ters, exert the main influence on the degree of manifes-
tation of the synergistic effect.
In work [10], it was shown that the characteristics
of the arc practically do not change in the cases of in-
teraction "gas CO2-laser – helium TIG arc" and "disc
Yb:YAG-laser – argon TIG arc". The reason is that the
inverse bremsstrahlung absorption coefficients are very
different due to the different electron densities of argon
and helium arcs and the different wavelengths of CO2](https://image.slidesharecdn.com/sciencesofeuropeno1472024-240901173407-6df3454c/75/Sciences-of-Europe-No-147-2024-84-2048.jpg)
![Sciences of Europe # 147, (2024) 85
and Yb:YAG-lasers. Such a study in a certain way con-
tributes to the partial application of the experience of
using a CO2-laser in hybrid processes with radiation
from solid-state lasers.
The work [11] presents the results of the study of
the synergistic effect of hybrid laser-arc welding. The
experiments were performed with a Nd:YAG-laser
with a power of PL=500 W in combination with stand-
ard equipment for TIG welding. Two aspects were in-
vestigated: heat transfer efficiency and melting effi-
ciency. The efficiency of heat transfer was determined
by calorimetric measurements, and the efficiency of
melting was determined by the cross-sections of welds
obtained at different welding modes. The results show
that the interaction of the laser and the arc does not lead
to a noticeable change in the heat transfer efficiency,
but leads to a significant increase in the melting effi-
ciency. The non-additive increase in the cross-sectional
area of the seams obtained by the addition of two heat
sources (laser and arc) indicates the presence of a syn-
ergistic effect and the hybrid nature of welding.
Spectral analysis of the hybrid plasma torch and
high-speed photographic analysis of the process come
to the rescue when investigating the manifestation of
the synergistic effect in hybrid welding [12]. The fol-
lowing is established. Firstly, the principle of the syn-
ergy effect is that when interacting with a compressed
arc of a non-melting electrode, the laser transfers the
electron energy to a higher level and creates the condi-
tions for a quantum transition. Thanks to this, more
photons are emitted, which increase the flow of heat to
the welded material. The synergistic effect is quantified
by the spectral intensity. It increases with increasing la-
ser power and decreases with arc current. This effect is
proportional to the cross-section of the weld, especially
its upper part. Secondly, the number of spatters in hy-
brid laser-arc welding is much smaller than in arc weld-
ing.
In work [13], a number of studies of laser-plasma
welding according to the scheme of Fig.1 were carried
out. It is proposed to determine the welding efficiency
ηW as the ratio of the theoretical value of the PFZ power
required to melt the material of the melting zone (FZ
index) to the total supplied welding power PW accord-
ing to
(1)
where ρ is the mass density of the material to be
welded, wch is the speed of movement, AFZ is the cross-
sectional area of the melting zone, and ΔηFZ is the re-
quired increase in the specific enthalpy for melting. Ra-
tio (1) can be considered as a basis for determining rel-
ative welding efficiency, which compares the effi-
ciency of the combined laser-plasma process with the
efficiency of individual processes. In this case, we get:
Fig. 1. Experimental setup with a separate location of the plasmatron and laser beam [13]: 1 – plasma burner
located at an angle α=35° (backward angle); 2 – plasma nozzle (distance to the sample L=2 mm); 3 – laser
beam directed at an angle β=20° (forward angle); 4 – cross-jet (air knife); 5 – high-speed camera; 6 – protec-
tive glass; 7 – sample; 8 – the direction of movement of the desktop (sample).
(2)
In this regard, AFZ,PL denotes the cross-sectional
area of the seam of the combined laser-plasma process,
and AFZ,P and AFZ,L are the cross-sectional area of the
seams made separately by plasma and laser welding.
Calculated values of measured weld cross-sectional ar-
eas and corresponding relative efficiencies are shown
in Table 1 for ASTM A284 medium carbon steel, AISI
304 stainless steel, and 6082 aluminum alloy.](https://image.slidesharecdn.com/sciencesofeuropeno1472024-240901173407-6df3454c/75/Sciences-of-Europe-No-147-2024-85-2048.jpg)
![86 Sciences of Europe # 147, (2024)
Table 1.
Cross-sectional areas of the AFZ welding seam and the resulting relative efficiency ηW of plasma, laser and laser-
plasma welding of plates (PL=600 W, IP=100 A) [13].
No Material Thickness
δ, mm
Welding
speed V,
m/min
AFZ,P / mm2
AFZ,L / mm2
AFZ,PL /
mm2
ηW / -
(1) ASTM A284 10,0 0,5 0,4 1,5 3,3 1,74
(2) AISI 304 1,5 1,5 0,1 0,7 1,9 2,38
(3) 6082 2,5 1,5 2,2 1,8 6,0 1,50
One of the reasons for increasing the efficiency of
laser-plasma welding compared to individual processes
can be a change in the arc voltage when laser radiation
is introduced into the plasma-arc process. In particular,
characteristic differences in arc voltage during welding
of steels and aluminum alloys were revealed. In the
case of aluminum welding, there is a noticeable drop in
the arc voltage in the range of -2 to -3 V when the laser
beam is turned on, while when welding steel under the
same conditions of a highly focused laser beam, a mod-
erate increase in the arc voltage between 0.15 and 0.6
V was found.
If the synergistic effect of hybrid laser-arc pro-
cessing is explained as an increase in energy transfer
from heat sources to the material, the thermal efficiency
or overall efficiency of the process ηT corresponds to
the ratio of the PU power required to melt the welded
material per unit time (without losses) to the total ap-
plied power PA [ 14]. This value can be divided accord-
ing to equation (3) into the melting efficiency ηM (use
of energy inside the base material) and the efficiency of
energy coupling ηC (energy input from heat sources) us-
ing the power PT, which is transferred from the heat
sources to the workpiece [14]:
(3)
Taking into account the heat flow entering the
welded workpiece and the energy coupling efficiency
ηC depending on it, the estimated weld cross-sections in
combination with equation (4) [14] are used to deter-
mine the thermal efficiency ηT:
(4)
where vx — welding speed, AS — weld area, probe
density, cρ — specific heat capacity, ϑS і ϑ∞ — melting
point and ambient temperature, hs — enthalpy of fu-
sion, PL — laser power, UArc and IArc — arc voltage and
current respectively. Then the melting efficiency ηM is
the result of applying equation (3).
The method and model of efficiency determina-
tion were applied in the work [15]. While a laser beam
with a power of PL=200 W and a focus point diameter
of 200 μm barely melts the material, the plasma weld-
ing process with an arc power of about 2 kW achieves
the penetration of the weld by approximately 2/3 of the
thickness of the workpiece for the applied set of param-
eters (Fig.2). The combination of both processes gives
welding with complete penetration. While the ηC en-
ergy coupling efficiency is only modestly increased by
about 10% compared to the arithmetic ηC energy cou-
pling efficiency of the individual processes, the ηM
melting efficiency of the combined process is about 1.5
times higher than the ηM melting efficiency of the
plasma-arc process. It can be hypothesized that the heat
flow within the weld pool, driven by conductive and/or
convective transfer mechanisms, is advantageously al-
tered to create a resulting weld cross-section with in-
creased penetration due to more favorable thermal
and/or hydrodynamic boundary conditions. The authors
of the work [15] propose to consider this as a clear
proof of the hypothesis that secondary, i.e. thermal, ef-
fects are responsible for the synergistic benefits of the
productivity of laser-arc processing.
Fig. 2. Cross-sections of welding of AISI304 steel (δ=1 mm) with a laser beam (PL = 200 W; ω0 = 200 μm),
plasma welding (QP = 1.8 l/min; dW = 5 mm) and laser-plasma welding (LaPAW) (PL = 200 W; ω0 = 200 μm;
QP = 1.8 l/min; dW = 5 mm) with corresponding efficiency values [15].](https://image.slidesharecdn.com/sciencesofeuropeno1472024-240901173407-6df3454c/75/Sciences-of-Europe-No-147-2024-86-2048.jpg)
![Sciences of Europe # 147, (2024) 87
The work [16] confirmed the presence of a syner-
gistic effect in laser-plasma welding using a fiber laser
by comparing the cross-sectional areas of welds made
in an AISI 304 plate (δ=4 mm) by laser, plasma, and
hybrid methods at close values of the power of laser ra-
diation and plasma arcs (~2 kW each). It was deter-
mined that the manifestation of this effect depends on
the welding speed. At a speed of 2 m/min, the cross-
sectional area of hybrid welding exceeds the sum of the
planes obtained by laser and plasma methods by 30%,
and at a speed of 4 m/min – ~20%.
In work [17], the dimensionless parameter of the
increase in melting energy ψ (𝜓 =
𝑆𝐻−(𝑆𝐿+𝑆𝐴)
𝑆𝐿+𝑆𝐴
∗ 100%,
was used to quantify the synergistic effect in laser-arc
hybrid welding, where SH, SL, SA – cross-sectional area
of hybrid, laser and arc welding seams, respectively).
The greater the value of ψ, the stronger the synergistic
effect. ψ was calculated and compared at different pa-
rameters of laser-TIG and laser-MIG hybrid welding.
The first had a stronger synergistic effect (ψ=59.3-
83.6%) than the second (ψ=1-23%). It can be expected
that in the case of using arc plasma (i.e. compressed
electric arc) in the hybrid process, the synergistic effect
will be even greater than in laser-TIG welding [18].
This effect can be estimated for laser-plasma welding
using the Nd:YAG laser by grinding the cross-sections
shown in Fig.3 and 4, respectively, of the specified
mode parameters.
а b c d
Fig. 3. Formation of a weld in S235JR steel sheets with a thickness of 3 mm caused by a change in the power of
laser radiation (a) 0 W; (b) 220 W; (c) 330 W; (d) 440 W (constant parameters: I = 150 A; V = 1000 mm/min;
QP = 0.8 l/min, L = 8 mm, β = 3°) [18].
а b c d
Fig. 4. Formation of a weld on S235JR steel sheets with a thickness of 4 mm due to a change in the power of
laser radiation (a) 0 W; (b) 440 W; (c) 0 W; (d) 440 W and welding speed: a), b) 200 mm/min, c), d) 250
mm/min (unchanged parameters: I = 150 A; QP = 0.4 l/min, L = 8 mm , β = 19°) [18].
To implement the processes of laser-plasma weld-
ing, the focused laser beam can be directed to the point
of interaction with the material at a certain angle, i.e.
according to the paraxial scheme (Fig.1) (for example,
[19]) or perpendicular to the surface of the product be-
ing welded, i.e. according to the coaxial scheme (for
example, [6, 20]). Structurally, the laser-plasma weld-
ing head can consist of separate elements – a laser fo-
cusing system and a plasmatron, or be integrated into a
general body. The plasma torch is usually tilted at a cer-
tain (minimum possible) angle to the axis of the focused
laser beam [21]. The bonding wire can be fed towards
the plasma jet or not fed at all. Also, powders of metals
and alloys can be used as filler materials [22, 23]. In the
case of using powder filler materials, important techno-
logical parameters of welding are the distance between
the processed workpiece and the laser-plasma head, as
well as the arc current [23]. The influence of the arc
current mainly ensures the formation of the upper
roller, while the power of the laser radiation ensures the
formation of the penetration depth (Fig.5).](https://image.slidesharecdn.com/sciencesofeuropeno1472024-240901173407-6df3454c/75/Sciences-of-Europe-No-147-2024-87-2048.jpg)
![88 Sciences of Europe # 147, (2024)
Fig. 5. The ratio between the cross-sectional area of the weld metal obtained by the plasma powder process and
the area obtained by the laser process, depending on the plasma arc current for two different welding speeds
[23].
The analysis of literary data allows us to formulate
the following main advantages of the hybrid laser-
plasma process in comparison with plasma-arc and la-
ser:
- the joint use of laser and plasma energy allows to
reduce the laser power and reduce the cost of the equip-
ment (estimated up to 40-50%);
- the laser component of laser-plasma welding al-
lows to reduce the size of the HAZ;
- the plasma component of laser-plasma welding
allows to reduce requirements for preparation and as-
sembly of welded edges;
- increase in productivity due to increase in weld-
ing speed;
- reduction of energy consumption due to im-
provement of process efficiency;
- expansion of the deposited roller during laser-
plasma deposition and increase of penetration depth
during welding due to changes in hydrodynamic cur-
rents in the welding bath.
Conclusions.
1. The study of literary sources showed that mod-
ern directions of scientific research of laser-plasma
welding processes are mainly aimed at studying the fea-
tures of the joint action on steels and alloys of com-
pressed arc plasma and laser radiation with a wave-
length of 1.03-1.07 microns (primarily - fiber laser ), as
well as on the study of the physical foundations of the
manifestation of the synergistic (hybrid) effect in such
an action and the determination of the possibilities of
its practical application.
2. It was determined that the promotion of the
manifestation of the synergistic effect is connected with
the improvement of the burning conditions of the
plasma arc in the zone of the ionized vapor torch
formed under the action of focused laser radiation, as
well as the simplification of the formation of the laser
keyhole due to the pressure of the plasma arc.
3. The effectiveness of the manifestation of the
synergistic effect during laser-plasma welding of steels
and alloys is proposed to be determined as the ratio of
the theoretical amount of power required to melt the
weld material to the total supplied welding power, or as
the ratio of the cross-sectional area of the laser-plasma
weld to the sum of the cross-sectional areas seams made
separately by plasma and laser welding. It was estab-
lished that the efficiency of laser-plasma welding can
vary from 1.5 (for aluminum alloy 6082) to 2.4 (for
AISI304 steel).
Acknowledgments
The work was funded within the following pro-
grams:
1. The National Key Research and Development
Program of China (Project Number:
2023YFE0201500).
2. Strategic project of the Academy of Sciences of
Guangdong Province, (GDAS’Project of Science and
Technology Development, 2020GDASYL-
20200301001).
References
1. Hansen R.S., Vivek A., Daehn G.S. (2015). Im-
pact welding of aluminum alloys 6061 and 5052 by va-
porizing foil actuators: HAZ size and peel strength.
Journal of Manufacturing Science and Engineering,
137(5). DOI: https://doi.org/10.1115/1.4030934](https://image.slidesharecdn.com/sciencesofeuropeno1472024-240901173407-6df3454c/75/Sciences-of-Europe-No-147-2024-88-2048.jpg)
![Sciences of Europe # 147, (2024) 91
industrial implementation of alternative non-thermal processing methods for meat products, as there is a lack of
fundamental research and evidence of the safety of processed products, no approved standards for processing and
sterilization have been developed, and there is limited research on environmental pollution during processing.
Ключевые слова: мясо, инактивация, термическая обработка, нетермическая технология, стерилиза-
ция высоким давлением, технология сверхкритического диоксида углерода, электролитическая вода, уль-
тразвук, импульсное электрическое поле.
Keywords: meat, inactivation, heat treatment, non-thermal technology, high pressure sterilization, supercriti-
cal carbon dioxide technology, electrolytic water, ultrasound, pulsed electric field.
Введение
Обеспечение безопасности пищевых продук-
товявляется основной задачей пищевой промыш-
ленности. Мясо ежегодно потребляется во все
мире, как основной источник белка, который очень
питателен для человеческого организма. Измене-
ние потребительских предпочтений стимулирует
спрос на минимально обработанные, готовые к упо-
треблению мясные продукты, которые являются
свежими и питательными, сохраняя при этом свои
естественные цвета, текстуру и вкус. Однако при-
сущие им характеристики, такие как уровень pH,
активность воды и определенные питательные ве-
щества, делают мясные продукты уязвимыми для
заражения различными микроорганизмами [1,2].
Если не принять эффективных мер по инактивации
микроорганизмов во время переработки мяса, это
может привести к различным пищевым заболева-
ниям и представлять прямую опасность для здоро-
вья человека. Например, присутствие Clostridium
perfringens в мясных продуктах вырабатывает бе-
лок- нейротоксин (ботулотоксин), который может
вызывать пищевые заболевания, приводящие к за-
труднению дыхания и параличу мышц. Кроме того,
в мясных продуктах были обнаружены различные
пищевые патогены, включая Escherichia coli,
Listeria monocytogenes, Staphylococcus aureus и
Salmonella Enteritidis. Присутствие этих патоген-
ных бактерий и бактерий порчи может способство-
вать распространению пищевых заболеваний, со-
здавая значительные риски для здоровья потреби-
телей [2,3]. Пищевая промышленность использует
различные технологии для предотвращения или
инактивации микроорганизмов, вызывающих
порчу. В настоящее время основным методом сте-
рилизации мяса и мясных продуктов в пищевой
промышленности являются традиционные терми-
ческие методы, такие как высокотемпературная об-
работка. Несмотря на то, что этот метод эффек-
тивно убивает вредные микроорганизмы и обеспе-
чивает безопасность пищевых продуктов,
использование высокой температуры может вы-
звать многочисленные негативные реакции, кото-
рые могут привести к снижению качества пищевых
продуктов, включая потерю пищевой ценности и
сенсорных свойств мяса Аналогичным образом,
хотя традиционные методы охлаждения и замо-
розки могут подавлять рост микробов и обеспечи-
вать существенные преимущества при стерилиза-
ции и консервации, они часто ставят под угрозу
сенсорные и питательные качества мяса и мясных
продуктов, не отвечая требованиям потребителей в
отношении высококачественных вариантов. В ре-
зультате их использование остается ограниченным.
Для решения проблем традиционных методов сте-
рилизации в пищевой промышленности приобрела
популярность новая технология нетермической
стерилизации, которая соответствует современным
тенденциям в области питания, здоровья, безопас-
ности и охраны окружающей среды [4,5]. Цель ис-
следования - обзор современных технологий нетер-
мической обработки и их потенциального исполь-
зования в качестве альтернативы традиционным
методам обработки мяса и мясных продуктов. Ос-
новное внимание уделено потенциальному приме-
нению технологий нетермической обработки в ка-
честве альтернативы традиционным методам в пе-
реработке мяса и мясных продуктов. Представлены
механизмы, преимущества и ограничения этих не-
термических технологий в последние годы обоб-
щены в отношении их применения в мясных про-
дуктах. Кроме того, приведены примеры лабора-
торных исследований, демонстрирующих
промышленную применимость этих технологий в
отношении мяса и мясных продуктов.
МЕТОДОЛОГИЯ ИССЛЕДОВАНИЯ
Поиск научной литературы на английском
языке по теме исследования проводили в библио-
графических базах «Scopus», «Web of Science» и
«PubMed». Для отбора научных статей на русском
языке провели поиск, по ключевым словам, в
«Google Scholar» и «Научной электронной библио-
теке eLIBRARY.RU». В качестве временных рамок
для обзора научных публикаций принят период
2015–2024 гг. При выполнении работы использо-
ваны научные методы поиск и скрининг научной
литературы, извлечение данных, их анализ, систе-
матизации и обобщения. При отборе публикаций
для обзора приоритет отдавали высоко цитируе-
мым источникам
РЕЗУЛЬТАТЫ И ОБСУЖДЕНИЯ
1. Современные нетермические техноло-
гии, принцип действия
Недавнее появление технологии нетермиче-
ской обработки пищевых продуктов открывает зна-
чительный потенциал для инактивации микроорга-
низмов и их токсинов в пищевых продуктах без
необходимости нагревания. Исследование новых
технологий обработки пищевых продуктов не
только открывает возможности для производства
более качественных продуктов питания, но и спо-
собствует снижению затрат и сокращению времени
обработки [2,5,6,7]. Хотя современные нетермиче-
ские технологии имеют ряд преимуществ по срав-
нению с традиционными методами, у них есть
определенные ограничения [2,5,6].
Технология обработки высоким давлением](https://image.slidesharecdn.com/sciencesofeuropeno1472024-240901173407-6df3454c/75/Sciences-of-Europe-No-147-2024-91-2048.jpg)
![92 Sciences of Europe # 147, (2024)
Технология обработки высоким давлением
(HPP), также известная как технология обработки
высоким статическим давлением, обычно включает
использование воды или другой жидкости в каче-
стве стерильной среды передачи давления. Пище-
вые продукты, запечатанные в мягкую материаль-
ную упаковку, помещаются в среду и подвергаются
определенному времени высокого давления (от 100
до 1000 МПа) с целью достижения денатурации пи-
щевых белков, инактивации ферментов, устранения
микроорганизмов и улучшения характеристик пи-
щевых продуктов [2,8]. По сравнению с традицион-
ными методами термической стерилизации техно-
логия стерилизации HPP предлагает несколько пре-
имуществ, таких как значительно сокращенное
время обработки, меньшее потребление энергии и
равномерное приложение давления с высокой эф-
фективностью. Этот метод не только приводит к
инактивации белков и ферментов, но и сохраняет
структуру аминокислот в ферментных белках не-
тронутой. Кроме того, он не изменяет содержание
витаминов, пигментов или летучих вкусовых ве-
ществ, присутствующих в пищевых материалах,
одновременно продлевая их срок годности [2,5,9].
HPP напрямую воздействует на везикулы, пу-
зырьки и протоплазму внутри микробных клеток,
что приводит к деформации этих трех клеточных
структур. Кроме того, HPP вызывает изменения в
других клеточных структурах, такие как удлинение
формы клетки, отслоение мембранной стенки и
утолщение безмембранной клеточной стенки. При-
менение обработки HPP приводит к нарушению
третичной структуры ферментов, что приводит к
последующей инактивации ферментных белков. [9,
10,11]. Как правило, необратимая денатурация про-
исходит при воздействии HPP на ферменты выше
300 МПа. На ферментативную инактивацию могут
влиять многочисленные факторы, включая тип
фермента, время суток и уровень pH [10,11,12].
Технология сверхкритического диоксида уг-
лерода
В конце 1980-х годов несколько японских уче-
ных провели исследования бактерицидного дей-
ствия газа высокого давления, уделив особое вни-
мание диоксиду углерода (CO 2), в отношении био-
логических продуктов, термочувствительных
веществ и хранящихся продуктов. В результате тех-
нология диоксида углерода высокого давления по-
степенно привлекла всеобщее внимание [13]. По
сравнению с технологией стерилизации при нагре-
вании сверхкритический диоксид углерода (CК-CO
2 ) имеет значительные преимущества: во-первых,
он предотвращает ухудшение пищевой ценности,
текстуры, вкуса, сенсорных свойств и других аспек-
тов качества продуктов, вызванных высокотемпе-
ратурной обработкой, при этом максимально сохра-
няя исходное качество; во-вторых, он представляет
собой зеленую технологию обработки, которая яв-
ляется энергоэффективной и экологически чистой,
не нанося никакого вреда окружающей среде [14].
Повышение давления в CК-CO 2 усиливает проник-
новение CO 2 в клетки, что приводит к изменениям
как внутриклеточного, так и внеклеточного уровня
CO 2. Последующее растворение CO 2 внутри кле-
ток вызывает закисление, тем самым снижая внут-
риклеточный pH и нарушая целостность клеточных
мембран, что в конечном итоге приводит к микроб-
ной инактивации. Кроме того, для SC-CO 2 были
предложены альтернативные механизмы стерили-
зации, такие как химическая модификация и инги-
бирование клеточного метаболизма, которые спо-
собствуют лизису клеток и дополнительно усили-
вают его бактерицидную эффективность. Более
того, использование этой технологии позволяет пе-
рерабатывать CO 2, что делает ее экологически чи-
стым и устойчивым подходом к стерилизации пи-
щевых продуктов [15].
Технология импульсного электрического
поля
Импульсное электрическое поле (ИЭП) — это
новая, устойчивая и экологически чистая техноло-
гия обработки пищевых продуктов. Она быстро до-
ставляет электрическую энергию в биологические
ткани, расположенные между двумя электродами,
посредством чрезвычайно коротких импульсов вы-
сокой интенсивности, вызывая трансмембранную
разность потенциалов в тканях и повышая проница-
емость клеток через электроосмотический меха-
низм. Благодаря своей нетермической природе,
низкому потреблению энергии и быстрому времени
обработки эта технология не вызывает пагубное
воздействие нагревания на характеристики и чи-
стоту экстракта, при этом максимально сохраняя
исходный вкус и пищевую ценность пищи [16,17].
В настоящее время преобладает мнение, что основ-
ной механизм инактивации ИЭП сосредоточен во-
круг концепций электродезинтеграции и электро-
порации. Концепция электродезинтеграции пред-
полагает, что при воздействии внешнего
электрического поля заряды и электролиты накап-
ливаются внутри и снаружи клеточной мембраны,
оказывая давление на мембрану. Когда трансмем-
бранное напряжение превышает критический уро-
вень, клеточная мембрана распадается. Напротив,
теория электропорации утверждает, что под дей-
ствием электрического поля происходят изменения
в фосфолипидных бислоях и белковых каналах кле-
точной мембраны. Чувствительные к напряжению
белковые каналы открываются, создавая неболь-
шие поры в бактериальных мембранах, которые
увеличивают проницаемость. В результате неболь-
шие внешние молекулы проникают через эти поры,
вызывая расширение объема бактерий, разрыв мем-
браны и высвобождение клеточного содержимого,
что в конечном итоге приводит к повреждению или
гибели бактерий [18].
Технология обработки электролитической
водой
Технология электролитической воды (ЭВ)
включает использование электрохимических мето-
дов для электролиза низкоконцентрированных рас-
творов электролитов (таких как хлорид натрия, хло-
рид магния, хлорид калия, сульфат натрия и карбо-
нат калия) или воды в электролизном баке. Этот
процесс изменяет значение pH раствора, окисли-](https://image.slidesharecdn.com/sciencesofeuropeno1472024-240901173407-6df3454c/75/Sciences-of-Europe-No-147-2024-92-2048.jpg)
![Sciences of Europe # 147, (2024) 93
тельно-восстановительный потенциал (ОВП), ак-
тивность активного компонента хлора (АКК), ак-
тивные формы кислорода (АФК) и другие свойства.
Следовательно, он проявляет сильные окислитель-
ные характеристики и вызывает ингибирование ак-
тивности ферментов, подавление микробной [19].
Что касается бактериостатического механизма
электролизованной воды, он включает приложение
напряжения к раствору с сильными окислительно-
восстановительными возможностями, что создает
разность потенциалов между катодом и анодом.
Этот процесс электролиза преобразует раствор в
раствор с особыми физико-химическими свой-
ствами, которые могут изменять проницаемость
клеточной мембраны и взаимодействовать с внут-
риклеточными компонентами, такими как ДНК и
нуклеиновые кислоты, что приводит к денатурации
и ингибированию метаболизма микроорганизмов,
что в конечном итоге приводит к их гибели. Техно-
логия стерилизации ЭВ имеет многочисленные
преимущества по сравнению с традиционными ме-
тодами термической стерилизации и химическими
дезинфицирующими средствами. Она демонстри-
рует широкий спектр стерилизующих возможно-
стей, высокую эффективность, простоту эксплуата-
ции, отсутствие загрязнения или рисков для без-
опасности и экологическую устойчивость. Кроме
того, ЭВ сохраняет естественные физические и пи-
тательные свойства продуктов питания. Следова-
тельно, ЭВ стала важной областью исследований
для научных исследований продуктов питания во
всем мире [20].
Ультразвуковая технология
Ультразвук (УЗ) — это быстрая, универсаль-
ная и неразрушающая зеленая технология, широко
применяемая в сфере обработки пищевых продук-
тов для повышения качества продуктов питания и
обеспечения их безопасности. По частоте УЗ
можно разделить на высокочастотный УЗ (20 кГц ~
40 кГц) и низкочастотный УЗ (40 кГц ~ 1 МГц). Об-
ласти применения ультразвуковых волн с различ-
ными частотами в обработке пищевых продуктов
имеют различия [2,21,22]. УЗ, как перспективная
технология нетермической стерилизации, эффек-
тивнее традиционной термической обработки. Эф-
фект кавитации, вызванный УЗ-обработкой, нару-
шает целостность клеточных мембран, что приво-
дит к высвобождению внутриклеточных белков и
молекул ДНК, тем самым достигая микробной
инактивации. Кроме того, обширные исследования,
проведенные учеными, выявили механизм, посред-
ством которого УЗ снижает бактериальный метабо-
лизм, ослабляя активность соответствующих мета-
болических ферментов [2,22, 23].
Технология импульсного света
Импульсный свет (PL), также называемый вы-
сокоинтенсивным спектральным импульсным све-
том, состоит из блока питания и блока источника
света. Он использует мгновенные импульсы (мощ-
ность) и инертный газ (источник света) для излуче-
ния высокоэнергетического, широкоспектрального
импульсного «белого света» для достижения стери-
лизации посредством фотохимических и фотофизи-
ческих эффектов. Излучаемое электромагнитное
излучение охватывает диапазон длин волн 100–
1100 нм, охватывая ультрафиолетовую и ближнюю
инфракрасную области [2,24]. Эта технология объ-
единяет коротковолновый УФ-свет с высокой энер-
гией для подавления роста микробов посредством
фотохимической активности, вызывая постоянные
изменения в молекуле ДНК, которые препятствуют
пролиферации клеток и в итоге приводят к инакти-
вации клеток. Фотофизические и фототермические
эффекты процесса PL также способствуют микроб-
ной деконтаминации. Более сильная инфракрасная
составляющая света производит локализованный
фототермический эффект, что приводит к пере-
греву, повреждению клеток и разрыву. На процесс
стерилизации PL влияют различные физические
факторы, такие как скорость потока, поток им-
пульса или интенсивность света, количество вспы-
шек, уровень энергии импульса, приложенное
напряжение, расстояние от лампы до образца и со-
держание УФ-излучения; тип образца; упаковка; и
штамм микробов [7,10,25].
Нетермическая плазменная технология
Плазменная обработка — это инновационная
биоцидная технология. Плазма представляет собой
четвертое состояние вещества после твердых тел,
жидкостей и газов. Она делится на термическую и
нетермическую плазму (НТП) [7,26,27] НТП также
считается низкотемпературной плазмой, атмосфер-
ной холодной плазмой или холодной плазмой (ХП)
Технология ХП подразумевает использование ча-
стично или полностью ионизированных газов,
включая положительно и/или отрицательно заря-
женные ионы, атомы, возбужденные молекулы,
электроны, свободные радикалы, фотоны и другие
реактивные вещества (РВ) без наличия термодина-
мического равновесия [1,26] Таким образом, это
высокоэнергетическая химическая среда, объеди-
няющая частицы и излучение различной природы.
Газы, которые в настоящее время подвергаются
ионизации, — это воздух, азот (N 2 ), кислород (O 2
) или определенные смеси инертных газов, таких
как аргон (Ar), гелий (He) или неон (Ne). NTP гене-
рируется различными методами разряда, такими
как тлеющие разряды, радиочастотные волновые
разряды, микроволновые разряды, диэлектриче-
ские барьерные разряды (DBD), коронные разряды,
скользящие дуговые разряды или плазменные
струи [7,28]. Можно выделить три системы проек-
тирования на основе размещения пищи относи-
тельно результирующей плазмы, включая системы
дистанционной обработки, прямой обработки и
электродного контакта. В частности, как прямые,
так и косвенные методы могут использоваться для
пищевых продуктов любой формы [29].
NTP имеет повышенные коэффициенты диф-
фузии и широкий спектр активности против пато-
генных и вызывающих порчу микроорганизмов,
биопленок и спор. Механизмы NTP, которые вызы-
вают микробное повреждение или гибель, вклю-
чают (I) способность NTP и его активных видов ин-
гибировать образование биопленки, влияя на ее](https://image.slidesharecdn.com/sciencesofeuropeno1472024-240901173407-6df3454c/75/Sciences-of-Europe-No-147-2024-93-2048.jpg)
![94 Sciences of Europe # 147, (2024)
прикрепление, созревание, регуляцию и диффузию,
обеспечивая хороший контроль над ее образова-
нием [30]; (II) присущую фотодесорбцию УФ-
фотонов, которая разрушает мембраны и внутрен-
ние клеточные компоненты, что приводит к утечке
цитоплазматических и клеточных компонентов и
облегчает проникновение свободных радикалов
для ингибирования микроорганизмов [26,31; (III)
прямое генетическое повреждение, которое предот-
вращает репликацию ДНК и в конечном итоге при-
водит к гибели клетки [26,32]; (IV) прямое генети-
ческое повреждение, которое предотвращает ре-
пликацию ДНК и в конечном итоге приводит к
гибели клетки [26,33] ; и (V) прямое генетическое
повреждение, которое препятствует репликации
ДНК и в конечном итоге приводит к гибели клетки
[26,34].
2. Применение современных технологий
обработки для мяса и мясных продуктов
В свете проблем, вызванных глобализацией и
разнообразными требованиями потребителей к вы-
сококачественным и богатым питательными веще-
ствами продуктам, технология нетермической сте-
рилизации в пищевой промышленности не только
максимизирует сохранение естественного качества
продуктов, но и улучшает функциональные харак-
теристики и пищевую ценность. Следовательно,
она стала фокусной точкой и областью интенсив-
ного интереса в пищевой промышленности [7].
Технологии и области применения обра-
ботки высоким давлением
Общеизвестно, что HPP больше подходит для
консервирования обработанного мяса, чем сырого.
С 1990 года метод HPP успешно применяется в пи-
щевой промышленности для дезактивации микро-
организмов и получил одобрение от регулирующих
органов, таких как Управление по контролю за про-
дуктами и лекарствами США (FDA), Министерство
сельского хозяйства США (USDA), Европейское
агентство по безопасности пищевых продуктов
(EFSA), Министерство здравоохранения Канады и
других. В настоящее время во всем мире установ-
лено около 420 машин HPP, около 30% из которых
предназначены для консервирования вареных и вя-
леных мясных продуктов [35]. Carrapiso et al. иссле-
довали влияние HPP и температуры хранения на ко-
личество микроорганизмов, цвет и окислительную
стабильность нарезанного вяленого иберийского
ребра. Применение давления 600 МПа в течение 8
минут эффективно уменьшило количество всех
присутствующих микроорганизмов, не нарушая це-
лостности цвета или уровней окисления. Кроме
того, количество колиформных бактерий превы-
сило допустимые пределы при 4 °C после хранения
при 20 °C, что указывает на необходимость холод-
ного хранения для длительного сохранения, чтобы
гарантировать безопасность вырезки [12]. Ученые
Riekkinen et al. исследовали эффективность различ-
ных давлений при дезактивации L. monocytogenes в
готовых к употреблению (RTE) рыбных продуктах
из радужной форели (Oncorhynchus mykiss) в усло-
виях холодной и теплой фумигации. Результаты по-
казали, что давление 600 МПа продемонстрировало
наивысшую эффективность даже после 28 дней
хранения, гарантируя, что количество колоний L.
monocytogenes в образцах рыбы как холодного, так
и горячего копчения оставалось ниже норматив-
ного предела (100 КОЕ г −1
), установленного Регла-
ментом (ЕС) 2073/2005 [36]. Хотя технология HPP
предлагает преимущества холодной стерилизации
для различных пищевых продуктов, ее глобальное
применение остается ограниченным. Отсутствие
стандартизированных процессов и критериев
оценки, особенно с точки зрения микроорганизмов
порчи и их влияния на срок годности продукта, пре-
пятствует широкому внедрению промышленного
использования обработки пищевых продуктов HPP.
Кроме того, высокая стоимость оборудования HPP
и ограниченные возможности пакетной обработки
способствуют высокой стоимости пищевых про-
дуктов HPP. Технология стерилизации HPP не по-
лучила широкого распространения в пищевой про-
мышленности из-за ее неспособности к непрерыв-
ному производству [2,35].
Технология и применение сверхкритиче-
ского диоксида углерода
Преимущества технологии CК-CO 2 включают
простоту внедрения процесса из-за низкой критиче-
ской точки (31 °C и 73,9 бар), что позволяет эффек-
тивно контролировать процесс при низком давле-
нии, а также относительно низкие инвестиционные
затраты. Кроме того, CК-CO 2 обладает низкой вяз-
костью, что облегчает его проникновение в твердые
матрицы, такие как мясные продукты, во время
процессов экстракции. Однако следует отметить,
что технология CК-CO 2 требует сравнительно бо-
лее длительного времени обработки для инактива-
ции микроорганизмов. Santi et al. [15] изучали вли-
яние обработки диоксидом углерода под высоким
давлением на сырое мясо куриной грудки, уделяя
особое внимание инактивации микроорганизмов и
снижению остатков. После обработки CК-CO 2
наблюдалось заметное снижение на 1,3 Log КОЕ г
−1
E. coli и 1,4 Log КОЕ г −1
L. innocua в свежем мясе
куриной грудки. Между тем, Gonzalez-Alonso et al.
исследовали влияние обработки сверхкритическим
диоксидом углерода на микробные популяции в сы-
рой курице. Обработка высоким давлением прово-
дилась при температуре 40 °C, 80 °C или 140 °C в
течение 15–45 мин. Количество E. coli снизилось на
1,4 log КОЕ г −1
после 15-минутной обработки и еще
на 5 log после 45-минутной обработки, при этом
значительное снижение наблюдалось также у тер-
мофильных микроорганизмов [37]. В настоящее
время исследования технологии стерилизации CК-
CO 2 в пищевых продуктах в основном сосредото-
чены на жидких продуктах, таких как яблочный
сок, апельсиновый сок и молоко, с меньшим акцен-
том на мясе и мясных продуктах. Будущие исследо-
вания должны глубже изучить эффективность воз-
действия CК-CO 2 сенсорные и питательные свой-
ства различных мясных продуктов, а также
усовершенствовать методы обработки, чтобы обес-
печить промышленное применение стерилизации
CК-CO 2 в этом секторе. Комбинирование CК-CO 2](https://image.slidesharecdn.com/sciencesofeuropeno1472024-240901173407-6df3454c/75/Sciences-of-Europe-No-147-2024-94-2048.jpg)
![Sciences of Europe # 147, (2024) 95
с другими нетермическими технологиями или до-
бавками является ключевой областью интереса в
нетермической стерилизации. Однако преобладаю-
щее внимание к объединению CК-CO 2 с ультразву-
ком может препятствовать развитию и использова-
нию нетермической технологии в мясных продук-
тах, замедляя индустриализацию стерилизации CК-
CO 2 [38].
Технология импульсного электрического
поля и ее применение
В дополнение к хорошо известным природным
антибактериальным агентам, обработка PEF про-
должительностью менее 1 с продемонстрировала
эффективность в снижении количества бактерий
при сохранении свежести пищевых продуктов. Од-
нако следует отметить, что мягкие условия обра-
ботки PEF недостаточны для инактивации спор и
грамположительных бактерий. Следовательно, ин-
тенсивности обработки, превышающие 25 кВ см −1
,
эффективно уничтожают микроорганизмы; тем не
менее, более высокие уровни интенсивности PEF
могут негативно влиять на сенсорное восприятие
пищевых продуктов [2]. Karki et al. исследовали
влияние холодного хранения на качество, усвояе-
мость белка in vitro и рост микроорганизмов в ваку-
умно-запечатанных (SV) стейках рибай из говя-
дины (SR), которые были предварительно обрабо-
таны импульсным электрическим полем (PEF) [39].
Результаты показали, что обработка PEF значи-
тельно улучшила нежность SR, обработанного SV,
не влияя на потери при приготовлении, адгезию и
эластичность и т. д. Кроме того, количество бакте-
рий во всех образцах оставалось ниже предела об-
наружения 10 2
КОЕ г −1
в течение как минимум 21
дня при хранении в холодильнике при 4 °C. Таким
образом, можно сделать вывод, что время и темпе-
ратура SV, использованные в этом исследовании,
были достаточными для инактивации патогенов в
SR. Однако важно отметить, что споры способны
выживать при обработке PEF и SV. Если на про-
дукте присутствуют споры, способные прорастать
и расти при 4 °C, они могут потенциально ограни-
чить срок его хранения. Haughton et al. изучали эф-
фективность обработки PEF в дезактивации различ-
ных микроорганизмов, обнаруженных в жидких
средах и сырой курице. Была исследована воспри-
имчивость 10 изолятов Campylobacter, E. coli и S.
Enteritidis к обработке PEF в жидкой среде. Было
отмечено, что Campylobacter продемонстрировали
повышенную чувствительность к обработке PEF по
сравнению с E. coli и Streptococcus Enteritidis, что
указывает на потенциальные возможности сниже-
ния уровня Campylobacter в горячей или холодной
воде, используемой для обработки курицы [40].
Технология PEF, известная своим незначительным
временем обработки и мощными бактерицидными
свойствами, привлекла внимание исследователей.
Чтобы способствовать ее широкому внедрению в
пищевую промышленность, следует направить уси-
лия на повышение ее применимости, снижение про-
изводственных затрат и совершенствование высо-
ковольтного источника питания и регулировки
электродов. Необходимы дальнейшие исследова-
ния для оптимизации оборудования технологии
PEF и изучения синергии с другими методами сте-
рилизации для повышения ее эффективности в бо-
лее крупных масштабах [2,41].
Технология электролиза воды и ее примене-
ние
В настоящее время ЭВ широко используется
для дезинфекции в секторах переработки пищевых
продуктов и общественного питания из-за его но-
вой, безопасной и экологичной природы. Исследо-
вания показали, что мощная кислотная электроли-
зованная вода может эффективно удалять микробы
с внешних поверхностей оборудования для перера-
ботки пищевых продуктов, а также со свежих фрук-
тов и овощей [2,7] Lan et al. исследовали влияние
комбинирования LC-MRP с предварительной обра-
боткой слабокислой электролизованной водой
(СКЭВ) на холодное сохранение вакуумно упако-
ванного морского окуня [42]. Результаты показали,
что комбинированная обработка СКЭВ и LC-MRP
продемонстрировала высокую эффективность в по-
давлении роста бактерий. На протяжении всего пе-
риода хранения все группы продемонстрировали
значительную тенденцию к увеличению (P <0,05)
общего количества жизнеспособных микроорга-
низмов (ОМЧ). На 10-й день ОМЧ группы DW был
зарегистрирован на уровне 7,08 ± 0,02 log КОЕ г −1
,
что превышает предел порчи 7 log КОЕ г −1
. Анало-
гично, ОМЧ групп СКЭВ и LC-MRPs превысили
предел порчи на 13-й и 18-й дни соответственно,
достигнув значений 7,40 и 7,65 log КОЕ г −1
. Напро-
тив, только на 20-й день ОМЧ группы SM превысил
предел порчи, что указывает на то, что СКЭВ в со-
четании с LC-MRPs эффективно сдерживали рост
микроорганизмов в морском окуне. Chang et al. ис-
следовали влияние продолжительности обработки
концентрацией доступного хлора и соотношения
твердого вещества и жидкости на скорость ингиби-
рования бактерий у креветок, обработанных СКЭВ
[19]. После 6 дней хранения общее количество ко-
лоний в контрольной группе превысило допусти-
мые пределы для количества колоний креветок, то-
гда как группа СКЭВ достигла уровня свежести в
диапазоне 5,00–5,70 log КОЕ г −1
, что указывает на
то, что все обработки СКЭВ в некоторой степени
подавляли рост микроорганизмов на креветках. По-
сле 8 дней хранения только группа СКЭВ имела об-
щее количество колоний в допустимых пределах,
что свидетельствует о том, что обработка SAEW
оказала превосходное ингибирующее действие на
креветок и продлила срок их хранения более чем на
2 дня. Общее количество колоний в группе СКЭВ
оставалось в допустимых пределах, что указывает
на то, что обработка СКЭВ оказала оптимальное
ингибирующее действие на креветок.
Кислотная электролизованная вода — это но-
вая технология консервирования, которая предпо-
лагает эффективно задержать повышение pH мяс-
ных продуктов, подавить рост бактерий и сократить
потери воды. Текущие исследования кислотной
электролизованной воды в первую очередь сосре-](https://image.slidesharecdn.com/sciencesofeuropeno1472024-240901173407-6df3454c/75/Sciences-of-Europe-No-147-2024-95-2048.jpg)
![96 Sciences of Europe # 147, (2024)
доточены на оценке ее стерилизующего и консер-
вирующего эффекта, при этом механизм консерви-
рования все еще не полностью изучен. Технология
все еще находится в экспериментальной фазе, что
требует дальнейшего изучения механизма ее фор-
мирования, влияющих факторов, бактерицидных
активных компонентов, оценки безопасности и воз-
действия на сенсорные и пищевые качества мясных
продуктов [2].
Ультразвуковые технологии и их примене-
ние
Ультразвуковая обработка пищевых продук-
тов подразумевает мгновенную передачу акустиче-
ской энергии продукту посредством применения
высокочастотных акустических волн, превышаю-
щих 20 кГц. Этот неинвазивный метод эффективно
подавляет такие патогены, как E. coli, Salmonella и
L. monocytogenes. Кроме того, по сравнению с тра-
диционными методами термической обработки, он
сводит к минимуму пагубное воздействие на сен-
сорные и пищевые свойства, обеспечивая при этом
экономическую эффективность и сокращенное
время обработки [2,43]. Li et al. использовали соче-
тание обработки ультразвуком (УЗ, 200 Вт и 30
кГц) и слабокислой электролизованной водой
(СКЭВ, 60 мг л -1
, pH = 6,2) для изучения комбини-
рованного механизма воздействия и дезинфекции
для проведения экспериментов по свежести на зер-
кальном карпе во время хранения в холодильнике
при температуре 4 °C [44]. Микробиологические
результаты показали, что УЗ + СКЭВ эффективно
подавляли рост Pseudomonas, одновременно подав-
ляя внутреннюю ферментативную функцию. Кроме
того, эта процедура нарушала клеточную мембрану
Pseudomonas, что приводило к увеличению утечки
нуклеиновых кислот и белков, а также к значитель-
ному ингибированию антиоксидантной фермента-
тивной функции. Этот новаторский подход пред-
ставляет собой новую промышленную технологию
сохранения охлажденной рыбы. Wang et al. (2024)
изучали свойства размораживания говядины с ис-
пользованием ультразвука с деионизированной во-
дой (ДИВ) и активированной плазмой водой (ХП)
[23]. Результаты показали, что общее количество
жизнеспособных бактерий в образцах говядины по-
сле обработки составило 4,46 ± 0,009, 3,866 ± 0,027,
4,11 ± 0,008 и 3,54 ± 0,020 log10 КОЕ г− 1
соответ-
ственно, в то время как общее количество колоний
в среде составило 3,85 ± 0,005, 1,66 ± 0,083, 3,52 ±
0,013 и 1,50 ± 0,142 log10 КОЕ мл −1
соответ-
ственно. Использование оттаивания плазменно-ак-
тивированной водой (ПАВ) и комбинированного
ультразвукового оттаивания значительно снизило
бактериальную колонизацию как в образцах говя-
дины, так и в средах для оттаивания. Комбиниро-
ванная обработка продемонстрировала наиболее
эффективное бактерицидное воздействие на бакте-
рии, за ней следует группа ДИВ что указывает на
хороший бактерицидный эффект от использования.
Кроме того, анализ структуры белка показал, что
обработка увеличила упорядоченную структуру
белка, а также стабилизировала их общую конфи-
гурацию. Эти результаты в совокупности демон-
стрируют возможность использования ультразвука
в сочетании с ПАВ в приложениях по разморажи-
ванию мяса. В то время как ультразвуковая комби-
нированная технология демонстрирует потенциал
для стерилизации пищевых продуктов за счет со-
хранения качества продуктов питания и минимиза-
ции повреждения функциональных компонентов,
текущие исследования в первую очередь сосредо-
точены на эффектах ультразвуковой инактивации
спор, а не на изучении ультраструктурных и моле-
кулярных изменений. Механизм воздействия уль-
тразвуковой кавитации на многослойную струк-
туру спор остается неясным, и необходимы систе-
матические исследования по снижению
термической устойчивости спор. Более того, споры
могут прорастать при подходящих условиях, транс-
формируясь в вегетативные формы, которые пред-
ставляют риск для безопасности пищевых продук-
тов. Изучение восстановления прорастания и роста
спор после ультразвуковой обработки имеет реша-
ющее значение для решения этой проблемы [44].
Технологии импульсного света и их примене-
ние
Большая часть энергии, используемой в техно-
логии PL, поступает из ультрафиолетового сег-
мента электромагнитного спектра. Однако одно за-
метное преимущество PL перед статической УФ-
обработкой заключается в ее способности быстро
доставлять энергию к пищевым продуктам [7,24].
Кроме того, эта технология вызывает минимальные
сенсорные и питательные изменения, что делает ее
пригодной для обработки мясных продуктов с вы-
соким содержанием жира и белка. Тем не менее,
при использовании в высоких концентрациях во
время микробной инактивации PL может вызывать
изменения состава и цвета, а также изменения
свойств, вызванные перегревом. Baptista et al. про-
вели исследование по использованию технологии
PL для контроля Campylobacter в мясе птицы [45].
Инактивация микроорганизмов PL объясняется фо-
тотермическими (тепловые эффекты из-за повы-
шенной температуры), фотохимическими (ингиби-
рование образования новой цепи ДНК во время ре-
пликации ДНК из-за образования димеров) и/или
фотофизическими (повреждение клеточной мем-
браны и элюция белка) механизмами, влияющими
на грамотрицательные бактерии больше, чем на
грамположительные. Количество
Enterobacteriaceae в образцах, обработанных PL,
было снижено примерно на 1–1,3 log КОЕ г −1
по
сравнению с необработанными образцами, в то
время как при обработке 3 (3 см и 2828 В) с более
высокой дозой энергии 9,68 ± 0,15 Дж см −2
количе-
ство Campylobacter было значительно ниже (4,5 ±
0,01 log КОЕ г −1
, P < 0,05). Результаты подтвер-
дили, что PL помогает контролировать присутствие
Enterobacteriaceae или потенциальных патогенов
этого семейства бактерий в мясе птицы. Duma
Kokan et al. [46] исследовали влияние применения
импульсного света на физико-химические, техни-
ческие и сенсорные свойства, пищевой состав и
продление срока годности охлажденной свинины](https://image.slidesharecdn.com/sciencesofeuropeno1472024-240901173407-6df3454c/75/Sciences-of-Europe-No-147-2024-96-2048.jpg)
![Sciences of Europe # 147, (2024) 97
longissimus dorsi. Результаты показали, что после 10
дней замороженного хранения общее количество
жизнеспособных бактерий в группе, обработанной
импульсным светом, снизилось примерно на 1,51 ×
10 6
КОЕ г −1
по сравнению с контрольной группой.
Это снижение можно объяснить фотохимическим
эффектом импульсного света, который вызывает
повреждение клеточных мембран и, следовательно,
приводит к значительному уменьшению общего ко-
личества микроорганизмов, присутствующих на
поверхности свинины. Результаты также продемон-
стрировали, что применение импульсного света
привело к положительным результатам за счет сни-
жения индекса TBARS, окислительно-восстанови-
тельного потенциала и уровней активности воды.
Следовательно, эта инновационная технология де-
монстрирует значительный потенциал для продле-
ния срока годности сырого мяса без ущерба для его
качества. Стерилизация импульсным светом, со-
временная нетермическая технология, имеет явные
преимущества по сравнению с традиционными тер-
мическими и химическими методами стерилиза-
ции. Она не только повышает долговечность хране-
ния и текстуру продуктов, но и остается недоста-
точно используемой в пищевом секторе. Проблемы
возникают из-за различий в разновидностях обору-
дования, условиях тестирования и повторяемости.
Отсутствие стандартизированных процедур еще
больше усложняет ее широкое применение. Кроме
того, ограничение, налагаемое руководством FDA
1996 года на поток импульсов до 12 Дж см −2
, пре-
пятствует исследовательским усилиям, поскольку
многочисленные исследования превышают этот
предел. Переоценка этого стандарта и потенциаль-
ное повышение порога потока импульсов заслужи-
вают рассмотрения. Принятие междисциплинарной
стратегии путем интеграции импульсного света с
такими технологиями, как плазма, сверхвысокое
давление, антибактериальные агенты и фотосенси-
билизаторы, может способствовать развитию для
более эффективных методов стерилизации продук-
тов питания и технологий обработки продуктов пи-
тания [47].
Нетермические плазменные технологии и
их применение
Факторы, влияющие на антимикробную эф-
фективность НТП, можно разделить на 3 группы:
технологические, микробные и факторы про-
дукта/окружающей среды. Технологические фак-
торы включают напряжение, частоту, тип и концен-
трацию газа, время обработки и схему воздействия
[26,48]. Увеличение напряжения, частоты и подачи
тока может значительно увеличить инактивацию
микроорганизмов. Аналогичным образом, тип газа
имеет решающее значение, поскольку химия
плазмы зависит от природы газовой среды. Время
обработки является еще одним условием, которое
может существенно повлиять на эффективность
НТП [49]. Длительное время обработки НТП при-
водит к более высоким концентрациям активных
веществ, снижает pH и увеличивает смертность
микроорганизмов, особенно тех микроорганизмов,
которые находятся во внутренних слоях биопленки.
Целевой микроорганизм играет ключевую роль.
Тип бактерий, штамм, способ присутствия (тро-
фобласт или спора) и концентрация являются ос-
новными микробными факторами, которые корре-
лируют с эффективностью инактивации НТП [50].
Эффективность НТП тесно связана с состоянием
продукта, составом и структурными характеристи-
ками. Состав, топология поверхности и содержание
воды в продукте являются другими важными фак-
торами. Особенно на шероховатых поверхностях
бактерии могут прилипать в несколько слоев, что
может препятствовать диффузии плазмы [51].
Наконец, содержание влаги, а также влажность
окружающей среды положительно коррелируют с
эффективностью плазменной обработки. В обоих
случаях присутствие воды увеличивает концентра-
цию гидроксильных радикалов, что приводит к бо-
лее высоким скоростям окисления. Hu et al. исполь-
зовали атмосферную холодную плазму (ACP) для
изучения эффектов на сохранность красных креве-
ток в холодильной цепи хранения [52]. Результаты
показали, что циклическая обработка атмосферной
холодной плазмой значительно подавила рост мик-
роорганизмов и значений TVB-N у креветок по
сравнению с однократной обработкой. Через 8 дней
общее микробное число ( ОМЧ) контрольной
группы, групп ACP-3 мин (1 T) и ACP-1 мин (3T)
составили 6,29 log КОЕ г −1
, 5,76 log КОЕ г −1
и 5,56
log КОЕ г −1
соответственно. Бактериальная
нагрузка в размере 6 log КОЕ г −1
мяса креветок счи-
талась приемлемым пределом для водного про-
дукта. Только ОМЧ контрольной группы превы-
сила этот рекомендуемый предел, в то время как у
циклической группы она была значительно ниже,
чем у группы одноразовой обработки НТП (P <
0,05). Ученые Xu et al. [53] исследовали влияние на
микробную безопасность и качество тканей говя-
дины, сравнивая обработку микроэлектродной
плазмой с гелием и воздухом. Для свежих ломтиков
говядины обработка плазмой с воздухом показала
более высокую антимикробную активность в отно-
шении S. aureus и E. coli, чем обработка плазмой
SMD с гелием (1,5 против 0,9; 0,9 против 0,28 log
КОЕ г −1
при 10 мин). В этом исследовании сравни-
тельный анализ ролей ROS, ·OH и O 3 в микробной
инактивации. Согласно нашему исследованию, это
может быть роль O 3, который является долгоживу-
щим (около 10 мин) и гидрофобным ROS, легко
диффундирующим в ткани и вызывающим инакти-
вацию E. coli и S. aureus. НТП также имеет неко-
торые недостатки. Исследования показали, что про-
дукты с высоким содержанием жира не подходят
для этой обработки, поскольку липиды окисляются
и вызывают прогорклость. Кроме того, было обна-
ружено, что НТП повышает кислотность, снижает
твердость и вызывает изменение цвета некоторых
фруктов и овощей. Кроме того, шероховатость и не-
ровности на поверхности пищи могут препятство-
вать бактерицидному эффекту НТП [2, 26]
Проблемы и перспективы на будущее
Разработка и применение новой технологии
нетермической стерилизации пищевых продуктов,](https://image.slidesharecdn.com/sciencesofeuropeno1472024-240901173407-6df3454c/75/Sciences-of-Europe-No-147-2024-97-2048.jpg)
![98 Sciences of Europe # 147, (2024)
характеризующейся экологичным подходом к об-
работке с низким потреблением энергии и мини-
мальным загрязнением, эффективно решили много-
численные проблемы, связанные с традиционными
методами термической стерилизации [2,54] Однако
некоторые технологии все еще находятся на экспе-
риментальной стадии исследований и не могут
быть быстро внедрены в крупномасштабных или
практических производственных условиях. Основ-
ные причины этого ограничения следующие:
1. Законы и правила: Законы и правила, каса-
ющиеся технологии нетермической обработки,
устарели по сравнению с традиционными термиче-
скими методами, что приводит к отсутствию совре-
менных стандартов и санитарных правил безопас-
ности и процесса обработки [55].
2. Затраты на техническое перевооружение:
на сегодняшний день заводское оборудование со-
стоит из дорогостоящих, крупногабаритных меха-
нических деталей, которые не подходят для широ-
кого использования, как традиционные методы.
Следовательно, научному сообществу необходимо
углубиться в базовые механизмы связанных техно-
логий, а также усилить глобальное сотрудничество
для продвижения внедрения зеленой, экологически
чистой и эффективной технологии нетермической
стерилизации в переработке мяса и мясных продук-
тов [56].
3. Ограничения текущих исследований: необ-
ходимы фундаментальные исследования для выяс-
нения микробных механизмов реакции на стресс,
адаптации и «перекрестной толерантности» (как
общих, так и штамм-специфических) для устране-
ния фактических ограничений этого подхода. По-
этому будущие исследования должны быть сосре-
доточены на разработке различных технических
комбинаций методов стерилизации для создания
более полной теоретической основы для техноло-
гии стерилизации без термической обработки.
Выводы
Разработка современных новых нетермиче-
ских технологий в качестве замены методам терми-
ческой обработки является результатом усилий пи-
щевой промышленности по производству здоро-
вых, безопасных, обладающих высокой пищевой
ценностью и длительным сроком хранения пище-
вых продуктов. Нетермические технологии обра-
ботки и стерилизации имеют значительные преиму-
щества по сравнению с термическими процессами
из-за сокращенных требований к времени обра-
ботки, использования низких температур и уровней
потребления энергии, а также улучшения характе-
ристик качества пищевых продуктов, цвет, вкус и
возможности сохранения питательных веществ при
одновременном увеличении функциональности.
Более того, эти технологии демонстрируют превос-
ходные характеристики экологической устойчиво-
сти и способствуют увеличению срока годности
продукта. Поэтому, с целью обеспечения широкого
внедрения технологий нетермической обработки в
пищевую промышленность и удовлетворения за-
просов современного потребителя, необходимы
дальнейшие фундаментальные исследования, мас-
штабные инвестиции в научные исследования и
разработки.
Литература
1. Urugo, M.M., Teka, T.A., Berihune, R.A. et
al. Novel non-thermal food processing techniques and
their mechanism of action in mycotoxins decontamina-
tion of foods // Innovative Food Science & Emerging
Technologies. 2023.V. 85. p. 103312.
https://doi.org/10.1016/j.ifset.2023.103312
2. Бурак, Л. Ч. Ограничения и возможности
современных технологий обеспечению микробио-
логической безопасности пищевых продуктов // Из-
вестия высших учебных заведений. Пищевая техно-
логия. 2024. № 23(396). С. 6-13.
https://doi.org/10.26297/0579-3009.2024.2-3.1
3. Chiozzi, V., Agriopoulou, S. & Varzakas, T.
Advances, applications, and comparison of thermal
(pasteurization, sterilization, and aseptic packaging)
against non-thermal (ultrasounds, UV radiation, ozona-
tion, high hydrostatic pressure) Technologies in Food
Processing // Applied Sciences-Basel. 2022.V. 12(4). p.
2202. https://doi.org/10.3390/app12042202
4. Pandiselvam, R., Mitharwal, S., Rani, P. et al.
The influence of non-thermal technologies on color
pigments of food materials: an updated review // Cur-
rent Research in Food Science. 2023. V. 6. p. 100529.
https://doi.org/10.1016/j.crfs.2023.100529
5. Бурак, Л. Ч., Завалей А.П. Эффективность
комбинированного воздействия ультразвука и мик-
роволн при обработке пищевых продуктов. Обзор //
Техника и технология пищевых производств.
2024.Т. 54, № 2. С. 342-357
https://doi.org/10.21603/2074-9414-2024-2-2510
6. Dash, D.R., Singh, S.K. & Singha, P. Recent
advances on the impact of novel non-thermal technolo-
gies on structure and functionality of plant proteins: a
comprehensive review. Critical Reviews in Food Sci-
ence and Nutrition. 2022.V.64(10). pp. 3151–3166.
https://doi.org/10.1080/10408398.2022.2130161
7. Бурак, Л. Ч. Влияние современных спосо-
бов обработки и стерилизации на качество плодо-
овощного сырья и соковой продукции //Москва:
Общество с ограниченной ответственностью
«Научно-издательский центр ИНФРА-М», 2025.
236 с. ISBN 978-5-16-020036-1.
https://doi.org/10.12737/0.12737/2154991
8. Argyri, A.A., Papadopoulou, O.S., Tassou,
C.C. & Chorianopoulos, N. Effect of high pressure pro-
cessing on the survival of salmonella enteritidis and
shelf-life of chicken fillets // Food Microbiology.
2018.V. 70. pp. 55–64.
https://doi.org/10.1016/j.fm.2017.08.019
9. Okur, G., Tavman, S., Tsutsuura, S. & Nishi-
umi, T. Effect of high pressure processing on traditional
Turkish meatballs properties and microbiological
safety during frozen storage // LWT- Food Science and
Technology. 2023.V. 185. p. 115110.
https://doi.org/10.1016/j.lwt.2023.115110
10. Бурак, Л. Ч. Использование современных
технологий обработки для увеличения срока хране-
ния фруктов и овощей. Обзор предметного поля //](https://image.slidesharecdn.com/sciencesofeuropeno1472024-240901173407-6df3454c/75/Sciences-of-Europe-No-147-2024-98-2048.jpg)


![102 Sciences of Europe # 147, (2024)
OPTIMIZATION OF MARITIME SHIPPING ROUTES USING MACHINE LEARNING
Korostin O.
master’s degree, Classic Private University
DOI: 10.5281/zenodo.13382708
ABSTRACT
This article investigates the application of machine learning (ML) to optimize maritime shipping routes, en-
hancing efficiency and reducing costs in maritime logistics. Given the critical role of maritime transport in global
trade, optimizing shipping routes is imperative to address challenges such as fluctuating fuel prices and variable
weather conditions. Traditional optimization methods are compared with ML techniques, emphasizing the latter's
superior ability to handle complex, dynamic environments through data-driven decision-making. Key ML ap-
proaches, including neural networks, genetic algorithms, and reinforcement learning, are analyzed for their effec-
tiveness in route optimization. The study underscores ML's transformative potential in improving operational ef-
ficiency, cost reduction, and environmental sustainability in maritime logistics.
Keywords: machine learning (ML), maritime logistics, route optimization, neural networks, genetic algo-
rithms, reinforcement learning, environmental sustainability.
Introduction
Maritime logistics plays a pivotal role in the global
economy, facilitating the movement of goods across
continents and supporting international trade. The effi-
ciency and reliability of maritime transport are crucial
for maintaining the smooth flow of global supply
chains. However, the industry faces significant chal-
lenges, including fluctuating fuel prices, varying
weather conditions, and the need to minimize environ-
mental impacts. These factors necessitate the continu-
ous optimization of maritime routes to enhance opera-
tional efficiency and reduce costs.
Route optimization in maritime logistics has relied
on heuristic methods and human expertise. While these
approaches have provided satisfactory results, they of-
ten fall short in handling the complexity and dynamic
nature of modern maritime operations. The advent of
machine learning (ML) offers a transformative ap-
proach to address these challenges. Algorithms pow-
ered by ML can analyze vast amounts of data, recog-
nize patterns, and make data-driven decisions, thereby
optimizing routes more effectively than traditional
methods.
Applying ML to maritime route optimization is
still an emerging field, with significant potential for in-
novation and improvement. The goal of this research is
to explore the theoretical foundations of using ML for
optimizing maritime routes, highlighting the various al-
gorithms and data preprocessing methods that can be
employed.
Machine learning techniques in logistics
The increasing complexity of global supply chains
and the dynamic nature of maritime operations necessi-
tate sophisticated tools for efficient and effective deci-
sion-making. ML offers a suite of powerful algorithms
capable of processing vast amounts of data and uncov-
ering intricate patterns, thereby enabling enhanced lo-
gistical performance [1]. Each algorithm within the ML
paradigm brings unique strengths and is suited to ad-
dress specific challenges and constraints inherent to the
maritime industry.
Neural Networks are a component of ML, widely
utilized for their ability to model complex relationships
within large datasets. In the context of maritime logis-
tics, neural networks can predict optimal routes by an-
alyzing historical shipping data, weather conditions,
and port information. These models are particularly
adept at identifying nonlinear patterns and interactions
that traditional methods might overlook. Convolutional
Neural Networks (CNNs) and Recurrent Neural Net-
works (RNNs) are among the most commonly used ar-
chitectures. CNNs are effective for spatial data analy-
sis, while RNNs are suitable for time-series data, mak-
ing them ideal for forecasting dynamic maritime
conditions.
Genetic Algorithms (GA) are another powerful
tool employed in route optimization. Inspired by the
principles of natural selection and genetics, GA itera-
tively evolves solutions to optimization problems. In
maritime logistics, GA can optimize routes by evaluat-
ing a population of possible solutions, selecting the
best-performing ones, and combining them to create
new, potentially superior routes. This process continues
until an optimal or near-optimal solution is found. The
adaptability of GA allows them to handle complex,
multi-objective optimization problems, such as balanc-
ing cost, time, and environmental impact in route plan-
ning [2].
Reinforcement Learning (RL), a subset of ML,
focuses on learning optimal actions through trial-and-
error interactions with an environment. In maritime lo-
gistics, RL agents can be trained to make routing deci-
sions that minimize fuel consumption and transit time
while accounting for changing conditions like weather
and port congestion. The RL framework is particularly
useful for dynamic and uncertain environments,
providing robust solutions that adapt to real-time data.
Support Vector Machines (SVM), though tradi-
tionally used for classification tasks, have also found
applications in logistics. SVM can be employed to clas-
sify routes based on various criteria such as safety, cost-
efficiency, and environmental impact [3]. By defining
clear decision boundaries, SVM help in selecting the
most appropriate route under given conditions.
Clustering Algorithms, such as K-means and hi-
erarchical clustering, are utilized for segmenting routes
and identifying patterns in shipping data. These algo-
rithms group similar routes together, enabling logistics](https://image.slidesharecdn.com/sciencesofeuropeno1472024-240901173407-6df3454c/75/Sciences-of-Europe-No-147-2024-102-2048.jpg)
![Sciences of Europe # 147, (2024) 103
planners to analyze common characteristics and opti-
mize accordingly. For instance, clustering can reveal
which routes are most affected by specific weather pat-
terns, allowing for preemptive adjustments to avoid de-
lays.
Decision Trees and Random Forests provide in-
terpretable models for route optimization. These meth-
ods split data into branches to make decisions, which
can be visualized and understood easily. In maritime
logistics, decision trees can help identify the most crit-
ical factors affecting route efficiency, while random
forests, an ensemble of decision trees, can improve pre-
diction accuracy by averaging the results of multiple
trees [4].
Bayesian Networks, which represent probabilis-
tic relationships among variables, offer another ap-
proach to route optimization. These networks can
model the uncertainty inherent in maritime logistics,
such as varying port processing times and unpredicta-
ble weather conditions. By incorporating prior
knowledge and updating beliefs based on new data,
Bayesian networks provide a flexible and robust frame-
work for decision-making.
The integration of diverse ML techniques into
maritime logistics, such as neural networks, genetic al-
gorithms, reinforcement learning, and other advanced
methods, holds the potential for substantial improve-
ments in operational efficiency, cost reduction, and en-
vironmental sustainability [5]. By leveraging these
techniques, the maritime industry can better navigate
the complexities of route optimization and other logis-
tical challenges.
Comparison of ML techniques with traditional
optimization methods
The evolution of optimization methods in mari-
time logistics has transitioned from heuristic and rule-
based approaches to more advanced techniques enabled
by ML. Traditional optimization methods, such as lin-
ear programming and dynamic programming, have
been the backbone of route planning and operational ef-
ficiency for decades. However, the increasing complex-
ity of maritime logistics demands more adaptive and
robust solutions. ML techniques offer enhanced capa-
bilities in handling large datasets and dynamic varia-
bles, providing more accurate and efficient optimiza-
tion outcomes.
The comparison between ML techniques and tra-
ditional optimization methods reveals distinct differ-
ences in their approach, flexibility, and performance.
Traditional methods are often limited by their reliance
on predefined rules and static models, which may not
adequately capture the dynamic nature of maritime op-
erations. In contrast, ML techniques can continuously
learn and adapt from new data, offering more flexible
and resilient solutions (table 1).
Table 1.
Comparison of traditional optimization methods and ML techniques in maritime logistics [6, 7]
Attribute Traditional methods ML techniques
Data handling Relies on predefined datasets, limited flex-
ibility to incorporate new data sources.
Capable of processing and integrating large
volumes of diverse and complex data.
Flexibility Operates on fixed rules and static models,
making adaptation to new conditions chal-
lenging.
Highly adaptive, capable of adjusting to new
patterns and evolving conditions dynami-
cally.
Complexity man-
agement
Suitable for simpler, less variable scenar-
ios; struggles with high complexity and dy-
namic changes.
Excels in managing complex, non-linear re-
lationships and adapting to dynamic changes.
Computational
efficiency
Efficient for small-scale, less complex
problems with faster computation times.
Typically requires significant computational
resources, especially for large-scale applica-
tions.
Predictive accu-
racy
Variable and often limited by the quality
and scope of the initial rules and models.
Generally provides high accuracy due to con-
tinuous learning and refinement from new
data.
Adaptability Low adaptability, requires manual updates
and adjustments to models and rules.
High adaptability, automatically updates and
refines models based on new data inputs.
Real-time pro-
cessing
Limited real-time capabilities, primarily
operates on batch processing.
Capable of real-time data processing and de-
cision-making, crucial for dynamic environ-
ments.
From the author's perspective, the application of
ML in maritime route optimization represents a signif-
icant advancement over traditional methods. ML tech-
nologies not only process large volumes of data and ex-
tract valuable insights but also offer the flexibility and
adaptability required to operate in constantly changing
environments. These advantages make ML an indis-
pensable tool for achieving higher accuracy in predic-
tions and route optimization, leading to substantial cost
reductions and improvements in environmental sustain-
ability. While traditional methods remain useful for
low-complexity solutions and smaller data volumes,
their limited ability to adapt and integrate new data ren-
ders them less effective in the modern, dynamic condi-
tions of maritime logistics. Therefore, the integration of
ML into maritime logistics processes opens new hori-
zons for innovation and enhances the overall efficiency
of the industry.
Application of ML to maritime route optimiza-
tion
As global trade continues to expand, the complex-
ity of maritime logistics increases, necessitating ad-
vanced solutions to manage dynamic variables. ML
technologies provide robust capabilities for processing](https://image.slidesharecdn.com/sciencesofeuropeno1472024-240901173407-6df3454c/75/Sciences-of-Europe-No-147-2024-103-2048.jpg)
![104 Sciences of Europe # 147, (2024)
large datasets, identifying patterns, and making data-
driven decisions, which are essential for optimizing
maritime routes.
MarineTraffic, a global leader in ship tracking
and maritime intelligence, employs ML to enhance its
analytical capabilities [8]. This project provides real-
time information on ship movements and current loca-
tions of vessels in harbors and ports. Their predictive
maritime intelligence platform integrates big data mod-
eling and ML to optimize vessel operations, improve
chartering decisions, and enhance fleet utilization. By
leveraging ML, MarineTraffic provides real-time visi-
bility and advanced analytics, enabling better decision-
making and operational efficiency. The platform helps
in predicting vessel destinations, routes, and estimated
times of arrival (ETA), thus significantly improving the
operational planning and efficiency of shipping activi-
ties.
One example of an American shipping company
that saw a revenue increase due to the implementation
of ML is the American Shipping Company ASA
(AMSC). In 2023, AMSC reported a significant rise in
its annual revenue, reaching $104,6 million, which was
attributed to the enhanced operational efficiency and
decision-making capabilities brought about by ML
technologies (fig. 1).
Figure 1. AMSC operating revenue, million USD [9]
AMSC has integrated ML into various aspects of
its operations, including predictive maintenance and
route optimization. These ML-driven strategies mini-
mize downtime and reduce fuel consumption, thereby
enhancing both operational performance and cost-ef-
fectiveness. The predictive maintenance system utilizes
ML algorithms to forecast equipment failures before
they occur, allowing for timely maintenance and re-
pairs, which reduces unexpected downtime and extends
the lifespan of assets.
Route optimization using ML helps in selecting
the most efficient paths for vessels, cutting down on
fuel usage and reducing travel time. This not only saves
costs but also contributes to the company's sustainabil-
ity efforts by lowering greenhouse gas emissions.
Crowley Maritime Corporation has also inte-
grated ML into its operations to enhance efficiency and
reduce costs. The company uses ML algorithms for pre-
dictive maintenance, optimizing the maintenance
schedules of its fleet. By predicting equipment failures
and scheduling maintenance proactively, Crowley Mar-
itime reduces downtime and extends the lifespan of its
assets.
The development of new technologies has allowed
USA partners to access geographically close and relia-
ble suppliers as a viable alternative to China, where hu-
man rights issues, environmental concerns, and trade
tensions create uncertainty and risks. The USA is the
primary market for goods from the Northern Triangle
countries, where apparel and textiles are the main ex-
port products. In 2022, with the help of Crowley, Hon-
duras, Guatemala, and El Salvador collectively ex-
ported goods to the USA (fig. 2).
Figure 2. Export to the USA with Crowley's assistance in 2022, billion USD [10]
The application of ML in maritime route optimi-
zation offers substantial benefits for the maritime in-
dustry, addressing the increasing complexity of global
trade logistics. By leveraging ML technologies, compa-
nies like MarineTraffic, AMSC and Crowley can pro-
cess large datasets, identify patterns, and make data-](https://image.slidesharecdn.com/sciencesofeuropeno1472024-240901173407-6df3454c/75/Sciences-of-Europe-No-147-2024-104-2048.jpg)

![Sciences of Europe # 147, (2024) 107
Prospective studies. It is noted that the introduction of automated geoinformation systems of the new gener-
ation, such as GIS K-MINE® (developer – "KAI Scientific and Industrial Enterprise" LLC (Ukraine), will allow
to increase work productivity by 50% or more due to the use of optimization tasks, as well as speed up processes
several times approval of mining technical documentation with controlling bodies by transferring it in electronic
form.
Keywords: relay protection, automation, technological schemes, power supply, high-mountain mine, statis-
tical methods, efficiency, work safety
Introduction
The problem of a constant increase in electricity
consumption at mining enterprises is directly related to
the tasks of improving the quality and saving electricity
[1]. At many enterprises, the issues of rational use of
electricity are still not given due attention; the values of
specific energy consumption standards and ways of pos-
sible reduction through the use of new technologies are
not analyzed [2]. Also, the issues of forecasting electric-
ity consumption are not considered, which is important
when planning specific consumption rates [3]. Electrical
networks with a voltage of 6 kV of the mine in question
developed gradually as the number of mining operations
increased and, given their expected volume, cannot fully
provide reliable power supply to the developing areas of
underground and open-pit mining at the mine [4]. There-
fore, an increase in power consumption, the need to en-
sure higher reliability and flexibility of the power supply
system for mining operations and the safety of electrical
installations in networks of various voltages when ex-
panding the scope of mining operations, both under-
ground and open-pit, is an important scientific and prac-
tical problem that requires an urgent solution [5].
The object of the study is the technology and tech-
nical means for power supply to developing ore mining
sites at a mining enterprise. One of the most problem-
atic areas is the difficulty in operating cable networks
with a voltage of 6 kV, caused by breakdowns of cable
insulation simultaneously in different sections of the
cable network during a short circuit (short circuit) to
ground in one of its sections [6].
The purpose of the study is to develop a method-
ology for calculating and forecasting the specific power
consumption of a mining enterprise based on the results
of experimental studies using statistical and graphic-an-
alytical methods. This will improve the safety of elec-
trical installations in networks of various voltages when
expanding the scope of mining operations, as well as
carry out ongoing monitoring of electricity consump-
tion and obtain an economic effect by improving the
operation of relay protection. To achieve this goal, it is
necessary to solve such problems.
1. Perform a technological audit and measure short
circuit currents to ground.
2. Develop a methodology for predicting specific
power consumption for individual technological sec-
tions of the quarry using modern software.
3. Give recommendations on the settings of relay
protection against short circuits and on the use of direc-
tional protection against single-phase ground faults.
Research methods
During the study, complex methods of direct
ground fault were used to determine the admittance, a
method using an artificial displacement of the network
neutral relative to the ground from an external current
source, as well as a method of imposing a constant oper-
ating current on a high-voltage operating network. An
analysis of work in the field of increasing the operational
reliability of power supply to developing ore mining sites
at a mining enterprise, mine, quarry and laboratory ex-
perimental studies, mathematical and physical modeling,
as well as theoretical analysis and generalization of re-
search results using standard and new methods were also
carried out [7].
Research results
Analysis of load diagrams of technological de-
partments of a high-mountain mine. The research was
carried out at the quarry of a mining and processing
plant, which produces copper and barite ore, extracts
quartzite and a number of additional works. The quarry
is a large production unit, the power consumption of
which is greatly influenced by a number of mining, ge-
ological and organizational factors. Thus, the monthly
power consumption of the quarry varies within certain
limits randomly. These changes have a certain impact
on the values of specific power consumption and en-
ergy losses in the elements of the power supply system.
In order to outline possible ways of rational energy con-
sumption in a quarry, it is necessary to analyze the elec-
tricity consumption graphs for the main divisions of the
quarry using methods of mathematical statistics [8].
Calculation diagram of quarry networks
To calculate short-circuit currents, a design dia-
gram (Figure 1) and an equivalent circuit (Figure 2) of
the quarry networks are drawn up..](https://image.slidesharecdn.com/sciencesofeuropeno1472024-240901173407-6df3454c/75/Sciences-of-Europe-No-147-2024-107-2048.jpg)
![108 Sciences of Europe # 147, (2024)
~
С
6 кВ
ТДТН-25 110/10/6
10 кВ
АС-50
АС-3´120
ТМ-4000 10/6
АС-240
А-35
АС-240
ЭКГ-4,6
№19
ЭКГ-4,6
№13
ЭКГ-8И
№8
АС-240
6 кВ
А-35
ЭКГ-8И
№11
А-35
ЭКГ-8И
№6
АС-240
СБШ 250МН
№19
А-35
0,4 кВ
АС-240
А-35
СБШ 250МН
№17
СБШ 250
№16
АС-240 0,4 кВ
А-35
СБШ 250МН
№18
АС-240
А-35
А-35
ЭКГ-8И
№10
АС-240
6 кВ
ЭКГ-8И
№12
АС-240
А-35 ЭКГ-8И
№9
А-35
6 кВ
0,4 кВ
СБШ 250МН
№15
АС-240
А-35
ЭКГ-4,6
№16
АС-240
АС-35
0,4 кВ
СБШ 250МН
№20
6 кВ
Figure 1. Calculation diagram of the quarry network
1
0,172
2
0,141; 0,179
3
7´10−4
;
2´10−4
4
0,165
5
0,076; 0,229
6
0,062; 0,188
7
0,055; 0,166
8
0,061; 0,184
9
0,079; 0,204
10
0,062; 0,188
11
0,058; 0,177
12
0,067; 0,203
33
0,01; 0,299
34
0,066; 0,199
К1
36
0,315; 0,156
37
0,033; 0,008
К4
35
0,071; 0,214
К3
44
0,096; 0,291
К30
47
0,29; 0,143
45
0,083; 0,251
51
0,249; 0,123
52
3,473
53
6,499; 1,518
К25
46
0,051; 0,155
К26
К31
54
0,349; 0,172
55
0,033; 0,008
48
0,033; 0,008
К28
49
3,473
50
6,499; 1,518
К29
13
0,415; 0,205
14
0,033; 0,008
К15
15
0,033; 0,008
К5
К2
38
0,315; 0,156
39
3,115; 0,158
40
6,499; 1,518
41
0,315; 0,156
42
3,473
43
6,499; 1,518
К6
К16
К8
16
0,373; 0,124
К9
К10
20
0,357; 0,176
21
29,52
23
6,499; 1,518
22
3,473
К19
К20
К11
К18
18
0,415; 0,205
19
29,52
К21
24
0,481; 0,283
25
0,033; 0,008
К22
26
0,515; 0,254
27
0,033; 0,008
К12
К23
28
0,558; 0,275
29
0,033; 0,008
К24
30
0,257; 0,122
31
3,473
К13
К14
32
6,499; 1,518
Figure 2. Replacement diagram of the quarry network
The dispersion of discrete random variables from
the mathematical expectation is characterized by the
variance:
𝐷[𝑥] = 𝑀{𝑥 − 𝑀[𝑥]}2
(2)
To estimate the dispersion of quantities in practi-
cal calculations, the standard deviation is more often
used:
𝜎[𝑥] = √𝐷[𝑥] (3)
The accuracy of statistical estimates can be char-
acterized by a confidence interval (𝜃∗
− 𝛿, 𝜃∗
+ 𝛿),
which covers the unknown parameter with a given re-
liability :
𝑃[𝜃∗
− 𝛿 < 𝜃 < 𝜃∗
+ 𝛿] = 𝛾(4)
When determining the width of the confidence in-
terval, as well as for a number of other statistical esti-
mates, the Student distribution is used, characterized by
the parameter:
𝑡 =
𝑥̅−𝑀[𝑥]
𝑆2 ∙ √𝑛 (5)
where 𝑥̅ – sample mean; 𝑆 – “corrected” standard
deviation; 𝑛 – sample size.
When analyzing statistical dependencies, it be-
comes necessary to describe these dependencies in the
form of mathematical expressions that take into ac-
count the relationships between random variables. The
construction of such dependencies is carried out using
the theory of regression analysis. The main task of the](https://image.slidesharecdn.com/sciencesofeuropeno1472024-240901173407-6df3454c/75/Sciences-of-Europe-No-147-2024-108-2048.jpg)
![Sciences of Europe # 147, (2024) 109
analysis is to study the relationship between the result-
ing feature 𝑦 and the observed feature 𝑥, and to evaluate
the regression function [9].
If the value of 𝑟 is close to one, then there is a close
relationship between the values of 𝑥 and 𝑦, approaching
a functional dependence; when r is close to zero, the
relationship is random and cannot be represented in the
form of an equation. The considered concepts of statis-
tical assessment and analysis of random variables will
be used in the future in the analysis of power consump-
tion processes in a quarry [10, 11].
Methodology for calculating electrical loads
When analyzing the operating modes of electrical
receivers of industrial enterprises, the following types
of loads are usually considered: active power, current
and reactive power. When analyzing power consump-
tion for individual technological divisions of the
quarry, we use monthly power consumption as the stud-
ied parameter [12, 13].
The closeness of the connection between random
variables 𝑥, 𝑦 is characterized by the pair correlation
coefficient (6).
1 1 1
2 2
2 2
1 1 1 1
1 1 1
1 1 1 1
n n n
i i i i
i i i
n n n n
i i i i
i i i i
x y x y
n n n
r
x x y y
n n n n
= = =
= = = =
− −
=
− −
(6)
where 𝑥𝑖, 𝑦𝑖 – values of random variables under
study at the 𝑖-th observation; 𝑛 – number of observa-
tions.
Electricity consumption at the quarry is accounted
for in the following technological for eight Depart-
ments, such as, (kWh):
1) overburden; 2) mining of copper ore; 3) loading
from a quartzite dump; 4) loading barite ore from a
dump; 5) extraction of basalt stone; 6) crushing of bas-
alt stone; 7) administrative building; 8) mechanical
workshop.
Energy consumption data for each department is
recorded in the memory of electronic meters and is the
initial information for analyzing load graphs. Due to
some arrhythmia in the operation of technological
equipment, fluctuations in power consumption may be
observed throughout the day, weeks, months, quarters
and years. Therefore, one of the tasks of analyzing load
diagrams is to identify these fluctuations, assess their
impact on the value of specific power consumption and
ways to eliminate them.
There is also a need to determine the value of the
mathematical expectation of power consumption for a
certain period of time (month, quarter, year). It is also
necessary to estimate the value of the confidence inter-
val characterizing the spread of fluctuations in power
consumption from the value of its mathematical expec-
tation. The values of mathematical expectation and
confidence interval are calculated using methods of sta-
tistical mathematics. To analyze electricity consump-
tion for the period under study, the following are con-
sidered: by month - average monthly load graphs; by
quarter – averaged quarterly load graphs; by year – av-
eraged annual load graphs [14, 15].
Graphic-analytical method for studying aver-
age monthly electrical loads
When analyzing fluctuations in electricity con-
sumption within each month, it is necessary to find out
whether there is any pattern of changes in electricity
consumption or not. To carry out such an analysis, it is
necessary to construct average monthly load graphs for
each of the quarry divisions, representing the depend-
ence of the average monthly power consumption
𝑊𝑚𝑜𝑛𝑡ℎ within five years:
𝑊𝑚𝑜𝑛𝑡ℎ = 𝑓(𝑖) (7)
Average monthly power consumption 𝑊𝑚𝑜𝑛𝑡ℎ
represents the arithmetic average of electricity con-
sumption in the same month when considered for all
years:
,
1
,
.
n
W
W
n
j
j
i
month
i
month,
=
=
(8)
where 𝑖 – number of the month in question; 𝑗 –
year number; 𝑛 – number of years.
Based on the power consumption data obtained at
the quarry using expression (8), the average monthly
values of power consumption were calculated for the
quarry divisions, which are given in Table 1. To assess
the degree of fluctuation in power consumption and es-
tablish patterns of power consumption by month over
five years, it is necessary to statistically process the data
in Table 1](https://image.slidesharecdn.com/sciencesofeuropeno1472024-240901173407-6df3454c/75/Sciences-of-Europe-No-147-2024-109-2048.jpg)
![110 Sciences of Europe # 147, (2024)
Table 1.
Average monthly power consumption by technological divisions of the quarry (W, kWh)
Months
1 2 3 4 5 6 7 8
Overburden (No. 1)
841517 783740 766650 762600 746520 787520 767980 800760
Copper ore mining (No. 2)
74567 72600 80267 72833 75567 76433 76533 72833
Loading quartzites from the dump (No. 3)
33383 35960 42360 43900 41540 37140 40800 39060
Loading barite ore from a dump (No. 4)
27731 24187 24341 27363 24325 35462 26600 25792
Extraction of basalt stone (No. 5)
3227 1080 3327 2033 2000 4000 2780 1300
Crushing basalt stone (No. 6)
2980 3285 5170 6617 5167 4780 3532 6127
Administrative building (No. 7)
7067 8060 7860 5860 5325 5000 2000 3400
Mechanical workshop (No. 8)
23333 24120 23260 19120 16920 21920 9580 10000
for compliance with any distribution law and de-
termine the following statistical indicators: mathemati-
cal expectation 𝑀[𝑊𝑚𝑜𝑛𝑡ℎ] power consumption values,
standard deviation, confidence intervals. It is also nec-
essary to perform a regression analysis to determine the
pattern of power consumption for each of the techno-
logical divisions of the quarry [16, 17]. Systematic pro-
cessing of the data shown in Table 1 was carried out
using modern software. The analysis showed that, by
the months of the years under study, the amount of elec-
tricity consumption in all divisions of the quarry fol-
lows the normal distribution law [18, 19].
Calculated mathematical expectation values
𝑀[𝑊𝑚𝑜𝑛𝑡ℎ], standard deviation 𝑆𝑛 and the value of the
confidence interval 𝑡𝛼,𝑘∙𝑆𝑛 are given in Table 2. The
value of the confidence interval was determined using
the value of the Student coefficient 𝑡𝛼,𝑘 taken at the
confidence level 𝑝 = 0,95 (at significance level 𝛼 =
0,05) and number of measurements 𝑛 = 12. For these
values, the number of degrees of freedom is: 𝑘 = 𝑛 −
2 = 10 and 𝑡0,05;10 = 2,23. Using computer software,
regression analysis was performed according to Table
1.
Table 2.
Statistical processing data (kWh)
Department number 1 2 3 4 5 6 7 8
𝑀[𝑊𝑚𝑜𝑛𝑡ℎ] 802737 74958 38614 24061 2035 4429 5303 17919
𝑆𝑛 58393 2198 3160 3071 1593 1569 1872 5155
𝑡𝛼,𝑘∙𝑆𝑛 130217 4902 7048 6848 3600 4361 4174 11496
In order to increase the reliability of the analysis
for approximating power consumption dependencies
𝑊𝑚𝑜𝑛𝑡ℎ starting from month number the regression
equations were proposed:
𝑊𝑚𝑜𝑛𝑡ℎ = 𝑎0 + 𝑎1 ∙ 𝑖
𝑊𝑚𝑜𝑛𝑡ℎ = 𝑎2 ∙ 𝑒𝑥𝑝(𝑎3 ∙ 𝑖) (9)
𝑊𝑚𝑜𝑛𝑡ℎ = 𝑎4 + 𝑎5 ∙ 𝑖 + 𝑎6 ∙ 𝑖2
where 𝑎0, 𝑎1, 𝑎2, 𝑎3, 𝑎4, 𝑎5, 𝑎6 – coefficients de-
termined using the least squares method (OLS). It is
better to use different symbols, i.e. a0 and a1 for the first
equation, a2 and a3 – for the second, a4, a5, a6 – for the
third.
The adequacy of regression equations (8-10) or (9)
is determined using the Fisher criterion. Based on the
results of the calculations performed for the quarry di-
visions, the following dependencies were obtained for
eight Departments, such as, (kWh):
1) for stripping:
𝑊𝑚𝑜𝑛𝑡ℎ = 7,61 ∙ 105
+ 6,49 ∙ 103
∙ 𝑖
𝑊𝑚𝑜𝑛𝑡ℎ = 7,63 ∙ 105
∙ 𝑒7,5∙10−3∙𝑖
(10)
𝑊𝑚𝑜𝑛𝑡ℎ = 8,47 ∙ 105
− 3,04 ∙ 104
∙ 𝑖 + 2,83 ∙ 103
∙ 𝑖2
2) for the extraction of copper ore:
𝑊𝑚𝑜𝑛𝑡ℎ = 7,56 ∙ 104
− 99,2 ∙ 𝑖
𝑊𝑚𝑜𝑛𝑡ℎ = 7,55 ∙ 104
∙ 𝑒−2,54∙10−2∙𝑖
(11)
𝑊𝑚𝑜𝑛𝑡ℎ = 7,42 ∙ 104
+ 5,08 ∙ 102
∙ 𝑖 − 46,7 ∙ 𝑖2
3) for loading quartzites from a dump:
𝑊𝑚𝑜𝑛𝑡ℎ = 3,89 ∙ 104
− 47,3 ∙ 𝑖
𝑊𝑚𝑜𝑛𝑡ℎ = 3,86 ∙ 104
∙ 𝑒−6,35∙10−4∙𝑖
(12)
𝑊𝑚𝑜𝑛𝑡ℎ = 3,44 ∙ 104
+ 1,86 ∙ 103
∙ 𝑖 − 146 ∙ 𝑖2
4) for loading barite ore from a dump:
𝑊𝑚𝑜𝑛𝑡ℎ = 2,78 ∙ 104
− 5,74 ∙ 𝑖
𝑊𝑚𝑜𝑛𝑡ℎ = 2,81 ∙ 104
∙ 𝑒−2,54∙10−2∙𝑖
(13)
𝑊𝑚𝑜𝑛𝑡ℎ = 2,53 ∙ 104
+ 449 ∙ 𝑖 − 77,6 ∙ 𝑖2
5) for the extraction of basalt stone:
𝑊𝑚𝑜𝑛𝑡ℎ = −3,22 ∙ 102
+ 6,65 ∙ 102
∙ 𝑖
𝑊𝑚𝑜𝑛𝑡ℎ = 1,84 ∙ 103
∙ 𝑒3,33∙10−2∙𝑖
(14)
𝑊𝑚𝑜𝑛𝑡ℎ = 7,47 ∙ 103
− 2,93 ∙ 103
∙ 𝑖 + 299,6 ∙ 𝑖2
6) for crushing basalt stone:
𝑊𝑚𝑜𝑛𝑡ℎ = 2,73 ∙ 103
+ 639,4 ∙ 102
∙ 𝑖](https://image.slidesharecdn.com/sciencesofeuropeno1472024-240901173407-6df3454c/75/Sciences-of-Europe-No-147-2024-110-2048.jpg)
![Sciences of Europe # 147, (2024) 111
𝑊𝑚𝑜𝑛𝑡ℎ = 2,85 ∙ 103
∙ 𝑒0,146∙𝑖
(15)
𝑊𝑚𝑜𝑛𝑡ℎ = 15,7 + 2,68 ∙ 103
∙ 𝑖 − 291,3 ∙ 𝑖2
7) for administrative building:
𝑊𝑚𝑜𝑛𝑡ℎ = 2,18 ∙ 103
− 288,3 ∙ 𝑖
𝑊𝑚𝑜𝑛𝑡ℎ = 6,94 ∙ 103
∙ 𝑒−5,23∙10−2∙𝑖
(16)
𝑊𝑚𝑜𝑛𝑡ℎ = 1,02 ∙ 104
− 1,58 ∙ 103
∙ 𝑖 + 99,5 ∙ 𝑖2
8) for mechanical workshop:
𝑊𝑚𝑜𝑛𝑡ℎ = 2,26 ∙ 103
− 727 ∙ 𝑖
𝑊𝑚𝑜𝑛𝑡ℎ = 2,22 ∙ 107
∙ 𝑒−4,03∙10−2∙𝑖
(17)
𝑊𝑚𝑜𝑛𝑡ℎ = 3,05 ∙ 104
− 4,09 ∙ 103
∙ 𝑖 + 258,7 ∙ 𝑖2
The values of the correlation coefficient r, which
characterizes the close relationship between power con-
sumption and the number of month i, are given in Table
3.
Table 3.
Correlation coefficients for power consumption regression equations
Department num-
ber
1 2 3 4 5 6 7 8
𝑟 0,4007 –0,1627 –0,0479 –0,6742 0,4076 0,7625 –0,5553 –0,0851
The obtained regression equations were checked
for adequacy using the Fisher criterion. The results of
these checks are given in Table 4-6. Please write the
criterion in the form used and describe , K1,K2 S2
.
As can be seen from the data obtained, presented
in Tables 4-6, for all divisions and for the three selected
types of regression equations, the following relation is
satisfied: F(,k1, k2)<Fcalc., which indicates the ade-
quacy of all obtained dependencies. This gives grounds
to assert that all the obtained dependencies are valid and
can be used for calculations. A linear relationship is
recommended as the simplest for engineering calcula-
tions 𝑊𝑚𝑜𝑛𝑡ℎ from 𝑖. From the data in Table 3 it follows
that the most correlated are the power consumption de-
pendencies 𝑊𝑚𝑜𝑛𝑡ℎ for the following divisions of the
quarry: stripping, loading barite ore from the dump,
mining of basalt stone, crushing of basalt stone, admin-
istrative building.
Table 4.
Significance of linear regression equation
Department num-
ber
S2
, (kWh)2
W, kWh W1, kWh Wres, kWh F(,k1,k2) Fcalc.
1 3,15109
3,751010
1,261010
2,491010 4,96 5,03
2 5,18106
2,99107
1,04107
1,95107 4,96 5,4
3 1,1107
1,07108
4,39107
6,31107 4,96 6,93
4 5,66106
6,03107
2,34107
3,69107 4,96 6,2
5 2,71107
2,02108
1,01108
1,01108 4,96 5,45
6 1,29106
2106
1,63106
3,7105 4,96 5,84
7 2,67106
2,9107
1,04107
1,86107 4,96 5,86
8 2,17107
1,02109
8,5108
1,7108 4,96 5,65
where DN – Department number,=0,05, k1=1, k2=10, m=5.
Table 5.
Significance of exponential regression equation
Department num-
ber
k1 k2 m S1
2
, (kWh)2
W, kWh W1, kWh
Wres,
kWh
F(,k1, k2) Fcalc.
1 0,05 1 10 5 3,15103
3,751010
1,251010
2,51010 4,96 5,05
2 0,05 1 10 5 5,18106
2,99107
1,04107
1,95107 4,96 5,3
3 0,05 1 10 5 1,1107
1,07108
4,38107
6,32107 4,96 6,9
4 0,05 1 10 5 5,66106
6,03107
2,26107
3,77107 4,96 6
5 0,05 1 10 5 2,71107
2,02108
8,13107
1,21108 4,96 5,41
6 0,05 1 10 5 1,29106
2106
1,28106
7,2105 4,96 6,3
7 0,05 1 10 5 2,67106
2,9107
1,07107
1,83107 4,96 5,82
8 0,05 1 10 5 2,17107
1,02109
8,67108
1,53108 4,96 5,61
That is, in these divisions, power consumption is
subject to certain dependencies on the number of the
month (season). For the departments of copper ore min-
ing, loading quartzites from a dump, and a mechanical
workshop, the dependence of power consumption is
largely determined by random factors, which corre-
sponds to the nature of the work of these departments
[20, 21].](https://image.slidesharecdn.com/sciencesofeuropeno1472024-240901173407-6df3454c/75/Sciences-of-Europe-No-147-2024-111-2048.jpg)
![112 Sciences of Europe # 147, (2024)
Table 6.
Significance of parabolic regression equation
Department num-
ber
k1 k2 m S2
, (kWh)2
W, kWh W1, kWh
Wres,
kWh
F(,k1, k2) Fcalc.
1 0,05 1 10 5 1,89109
3,751010
7,55109
2,991010 4,96 5,12
2 0,05 1 10 5 4,44106
2,99107
8,88106
2,1107 4,96 5,4
3 0,05 1 10 5 7,33106
1,07108
2,93107
7,77107 4,96 6,95
4 0,05 1 10 5 4,54106
6,03107
1,81107
4,22107 4,96 6,27
5 0,05 1 10 5 1,67107
2,02108
1,24108
7,8107 4,96 5,52
6 0,05 1 10 5 3,96105
2106
3,96105
1,6106 4,96 6,83
7 0,05 1 10 5 1,22106
2,9107
4,88106
2,41107 4,96 5,9
8 0,05 1 10 5 1,16107
1,02109
4,63108
5,57109 4,96 5,71
According to the table. 1, for graphical analysis,
average monthly power consumption graphs were con-
structed for eight technological divisions of the quarry
(Departments). As an example, these dependencies for
the quarry divisions (overburden, department No. 1) are
presented in Fig. 3. The dotted line in the indicated fig-
ure shows the values of the mathematical expectation.
Analysis of the graph (see Fig. 3) shows that there is no
trend towards an increase or decrease in power con-
sumption during the month [22, 23]. To analyze power
consumption within a quarter, it is necessary to con-
sider the average quarterly graphs of electrical loads for
all divisions of the quarry. In the same way, as in the
analysis of average monthly load graphs, the values of
power consumption are determined 𝑊. These data are
shown in Table. 7.
Figure 3. Average monthly power consumption chart for overburden
Study of average quarterly graphs of electrical
loads
Statistical processing of data in Table 7 showed
that within the quarter the amount of electricity con-
sumption 𝑊 in all divisions of the quarry it obeys the
normal distribution law by departments and quarters of
the year [24, 25].
Table 7.
Average quarterly power consumption by technological divisions of the quarry (кWh)
I II III IV
Overburden (No. 1)
2406820 2296640 2410720 2174600
Copper ore mining (No. 2)
227483 224833 223400 224300
Loading quartzites from the dump (No. 3)
114280 122580 116720 123275
Loading barite ore from a dump (No. 4)
72287 77166 77111 52137
Extraction of basalt stone (No. 5)
7634 8033 3200 1800
Crushing basalt stone (No. 6)
11435 18401 15378 16121
Administrative building (No. 7)
22400 15120 7800 16000
Mechanical workshop (No. 8)
71180 57960 32980 54375
7
8
9
10
1 2 3 4 5 6 7 8 9 10 11 12
W
month.
10
-5
,
kWh
Months](https://image.slidesharecdn.com/sciencesofeuropeno1472024-240901173407-6df3454c/75/Sciences-of-Europe-No-147-2024-112-2048.jpg)
![Sciences of Europe # 147, (2024) 113
Calculated mathematical expectation values
𝑀[𝑊], standard deviation 𝑆𝑛 and the value of the con-
fidence interval 𝑡𝛼,𝑘∙𝑆𝑛, defined in the same way as
above are given in Table 8.
Table 8.
Statistical processing data
Department number 1 2 3 4 5 6 7 8
kW
W
M , kWh 2322195 224991 119214 69675 5167 14700 15330 54124
Sn, kWh 111705 1732 4415 11914 1174 1039 3279 11591
t,k Sn, kWh 480331 7447 1897 51229 5050 13200 14100 51131
To approximate the dependences of power con-
sumption kW
W as a function of the quarter number,
expressions of the same type were used as in the study
of average monthly electricity consumption [26, 27].
Forecasting specific power consumption
When planning power consumption for subse-
quent years and for declaring the value of the thirty-mi-
nute maximum power Р30 it is necessary to have an es-
timate of these quantities. Determining the forecast
value of specific electricity consumption for one year
in advance is based on a statistical analysis of changes
in this value over a number of previous years. As fol-
lows from the analysis of existing methods for predict-
ing electrical quantities, one of the most accurate meth-
ods for engineering solutions is forecasting using the
concepts of autocorrelation and partial autocorrelation
functions. For this case, a program has been developed
to predict specific electricity consumption one year in
advance. The use of the developed program for plan-
ning electricity consumption at mining and processing
enterprises will make it possible to correctly distribute
electricity resources among quarters of the next year,
control actual electricity consumption and purposefully
work to reduce it, due to which an appropriate eco-
nomic effect can be obtained [28].
Thus, based on experimental studies using statisti-
cal methods, the authors determined the parameters of
electricity consumption for individual technological
and auxiliary sections of the quarry (overburden, cop-
per ore mining, loading from quartzite dumps, loading
from barite ore dumps, mining of basalt stone, crushing
of basalt stone). A methodology for predicting specific
power consumption for individual technological sec-
tions of the quarry using modern software has also been
developed. To improve the selectivity of relay protec-
tion, the currents of three- and two-phase short circuits
in the 6 kV networks of the quarry are calculated, and
experimental studies of single-phase short circuits in
the networks of the quarry and processing plant are pre-
sented. Based on the research carried out, recommen-
dations were given on the settings of relay protection
against short circuits and on the use of directional pro-
tection against single-phase ground faults. In general,
the proposed recommendations allow for ongoing mon-
itoring of electricity consumption and obtaining an eco-
nomic effect by improving the operation of relay pro-
tection [29].
Promising areas of research
Further analysis of microprocessor relay protec-
tion in various industries using the results obtained in
the work is important and relevant. The developed
methods for calculating and forecasting specific power
consumption of mining enterprises can be further ex-
panded through the use of rank analysis methods of
neural networks. The use and adaptation of mathemati-
cal modeling of technological processes and automated
geographic information systems of the new generation
such as GIS K-MINE® (Krivoy Rog, Ukraine) and
VENTSIM is relevant [30]. Unfinished sentence. And
finally, as a result of the research, an assessment was
made of the operational reliability of power supply to
developing ore mining sites at a mining enterprise to
ensure higher flexibility of the power supply system for
mining operations. At the same time, the reliability and
safety of electrical installations in networks of various
voltages increases when the scope of mining operations
is expanded by both underground and open-pit meth-
ods. The presented research results are important in the
implementation of educational programs for training
mining engineers, especially for distance learning dur-
ing a pandemic. Based on the results of power con-
sumption by divisions of a mining enterprise's quarry,
a good rhythm of operation of electrical equipment is
shown. This makes it possible to use the obtained aver-
age data on power consumption in practice [31, 32].
Conclusion
The obtained values of average power consump-
tion and average specific power consumption (mathe-
matical expectations) allow for ongoing monitoring of
power consumption by quarry divisions. These indica-
tors can be used to monitor the progress of the techno-
logical process and when modernizing the distribution
networks of the quarry.
When monitoring electricity consumption using
electronic meters, it is recommended to compare the
recorded values of specific monthly electricity con-
sumption with the obtained data, such as (kW*h/t):
overburden: Wud.month=1.68; for copper ore min-
ing: Wud.month=0.88; for loading from a quartzite dump:
Wud.month=1.36; for the extraction of basalt stone:
Wud.month=1.54.
Comparing the actual values of specific power
consumption with the recommended ones will make it
possible to prevent excess energy consumption in indi-
vidual technological processes. Due to the operational
control of the operating modes of the quarry's electrical
equipment, it is possible to reduce unproductive energy
consumption and thereby obtain a corresponding eco-
nomic effect.](https://image.slidesharecdn.com/sciencesofeuropeno1472024-240901173407-6df3454c/75/Sciences-of-Europe-No-147-2024-113-2048.jpg)
![114 Sciences of Europe # 147, (2024)
Prospective Research. It was noted that the intro-
duction of automated new generation geographic infor-
mation systems such as GIS K-MINE® (developed by
Scientific-Industrial Enterprise KAI, Ukraine) and
VENTSIM are recommended will increase work
productivity by 50% or more through the use of optimi-
zation tasks, as well as speed up several times the pro-
cesses of coordinating mining technical documentation
with regulatory authorities by transmitting it electroni-
cally.
Acknowledgements
The authors appreciate the value and constructive
respect and recommendations to specialists: R. V.
Klyuev, I. Bosikov. I., as well as contributions from the
departments of “Automated electromechanical systems
in industry and transport”, “Computer systems and
measures”, “Civil safety”, Krivorizky National Univer-
sity, Ukraine, Nazareneko M.V., Nazarenko N.V.,
Khomenko S.A., Baranovsky S.S. and others (TOV sci-
entific and industrial enterprise KAI, Ukraine), DP
“UkrNDPRIPROMTECHNOLOGIES, Ukraine” and
other reviewers of statistics.
References
1. Vibration delivery complexes in ore deposit de-
velopment technologies / [Poturaev V.N., Dyrda V.I.,
Poddubny I.K.( 1989) and others] ed. IN AND. Belo-
brova - K.: Nauk. Dumka, 167 p. (in Ukrainian).
2. Franchuk V.P. Antsiferov A.V.(2000). The use
of the Volterra principle and the complex modulus of
elasticity when taking into account inelastic resistances
in oscillatory systems with significant asymmetric non-
linearity. Science Bulletin of NSAU. No. 2. pp. 30–32.
(in Ukrainian).
3. Basarir H., Bin H., Fourie A., Karrech A. & El-
chalakani M. An adaptive neuro fuzzy inference system
to model the uniaxial compressive strength of cemented
hydraulic backfill // Mining of Mineral Deposits. 2018.
No. 12(2). P. 1–12. https://doi.org/10.15407/min-
ing12.02.001
4. Sotskov V., Dereviahina N., & Malanchuk L.
Analysis of operation parameters of partial backfilling
in the context of selective coal mining // Mining of Min-
eral Deposits. 2019. No. 13(4). P. 129–138. https://
doi.org/10.33271/mining13.04.129
5. Iordanov I., Novikova Yu., Simonova Yu., Ye-
fremov O., Podkopayev Ye., & Korol A. Experimental
characteristics for deformation properties of backfill
mass // Mining of Mineral Deposits. 2020. No. 14(3). P.
119–127. https://doi.org/10.33271/mining14.03.119
6. Naduty V.P., Sukharev V.V., Belyushin
D.V.(2012.). Analysis of the impact interaction of lump
rock mass with the working surfaces of machines and
equipment // Geotechnical mechanics: Sat. scientific tr.
– Dnepropetrovsk: IGTM NAS of Ukraine, Vol. 103. pp.
152 – 159. (in Ukrainian).
7.Mining and processing of uranium ores in
Ukraine. Monograph. Under the general editorship of
A.P. Chernova. –K.: Adef – Ukraine, 2001. –238 p. (in
Ukrainian).
8.Serdyuk A.M. Stus V.P., Lyashenko V.I. (2011).
Ecology and livelihoods of the population in the indus-
trial regions of Ukraine. Dnipropetrovsk. Vidavnitstvo
"Thresholds", 486 p. (in Ukrainian).
9. Radiation Protection and Safety of Radiation
Sources: International Basic Safety Standards. –Vi-
enna: IAEA, 2015. –484 p.
10. Kucha P.M. Justification of the technology and
parameters of underground mining operations during
block leaching of uranium from solid ores / P.M.
Kucha. "Sustainable development of industry and
society": international. science and technology conf.
(May 22-25, 2013). - Kryvyi Rih: DVNZ "KNU". –
2013, vol. 1, 26–27. (in Ukraine).
11. Problems of discovery and preparation of ore
deposits in the deep horizons of the mines of Kryvbas /
M. I. Stupnik, M. B. Fedko, S. V. Pysmennyi and others
12. Mac Carthy J., Nosrati A., Skinner W., Addai-
Mensah J. (2016). Atmospheric acid leaching mecha-
nisms and kinetics and rheological studies of a low
grade saprolitic nickel laterite ore. Hydrometallurgy,
Vol. 160, 26–37.
13. Onika, S.G., Rysbekov, K.B., Aben, E.K., &
Bahmagambetova G.B. (2020). Leaching rate depend-
ence on productive solution temperature. Vestnik
KazNRTU, 142(6), 700-705.
https://doi.org/10.51301/vest.su.2020.v142.i6.122.
14. Dereviahina N., & Malanchuk L. Analysis of
operation parameters of partial backfilling in the con-
text of selective coal mining // Mining of Mineral De-
posits. 2019. No. 13(4). P. 129–138. https://
doi.org/10.33271/mining13.04.129 .
15. Iordanov I., Novikova Yu., Simonova Yu., Ye-
fremov O., Podkopayev Ye., & Korol A. Experimental
characteristics for deformation properties of backfill
mass // Mining of Mineral Deposits. 2020. No. 14(3).
P. 119–127. https://doi.org/10.33271/mining14.03.119
16. Lyashenko, V., Andreev, B., & Dudar, T.
(2022). Substantiation of mining-technical and envi-
ronmental safety of underground mining of complex-
structure ore deposits. Mining of Mineral Deposits,
16(1), 43-51. https://doi.org/10.33271/min-
ing16.01.043.
17. Reiter K., Heidbach O. 3—D geomechani-
cal—numerical model of the contemporary crustal
stress state in the Alberta Basin (Canada) // Solid Earth.
2014. No. 5. Pp. 1123—1149.
18. Aben, E., Markenbayev, Zh., Khairullaev, N.,
Myrzakhmetov, S., & Aben, Kh. (2019). Study of
change in the leaching solution activity after treatment
with a cavitator. Mining of Mineral Deposits, 13(4),
114-120. https://doi.org/10.33271/mining13.04.114
19. Malanchuk, Z., Korniienko, V., Malanchuk,
Ye., Soroka, V., & Vasylchuk, O. (2018). Modeling the
formation of high metal concentration zones in man-
made deposits. Mining of Mineral Deposits, 12(2), 76-
84. https://doi.org/10.15407/mining12.02.076
20. Stupnik, M., Kalinichenko, O., Kalinichenko,
V., Pysmennyi, S., & Morhun, O. (2018). Choice and
substantiation of stable crown shapes in deep-level iron
ore mining. Mining of Mineral Deposits, 12(4), 56-62.
https://doi.org/10.15407/mining12.04.056](https://image.slidesharecdn.com/sciencesofeuropeno1472024-240901173407-6df3454c/75/Sciences-of-Europe-No-147-2024-114-2048.jpg)

![116 Sciences of Europe # 147, (2024)
THE TECHNOLOGY OF PLASMA-ARC ATOMIZATION OF CURRENT-CARRYING SOLID
WIRES FOR TITANIUM POWDER PRODUCTION
Strohonov D.,
Tereshchenko O.,
Burlachenko O.,
Korzhyk V.,
Ganushchak O.,
Konoreva O.
E.O. Paton Electric Welding Institute, National Academy of Sciences of Ukraine
Kyiv, Ukraine
DOI: 10.5281/zenodo.13382721
ABSTRACT
Currently, due to the rapid development of additive manufacturing, there is an urgent need to produce high-
quality spherical granules and powders of titanium and titanium alloys with special properties, namely, a high
degree of sphericity, the absence of external and internal defects, a given particle size distribution, etc. The possi-
bility of obtaining high-quality spherical powders from technical titanium using plasma-arc spraying technology
of CP-Ti (Grade 2) current-carrying wire with a diameter of 1.6 mm has been experimentally confirmed.
Keywords: additive technologies, plasma-arc atomization, spheroidization, granules, powders.
The intensive development of additive technolo-
gies (AT) for printing titanium alloy parts by DED (Di-
rect Energy Deposition) and PBF (Powder Bed Fusion)
methods requires the creation of special materials in the
form of spherical powders with a specified particle size
composition (mostly less than 53 μm) and strict re-
quirements for the shape of particles (coefficient of
sphericity) with the presence of a minimum number of
defective particles [1, 2]. One of the most promising
methods of obtaining such powders is the plasma-arc
atomization of current-carrying solid titanium wires
with diameters of 1.0 to 3.2 mm [3, 4].
At this time, there are not enough investigations
on the effect of the parameters of plasma-arc atomiza-
tion mode on particle size distribution, chemical com-
position and technological properties of the powder,
etc. Thus, the work aims to study the influence of the
parameters of the plasma-arc atomization process of
current-carrying titanium wire and to confirm the pos-
sibility of obtaining high-quality spherical powders
during its atomization.
Figure 1 shows a schematic representation of the
plasma-arc atomization process of the current-carrying
wire. An essence of the process of plasma-arc atomiza-
tion process lies in melting of the tip of the current-car-
rying solid wire (anode) which is entered in a zone of
high-speed plasma jet and further fragmentation of the
melt stripping from a wire end. An arc burns between a
non-consumable tungsten cathode and a current-carry-
ing wire (anode) being fed through a plasma torch noz-
zle. Working (plasma-forming) gas entering an operat-
ing chamber is heated with an electric arc and comes
out from the nozzle in form of a plasma jet. An open
section of a discharge out of the plasma-forming nozzle
is blown concentrically by a gas flow coming out of a
circular gap between the plasma torch nozzles. Among
the peculiarities of this method is the fact that melting
and jet atomization of the wire material is carried out
by argon plasma, meanwhile melt fragmentation and
acceleration of dispersed particles is intensified by a jet
of cold concurrent gas. This provides minimum losses
on evaporation of wire material (up to 2 %), obtaining
the optimum fraction composition of the disperse
phase, reaching a near-sonic velocity by the particles of
atomization material, etc [5, 6].](https://image.slidesharecdn.com/sciencesofeuropeno1472024-240901173407-6df3454c/75/Sciences-of-Europe-No-147-2024-116-2048.jpg)
![Sciences of Europe # 147, (2024) 117
а) b)
Fig. 1. Schematic representation (a) [7] and visualization (b) of the plasma-arc atomization process for the
production of Ti powders
The technological experiments were carried out
using a plasma-arc atomization unit PLAZER-50 [8],
which was modified for the realization of the process of
atomization of titanium wire and powder production
(fig. 1(b)).
Table 1
Technical parameters of plasma-arc atomization unit PLAZER-50
Energy consumption, kVA no more 50
The voltage of the three-phase alternating current
supply network with a frequency of 50 Hz, V
380
No-load voltage, V 160
Operating current adjustment range, A 100 – 400
Operating voltage adjustment range, V 60 – 125
The longest duration of inclusion, PV% 100
Argon consumption at a pressure of 0.6 MPa, nm3
/h
8
Wire feed speed, m/min 5 – 15
Cooling of the plasmatron water
The resource of the plasmatron nozzle and cathode,
hours of machine time, no less 100
Overall dimensions, mm:
- power sources
- control cabinets
501 х 478 х 503
605 х 605 х1600
Indicated equipment was used for the examination
of the particle size distribution in the atomization of ti-
tanium wire (anode) CP-Ti (Grade 2) of 1.6 mm diam-
eter (table 2).
Table 2.
Chemical composition of titanium wire CP-Ti (Grade 2)
Element, wt. %
Ti Fe O C N H
≥ 98.9 ≤ 0.30 ≤ 0.25 ≤ 0.080 ≤ 0.030 ≤ 0.015
According to earlier obtained practical data, an op-
timum mode was selected using a criterion of visual as-
sessment of the shape of the plasma jet at its reaching a
minimum opening angle and process stability. It was
used for a corresponding change of the parameters of
mode to determine the effect of each of them on the
change of the particle granulometric composition. High
grade argon I1 according to ISO 14175–2008“Welding](https://image.slidesharecdn.com/sciencesofeuropeno1472024-240901173407-6df3454c/75/Sciences-of-Europe-No-147-2024-117-2048.jpg)
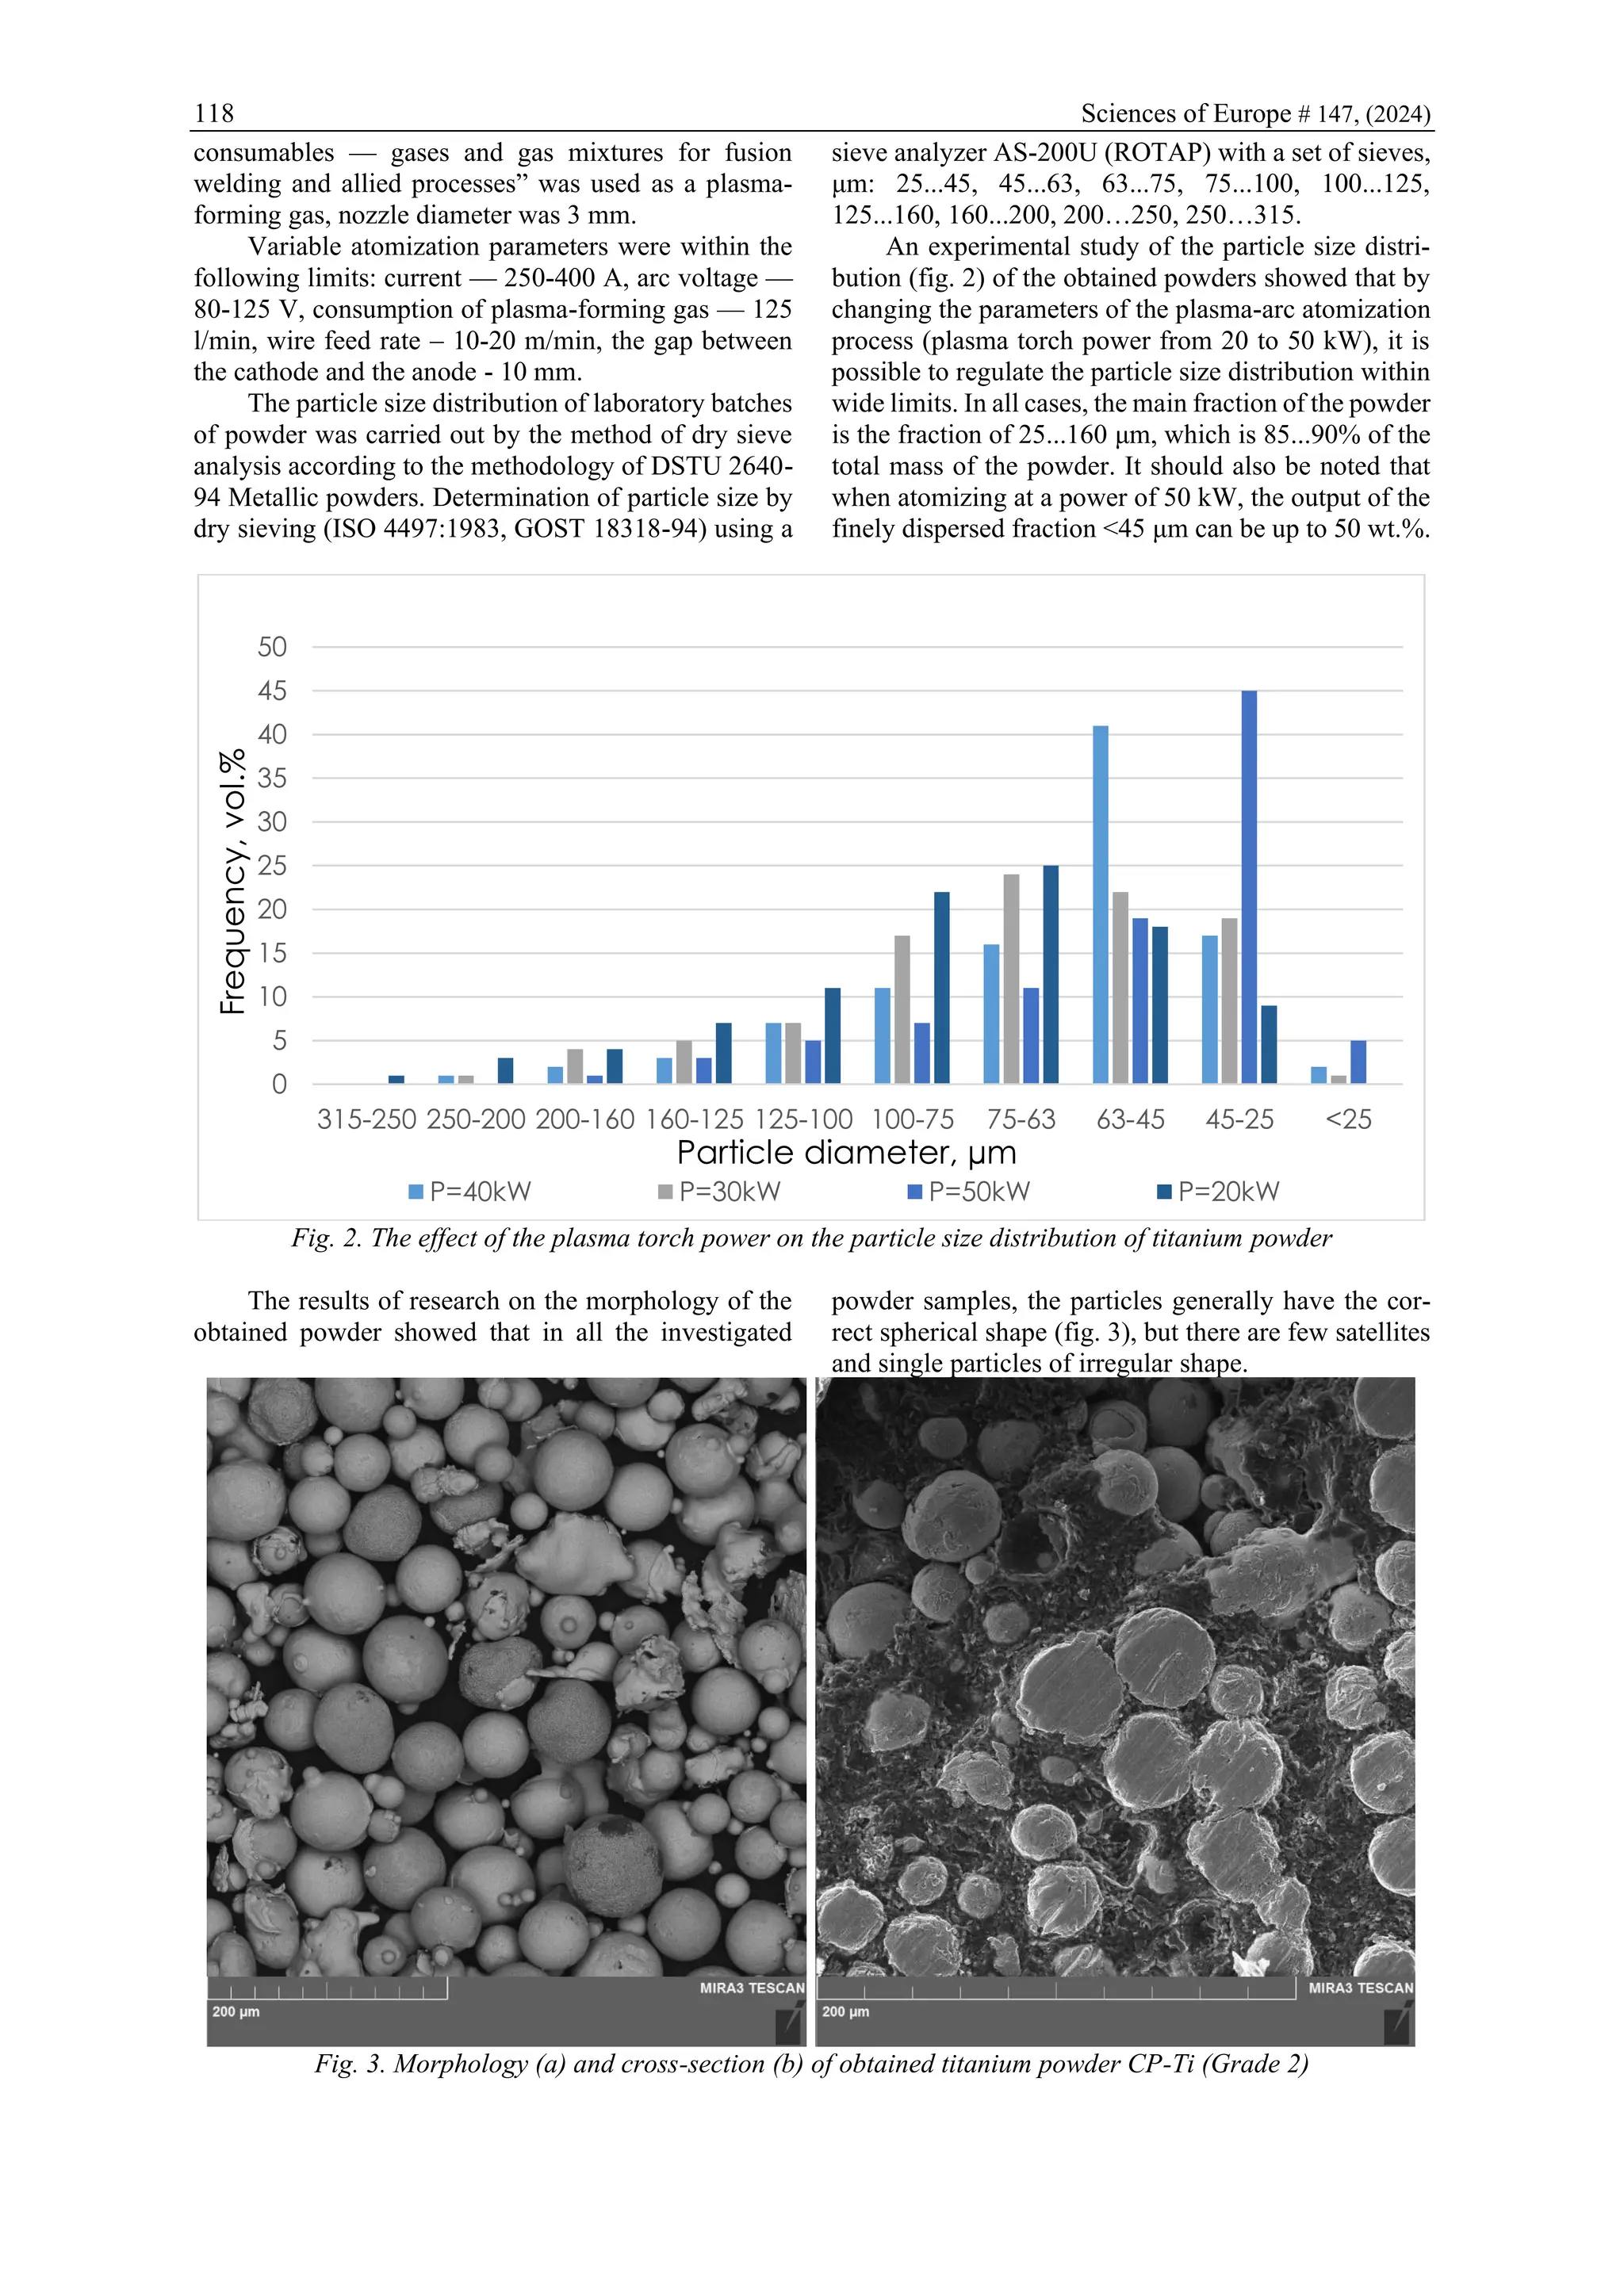


The document details the publication 'Sciences of Europe', a journal covering various scientific fields, published in multiple languages and emphasizing open access. It includes articles on agricultural sciences, economic sciences, medical sciences, and more, with a focus on research conducted in Azerbaijan on soil degradation affecting agricultural productivity. The main findings highlight the importance of appropriate agricultural practices and fertilization to enhance soil fertility and sustain agricultural development in the Lankaran zone.


