Download to read offline

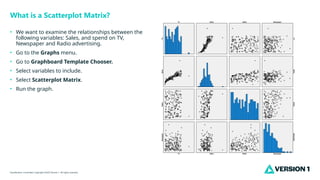

The document explains how to create a scatterplot matrix to examine the relationships between sales and spending on TV, newspaper, and radio advertising. It provides step-by-step instructions to access the graph menu, choose a graph template, select variables, and run the scatterplot matrix. The content is classified as controlled and copyrighted.


