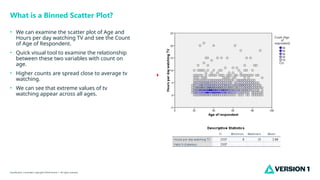
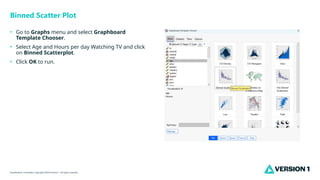
The document explains the concept of a binned scatter plot, which visually illustrates the relationship between age and TV watching hours while highlighting respondent counts. It provides instructions on how to create a binned scatter plot using a specific software tool. Additionally, it emphasizes the confidentiality of the presentation's content.