Download to read offline


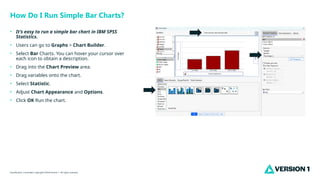

The document provides a brief guide on running simple bar charts using IBM SPSS Statistics. It outlines steps including accessing the chart builder, selecting bar charts, and adjusting options before running the chart. Additional information can be found at www.spssanalyticspartner.com.


