The executive summary highlights that:
1) Scaleups are critical drivers of economic growth and job creation in the UK.
2) Progress has been made in identifying scaleups and supporting their growth nationally, but disparities remain locally.
3) Scaleup leaders continue to need most help with accessing talent, developing leadership skills, and reaching new markets, both domestic and international.


![33 SCALEUP INSTITUTE | www.scaleupinstitute.org.uk | @scaleupinst | #scaleup
ATTRACTING TALENT – VIEWS FROM OUR SCALEUP LEADERS
“The main issue I have is getting the right talent. We have a shortage of the talent I
need as there is an excess of unskilled labour in the market and getting skilled labour
from overseas is highly complicated.” (South West)
“Talent is key, so with Brexit it is important to make sure that the right talent is
welcome in the UK and scaleup businesses should be able to keep the talent they have.”
(Greater London)
“Access to talent, including visa policies, to enable easy access to talented individuals
not currently based in the UK.” (Greater Manchester)
“The government must make it easier to retain foreign post-graduates in the UK.
Research positions do not necessarily command top salaries which results in individuals
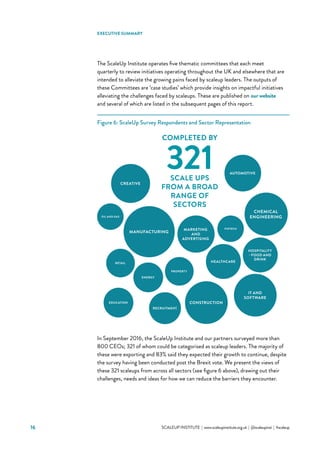
achieving less points than are required for their visas to be approved for renewal. This
leads to leakage of highly trained individuals leaving the UK after the PhDs etc.”
(Scotland)
Apprenticeships are seen as useful to scaleups, but there is a sentiment that more
work could be done in improving availability and accessibility as a viable career path
for students
“Be more open to apprenticeship schemes and [thereby help] provide the correct
training to develop new, young ambitious talent.” (North East)
Making it easier to hire the right people with the requisite talent and skills
“The creation of a flexible talent pool where companies could quickly and cheaply
locate temporary (freelance) talent, with a trusted review system to ensure quality.”
(South West)
“Make it easier to connect and hire skilled workers that have been a part of scaleups,
in the UK, EU and abroad. Consider the creation of free databases to access active
candidates.” (Greater London)
“Tax breaks for hiring graduates because they don’t yet have the right skills – eg no
National Insurance if you hire people for the first three to five years they work for you
post university.” (Greater London)
CHAPTER 2](https://image.slidesharecdn.com/5d522121-341f-48d6-9a8a-385baf307f9b-170206105658/85/Scaleup_full_report_ReSET_021216_Final2-2-33-320.jpg)


![58 SCALEUP INSTITUTE | www.scaleupinstitute.org.uk | @scaleupinst | #scaleup
procurement, will do more to secure the UK’s long-term competitive advantage.
Finance challenges are a complement to the context of the broader issues that a
fast-growing company faces in its journey for achieving scale.
ON ACCESSING FINANCE – VIEWS FROM OUR SCALEUP LEADERS
Need for geographically balanced risk capital
“It would be better to be more balanced geographically … with this in mind a greater
steer can be placed on encouraging innovation funding into areas with stronger needs
for innovation and growth to help rebalance the UK economy. This may be possible to
address in the remit of funding agencies and application review processes, this action
could do a lot to rebalance innovation and growth across the UK.” (South Yorkshire)
Desire for continued support in taxation options
“Keep EIS funding incentive going.” (Greater London)
“Continuation of RD tax credits – RD tax credits help firms focus time and
efforts on innovation and IP generation….[it] is a helpful mechanism that encourages
innovation particularly in labour heavy (not capital equipment heavy) industries.
Removal of this would damage investment in innovation especially in the digital, high
skilled professional and service sectors….” (South Yorkshire)
Ease of flexible finance access and support in identifying options
“Make it easier to find out what government funding support is available.”
(Greater London)
“Help with Finance, access to FD skills.” (Warrington)
CHAPTER 5](https://image.slidesharecdn.com/5d522121-341f-48d6-9a8a-385baf307f9b-170206105658/85/Scaleup_full_report_ReSET_021216_Final2-2-58-320.jpg)