
More Related Content
Similar to Sbu Missed Demand Report(1)
Similar to Sbu Missed Demand Report(1) (20)
Sbu Missed Demand Report(1)
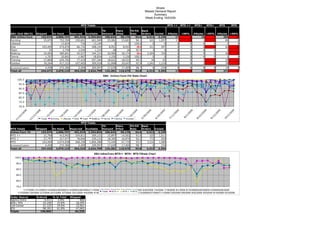
- 1. Shoes Missed Demand Report Summary Week Ending 10/03/09 MTS Totals MTS ++ MTS ++ MTS+ MTS+ MTS MTS Ttl Pairs Ttl Fill Back SBU (Sub SBU'S) Shipped On Hand Reserved Available Demand Filled Rate Orders Cncled #Styles <98% #Styles <95% #Styles <90% SBU Inline/Core 152,974 2,806,757 451,915 2,354,842 106,642 99,170 93.0 4,313 3,159 17 8 19 7 259 31 Running 33,670 752,550 150,601 601,949 25,081 23,603 94.1 421 1,057 17 8 1 1 80 0 Lifestyle 5 13,824 720 13,104 5 5 100.0 0 0 0 0 0 0 1 0 Kids 103,409 574,876 66,732 508,144 8,951 8,043 89.9 411 497 0 0 8 3 60 18 Team 25 2,759 1,544 1,215 28 26 92.9 2 0 0 0 0 0 2 1 Walking 24,004 389,841 45,527 344,314 20,908 18,174 86.9 2,404 330 0 0 0 0 48 8 Tennis 1,767 20,801 1,967 18,834 1,150 1,150 100.0 0 0 0 0 6 0 2 0 Training 37,869 634,783 77,419 557,364 18,621 18,522 99.5 34 65 0 0 2 1 28 1 Outdoor 39,264 417,323 107,405 309,918 31,898 29,647 92.9 1,041 1,210 0 0 2 2 38 3 Exclusive/Custom 4,458 272,366 2,409 269,957 17,639 17,405 98.7 0 234 0 0 0 0 14 0 Total all 244,471 3,079,123 454,324 2,624,799 124,281 116,575 93.8 4,313 3,393 17 8 19 7 273 31 SBU Inline/Core Fill Rate Chart 100.0 95.0 90.0 85.0 80.0 75.0 70.0 09 9 9 9 9 9 9 9 9 9 09 09 09 9 08 08 00 00 00 00 00 00 00 00 00 00 20 20 20 20 20 20 /2 /2 /2 /2 /2 /2 /2 /2 /2 /2 5/ 7/ 9/ 1/ 3/ 2/ 11 24 14 28 18 30 20 22 12 /3 1/ 3/ 5/ 8/ /2 /1 10 Totals Running Lifestyle Kids Team Walking Tennis Training Outdoor 2/ 3/ 7/ 8/ 1/ 4/ 5/ 6/ 9/ 11 12 MTS Totals Ttl Pairs Ttl Fill Back MTS Totals Shipped On Hand Reserved Available Demand Filled Rate Orders Cncled Inline/Core Ttl 152,974 2,806,757 451,915 2,354,842 106,642 99,170 93.0 4,313 3,159 MTS ++ 21,768 413,942 104,811 309,131 15,897 14,561 91.6 325 1,011 MTS + 27,797 317,977 78,846 239,131 18,305 16,874 92.2 772 659 MTS 103,409 2,074,838 268,258 1,806,580 72,440 67,735 93.5 3,216 1,489 Exclusive/Custom 4,458 272,366 2,409 269,957 17,639 17,405 98.7 0 234 Total all 157,432 3,079,123 454,324 2,624,799 124,281 116,575 93.8 4,313 3,393 SBU Inline/Core MTS++ MTS+ MTS Fillrate Chart 100.0 95.0 90.0 85.0 80.0 75.0 1/17/2008 1/31/2009 2/14/2009 2/28/2009 3/14/2009 3/28/2009 4/11/2009 4/25/2009 5/9/2009 5/24/2009 6/6/2009 6/20/2009 7/4/2009 7/18/2009 8/1/2009 8/15/2009 8/29/2009 9/12/2009 9/26/2009 Totals MTS ++ MTS + MTS 1/10/2009 1/24/2009 2/7/2009 2/21/2009 3/7/2009 3/21/2009 4/4/2009 4/18/2009 5/2/2009 5/17/2009 5/30/2009 6/13/2009 6/27/2009 7/11/2009 7/25/2009 8/8/3009 8/22/2009 9/5/2009 9/19/2009 10/3/2009 Order Source Ordered % to Total Shipped Agency Entry 4,411 2.8% 800 B2B / SFA 25,148 15.8% 18,295 Call Center 31,125 19.6% 15,561 EDI 98,181 61.8% 47,683 Totals 158,865 82,339
- 2. New Balance Athletic Shoes Missed Demand Report MTO Week Ending 10/03/09 MTO Totals MTO MTO Ttl Pairs Ttl Fill Back SBU (Sub SBU'S) Shipped On Hand Reserved Available Demand Filled Rate Orders Cncled #Styles <90% 210,652 901,953 327,855 574,098 9,345 6,480 69.1 2,722 161 989 63 Running 77,745 281,619 108,859 172,760 1,112 957 86.0 145 11 372 12 Lifestyle 37,836 143,192 59,634 83,558 2,536 2,197 86.3 333 14 111 12 Image Lifestyle 171 26,985 3,227 23,758 51 29 56.9 22 0 5 3 Kids 6,141 89,361 39,510 49,851 2,759 829 29.7 1,824 115 176 25 Team 2,088 117,671 11,540 106,131 1,071 1,034 96.5 37 0 28 4 Walking 12,676 36,792 7,313 29,479 1,070 823 76.9 231 16 14 0 Tennis 288 17,855 3,121 14,734 183 158 86.3 25 0 146 2 Training 46,912 92,615 37,457 55,158 246 194 78.9 50 2 97 4 Outdoor 26,795 95,863 57,194 38,669 317 259 81.7 55 3 40 1 Total all 210,652 901,953 327,855 574,098 9,345 6,480 69.1 2,722 161 989 63
- 3. New Balance Athletic Shoes Missed Demand Report Running MTS Week Ending 10/03/09 Totals EDI Call Center Intro Phase Out Style Date Date Shipped On Hand Reserved Available Ttl Demand Pairs Filled Fill Rate Ttl BackordersOrdered Cncl Rate Cncled Ordered Cncl Rate Cncled 33,670 752,550 150,601 601,949 25,081 23,603 94.1 421 4,888 20.9 1,022 387 9.0 35 1,057 SDS606MB 1/1/2009 11/28/2009 0 504 0 504 0 0 0.0 0 0 0.0 0 0 0 0 MR769SB 1/1/2009 11/28/2009 6,665 61,830 21,464 40,366 1,752 1,750 99.9 1 893 0.0 0 23 4.3 1 MR769SG 4/1/2009 11/28/2009 66 9,002 1,996 7,006 49 49 100.0 0 0 0.0 0 1 0 0 MR769ST 1/1/2009 11/28/2009 98 43,874 20,805 23,069 225 225 100.0 0 0 0.0 0 3 0 0 WR769KM 4/1/2009 11/28/2009 167 3,102 552 2,550 148 142 95.9 4 2 0.0 0 8 25 2 WR769KMW 7/1/2009 11/28/2009 0 216 0 216 0 0 0.0 0 0 0.0 0 0 0 0 WR769SB 1/1/2009 11/28/2009 2,641 21,026 6,363 14,663 1,169 1,014 86.7 88 228 26.3 60 32 21.9 7 WR769ST 1/1/2009 11/28/2009 200 34,446 15,508 18,938 1,152 1,152 100.0 0 0 0.0 0 2 0 0 MR904LW 3/1/2009 11/28/2009 74 7,919 3,244 4,675 62 62 100.0 0 13 0.0 0 0 0 0 MR904TR 4/1/2009 11/28/2009 11 3,550 1,343 2,207 13 13 100.0 0 0 0.0 0 0 0 0 MR904WY 3/1/2009 11/28/2009 0 1,074 84 990 0 0 0.0 0 0 0.0 0 0 0 0 WR904LW 3/1/2009 11/28/2009 37 8,804 999 7,805 37 37 100.0 0 21 0.0 0 0 0 0 WR904TR 4/1/2009 11/28/2009 7 4,410 780 3,630 7 7 100.0 0 0 0.0 0 0 0 0 MR1063CU 1/1/2009 11/28/2009 211 33,010 7,002 26,008 127 127 100.0 0 18 0.0 0 2 0 0 MR1063WN 1/1/2009 11/28/2009 875 4,716 2,648 2,068 389 276 71.0 98 1 0.0 0 22 68.2 15 MR1063WR 4/1/2009 11/28/2009 113 6,820 2,559 4,261 94 92 97.9 2 0 0.0 0 2 0 0 WR1063CU 1/1/2009 11/28/2009 98 37,814 5,624 32,190 62 62 100.0 0 0 0.0 0 1 0 0 WR1063TB 4/1/2009 11/28/2009 57 5,169 1,885 3,284 47 46 97.9 1 0 0.0 0 2 0 0 WR1063WB 1/1/2009 11/28/2009 327 8,732 2,235 6,497 357 330 92.4 25 8 0.0 0 6 33 2 MR1225BR 7/1/2009 5/28/2010 147 5,968 284 5,684 152 151 99.3 1 0 0.0 0 4 0 0 MR1225ST 7/1/2009 5/28/2010 871 8,118 1,148 6,970 700 698 99.7 0 20 10.0 2 10 0 0 WR1225ST 7/1/2009 5/28/2010 764 11,951 330 11,621 698 698 100.0 0 19 0.0 0 9 0 0 WR1225SY 7/1/2009 5/28/2010 98 8,447 204 8,243 108 108 100.0 0 1 0.0 0 1 0 0 MR726GY 4/1/2009 2/28/2010 0 9 0 9 0 0 0.0 0 0 0.0 0 0 0 0 MR726RW 4/1/2009 2/28/2010 0 10 0 10 0 0 0.0 0 0 0.0 0 0 0 0 WR726BP 4/1/2009 2/28/2010 0 9 0 9 0 0 0.0 0 0 0.0 0 0 0 0 WR726SG 4/1/2009 2/28/2010 0 9 0 9 0 0 0.0 0 0 0.0 0 0 0 0 WR726WY 4/1/2009 2/28/2010 0 10 0 10 0 0 0.0 0 0 0.0 0 0 0 0 MR738WB 7/1/2009 5/28/2010 93 8,236 703 7,533 94 94 100.0 0 0 0.0 0 0 0 0 WR738GP 7/1/2009 5/28/2010 61 17,218 143 17,075 42 42 100.0 0 0 0.0 0 0 0 0 MR749GO 1/1/2009 2/28/2010 47 6,036 210 5,826 68 49 72.1 18 0 0.0 0 1 100 1 MR749GY 7/1/2009 2/28/2010 303 13,367 2,353 11,014 135 134 99.3 1 1 0.0 0 3 0 0 MR749ST 1/1/2009 11/28/2009 282 5,432 3,531 1,901 1,075 242 22.5 53 900 86.7 780 3 0 0 WR749BR 7/1/2009 2/28/2010 65 4,390 862 3,528 60 56 93.3 3 1 0.0 0 3 33 1 WR749GR 1/1/2009 10/28/2009 145 3,478 679 2,799 75 74 98.7 1 0 0.0 0 5 0 0 WR749ST 1/1/2009 11/28/2009 633 21,670 4,045 17,625 632 629 99.5 3 456 0.0 0 1 0 0 MR758CU 7/1/2009 5/28/2010 918 11,487 635 10,852 847 817 96.5 10 160 12.5 20 12 0 0 MR758SB 7/1/2009 5/28/2010 1,368 18,849 2,166 16,683 215 215 100.0 0 0 0.0 0 0 0 0 MR758SR 7/1/2009 5/28/2010 151 10,321 1,006 9,315 116 116 100.0 0 1 0.0 0 3 0 0 WR758CU 7/1/2009 5/28/2010 1,354 18,679 1,266 17,413 741 741 100.0 0 58 0.0 0 13 0 0 WR758GR 7/1/2009 5/28/2010 195 15,070 247 14,823 126 126 100.0 0 34 0.0 0 6 0 0 MR850ST 5/1/2009 1/28/2011 952 14,831 1,683 13,148 807 795 98.5 12 16 0.0 0 26 0 0 WR850ST 5/1/2009 1/28/2011 973 11,929 1,855 10,074 823 801 97.3 18 25 12.0 3 26 3.8 1 MR883CU 2/1/2009 10/28/2010 418 13,320 522 12,798 331 331 100.0 0 9 0.0 0 4 0 0 WR883CU 2/1/2009 10/28/2010 698 9,942 485 9,457 746 736 98.7 9 13 7.7 1 12 0 0 MR993BK 12/1/2008 9/28/2011 650 7,319 1,975 5,344 882 858 97.3 13 207 4.8 10 7 14 1 MR993GL 12/1/2008 9/28/2011 4,104 50,144 7,260 42,884 4,104 3,957 96.4 34 1,212 9.2 111 27 7.4 2 MR993NV 4/1/2009 9/28/2011 446 7,395 1,439 5,956 323 316 97.8 5 123 1.6 2 2 0 0 WR993BK 12/1/2008 9/28/2011 225 5,191 224 4,967 252 251 99.6 1 2 0.0 0 11 0 0 #REF! WR993BW 3/1/2009 9/28/2011 257 6,367 114 6,253 170 170 100.0 0 2 0.0 0 2 0 0 WR993GL 12/1/2008 9/28/2011 1,077 33,694 2,972 30,722 985 985 100.0 0 146 0.0 0 13 0 0 WR993KM 8/15/2009 5/28/2010 424 9,858 829 9,029 154 154 100.0 0 2 0.0 0 5 0 0 WR993NV 4/1/2009 9/28/2011 58 11,291 800 10,491 59 59 100.0 0 0 0.0 0 3 0 0 MR1123MC 11/1/2007 5/28/2011 958 7,325 676 6,649 922 914 99.1 8 30 0.0 0 13 0 0 Page 3
- 4. New Balance Athletic Shoes Missed Demand Report Running MTS Week Ending 10/03/09 Totals EDI Call Center Intro Phase Out Style Date Date Shipped On Hand Reserved Available Ttl Demand Pairs Filled Fill Rate Ttl BackordersOrdered Cncl Rate Cncled Ordered Cncl Rate Cncled WR1123MC 11/1/2007 5/28/2011 1,439 7,758 1,105 6,653 1,503 1,485 98.8 7 41 24.4 10 32 3.1 1 MR1011MC 1/1/2008 11/28/2009 518 24,153 6,351 17,802 462 451 97.6 2 150 6.0 9 9 0 0 WR1011MC 1/1/2008 11/28/2009 752 23,656 4,191 19,465 477 463 97.1 1 57 22.8 13 3 0 0 MR817MC 5/1/2007 12/28/2009 176 5,390 1,854 3,536 60 60 100.0 0 10 0.0 0 0 0 0 WR817MC 5/1/2007 12/28/2009 59 3,231 818 2,413 47 46 97.9 0 4 25.0 1 0 0 0 WR827SP 1/1/2009 7/1/2010 0 120 0 120 0 0 0.0 0 0 0.0 0 0 0 0 M587NV 7/30/1999 7/4/2020 195 9,663 385 9,278 223 220 98.7 2 1 0.0 0 3 33.3 1 W587WB 9/16/1999 7/4/2020 149 5,191 160 5,031 177 177 100.0 0 3 0.0 0 11 0 0 Page 4
- 5. Running_Sizes Style Width Total 05 055 06 065 07 075 08 085 09 095 MR1063WN D 54 4 1 MR1063WN 2E 17 1 1 MR1063WN 4E 42 1 3 5 MR749ST D 744 9 59 104 107 MR749ST 2E 4 MR749ST 4E 85 1 11 WR1063WB 2A 5 1 1 WR1063WB B 11 6 WR1063WB D 11 1 1 7 WR769SB 2A 5 WR769SB B 10 2 8 WR769SB D 138 1 10 23 27 48 16 2 WR769SB 2E 2 1 Page 5
- 6. Running_Sizes 10 105 11 115 12 125 13 14 15 1 1 21 8 12 5 1 7 1 2 1 1 1 2 7 6 5 4 4 3 3 1 118 102 111 75 48 11 4 12 13 13 12 12 11 3 5 2 3 1 1 11 1 Page 6
- 7. New Balance Athletic Shoes Missed Demand Report Exclusives Custom Totals MTS EDI Call Center Intro Phase Out Week Ending 10/03/09 Style Date Date Shipped On Hand Reserved AvailableTtl DemandPairs Filled Fill Rate Ttl Backorders Ordered Cncl Rate Cncled Ordered Cncl Rate Cncled 4,458 272,366 2,409 269,957 17,639 17,405 98.7 0 17,639 1.3 234 0 #DIV/0! 0 234 CW680PK 8/15/2003 8/15/2021 0 7,091 185 6,906 0 0 0.0 0 0 0.0 0 0 0.0 0 CM580GR 4/24/1997 12/25/2020 0 2,312 47 2,265 0 0 0.0 0 0 0.0 0 0 0.0 0 CW680GR 5/29/1998 12/25/2020 0 1,953 97 1,856 0 0 0.0 0 0 0.0 0 0 0.0 0 CW470BS 5/15/2002 5/1/2011 310 40,968 0 40,968 865 865 100.0 0 865 0.0 0 0 0.0 0 CW470SP 11/1/2004 11/1/2020 262 37,762 12 37,750 716 716 100.0 0 716 0.0 0 0 0.0 0 CM475BK 6/1/2003 6/1/2020 717 37,873 314 37,559 2,223 2,223 100.0 0 2,223 0.0 0 0 0.0 0 CM475NW 11/1/2004 11/1/2020 475 27,641 183 27,458 1,423 1,423 100.0 0 1,423 0.0 0 0 0.0 0 WX600WT 6/2/2003 12/28/2010 958 45,815 1,375 44,440 2,957 2,957 100.0 0 2,957 0.0 0 0 0.0 0 MW642GM 7/1/2005 12/28/2010 303 25,335 24 25,311 1,129 1,129 100.0 0 1,129 0.0 0 0 0.0 0 MX610AW 12/1/2006 3/1/2010 0 38 0 38 0 0 0.0 0 0 0.0 0 0 0.0 0 MX610WN 5/1/2006 1/1/2020 0 7,497 12 7,485 3,032 2,798 92.3 0 3,032 7.7 234 0 0.0 0 WX610WP 5/1/2006 12/28/2009 0 13 0 13 0 0 0.0 0 0 0.0 0 0 0.0 0 WX610WT 5/1/2006 1/1/2020 0 5,631 1 5,630 982 982 100.0 0 982 0.0 0 0 0.0 0 MX600WN 6/1/2003 12/28/2010 1,433 32,437 159 32,278 4,312 4,312 100.0 0 4,312 0.0 0 0 0.0 0
- 8. Style Width Total <> 05 055 06 065 07 075 08 085 09 095 10 105 11 115 12
- 9. 125 13 14 15 16
- 10. New Balance Athletic Shoes Missed Demand Report Lifestyle MTS Phase Out Week Ending 10/03/09 Totals EDI Style SBU Sub SBU Sub Division Supplier Intro Date Date Shipped On Hand Reserved Available Ttl Demand Pairs Filled Ttl Fill Rate Backorders Ordered 5 13,824 720 13,104 5 5 100.0 0 0 WAM442PR Lifestyle Lifestyle Inline (A) 442 Komen Pink 2/1/2009 Ribbon Mule 1/28/2010 5 13,824 720 13,104 5 5 100 0 0 Page 10
- 11. New Balance Athletic Shoes Missed Demand Report Lifestyle MTS EDI Call Center Week Ending 10/03/09 Cncl Rate Cncled Ordered Cncl Rate Cncled #DIV/0! 0 0 #DIV/0! 0 0 0 0 0 0 0 Page 11
- 12. Lifestyle_Sizes Style Width Total Page 12
- 13. New Balance Athletic Shoes Missed Demand Report Week Ending Phase Out Totals 10/03/09 EDI Call Center Style Intro Date Date Shipped On Hand ReservedAvailableTtl DemandPairs Filled Fill Rate Ttl Backorders Ordered Cncl Rate Cncled Ordered Cncl Rate Cncled 16,370 574,876 66,732 508,144 8,951 8,043 89.9 411 4,190 11.6 487 82 12.2 10 497 KJ552NYG 4/1/2009 1/28/2011 45 18247 128 18119 9 9 100 0 0 0 0 0 0 0 KJ552NYP 4/1/2009 1/28/2011 99 16926 276 16650 37 37 100 0 0 0 0 0 0 0 KG630BYI 1/1/2009 10/28/2009 12 461 319 142 7 0 0 7 0 0 0 0 0 0 KG630NRP 1/1/2009 10/28/2009 77 339 281 58 1 1 100 0 0 0 0 0 0 0 KG630PKI 1/1/2009 10/28/2009 71 5661 520 5141 61 61 100 0 0 0 0 0 0 0 KG630WBP 1/1/2009 10/28/2009 62 393 188 205 14 4 28.6 10 0 0 0 0 0 0 KJ630NRG 1/1/2009 10/28/2009 23 1016 286 730 13 13 100 0 0 0 0 0 0 0 KJ630NRI 1/1/2009 10/28/2009 29 700 232 468 23 23 100 0 0 0 0 0 0 0 KJ630NRP 1/1/2009 10/28/2009 381 1960 670 1290 28 25 89.3 3 0 0 0 0 0 0 KJ630WBG 1/1/2009 10/28/2009 34 395 154 241 17 14 82.4 3 0 0 0 0 0 0 KJ630WBP 1/1/2009 10/28/2009 63 420 150 270 44 41 93.2 3 0 0 0 0 0 0 KJ537GYG 6/1/2009 3/28/2010 120 1291 237 1054 124 78 62.9 6 98 40.8 40 0 0 0 KJ537GYI 6/1/2009 3/28/2010 15 3369 217 3152 62 62 100 0 0 0 0 0 0 0 KJ537GYP 6/1/2009 3/28/2010 172 8109 393 7716 112 112 100 0 90 0 0 1 0 0 KJ537WPG 6/1/2009 3/28/2010 78 5055 728 4327 54 54 100 0 50 0 0 0 0 0 KJ537WPI 6/1/2009 3/28/2010 54 509 71 438 56 55 98.2 0 0 0 0 1 100 1 KJ537WPP 6/1/2009 3/28/2010 294 3831 1182 2649 232 194 83.6 0 193 19.7 38 0 0 0 KJ571BRG 1/1/2009 10/28/2009 1008 1816 1778 38 207 0 0 5 202 100 202 0 0 0 KJ571BRP 1/1/2009 10/28/2009 13 1397 55 1342 24 13 54.2 11 0 0 0 0 0 0 KJ571GRG 1/1/2009 10/28/2009 104 3670 503 3167 78 78 100 0 71 0 0 1 0 0 KJ571GRP 1/1/2009 10/28/2009 13 5075 732 4343 19 15 78.9 4 1 0 0 0 0 0 KV571BBG 1/1/2009 10/28/2009 88 10509 1092 9417 20 20 100 0 0 0 0 0 0 0 KV571BBP 1/1/2009 10/28/2009 265 6823 2346 4477 18 16 88.9 2 0 0 0 0 0 0 KJ686PLG 7/1/2009 4/28/2010 475 4732 632 4100 195 142 72.8 12 124 33.1 41 0 0 0 KJ686PLP 7/1/2009 4/28/2010 530 5943 2632 3311 66 43 65.2 23 0 0 0 0 0 0 KJ686SBG 7/1/2009 4/28/2010 1072 9453 1188 8265 517 492 95.2 4 422 5 21 0 0 0 KJ686SBP 7/1/2009 4/28/2010 913 7054 2220 4834 360 360 100 0 268 0 0 0 0 0 KV686BRG 7/1/2009 4/28/2010 59 13103 260 12843 46 46 100 0 0 0 0 2 0 0 KV686BRI 7/1/2009 4/28/2010 33 16085 242 15843 44 44 100 0 0 0 0 0 0 0 KV686BRP 7/1/2009 4/28/2010 168 22473 788 21685 156 146 93.6 10 0 0 0 2 0 0 KV686PKG 7/1/2009 4/28/2010 2 9348 112 9236 10 10 100 0 0 0 0 0 0 0 KV686PKI 7/1/2009 4/28/2010 921 34836 5725 29111 74 74 100 0 0 0 0 0 0 0 KV686PKP 7/1/2009 4/28/2010 468 12217 1447 10770 396 383 96.7 13 226 0 0 0 0 0 KV686SBG 7/2/2009 4/28/2010 30 10370 1136 9234 61 61 100 0 0 0 0 1 0 0 KV686SBP 7/1/2009 4/28/2010 507 23001 2954 20047 303 303 100 0 182 0 0 4 0 0 KJ993BKG 12/1/2008 10/28/2011 168 9026 1140 7886 59 59 100 0 21 0 0 0 0 0 KJ993BKI 12/1/2008 10/28/2011 39 4264 450 3814 29 29 100 0 0 0 0 0 0 0 KJ993BKP 12/1/2008 10/28/2011 67 5347 522 4825 35 35 100 0 0 0 0 0 0 0 KJ993GRG 12/1/2008 10/28/2011 396 56395 3052 53343 502 502 100 0 214 0 0 1 0 0 KJ993GRI 12/1/2008 10/28/2011 376 32441 937 31504 441 441 100 0 231 0 0 1 0 0 KJ993GRP 12/1/2008 10/28/2011 195 23842 837 23005 286 286 100 0 178 0 0 3 0 0 KJ993NVG 12/1/2008 10/28/2011 23 2168 345 1823 37 29 78.4 8 0 0 0 0 0 0 KJ993NVI 12/1/2008 10/28/2011 28 1655 359 1296 9 8 88.9 1 0 0 0 0 0 0 KJ993NVP 12/1/2008 10/28/2011 10 661 291 370 33 20 60.6 13 0 0 0 0 0 0 KV993GRI 12/1/2008 10/28/2011 2638 12894 4603 8291 684 511 74.7 47 254 49.6 126 22 0 0 KV993GRP 12/1/2008 10/28/2011 14 1780 536 1244 91 45 49.5 39 4 100 4 3 100 3 KV993PKI 12/1/2008 10/28/2011 170 2392 857 1535 250 238 95.2 12 1 0 0 9 0 0 KV993PKP 12/1/2008 10/28/2011 23 1587 191 1396 27 21 77.8 6 0 0 0 3 0 0 KJ769GPG 1/1/2009 10/28/2009 53 5744 562 5182 63 63 100 0 0 0 0 0 0 0 KJ769GPP 1/1/2009 10/28/2009 23 2510 1899 611 47 25 53.2 22 0 0 0 0 0 0 Page 13
- 14. New Balance Athletic Shoes Missed Demand Report Week Ending KJ769STG 1/1/2009 10/28/2009 120 5038 1751 3287 46 10/03/09 100 46 0 0 0 0 0 0 0 KJ769STP 1/1/2009 10/28/2009 18 2769 1830 939 14 10 71.4 4 0 0 0 0 0 0 KR749GPG 1/1/2009 10/28/2009 67 6927 2568 4359 570 462 81.1 108 0 0 0 1 0 0 KR749GPP 1/1/2009 10/28/2009 179 6127 1728 4399 98 84 85.7 10 0 0 0 4 100 4 KR749STG 1/1/2009 10/28/2009 162 7299 3533 3766 110 98 89.1 10 0 0 0 9 22.2 2 KR749STP 1/1/2009 10/28/2009 237 7256 379 6877 153 141 92.2 12 0 0 0 6 0 0 KV503GBI 4/1/2009 1/28/2011 197 14315 383 13932 211 211 100 0 156 0 0 0 0 0 KV503WNI 4/1/2009 1/28/2011 157 25193 419 24774 235 226 96.2 3 197 3 6 0 0 0 KV503WPI 4/1/2009 1/28/2011 303 17088 465 16623 355 355 100 0 304 0 0 0 0 0 KX503WNI 4/1/2009 1/28/2011 35 4536 441 4095 39 39 100 0 0 0 0 0 0 0 KX503WPI 4/1/2009 1/28/2011 52 2634 378 2256 46 46 100 0 0 0 0 0 0 0 KX622AWG 5/1/2008 3/28/2010 588 7289 744 6545 144 144 100 0 96 0 0 1 0 0 KX622AWP 5/1/2008 3/28/2010 1347 7461 1798 5663 168 168 100 0 120 0 0 3 0 0 KX622BKG 5/1/2008 3/28/2010 72 7125 309 6816 278 278 100 0 217 0 0 0 0 0 KX622BKP 5/1/2008 3/28/2010 35 6685 154 6531 232 232 100 0 210 0 0 0 0 0 KX622WNG 5/1/2008 3/28/2010 174 6076 643 5433 107 98 91.6 0 60 15 9 0 0 0 KX622WNP 5/1/2008 3/28/2010 53 6637 448 6189 30 30 100 0 0 0 0 0 0 0 KX622WPP 5/1/2008 3/28/2010 53 5128 306 4822 34 34 100 0 0 0 0 4 0 0 Page 14
- 15. Kids_Sizes Style Width Total <> 05 055 06 065 07 09 10 105 KJ537GYG M 46 3 20 11 12 KJ537WPP M 38 4 KJ571BRG M 204 75 19 14 28 33 35 KJ571BRG W 3 1 1 1 KJ686PLG M 53 53 KR749GPG M 108 82 26 KR749STG M 12 5 2 2 3 KV993GRI M 173 145 28 Page 15
- 16. Kids_Sizes 11 12 17 17 Page 16
- 17. New Balance Athletic Shoes Missed Demand Report Team MTS Totals Week Ending 10/03/09 EDI Call Center Intro Phase Out Style Date Date Shipped On Hand Reserved Available Ttl Demand Pairs Filled Ttl Fill Rate BackordersOrdered Cncl Rate Cncled Ordered Cncl Rate Cncled 25 2,759 1,544 1,215 28 26 92.9 2 0 #DIV/0! 0 0 #DIV/0! 0 0 BB888HB 7/1/2006 9/28/2010 7 1,083 720 363 10 8 80.0 2 0 0.0 0 0 0.0 0 BB888HW 7/1/2006 9/28/2010 18 1,676 824 852 18 18 100.0 0 0 0.0 0 0 0.0 0 Page 17
- 18. Team_Sizes Style Width Total Page 18
- 19. New Balance Athletic Shoes Missed Demand Report Walking MTS TotalsWeek Ending 10/03/09 EDI Call Center Intro Phase Out Style Date Date Shipped On Hand Reserved Available Ttl Demand Pairs Filled Ttl Fill Rate Backorders Ordered Cncl Rate Cncled Ordered Cncl Rate Cncled 24,004 389,841 45,527 344,314 20,908 18,174 86.9 2,404 2,318 9.6 223 481 22.2 107 330 MW1200WN 7/1/2009 5/28/2011 24 3,585 54 3,531 28 28 100.0 0 0 0.0 0 0 0 0 12/30 WW1200WT 7/1/2009 5/28/2011 314 4,245 383 3,862 136 135 99.3 1 1 0.0 0 4 0 0 #REF! MW410BK 8/1/2009 2/28/2012 29 5,993 1,848 4,145 14 14 100.0 0 0 0.0 0 0 0 0 MW410WT 8/1/2009 2/28/2012 26 10,148 3,102 7,046 30 30 100.0 0 0 0.0 0 0 0 0 WW410BK 8/1/2009 2/28/2012 27 17,093 676 16,417 8 8 100.0 0 0 0.0 0 0 0 0 WW410WT 8/1/2009 2/28/2012 30 18,483 581 17,902 30 27 90.0 3 0 0.0 0 0 0 0 MW559WN 7/1/2009 5/28/2011 146 18,159 762 17,397 164 164 100.0 0 69 0.0 0 1 0 0 WW559WB 7/1/2009 5/28/2011 237 25,891 3,438 22,453 205 201 98.0 2 38 2.6 1 6 16.7 1 MW660WT 4/1/2009 2/28/2011 43 14,920 46 14,874 53 53 100.0 0 0 0.0 0 1 0 0 WW660WT 4/1/2009 2/28/2011 174 5,903 47 5,856 180 168 93.3 0 78 15.4 12 1 0 0 WW760WB 2/1/2009 11/28/2009 153 6,131 1,214 4,917 53 52 98.1 1 3 0.0 0 0 0 0 #REF! MW845BK 8/1/2008 4/28/2010 166 6,467 270 6,197 203 198 97.5 5 4 0.0 0 4 0 0 MW845WN 8/1/2008 2/28/2010 888 5,067 1,283 3,784 788 505 64.1 273 9 22.2 2 29 27.6 8 WW845BK 8/1/2008 2/28/2010 362 2,948 681 2,267 354 342 96.6 12 2 0.0 0 10 0 0 12/30 WW845WB 8/1/2008 2/28/2010 2,739 2,659 2,659 0 1,904 706 37.1 1,125 35 48.6 17 115 48.7 56 WW870WT 4/1/2009 12/28/2009 20 4,774 250 4,524 19 19 100.0 0 0 0.0 0 0 0 0 12/30 MW927BK 4/1/2009 2/28/2012 1,455 10,334 2,080 8,254 1,430 1,360 95.1 69 6 16.7 1 35 0 0 #REF! MW927WT 4/1/2009 2/28/2012 1,053 7,666 1,092 6,574 1,156 1,154 99.8 2 27 0.0 0 19 0 0 WW927BK 4/1/2009 2/28/2012 735 15,467 344 15,123 791 791 100.0 0 2 0.0 0 13 0 0 WW927WT 4/1/2009 2/28/2012 1,724 13,610 1,437 12,173 1,793 1,779 99.2 12 18 0.0 0 44 4.5 2 MW629BK 7/1/2009 4/28/2010 0 102 0 102 0 0 0.0 0 0 0.0 0 0 0 0 MW629BR 7/1/2009 7/1/2010 0 120 0 120 0 0 0.0 0 0 0.0 0 0 0 0 WW629BR 7/1/2009 4/28/2010 0 109 0 109 0 0 0.0 0 0 0.0 0 0 0 0 12/30 MW811BK 4/1/2004 3/28/2010 457 7,786 666 7,120 520 519 99.8 1 12 0.0 0 7 0 0 MW811VB 4/1/2004 6/28/2010 74 5,159 252 4,907 128 72 56.2 55 1 0.0 0 2 50 1 WW811BK 4/1/2004 3/28/2010 670 16,540 1,111 15,429 622 622 100.0 0 1 0.0 0 19 0 0 #REF! WW811SO 3/1/2006 3/28/2010 267 1,505 1,022 483 161 51 31.7 107 2 100.0 2 3 33.3 1 WW811WT 4/1/2004 3/28/2010 2,427 8,055 2,411 5,644 1,646 1,579 95.9 58 41 4.9 2 42 16.7 7 MW811VK 4/1/2004 6/28/2010 386 3,675 367 3,308 384 382 99.5 2 0 0.0 0 12 0 0 MW811VW 4/1/2004 6/28/2010 407 2,120 251 1,869 215 160 74.4 51 2 100.0 2 7 28.6 2 MW811WT 4/1/2004 3/28/2010 475 4,405 673 3,732 501 421 84.0 71 22 31.8 7 13 15.4 2 WW811VW 4/1/2004 6/28/2010 277 1,173 502 671 254 49 19.3 192 0 0.0 0 15 86.7 13 MW576BK 12/1/2007 11/28/2010 890 20,806 2,209 18,597 1,428 1,326 92.9 82 312 6.1 19 7 14.3 1 MW576VB 2/1/2008 11/28/2010 367 9,882 776 9,106 681 680 99.9 1 127 0.0 0 3 0 0 MW576VK 2/1/2008 11/28/2010 703 4,145 1,574 2,571 1,431 1,072 74.9 221 253 50.2 127 13 84.6 11 MW576VW 2/1/2008 11/28/2010 1,259 8,861 1,613 7,248 973 973 100.0 0 717 0.0 0 3 0 0 MW576WT 1/1/2008 11/28/2010 1,194 27,064 2,200 24,864 478 478 100.0 0 159 0.0 0 22 0 0 WW576BK 12/1/2007 11/28/2010 477 14,425 1,263 13,162 129 129 100.0 0 2 0.0 0 3 0 0 WW576VB 2/1/2008 11/28/2010 152 3,571 171 3,400 62 62 100.0 0 4 0.0 0 0 0 0 WW576VK 2/1/2008 11/28/2010 214 8,191 682 7,509 87 87 100.0 0 1 0.0 0 1 0 0 #REF! WW576VW 2/1/2008 11/28/2010 332 3,787 365 3,422 172 172 100.0 0 4 0.0 0 2 0 0 WW576WT 1/1/2008 11/28/2010 996 8,526 2,061 6,465 694 638 91.9 23 363 8.5 31 11 18.2 2 WW511BK 4/1/2008 4/28/2010 147 5,562 304 5,258 10 10 100.0 0 0 0.0 0 0 0 0 WW511WT 4/1/2008 4/28/2010 250 10,193 315 9,878 62 62 100.0 0 0 0.0 0 1 0 0 WW811BE 4/1/2004 3/28/2010 456 2,077 315 1,762 405 379 93.6 26 1 0.0 0 7 0 0 MW811BE 4/1/2004 3/28/2010 82 3,493 543 2,950 102 101 99.0 1 2 0.0 0 2 0 0 MK706B 9/1/2005 12/28/2010 337 6,217 1,195 5,022 316 313 99.1 3 0 0.0 0 4 0 0 WK706B 9/1/2005 12/28/2010 363 2,749 439 2,310 108 103 95.4 5 0 0.0 0 0 0 0 Page 19
- 20. Walking_Sizes Style Width Total 05 055 06 065 07 075 08 085 09 095 MW576VK D 50 2 2 MW576VK 2E 17 8 MW576VK 4E 292 18 20 39 22 6 52 MW811VB B 1 MW811VB D 22 4 4 MW811VB 2E 25 4 7 MW811VB 4E 8 MW811VW B 6 MW811VW D 22 MW811VW 2E 20 2 MW811VW 4E 7 1 6 MW811WT 2A 9 MW811WT B 10 MW811WT D 19 MW811WT 2E 24 MW811WT 4E 16 8 MW811WT 6E 2 MW845WN 2A 21 MW845WN B 46 MW845WN D 9 MW845WN 2E 178 2 3 6 9 14 17 MW845WN 4E 29 3 5 WW811SO 2A 6 1 2 1 WW811SO B 56 4 1 3 6 8 6 1 9 WW811SO D 36 3 1 5 6 7 5 WW811SO 2E 12 5 1 4 WW811VW 2A 9 6 1 WW811VW B 87 1 1 5 5 11 8 12 9 5 15 WW811VW D 74 9 8 12 16 9 7 4 WW811VW 2E 35 1 10 5 5 3 7 WW845WB 2A 238 12 21 25 31 44 WW845WB B 530 4 3 1 99 122 91 WW845WB D 347 4 4 24 5 3 64 79 85 52 WW845WB 2E 83 9 13 14 30 Page 20
- 21. Walking_Sizes 10 105 11 115 12 125 13 14 15 5 1 40 9 30 22 20 16 46 1 1 6 3 2 3 8 4 1 1 3 4 1 1 1 2 2 13 8 1 8 7 3 1 4 4 3 7 19 11 13 3 5 2 1 4 4 6 3 3 9 6 7 8 2 11 3 9 18 28 33 15 9 17 5 2 16 5 2 7 4 2 4 1 3 3 3 1 1 2 12 3 8 1 3 1 35 20 25 20 5 90 45 46 25 4 1 12 12 2 13 4 Page 21
- 22. New Balance Athletic Shoes Missed Demand Report Tennis MTS Totals Week Ending 10/03/09 EDI Call Center Intro Phase Out Style Date Date Shipped On Hand Reserved Available Ttl Demand Pairs Filled Ttl Fill Rate Backorders Ordered Cncl Rate Cncled Ordered Cncl Rate Cncled 1,767 20,801 1,967 18,834 1,150 1,150 100.0 0 22 0.0 0 16 0.0 0 0 CT1004W 2/1/2009 12/28/2010 401 6,389 530 5,859 227 227 100.0 0 2 0.0 0 4 0.0 0 WCT1004W 2/1/2009 12/28/2010 392 6,709 492 6,217 207 207 100.0 0 1 0.0 0 0 0.0 0 MC803W 4/1/2007 2/28/2010 637 3,992 521 3,471 389 389 100.0 0 11 0.0 0 8 0.0 0 WC803W 4/1/2007 2/28/2010 337 3,711 424 3,287 327 327 100.0 0 8 0.0 0 4 0.0 0 12/30 Page 22
- 23. Tennis_Sizes Style Width Total Page 23
- 24. Tennis_Sizes Page 24
- 25. Tennis_Sizes Page 25
- 26. New Balance Athletic Shoes Missed Demand Report Training MTS Week Ending 10/03/09 Totals EDI Call Center Intro Phase Out Style Date Date Shipped On Hand Reserved Available Ttl Demand Pairs Filled Ttl Fill Rate Backorders Ordered Cncl Rate Cncled Ordered Cncl Rate Cncled 37,869 634,783 77,419 557,364 18,621 18,522 99.5 34 9,017 0.7 62 136 2.2 3 65 MX1010WB 1/1/2009 5/28/2010 108 29,142 1,659 27,483 98 98 100.0 0 0 0.0 0 2 0.0 0 WX1010WB 1/1/2009 5/28/2010 95 22,178 743 21,435 102 102 100.0 0 0 0.0 0 3 0.0 0 MX1210GR 4/1/2009 11/28/2010 49 9,963 781 9,182 71 71 100.0 0 1 0.0 0 2 0.0 0 WX1210TR 4/1/2009 11/28/2010 99 5,804 149 5,655 133 133 100.0 0 1 0.0 0 0 0.0 0 MX608V2B 5/1/2009 2/28/2011 831 37,304 6,117 31,187 209 202 96.7 7 0 0.0 0 0 0.0 0 MX608V2O 7/1/2009 2/28/2011 815 18,001 914 17,087 53 53 100.0 0 0 0.0 0 1 0.0 0 MX608V2S 5/1/2009 2/28/2011 184 10,447 921 9,526 61 61 100.0 0 0 0.0 0 0 0.0 0 MX608V2W 5/1/2009 2/28/2011 7,520 85,325 20,152 65,173 2,266 2,187 96.5 17 716 8.7 62 6 0.0 0 WX608V2B 5/1/2009 2/28/2011 122 16,759 453 16,306 48 48 100.0 0 0 0.0 0 2 0.0 0 WX608V2P 5/1/2009 2/28/2011 2,148 27,080 2,761 24,319 231 230 99.6 1 96 0.0 0 0 0.0 0 WX608V2W 5/1/2009 2/28/2011 4,714 83,102 8,039 75,063 1,059 1,059 100.0 0 503 0.0 0 2 0.0 0 MX840WS 10/1/2008 11/28/2009 11 5,600 333 5,267 44 40 90.9 4 0 0.0 0 0 0.0 0 WX840SB 10/1/2008 11/28/2009 10 4,647 2,341 2,306 12 9 75.0 3 0 0.0 0 0 0.0 0 MX407BK 1/1/2007 4/1/2027 857 41,046 597 40,449 931 931 100 0 931 0.0 0 0 0.0 0 MX622AB 5/1/2008 3/28/2010 4,779 27,958 9,641 18,317 1,940 1,940 100 0 844 0.0 0 15 0.0 0 MX622OD 5/1/2008 3/28/2010 309 19,734 989 18,745 217 217 100 0 0 0.0 0 4 0.0 0 MX622WN 5/1/2008 3/28/2010 9,501 72,688 13,440 59,248 5,521 5,521 100 0 3,902 0.0 0 27 0.0 0 MX622WT 5/1/2008 3/28/2010 1,081 12,007 1,143 10,864 1,050 1,050 100 0 562 0.0 0 21 0.0 0 WX622AB 5/1/2008 3/28/2010 135 7,263 1,481 5,782 99 99 100 0 0 0.0 0 0 0.0 0 WX622WB 5/1/2008 3/28/2010 440 23,036 873 22,163 344 343 99.7 1 117 0.0 0 1 0.0 0 WX622WP 5/1/2008 3/28/2010 560 23,961 912 23,049 444 444 100 0 262 0.0 0 0 0.0 0 WX622WT 5/1/2008 3/28/2010 1,940 23,616 1,674 21,942 1,521 1,521 100 0 947 0.0 0 19 0.0 0 MX855WN 4/1/2008 5/28/2010 940 15,004 866 14,138 943 940 99.7 1 113 0.0 0 12 16.7 2 WX855WB 4/1/2008 5/28/2010 621 13,118 440 12,678 1,224 1,223 99.9 0 22 0.0 0 19 5.3 1 Page 26
- 27. Training_Sizes Style Width Total Page 27
- 28. New Balance Athletic Shoes Missed Demand Report Outdoor MTS Week Ending 10/03/09 Totals EDI Call Center Intro Phase Out Style Date Date Shipped On Hand Reserved Available Ttl Demand Pairs Filled Ttl Fill Rate Backorders Ordered Cncl Rate Cncled Ordered Cncl Rate Cncled 39,264 417,323 107,405 309,918 31,898 29,647 92.9 1,041 4,355 27.6 1,200 83 12.0 10 1,210 MO1520BR 7/1/2009 4/28/2011 12 2,479 473 2,006 16 16 100.0 0 0 0.0 0 0 0.0 0 MO1520GT 2/1/2009 10/28/2010 206 9,047 685 8,362 1,360 1,360 100.0 0 4 0.0 0 0 0.0 0 WO1520GR 7/1/2009 4/28/2011 50 2,448 565 1,883 9 9 100.0 0 0 0.0 0 0 0.0 0 WO1520GT 2/1/2009 10/28/2010 23 4,328 516 3,812 25 25 100.0 0 0 0.0 0 0 0.0 0 MT571BK 1/1/2009 10/28/2009 619 6,900 2,028 4,872 7,064 6,707 94.9 276 485 16.5 80 1 100.0 1 MT571GY 1/1/2009 10/28/2009 11,016 22,732 19,585 3,147 7,243 6,404 88.4 659 337 53.4 180 6 0.0 0 WT571GP 1/1/2009 10/28/2009 8,678 41,049 36,224 4,825 4,023 3,675 91.3 7 671 50.5 339 3 66.7 2 MT621BK 7/1/2009 4/28/2010 2,197 6,033 1,618 4,415 1,805 1,190 65.9 15 1,680 35.6 598 5 40.0 2 MT621GR 7/1/2009 4/28/2010 3,780 8,960 4,497 4,463 14 14 100.0 0 0 0.0 0 0 0.0 0 WT621GP 7/1/2009 4/28/2010 52 12,574 3,109 9,465 40 40 100.0 0 0 0.0 0 0 0.0 0 MT812AT 2/1/2009 11/28/2009 423 4,171 2,844 1,327 138 96 69.6 39 12 25.0 3 2 0.0 0 MT812BK 2/1/2009 11/28/2009 92 3,986 340 3,646 100 95 95.0 4 3 0.0 0 3 33.3 1 WT812GR 2/1/2009 11/28/2009 49 3,579 180 3,399 46 46 100.0 0 4 0.0 0 0 0 0 WT840OD 7/1/2008 10/28/2009 4 5,190 752 4,438 4 4 100.0 0 0 0.0 0 0 0 0 MT875OR 4/1/2009 1/28/2010 123 2,686 424 2,262 127 123 96.9 3 0 0.0 0 2 50.0 1 WT875OR 4/1/2009 1/28/2010 71 991 225 766 56 54 96.4 1 0 0.0 0 2 50 1 MT909OR 10/1/2008 10/28/2009 33 3,523 321 3,202 30 30 100.0 0 0 0.0 0 2 0.0 0 WT909OR 10/1/2008 10/28/2009 12 3,168 134 3,034 12 12 100.0 0 0 0.0 0 0 0 0 MT910GT 8/1/2009 4/28/2011 87 4,640 258 4,382 94 73 77.7 21 0 0.0 0 0 0 0 WT910GT 8/1/2009 4/28/2011 83 3,191 154 3,037 65 65 100.0 0 0 0.0 0 0 0 0 MW645BR 7/1/2008 5/28/2010 2,995 34,959 5,035 29,924 403 401 99.5 2 191 0.0 0 0 0 0 MW645GR 7/1/2008 5/28/2010 384 20,206 1,000 19,206 2,950 2,950 100.0 0 284 0.0 0 2 0 0 MW645WR 7/1/2009 5/28/2010 463 16,277 6,911 9,366 173 173 100.0 0 0 0.0 0 1 0 0 WW645BR 7/1/2008 5/28/2010 272 18,649 1,982 16,667 3,043 3,042 100.0 1 260 0.0 0 0 0 0 WW645TP 7/1/2008 5/28/2010 193 19,224 2,259 16,965 202 202 100.0 0 93 0.0 0 0 0 0 WW645WR 7/1/2009 5/28/2010 1,298 14,237 2,121 12,116 40 40 100.0 0 0 0.0 0 1 0 0 MW955GT 2/1/2009 5/28/2011 353 6,683 456 6,227 315 315 100.0 0 41 0.0 0 6 0 0 WW955GT 2/1/2009 5/28/2011 262 6,968 494 6,474 129 129 100.0 0 0 0.0 0 1 0.0 0 MW966BR 10/1/2008 4/28/2010 696 20,928 2,558 18,370 758 758 100.0 0 257 0.0 0 7 0 0 MW966GR 10/1/2008 7/28/2010 0 1 0 1 0 0 0.0 0 0 0.0 0 0 0.0 0 WW966BR 10/1/2008 4/28/2010 245 11,316 925 10,391 217 213 98.2 4 0 0.0 0 5 0.0 0 MW605BR 4/1/2008 2/28/2010 1,058 29,589 1,838 27,751 122 122 100.0 0 9 0.0 0 0 0 0 WW605BR 4/1/2008 2/28/2010 1,200 18,156 1,630 16,526 138 137 99.3 1 19 0.0 0 0 0 0 MW977GT 7/1/2007 8/28/2010 1,702 13,356 2,737 10,619 700 698 99.7 1 5 0.0 0 22 4.5 1 WW977GT 7/1/2007 8/28/2010 385 10,754 1,315 9,439 258 258 100.0 0 0 0.0 0 8 0 0 MO1201GT 7/1/2008 12/28/2009 41 7,286 707 6,579 45 44 97.8 0 0 0.0 0 1 100 1 WO1201GT 7/1/2008 12/28/2009 13 7,233 63 7,170 12 12 100.0 0 0 0.0 0 1 0 0 MO1500GT 7/1/2008 5/28/2011 86 3,377 355 3,022 111 105 94.6 6 0 0.0 0 1 0 0 WO1500GT 7/1/2008 5/28/2011 8 6,449 87 6,362 11 10 90.9 1 0 0.0 0 1 0 0 Page 28
- 29. Outdoor_Sizes Style Width Total 075 08 085 09 095 10 105 11 115 12 MT571GY D 839 16 105 161 313 8 2 MT621BK D 41 41 MT621BK 2E 2 MT621BK 4E 572 77 1 74 1 79 77 77 35 74 MT812AT B 7 1 1 1 1 2 MT812AT D 3 MT812AT 2E 15 3 2 3 2 2 MT812AT 4E 17 1 1 5 5 4 Page 29
- 30. Outdoor_Sizes 125 13 14 15 16 225 4 5 2 75 1 1 1 2 1 2 1 1 Page 30
- 31. New Balance Athletic Shoes Missed Demand Report Inline MTS Phase Out Totals Week Ending 10/03/09 EDI Call Center Style Intro Date Date Shipped On Hand Reserved Available Ttl Demand Pairs Filled Ttl Fill Rate Backorders Ordered Cncl Rate Cncled Ordered Cncl Rate Cncled 101,852 2,075,508 303,793 1,771,715 74,620 69,208 92.7 2,574 15,782 17.6 2,771 699 9.6 67 2,838 CT1004W 2/1/2009 12/28/2010 401 6,389 530 5,859 227 227 100.0 0 2 0.0 0 4 0.0 0 WCT1004W 2/1/2009 12/28/2010 392 6,709 492 6,217 207 207 100.0 0 1 0.0 0 0 0.0 0 KJ552NYG 4/1/2009 1/28/2011 45 18,247 128 18,119 9 9 100.0 0 0 0.0 0 0 0.0 0 KJ552NYP 4/1/2009 1/28/2011 99 16,926 276 16,650 37 37 100.0 0 0 0.0 0 0 0.0 0 KG630BYI 1/1/2009 10/28/2009 12 461 319 142 7 0 0.0 7 0 0.0 0 0 0.0 0 KG630NRP 1/1/2009 10/28/2009 77 339 281 58 1 1 100.0 0 0 0.0 0 0 0.0 0 KG630PKI 1/1/2009 10/28/2009 71 5,661 520 5,141 61 61 100.0 0 0 0.0 0 0 0.0 0 KG630WBP 1/1/2009 10/28/2009 62 393 188 205 14 4 28.6 10 0 0.0 0 0 0.0 0 KJ630NRG 1/1/2009 10/28/2009 23 1,016 286 730 13 13 100.0 0 0 0.0 0 0 0.0 0 KJ630NRI 1/1/2009 10/28/2009 29 700 232 468 23 23 100.0 0 0 0.0 0 0 0.0 0 KJ630NRP 1/1/2009 10/28/2009 381 1,960 670 1,290 28 25 89.3 3 0 0.0 0 0 0.0 0 KJ630WBG 1/1/2009 10/28/2009 34 395 154 241 17 14 82.4 3 0 0.0 0 0 0.0 0 KJ630WBP 1/1/2009 10/28/2009 63 420 150 270 44 41 93.2 3 0 0.0 0 0 0.0 0 KJ537GYG 6/1/2009 3/28/2010 120 1,291 237 1,054 124 78 62.9 6 98 40.8 40 0 0.0 0 KJ537GYI 6/1/2009 3/28/2010 15 3,369 217 3,152 62 62 100.0 0 0 0.0 0 0 0.0 0 KJ537GYP 6/1/2009 3/28/2010 172 8,109 393 7,716 112 112 100.0 0 90 0.0 0 1 0.0 0 KJ537WPG 6/1/2009 3/28/2010 78 5,055 728 4,327 54 54 100.0 0 50 0.0 0 0 0.0 0 KJ537WPI 6/1/2009 3/28/2010 54 509 71 438 56 55 98.2 0 0 0.0 0 1 100.0 1 KJ537WPP 6/1/2009 3/28/2010 294 3,831 1,182 2,649 232 194 83.6 0 193 19.7 38 0 0.0 0 KJ571BRG 1/1/2009 10/28/2009 1,008 1,816 1,778 38 207 0 0.0 5 202 100.0 202 0 0.0 0 KJ571BRP 1/1/2009 10/28/2009 13 1,397 55 1,342 24 13 54.2 11 0 0.0 0 0 0.0 0 KJ571GRG 1/1/2009 10/28/2009 104 3,670 503 3,167 78 78 100.0 0 71 0.0 0 1 0.0 0 KJ571GRP 1/1/2009 10/28/2009 13 5,075 732 4,343 19 15 78.9 4 1 0.0 0 0 0.0 0 KV571BBG 1/1/2009 10/28/2009 88 10,509 1,092 9,417 20 20 100.0 0 0 0.0 0 0 0.0 0 KV571BBP 1/1/2009 10/28/2009 265 6,823 2,346 4,477 18 16 88.9 2 0 0.0 0 0 0.0 0 KJ686PLG 7/1/2009 4/28/2010 475 4,732 632 4,100 195 142 72.8 12 124 33.1 41 0 0.0 0 KJ686PLP 7/1/2009 4/28/2010 530 5,943 2,632 3,311 66 43 65.2 23 0 0.0 0 0 0.0 0 KJ686SBG 7/1/2009 4/28/2010 1,072 9,453 1,188 8,265 517 492 95.2 4 422 5.0 21 0 0.0 0 KJ686SBP 7/1/2009 4/28/2010 913 7,054 2,220 4,834 360 360 100.0 0 268 0.0 0 0 0.0 0 KV686BRG 7/1/2009 4/28/2010 59 13,103 260 12,843 46 46 100.0 0 0 0.0 0 2 0.0 0 KV686BRI 7/1/2009 4/28/2010 33 16,085 242 15,843 44 44 100.0 0 0 0.0 0 0 0.0 0 KV686BRP 7/1/2009 4/28/2010 168 22,473 788 21,685 156 146 93.6 10 0 0.0 0 2 0.0 0 KV686PKG 7/1/2009 4/28/2010 2 9,348 112 9,236 10 10 100.0 0 0 0.0 0 0 0.0 0 KV686PKI 7/1/2009 4/28/2010 921 34,836 5,725 29,111 74 74 100.0 0 0 0.0 0 0 0.0 0 KV686PKP 7/1/2009 4/28/2010 468 12,217 1,447 10,770 396 383 96.7 13 226 0.0 0 0 0.0 0 KV686SBG 7/2/2009 4/28/2010 30 10,370 1,136 9,234 61 61 100.0 0 0 0.0 0 1 0.0 0 KV686SBP 7/1/2009 4/28/2010 507 23,001 2,954 20,047 303 303 100.0 0 182 0.0 0 4 0.0 0 KJ993BKG 12/1/2008 10/28/2011 168 9,026 1,140 7,886 59 59 100.0 0 21 0.0 0 0 0.0 0 KJ993BKI 12/1/2008 10/28/2011 39 4,264 450 3,814 29 29 100.0 0 0 0.0 0 0 0.0 0 KJ993BKP 12/1/2008 10/28/2011 67 5,347 522 4,825 35 35 100.0 0 0 0.0 0 0 0.0 0 KJ993GRG 12/1/2008 10/28/2011 396 56,395 3,052 53,343 502 502 100.0 0 214 0.0 0 1 0.0 0 KJ993GRI 12/1/2008 10/28/2011 376 32,441 937 31,504 441 441 100.0 0 231 0.0 0 1 0.0 0 KJ993GRP 12/1/2008 10/28/2011 195 23,842 837 23,005 286 286 100.0 0 178 0.0 0 3 0.0 0 KJ993NVG 12/1/2008 10/28/2011 23 2,168 345 1,823 37 29 78.4 8 0 0.0 0 0 0.0 0 KJ993NVI 12/1/2008 10/28/2011 28 1,655 359 1,296 9 8 88.9 1 0 0.0 0 0 0.0 0 KJ993NVP 12/1/2008 10/28/2011 10 661 291 370 33 20 60.6 13 0 0.0 0 0 0.0 0 KV993GRI 12/1/2008 10/28/2011 2,638 12,894 4,603 8,291 684 511 74.7 47 254 49.6 126 22 0.0 0 KV993GRP 12/1/2008 10/28/2011 14 1,780 536 1,244 91 45 49.5 39 4 100.0 4 3 100.0 3 KV993PKI 12/1/2008 10/28/2011 170 2,392 857 1,535 250 238 95.2 12 1 0.0 0 9 0.0 0 KV993PKP 12/1/2008 10/28/2011 23 1,587 191 1,396 27 21 77.8 6 0 0.0 0 3 0.0 0 KJ769GPG 1/1/2009 10/28/2009 53 5,744 562 5,182 63 63 100.0 0 0 0.0 0 0 0.0 0 KJ769GPP 1/1/2009 10/28/2009 23 2,510 1,899 611 47 25 53.2 22 0 0.0 0 0 0.0 0 KJ769STG 1/1/2009 10/28/2009 120 5,038 1,751 3,287 46 46 100.0 0 0 0.0 0 0 0.0 0 KJ769STP 1/1/2009 10/28/2009 18 2,769 1,830 939 14 10 71.4 4 0 0.0 0 0 0.0 0 KR749GPG 1/1/2009 10/28/2009 67 6,927 2,568 4,359 570 462 81.1 108 0 0.0 0 1 0.0 0 KR749GPP 1/1/2009 10/28/2009 179 6,127 1,728 4,399 98 84 85.7 10 0 0.0 0 4 100.0 4 KR749STG 1/1/2009 10/28/2009 162 7,299 3,533 3,766 110 98 89.1 10 0 0.0 0 9 22.2 2 Page 31