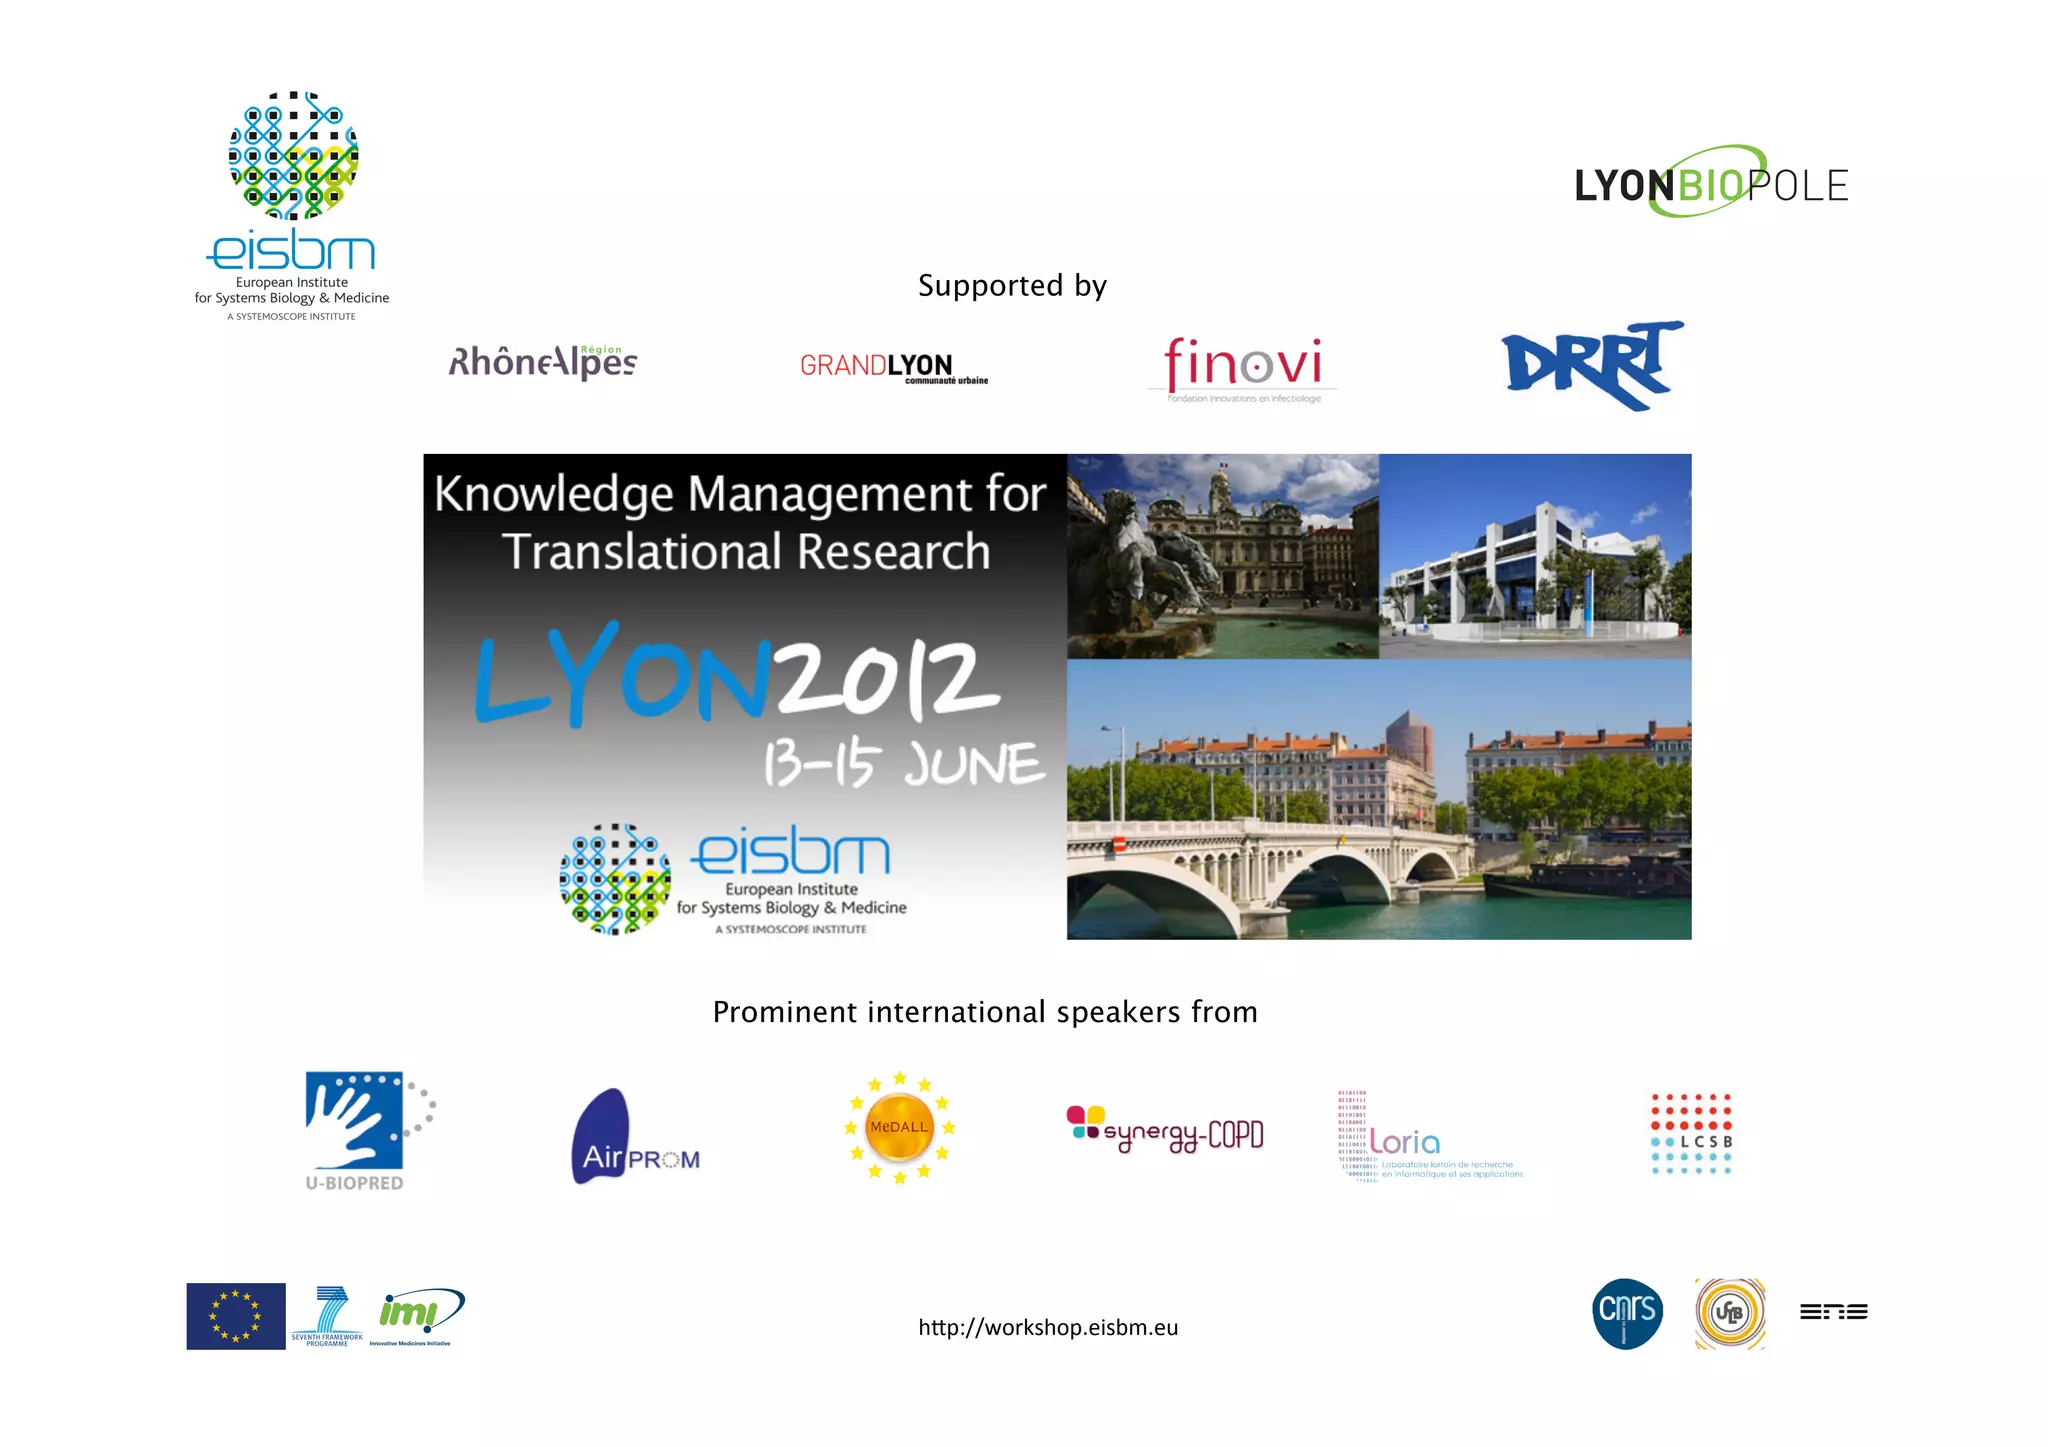
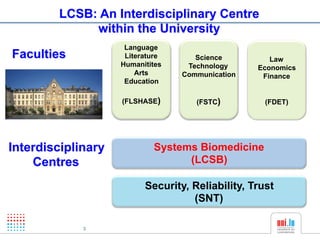
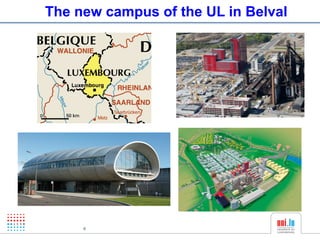
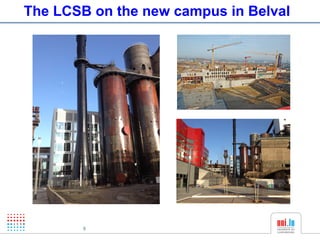
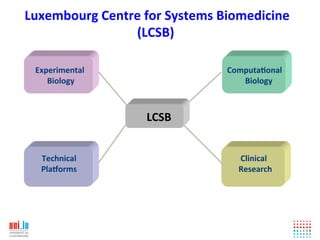
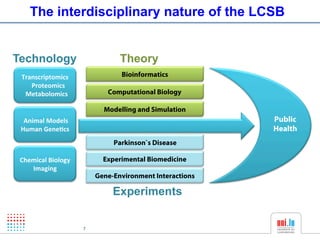
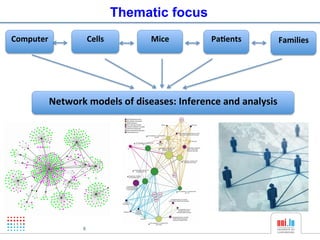
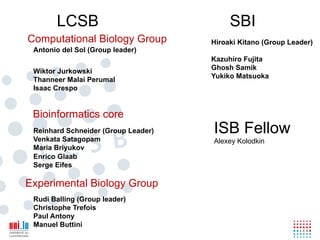
4. LCSB: An Interdisciplinary Centre
within the University
Language
Faculties Literature Science Law
Humanitites Technology Economics
Arts Communication Finance
Education
(FLSHASE) (FSTC) (FDET)
Interdisciplinary Systems Biomedicine
Centres (LCSB)
Security, Reliability, Trust
(SNT)
3
8. The interdisciplinary nature of the LCSB
Technology Theory
Transcriptomics! Bioinformatics
!!!!Proteomics!
!!Metabolomics! Computational Biology
Modelling and Simulation
!Animal!Models! Public
Human!Gene2cs! !!!!!!!!!!!!!!!!!!!!!!!!!!
! Health
Parkinson`s Disease
Chemical!Biology! Experimental Biomedicine
Imaging!!!!
Gene-Environment Interactions
Experiments
18/06/12 7
12. Computational approaches to study function
of macromolecules
Prediction of Chemokine receptor dimerization
Hernandez P, Serrano A, Juan D, del Sol A, Valencia A, Martinez C
Nature Immunology (2004) 5: 216-223
13. Computational approaches to study function
of macromolecules
Network determinants and key amino acids
for allosteric communications
Central amino acids identify key residues for the allosteric
signaling
Central residue
del Sol A, Fujihashi H, Amoros D, Nussinov R, Molecular Systems Biology 2006,
Tsai C, Antonio del Sol, Ruth Nussinov JMB 2008, 378: 1-11
14. Molecular!analysis!of!disease?related!perturba6ons
!
prion!disease!
!
Wuthrich K et al. NMR solution structure of the human prion protein. PNAS, 2000, 97: 145-150
Nelson R, Sawaya MR, Balbirnie M, et al. Structure of the cross-beta spine of amyloid-like fibrils. Nature.
2005;435(7043):773-8.
16. Modeling!mouse!neural!stem!cells!differen6a6on!into!astrocytes:!
understanding!astrocyte!dedifferen6a6on!under!specific!s6muli!
Project in collaboration with Prof Noel J Buckley
Department of Neuroscience
Institute of Psychiatry
King’s College London
FBS!
NSCs!CTX12! Astrocytes!
EGF+FGF?2!
BMP4!
NSCs!CTX12! Astrocytes!
EGF+FGF?2!
Goals:
-Constructing a gene regulatory network based model to describe
differentiation and dedifferentiation of astrocytes.
-Identify candidate genes controlling and inducing both differentiation 15
and dedifferentiation.
17. Role!of!MicroRNAs!in!regula6ng!Epithelial!to!Mesenchymal!Transi6on!
Project in collaboration
with Evelyne Friederich,
Life Sciences Research
Unit, University of
Luxembourg
Goals:
- Introduce a dynamic model for a gene regulatory network describing EMT
- Elucidation of the role of novel microRNAs in EMT
16
18. Goals:
- Network model describing molecular changes underlying normal and Alzheimer’s
disease aging 17
- Understand similarities and differences between normal and Alzheimer’s disease aging
26. Constructing a PD-disease network
• Literature and expertise-based curation
• Map annotation
• Network analysis
• Text mining-based map enrichment
• Integration of sequencing data with map
M. Ostaszweski, C. Trefois, P. Antony, R. Balling
I. Crespo, A. del Sol
E. Glaab, G. Vanketta, R. Schneider
Cooperation with the team of
25 H. Kitano (Japan)
32. Data Mining Tools for finding new PD genes and Curation
I. !Sta6s6cal!analysis!of!the!full!text!PD!related!ar6cles.!!
!Co?occurrence?based!strategy.!
II. ! !Lexico?syntac6c!refinement!of!sta6s6cal!results!
• From co-occurrence to typed relationship extractions:
– “PINK1 binds and colocalizes with TRAP1 in the mitochondria and phosphorilates TRAP1
both in vitro and in vivo.” (17579517)
• Data curation: detection of negative & hypothetical
context
– “GDNF and PSPN, but not NRTN, induce neurite outgrowth of dopaminergic neurons in
vitro” (14699966)
– “One way to resolve this apparent contradiction is to place LRRK2 genetically upstream of
deposited proteins such as SNCA or tau, implying that the same initial mutation might
then result in different pathological outcomes depending on the course the disease
takes” (20696314)
Monday, March 12, 2012 31
33. PD Microarray datasets
Study Cell type Conditions Platform
C. R. Scherzer et al., PNAS, Whole blood, early PD PD (50), healthy (21), U133A
2007 stage other neuro. dis. (33)
Y. Zhang et al., Am J Med Genet multiple brain regions, post PD (40), healthy (53) U133A
B Neuropsychiatr Genet, 2005 mortem
T. G. Lesnick et al., PloS Genet, SN, post mortem PD (16), healthy (9) U133 Plus 2.0
2007
L. B. Moran et al., Neurogenetics, SN + frontal gyrus, post PD (29), healthy (18) U133A,
2006 mortem U133B
Normalization: if not pre-normalized " GC-RMA (Bolstad et al., 2005)
Sample filtering: only use SN, post mortem samples for integrative analysis
Monday, March 12, 2012 32
34. Analysis of differentially expressed genes
Cross-study analysis of differentially expressed genes
1) Empirical Bayes moderated t-statistic (G. K. Smyth, 2004)
2) Marot et al. (2009) inverse weighted normal method to combine p-values
3) Multiple testing adjustment (Benjamini & Hochberg, 1995), cut-off: 0.05
" 1656 differentially expressed genes (DEGs)
Healthy PD
Differentially expressed genes
First observations:
• 62% of DEGs are down-
regulated
• Among 205 mitochondrial
DEGs: 76% down-regulated
• Among 31 proteasomal
DEGs: 90% down-regulated
Samples
Monday, March 12, 2012 33
35. Visualizing the data on the PD pathways
Visualization on PD map:
• Project transcriptomes
from the meta analysis of
the PD microarray studies
onto PD map, using a
colour gradient coding:
Red = down-regulated
Green = up-regulated
The darker the colour tone,
the higher the fold change.
PD pathway map
Monday, March 12, 2012 34
36. Network Analysis of the PD map: Overview
Content Analysis
A priori
knowledge
Network inference Structural Analysis
G = (V , E )
Computational Biology
Group
Experimental Analysis Static Model
xk = f ( xk +1 )
Dynamic Model
&
x = f ( x, p )
35
38. Structural!analysis!of!PD!network!
Goals:
• Identify species/
components that are
essential for disease
pathology.
• Develop general
purpose algorithms that
analyses the structure
of cellular networks, to
understand the
genotype-phenotype
relationship
40. Structure Analysis (Graph theoretic approach)
• Identifying the global properties of the
PD network
x1 – Characteristic distance, path length,
x2
x3
x4
x5
x6
degree distribution, clustering
x1 0 1 0 0 0 0 coefficient, matching Index, Eigen values
and spectral properties
x2 0 0 0 0 1 1
x3 0 0 0 0 1 0
• Centrality analysis
x4 0 0 0 0 0 1 – Degree centrality, betweeness centrality,
x5 0 0 0 0 0 1 average neighbourhood degree, radiality,
integration, katzu index and page rank
x6 0 0 0 0 0 0
• Motif & module identification
Adjacency Matrix
• Simple path analysis
Junker, BH and Schreiber, F (2008) Analysis of Biological Networks
39
41. Structure Analysis (Gene prioritization studies)
• Simple path analysis
– Output: To predict the essentiality of
components
• Simple paths (SP’s)
– All set of nodes that can perform signal
transduction from one node to another
– Given a input-output pair (like x1 – x6)
– SP’s are
• x1 – x2 – x6
• x1 – x2 – x5 – x6
Wang,RS. (2011) BMC Syst. Biol., 5: 44
40
42. Structure Analysis (Gene prioritization studies)
• Based on an input-output pair all the other nodes
in the sub-network are scored
N SP ( G ) − N SP ( GΔv )
E SP ( v ) =
N SP ( G )
where
E ESM ( v ) − Essentiality of the vertex v
N ESM ( G ) − Number of SP ' s of original graph G
N ESM ( GΔv ) − Number of SP ' s of perturbed graph GΔv
Node!Name! Essen2ality!Scores! Node!Name! Essen2ality!Scores!
x1 1! x4! 1!
x2! 1! x5! 0.5!
x3! 0.5!
Wang,RS. (2011) BMC Syst. Biol., 5: 44 41
43. Structure Analysis (Gene prioritization studies)
• Considering all the 1165 nodes (excluding phenotypes)
as inputs and 6 hallmarks as outputs we can arrive at
1165 x 6 ranking sets
Hallmarks
Alpha-synuclein
Mitochondrial
aggregation
dysfunction
For Ex1
(Given caspase-6 –
.
Alpha synuclein
Nodes aggregation pair)
Input Nodes
caspase-6 Ex1 Ex1109 . BAD:BCL-2 ESP
BAD:BCL-2 Ex2 Ex1110 . tBID:BCL-2 ESP
tBID:BCL-2 Ex3 Ex1111 . caspase-3 ESP
caspase-3 Ex4 Ex1112 .
Hallmarks NNT dimer Ex5 Ex1113 .
NNT dimer ESP
. . . . . .
42
44. Structure Analysis (Gene prioritization studies)
Hallmarks • Combining all the row rankings
of each column will give the
Alpha-synuclein
Mitochondrial
importance of species wrt the
aggregation
dysfunction
given hallmark
• Combining the column rankings
Nodes
of each row will give the
caspase-6 Ex1 Ex1109 Ex2217 Ex3325 . importance of species wrt the
BAD:BCL-2 Ex2 Ex1110 Ex2218 Ex3326 . selected target
tBID:BCL-2 Ex3 Ex1111 Ex2219 Ex3327 .
• But still the question remains
caspase-3 Ex4 Ex1112 Ex2220 Ex3328 . what is the good target and
NNT dimer Ex5 Ex1113 Ex2221 Ex3329 . what is the interesting
. . . . . . hallmark?
43
45. Centrality analysis and Simple path analysis
• Simple path analysis:
– Top 10% includes metabolites of citric acid cycle and glycolysis pathway
– Next group forms proteins and complexes involved in apoptosis
• Centrality analysis:
– VDAC1 and apoptosome to be the key components that are highly
ranked
– AMPA receptors involved in long-term potentiation mechanism of
synaptic plasticity and transcription factors like CREB1.
• Both analysis:
– Highlights many small molecules such as reactive oxygen species (e.g.
hydrogen peroxide)
44
46. Comparison
Comparison with text mining and pathway enrichment analysis
Text Mining
Enrichment Analysis
Mitochondrial dysfunction
Neuroinflammation
All Hallmarks
Protein misfolding
Synaptic transmission dysfunction
Failure of protein quality control
0.6 0.4 0.2 0
Cosine correlation distance
45
47. Dynamical!model!of!PD!network!
Goals:
• to develop a dynamical
boolean/fuzzy model of
PD pathology, based on
the PD map
• to understand the
mitochondrial
21!
dysfunction mechanism
20! of PD
• to generate hyposthesis
for in house
experiments.