Download as PDF, PPTX


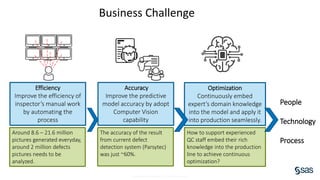
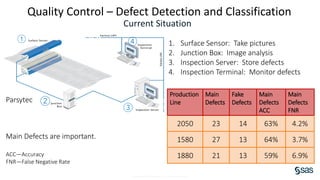

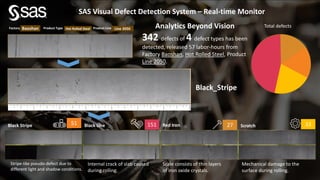
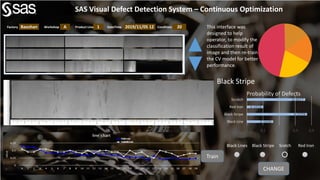

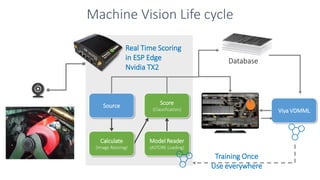
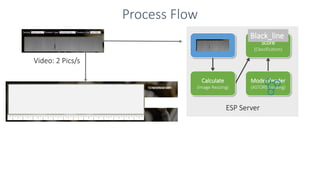
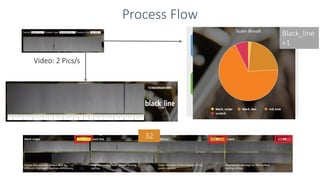

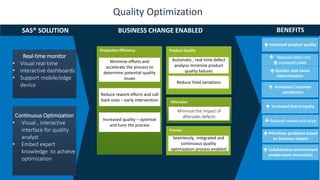


The document discusses the implementation of the SAS Visual Defect Detection System to enhance quality control in Baosteel, China's largest steel company. By automating defect detection and classification using deep learning, the system aims to improve inspection efficiency and accuracy, reducing labor costs and enhancing product quality. The system also focuses on continuous optimization by embedding expert knowledge and enabling real-time monitoring.