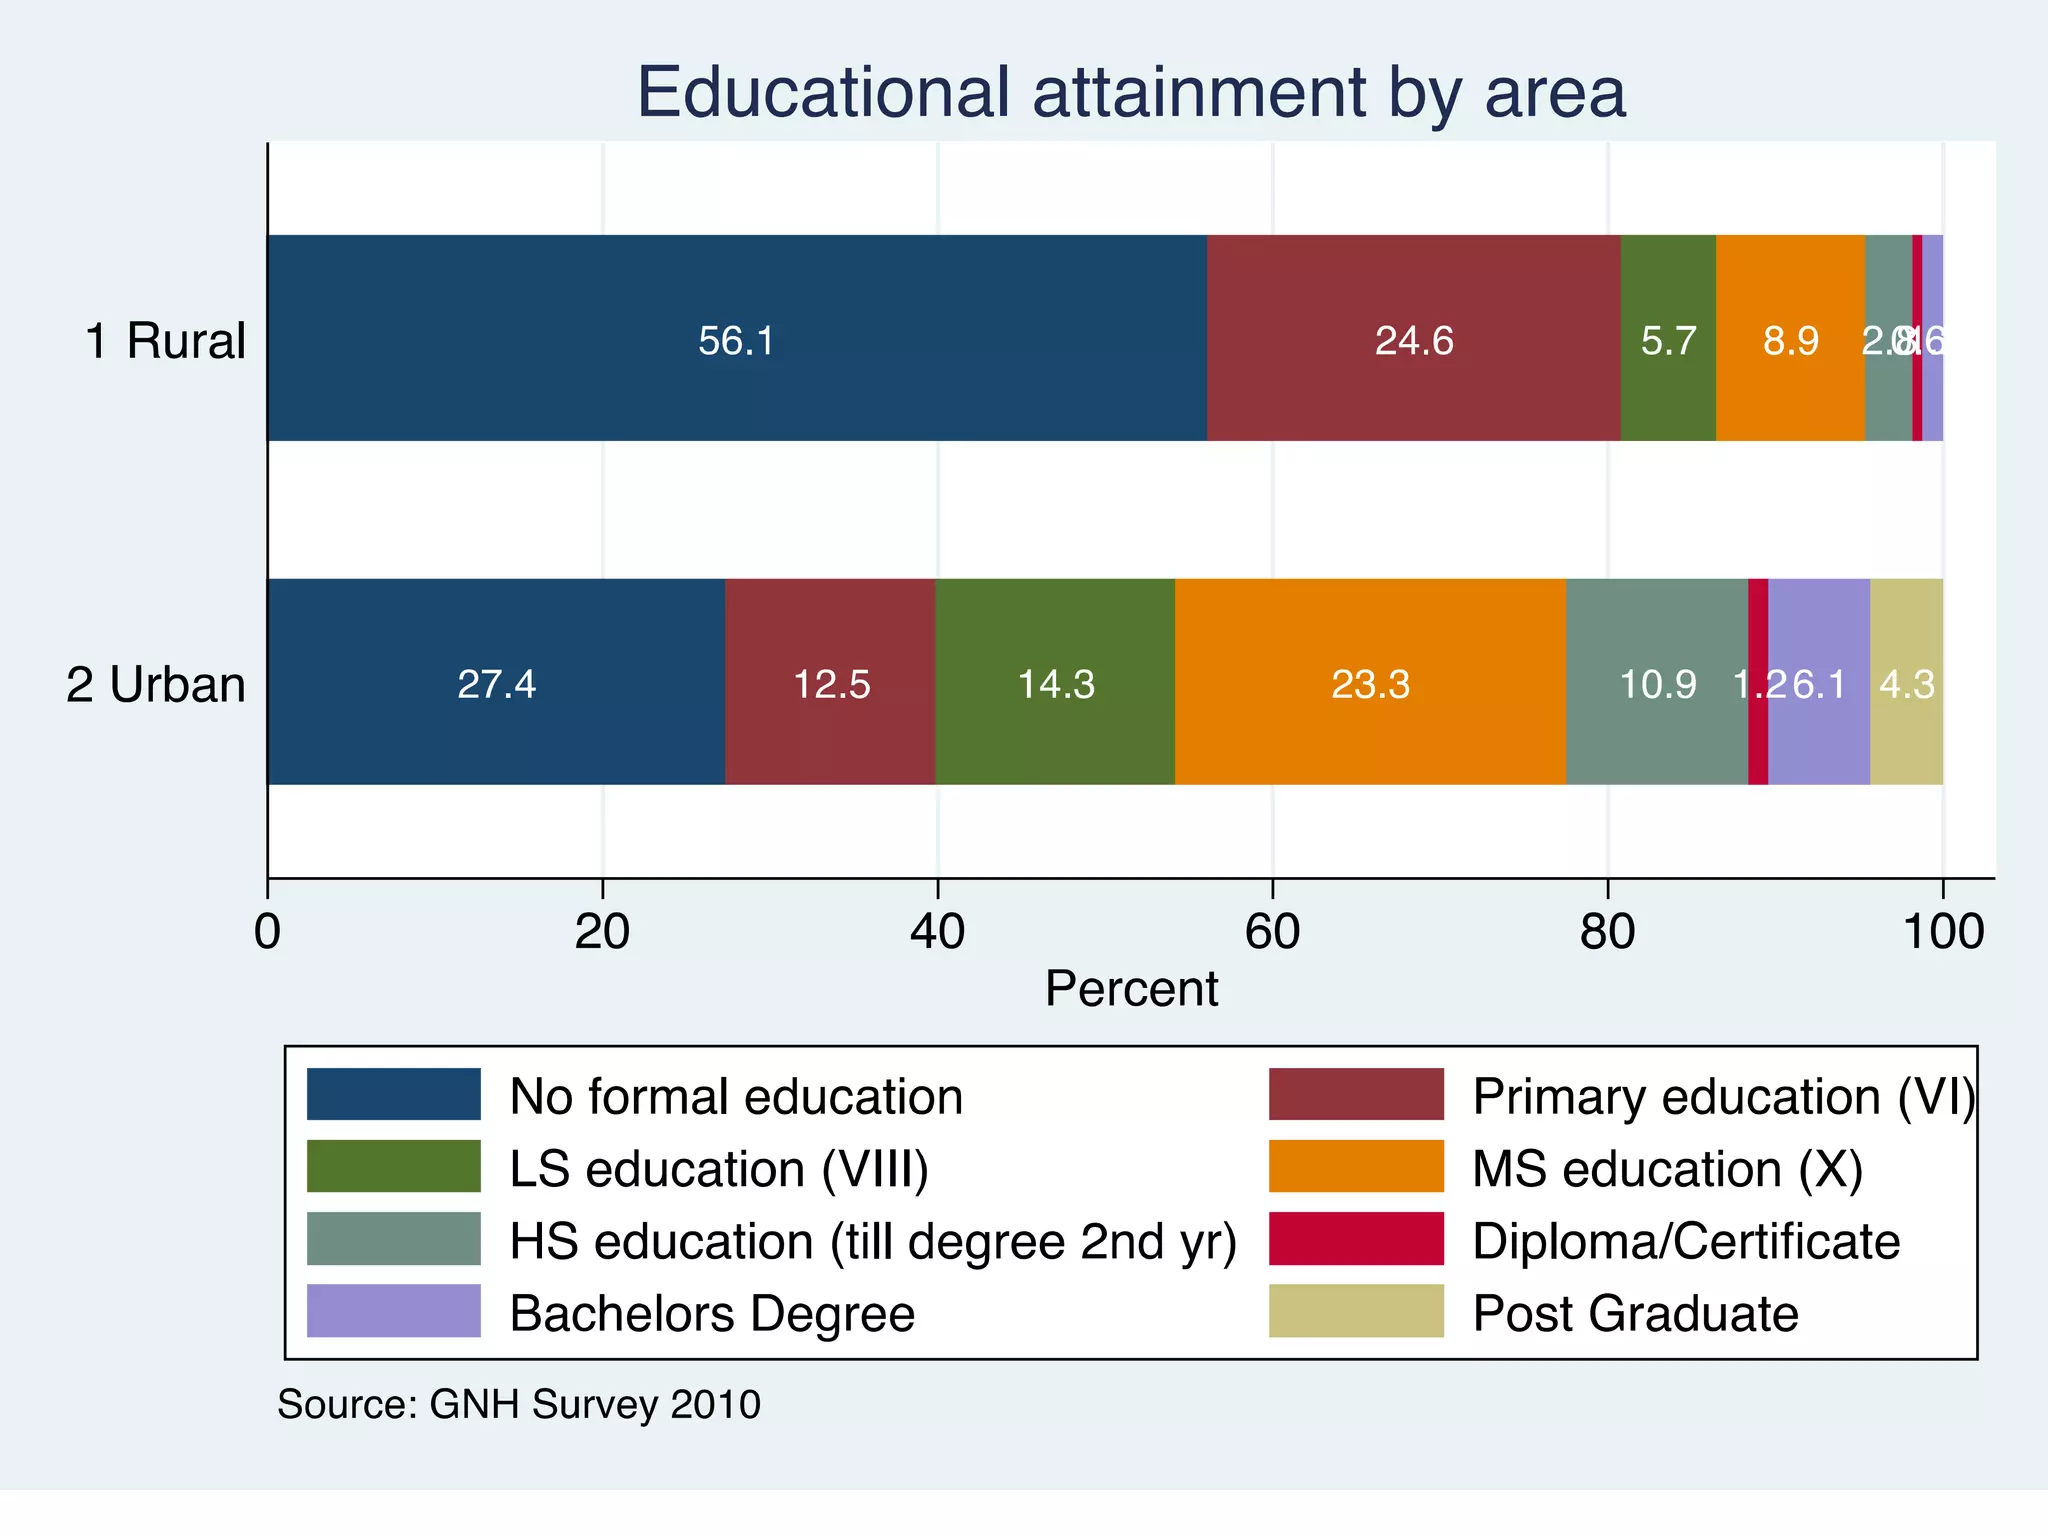
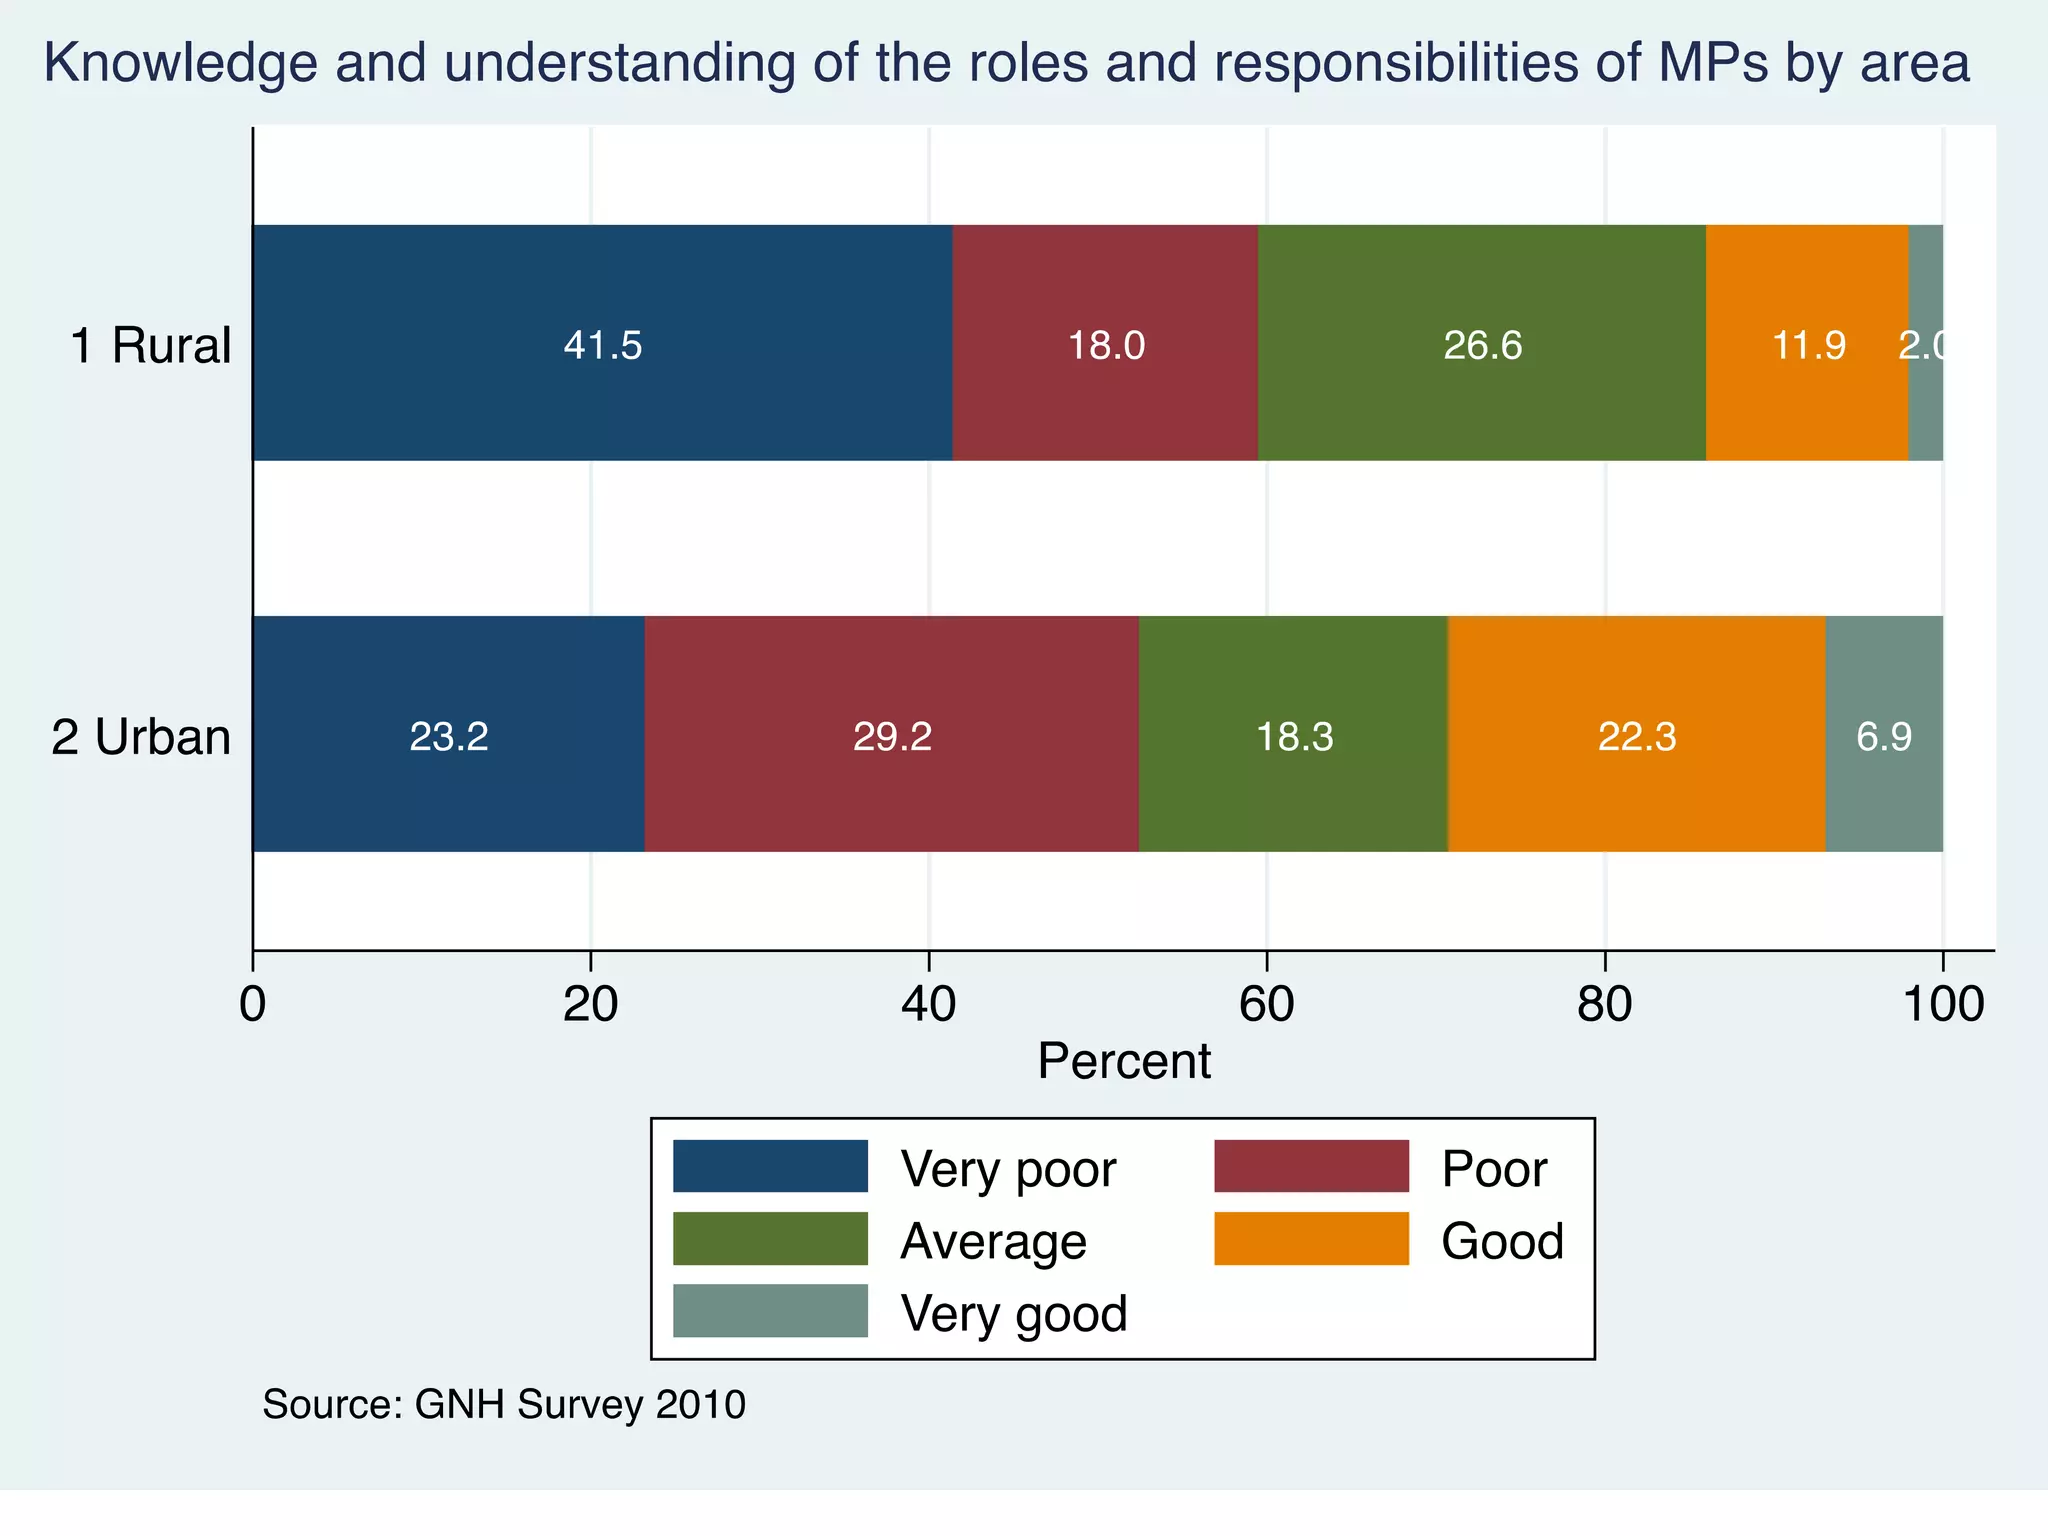
This document summarizes survey findings from 2010 on GNH in Sarpang Dzongkhag, Bhutan. Key findings include:
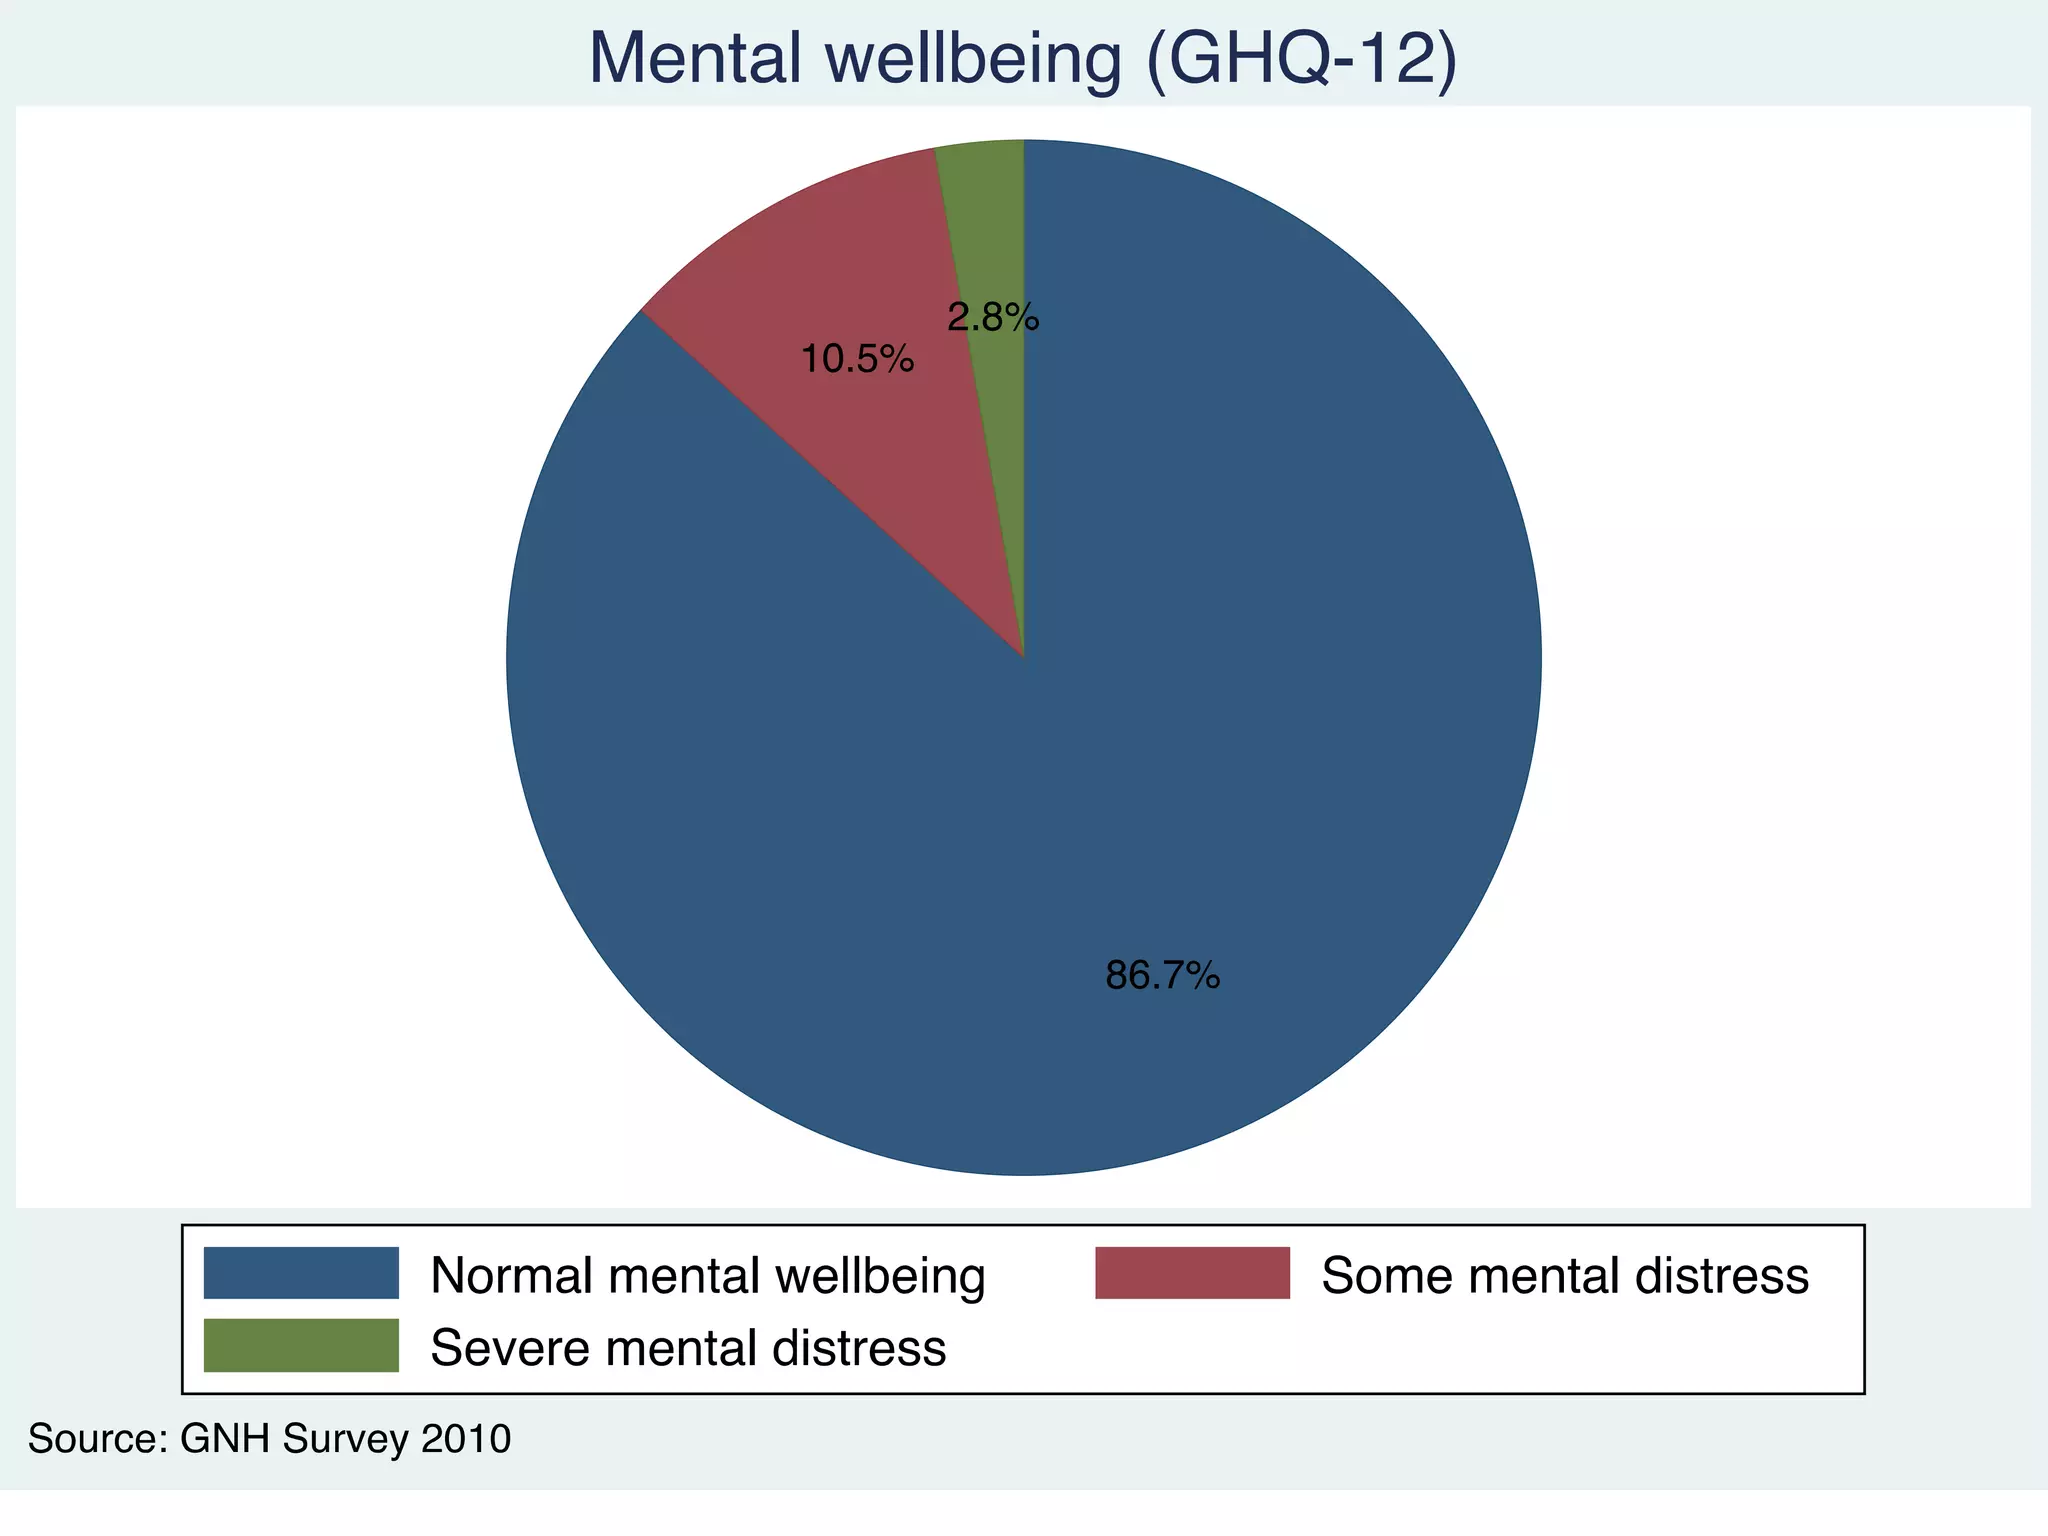
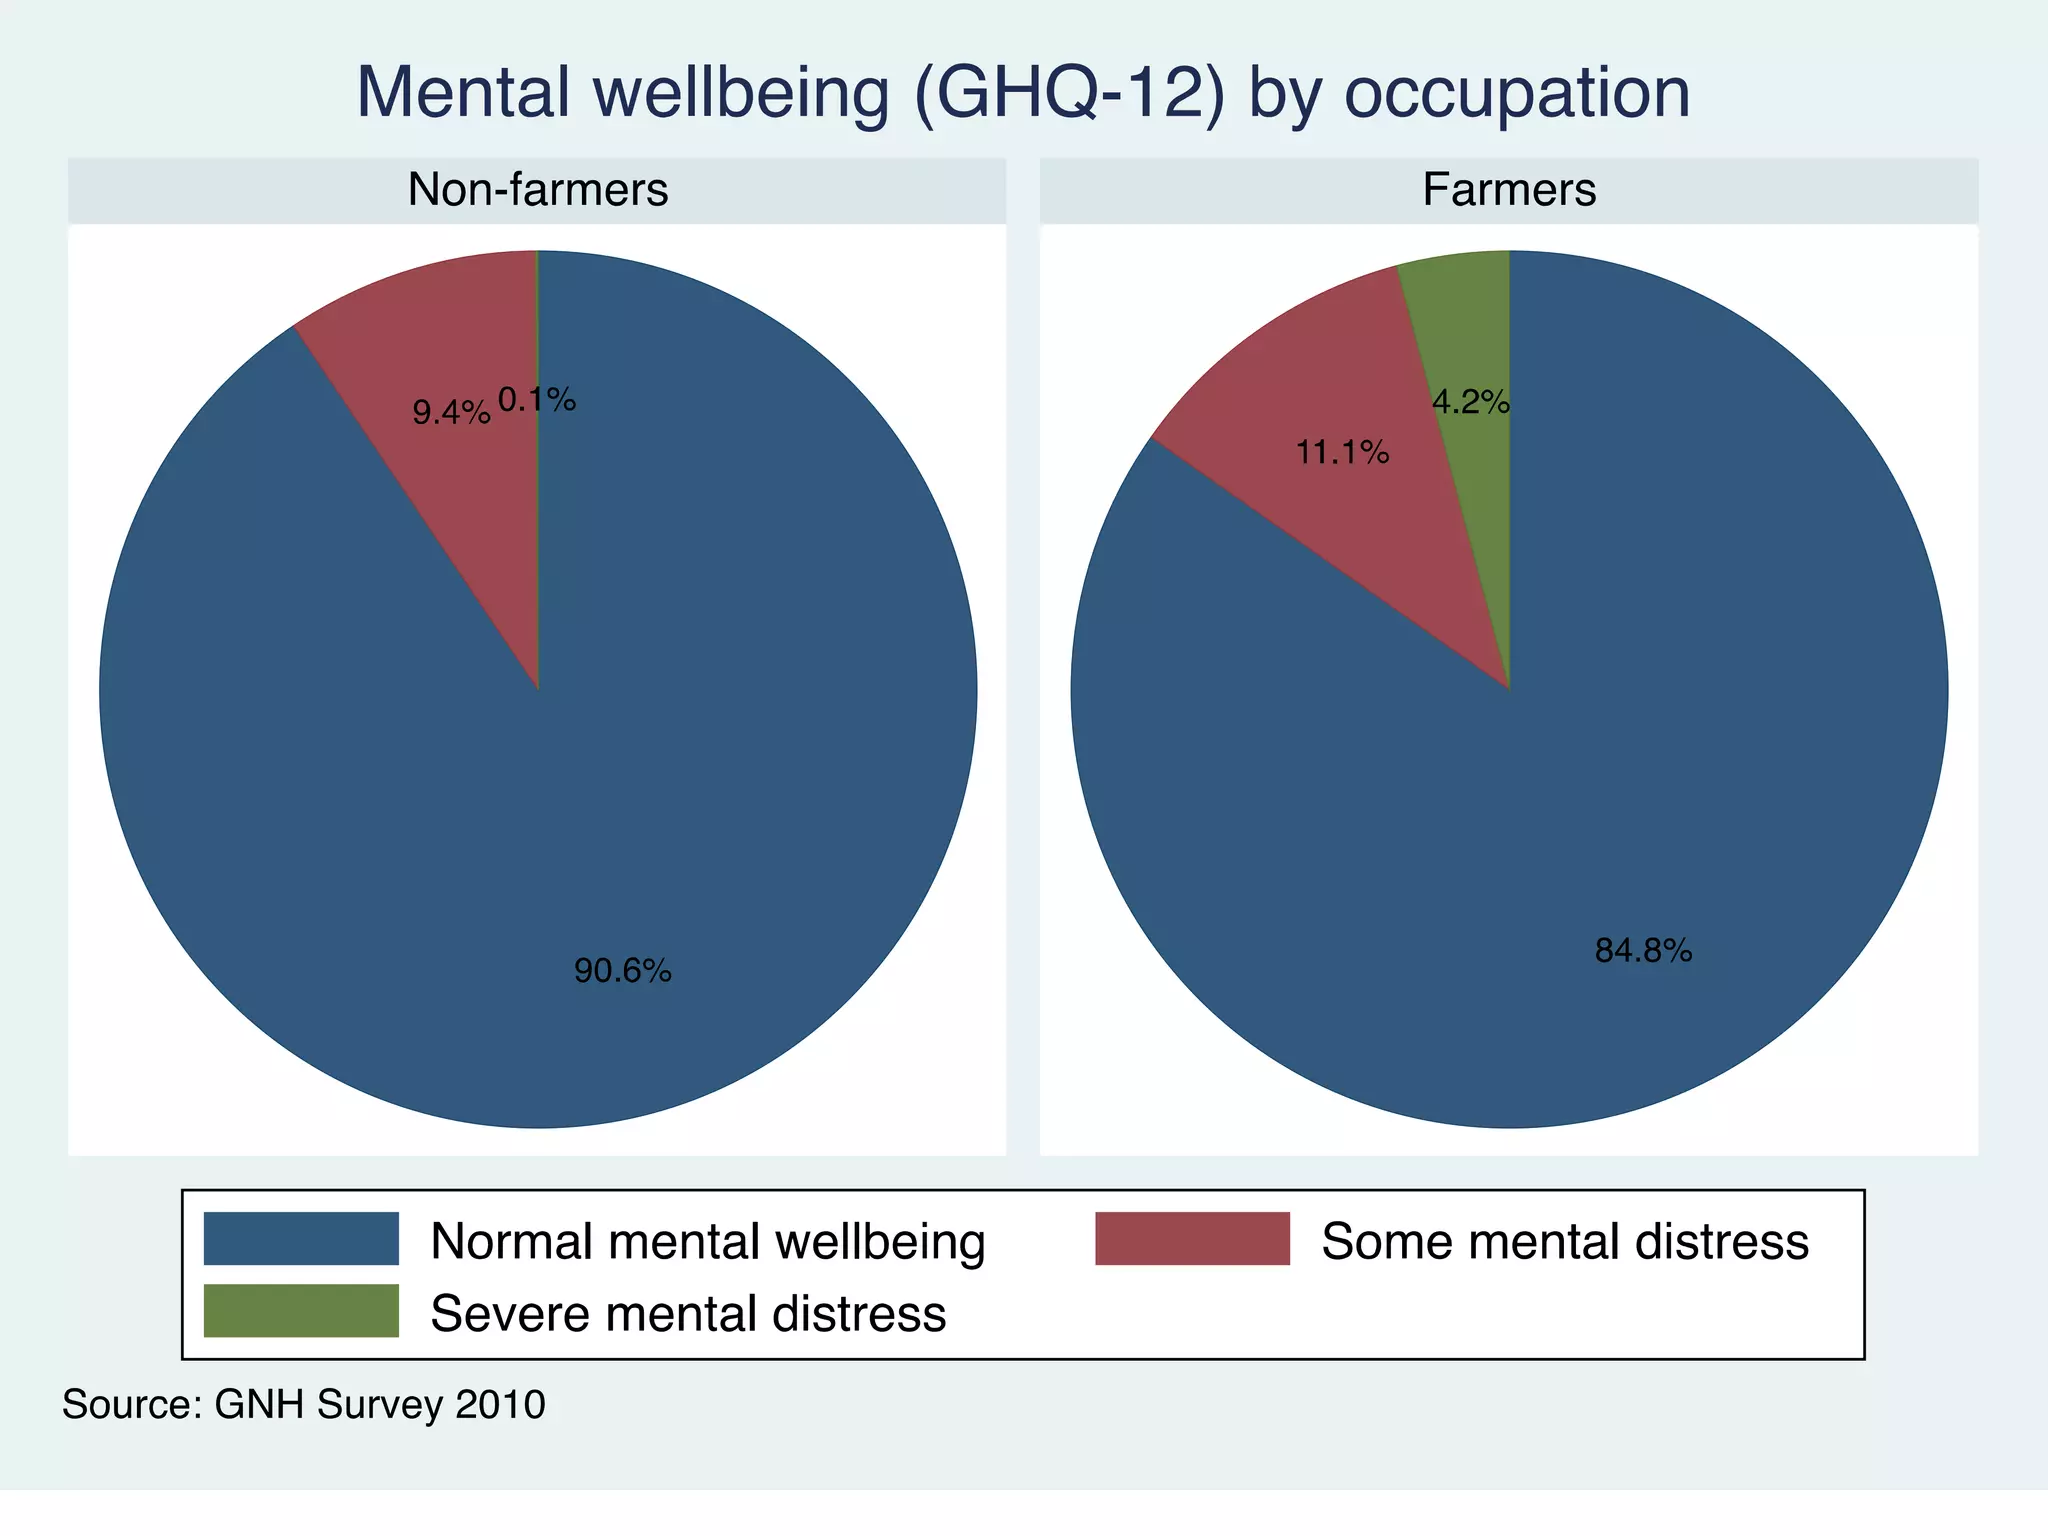
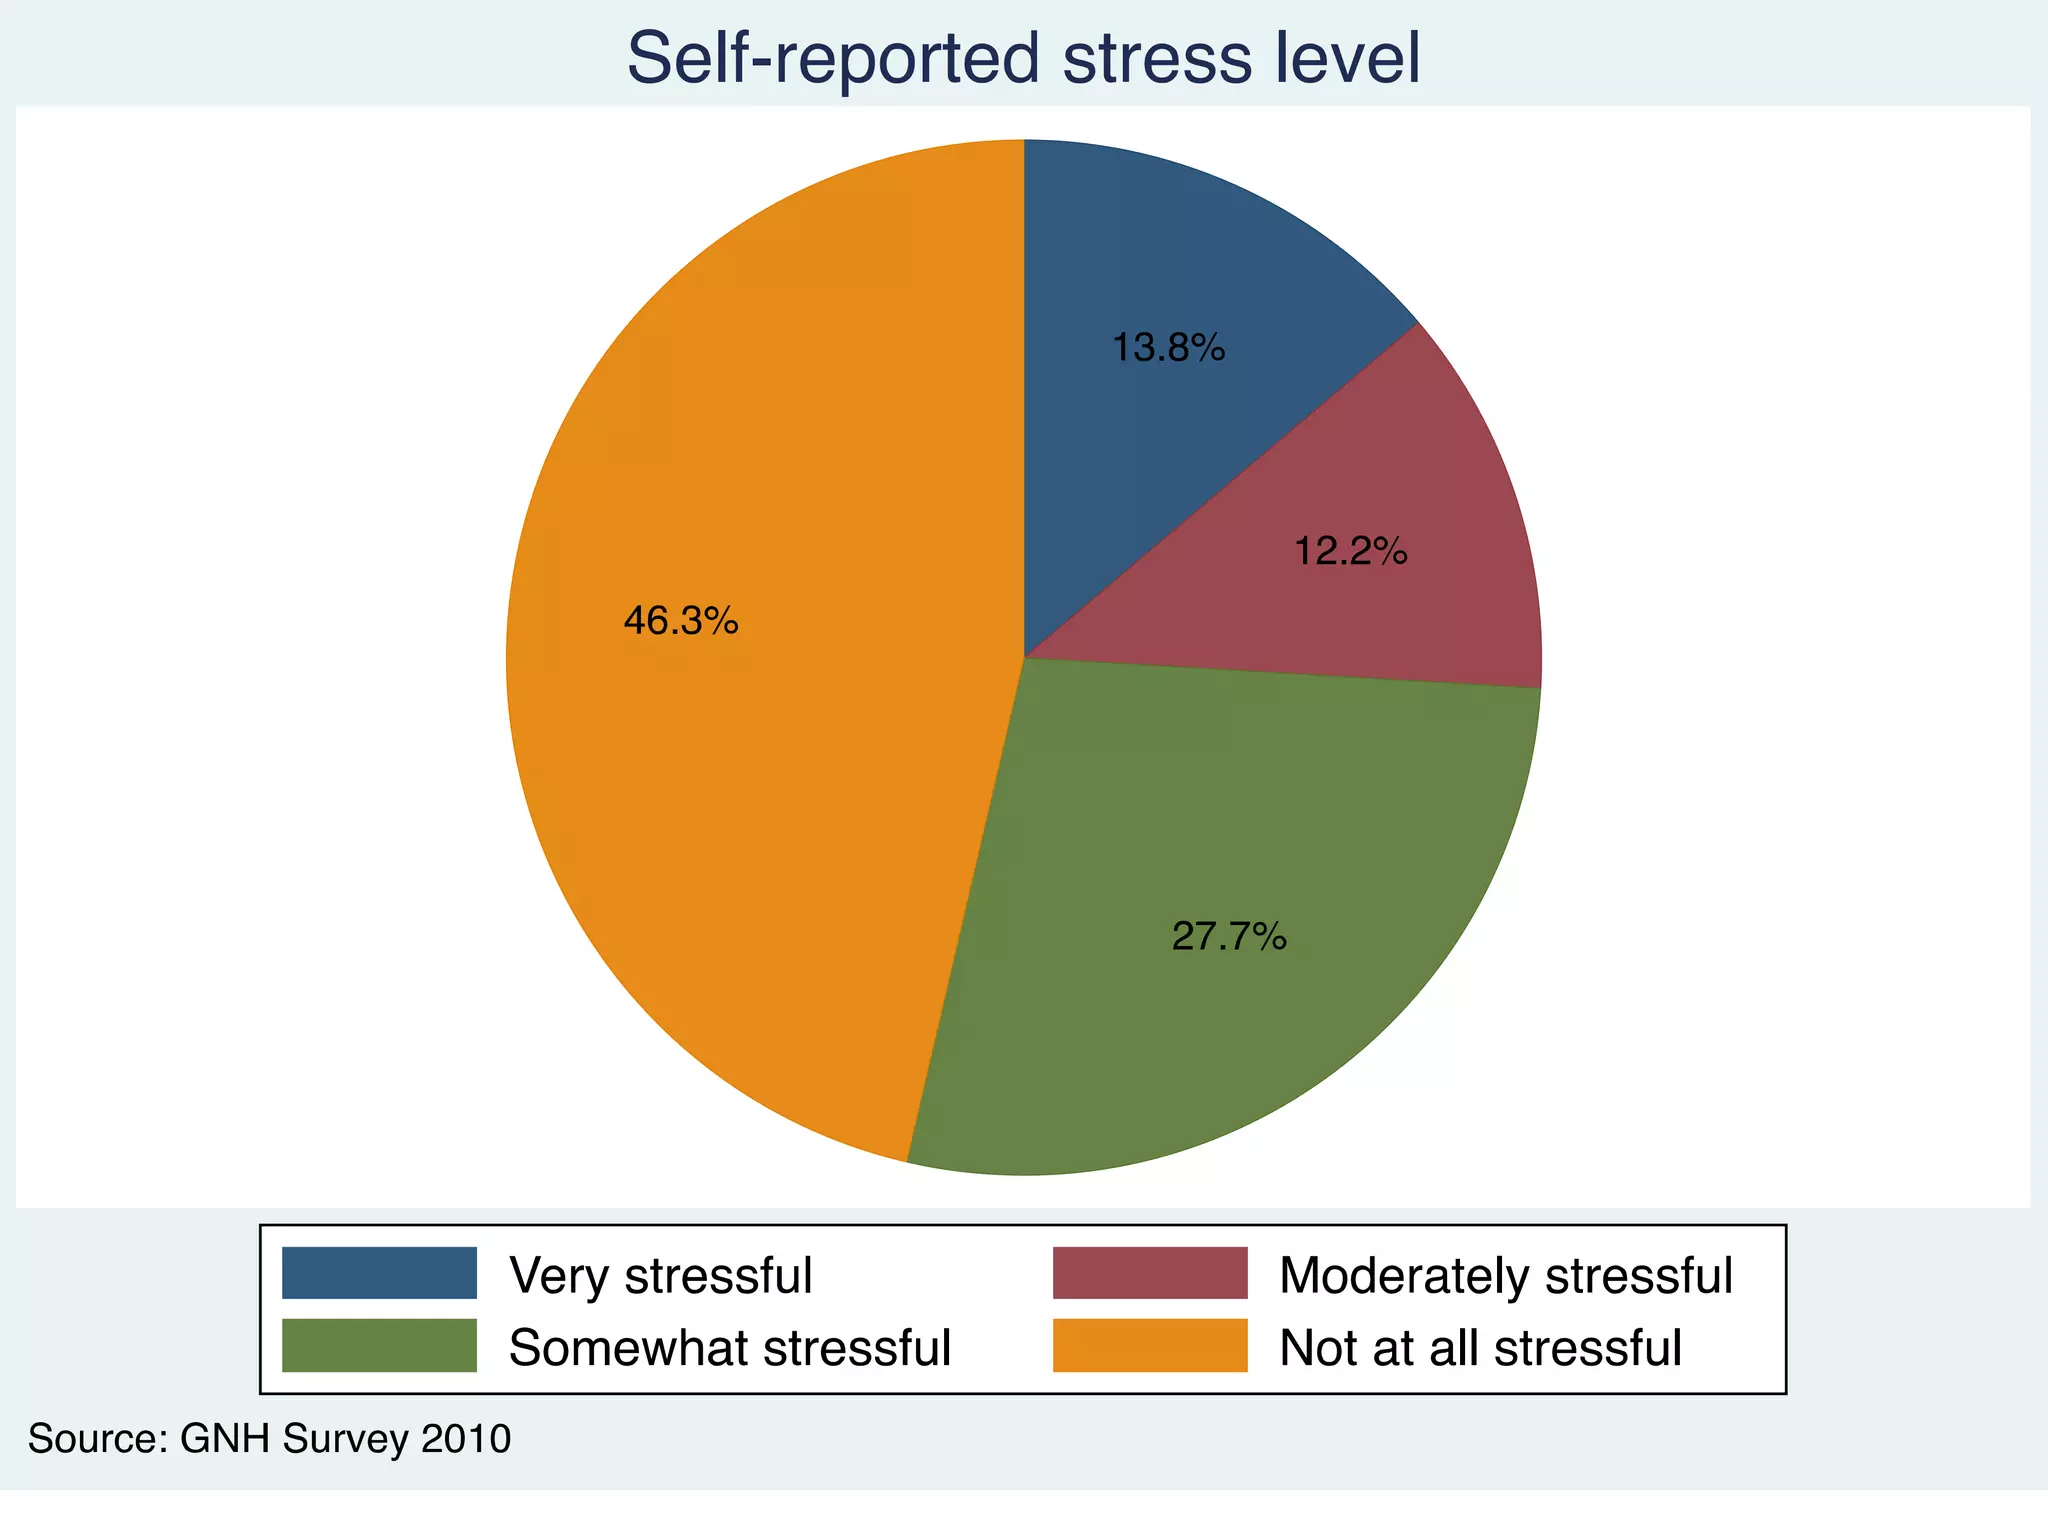
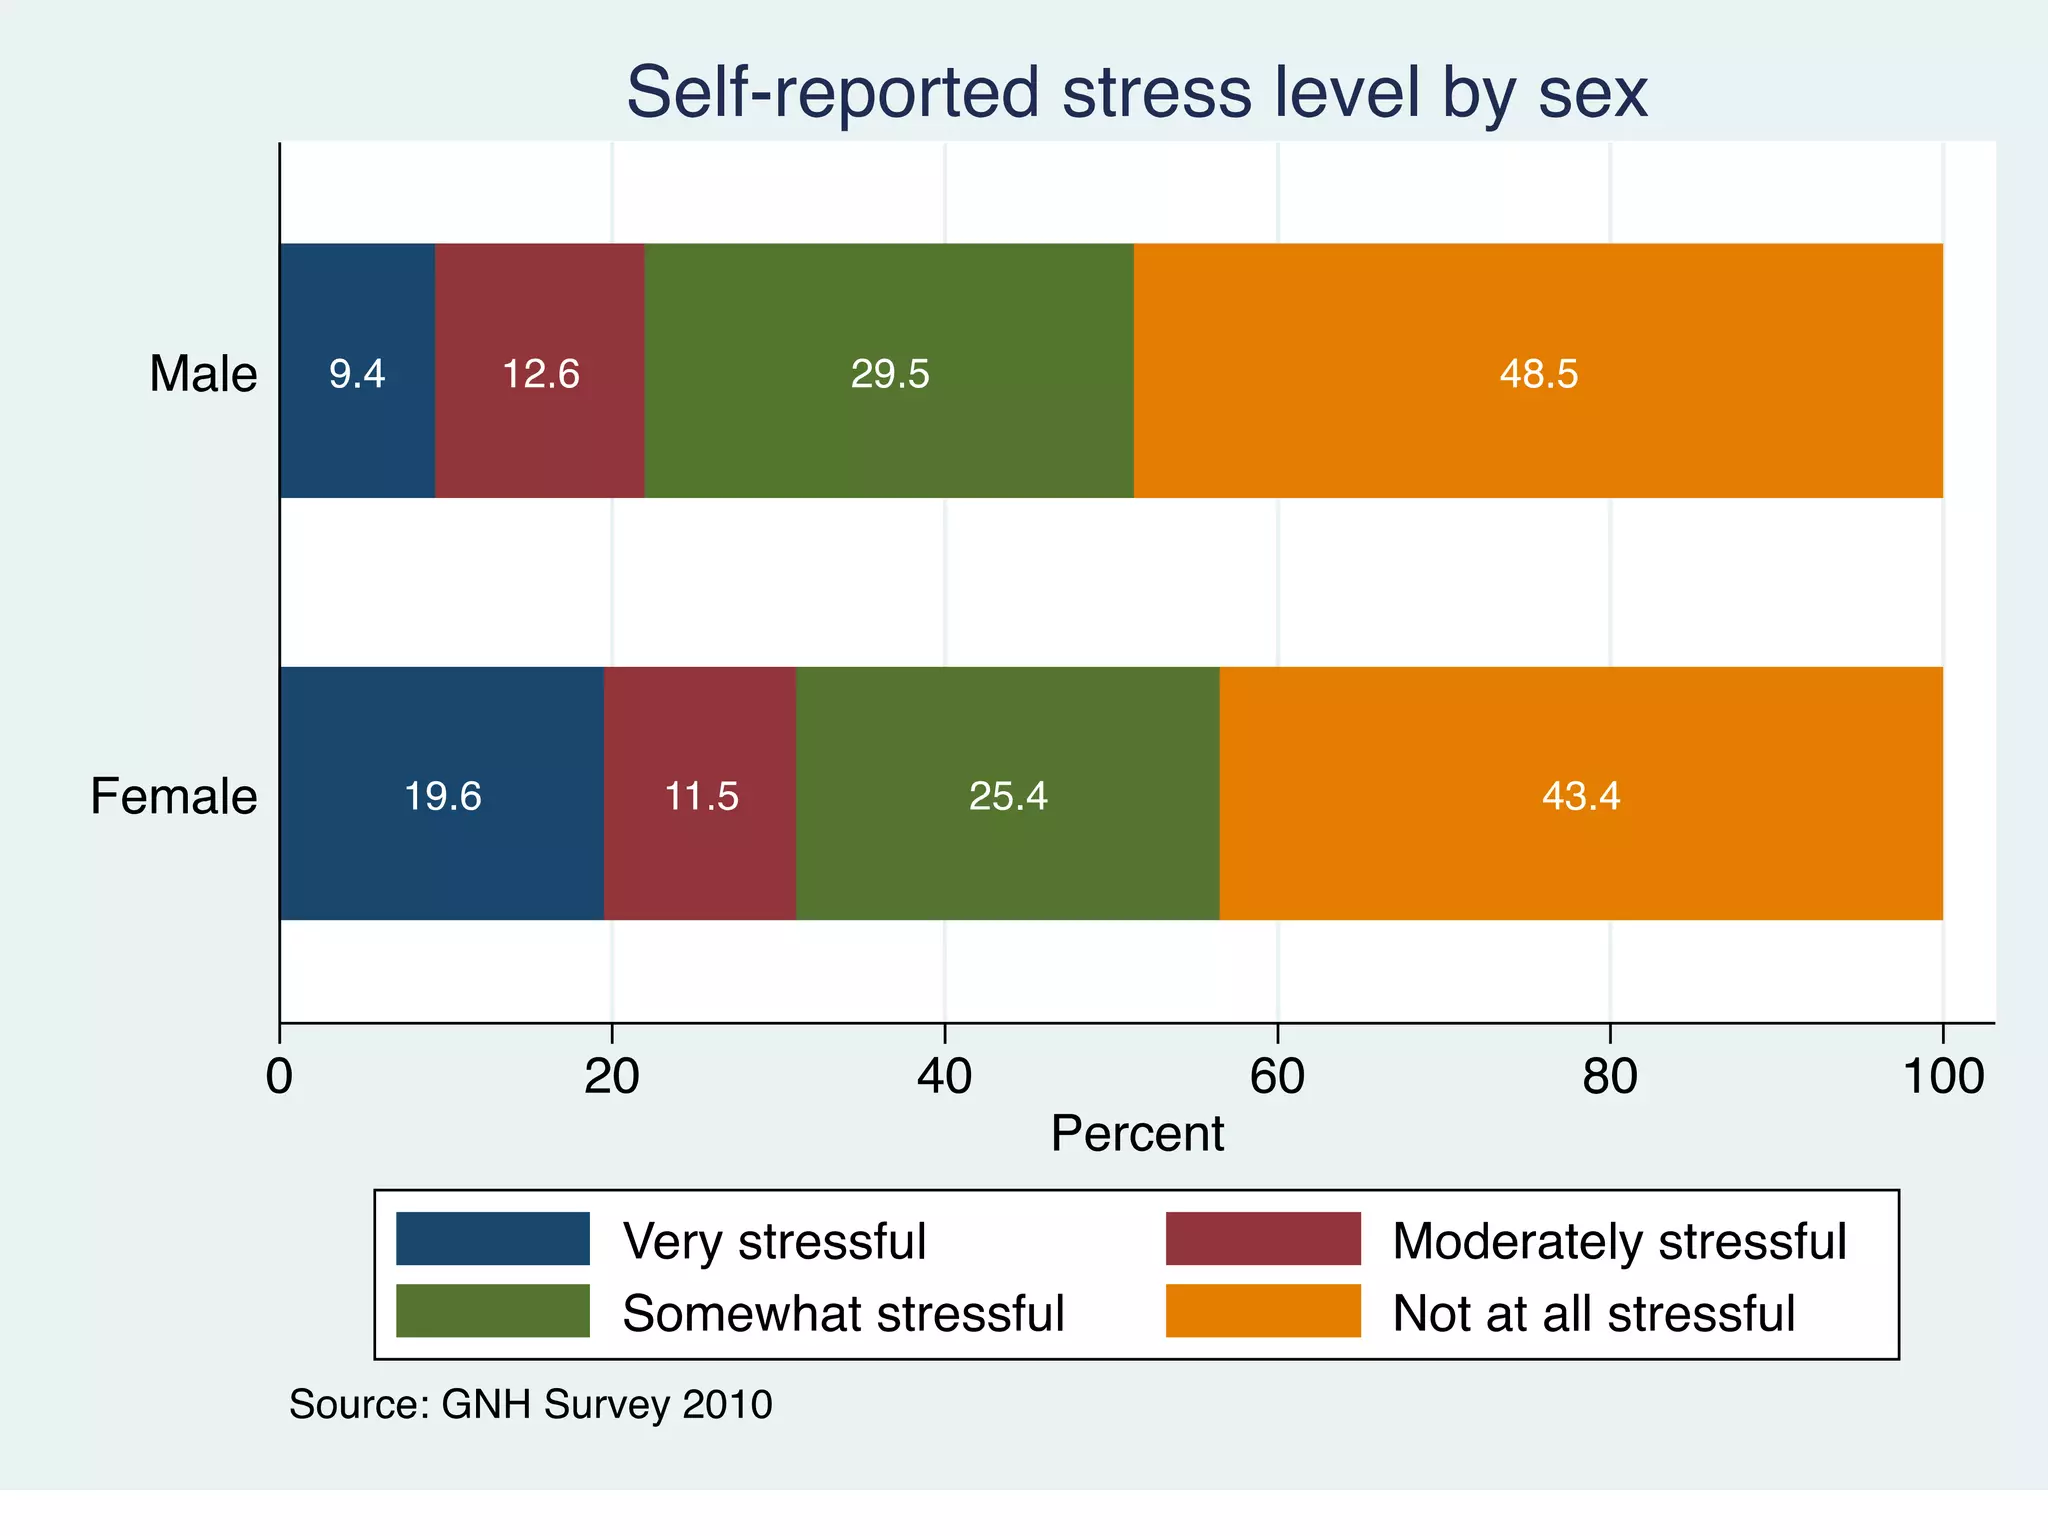
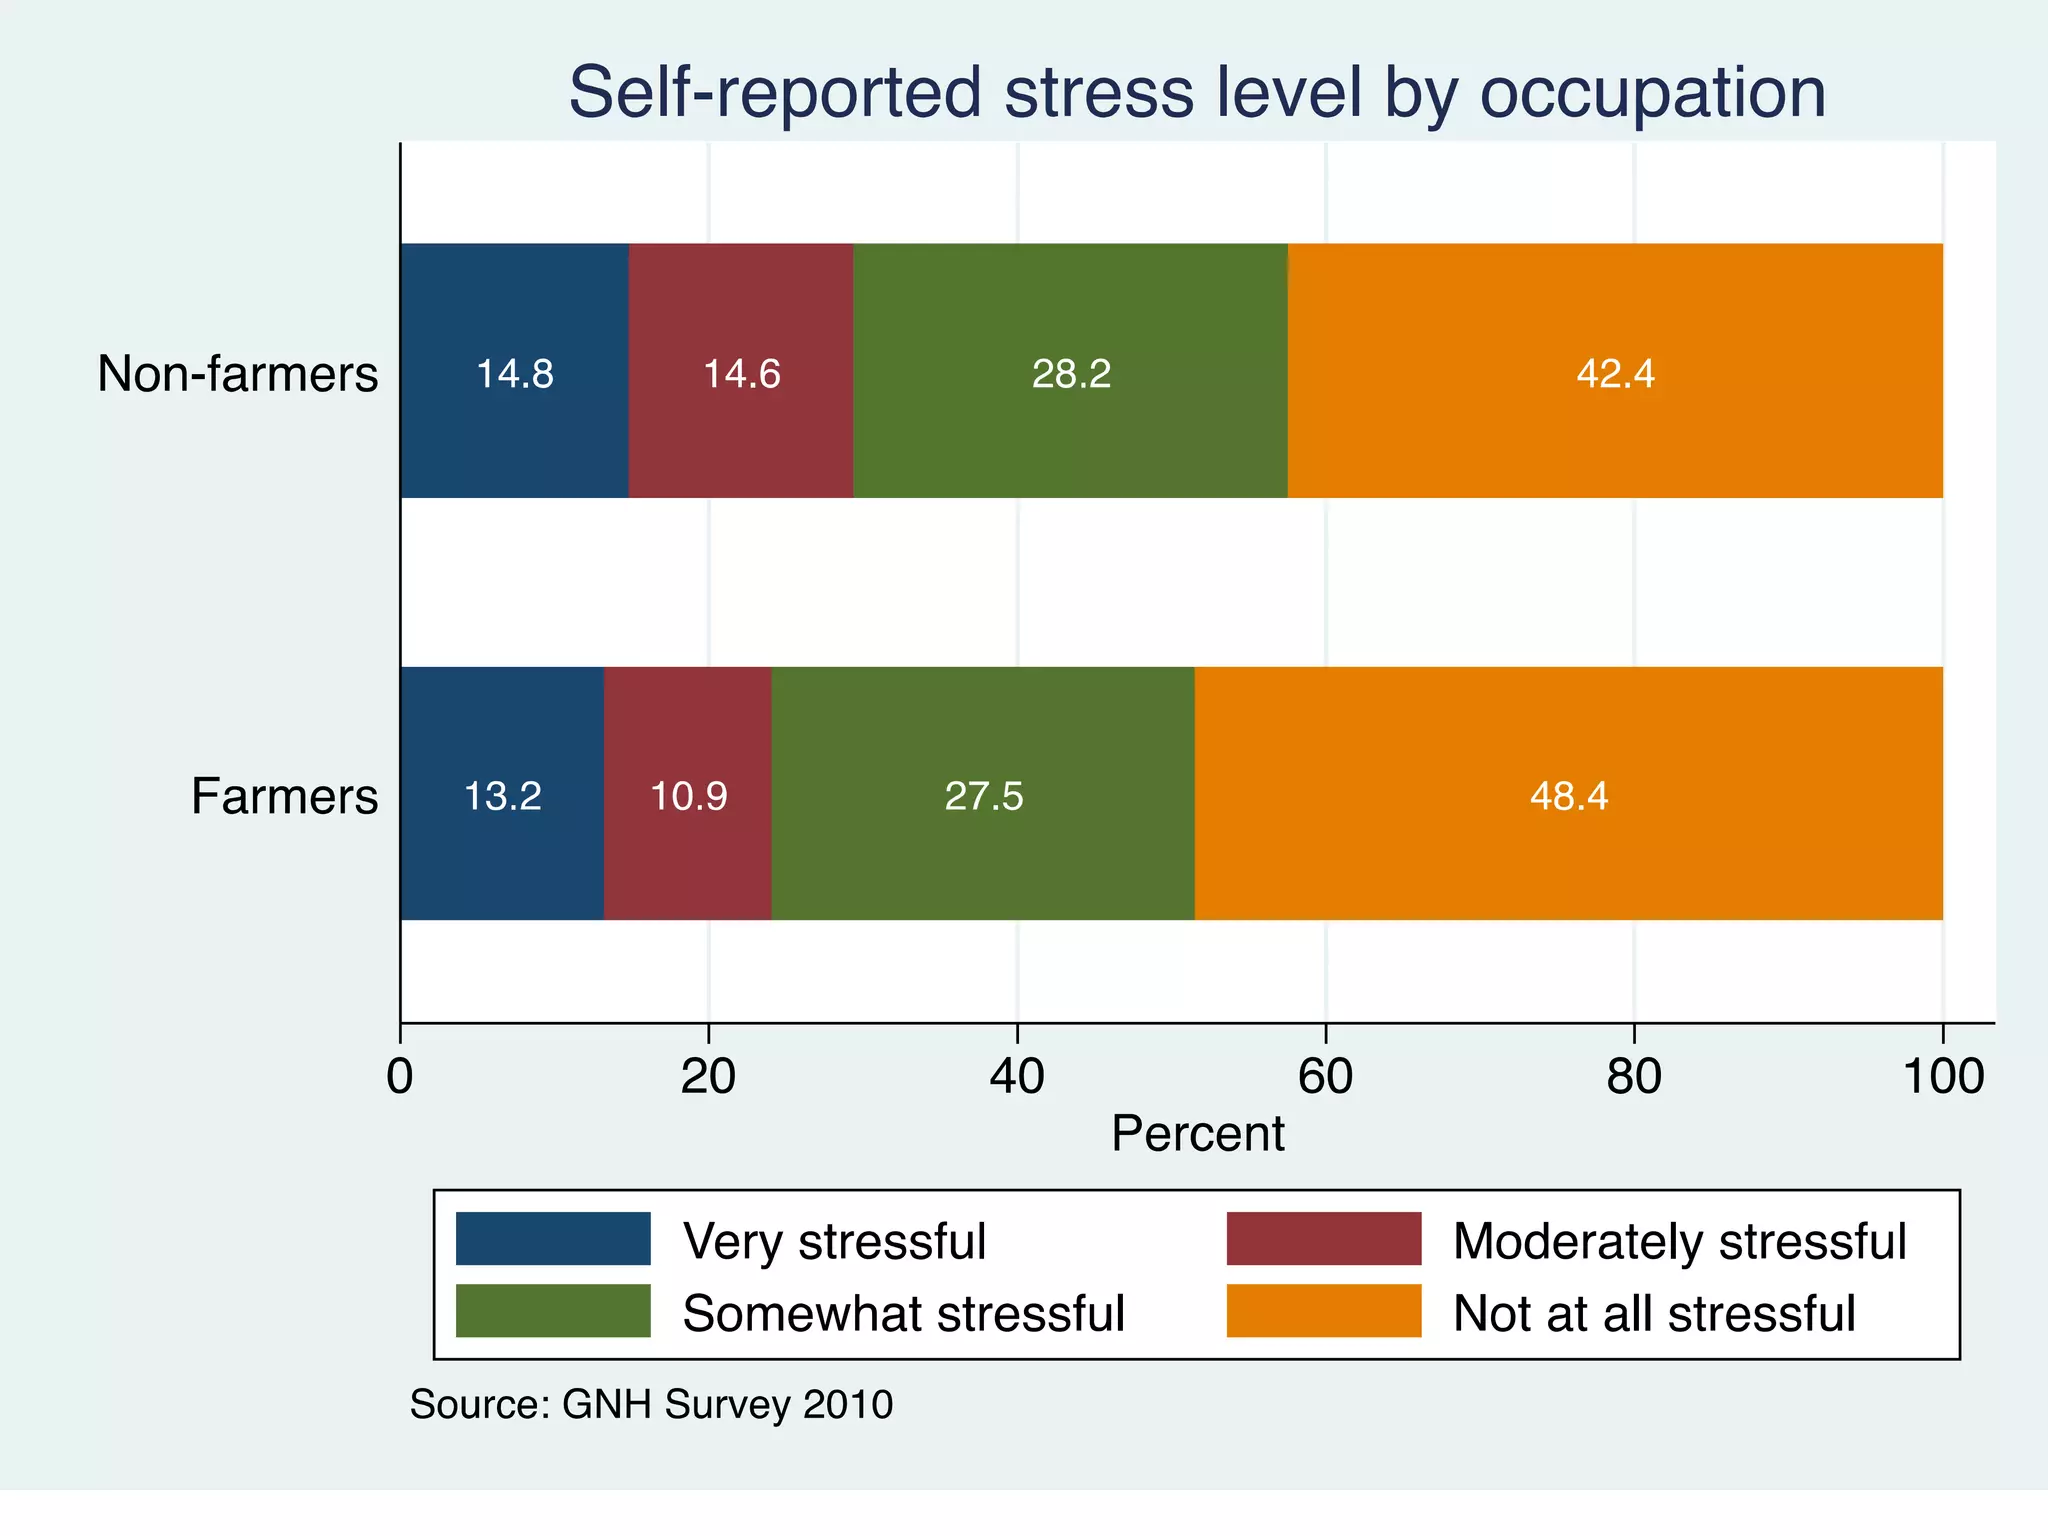
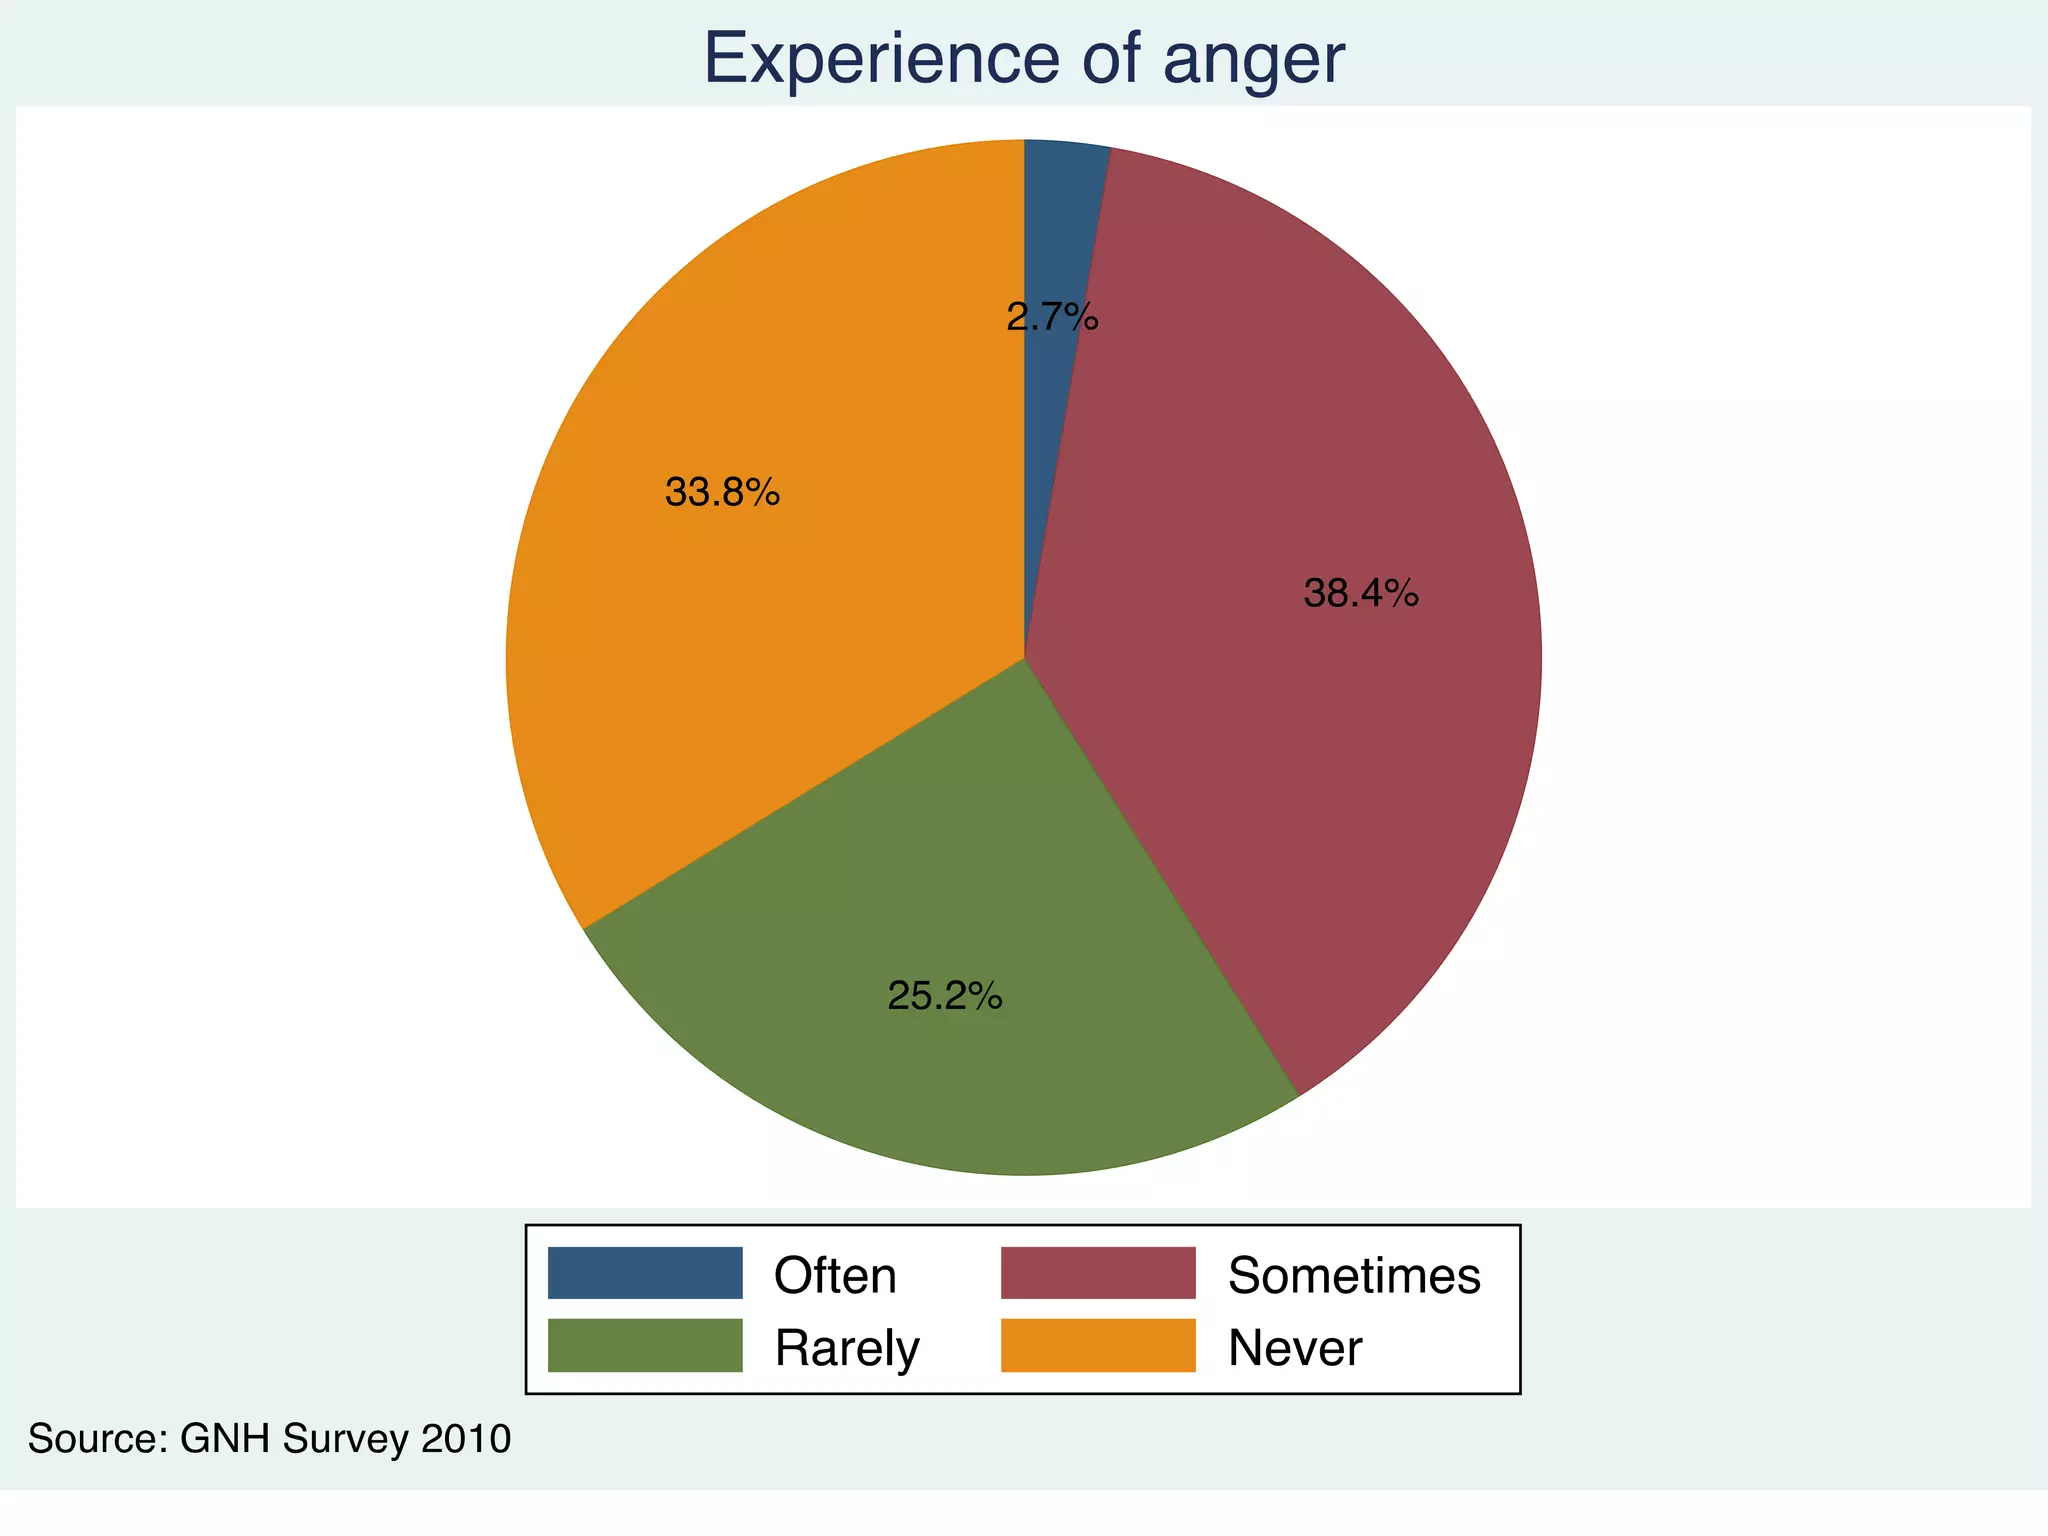
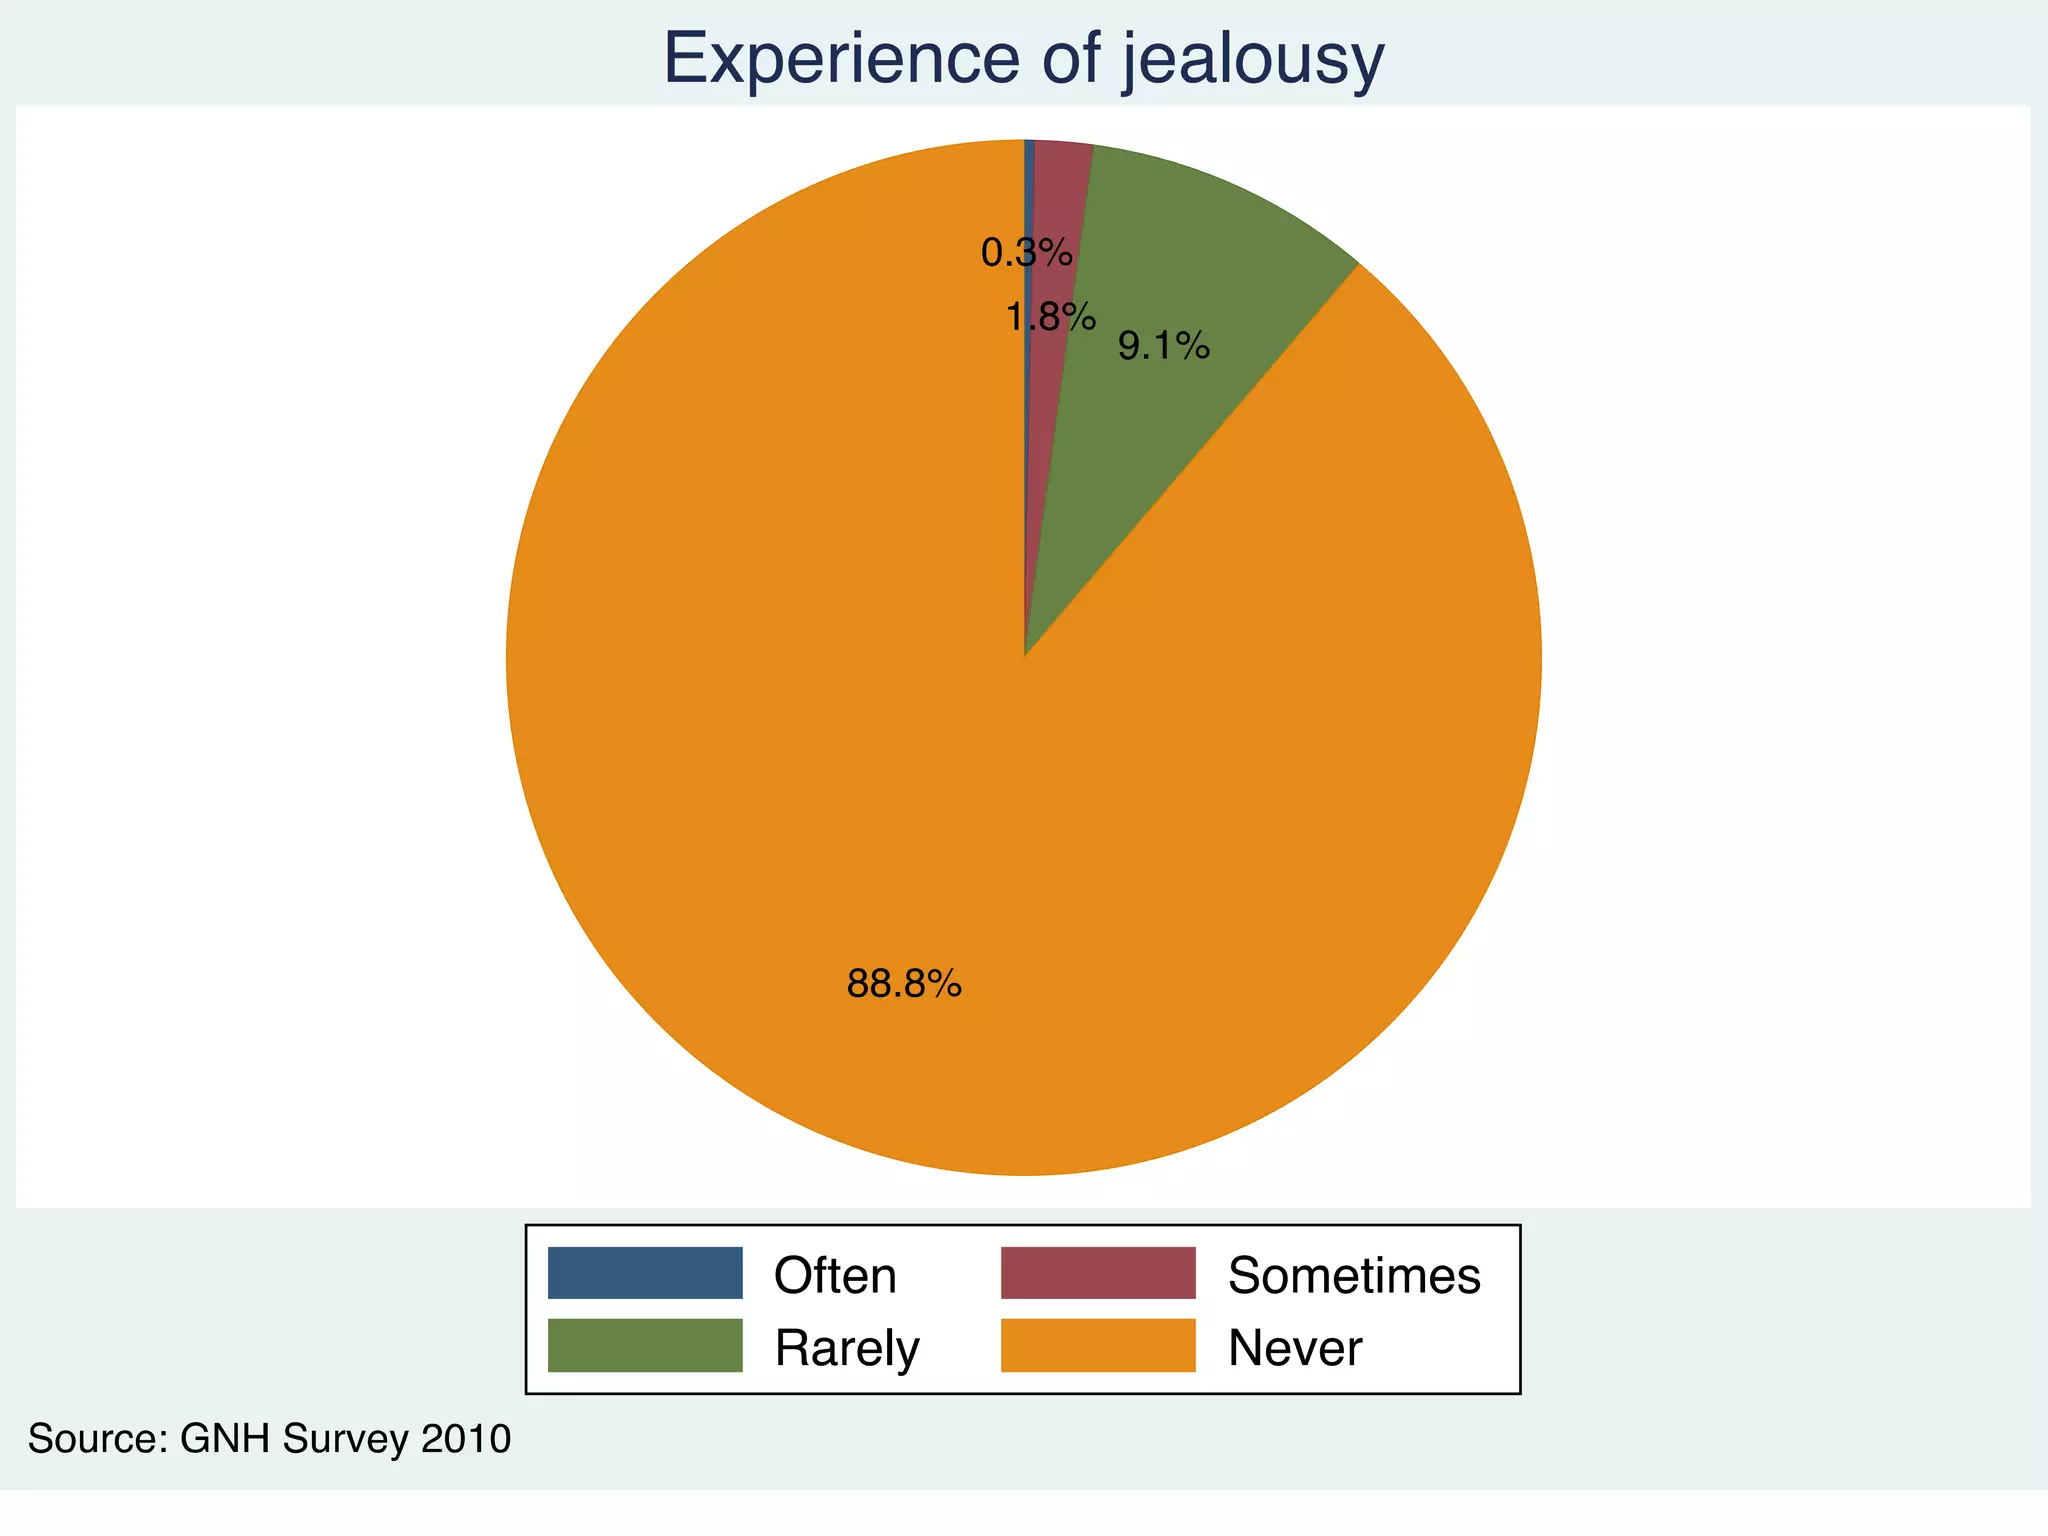
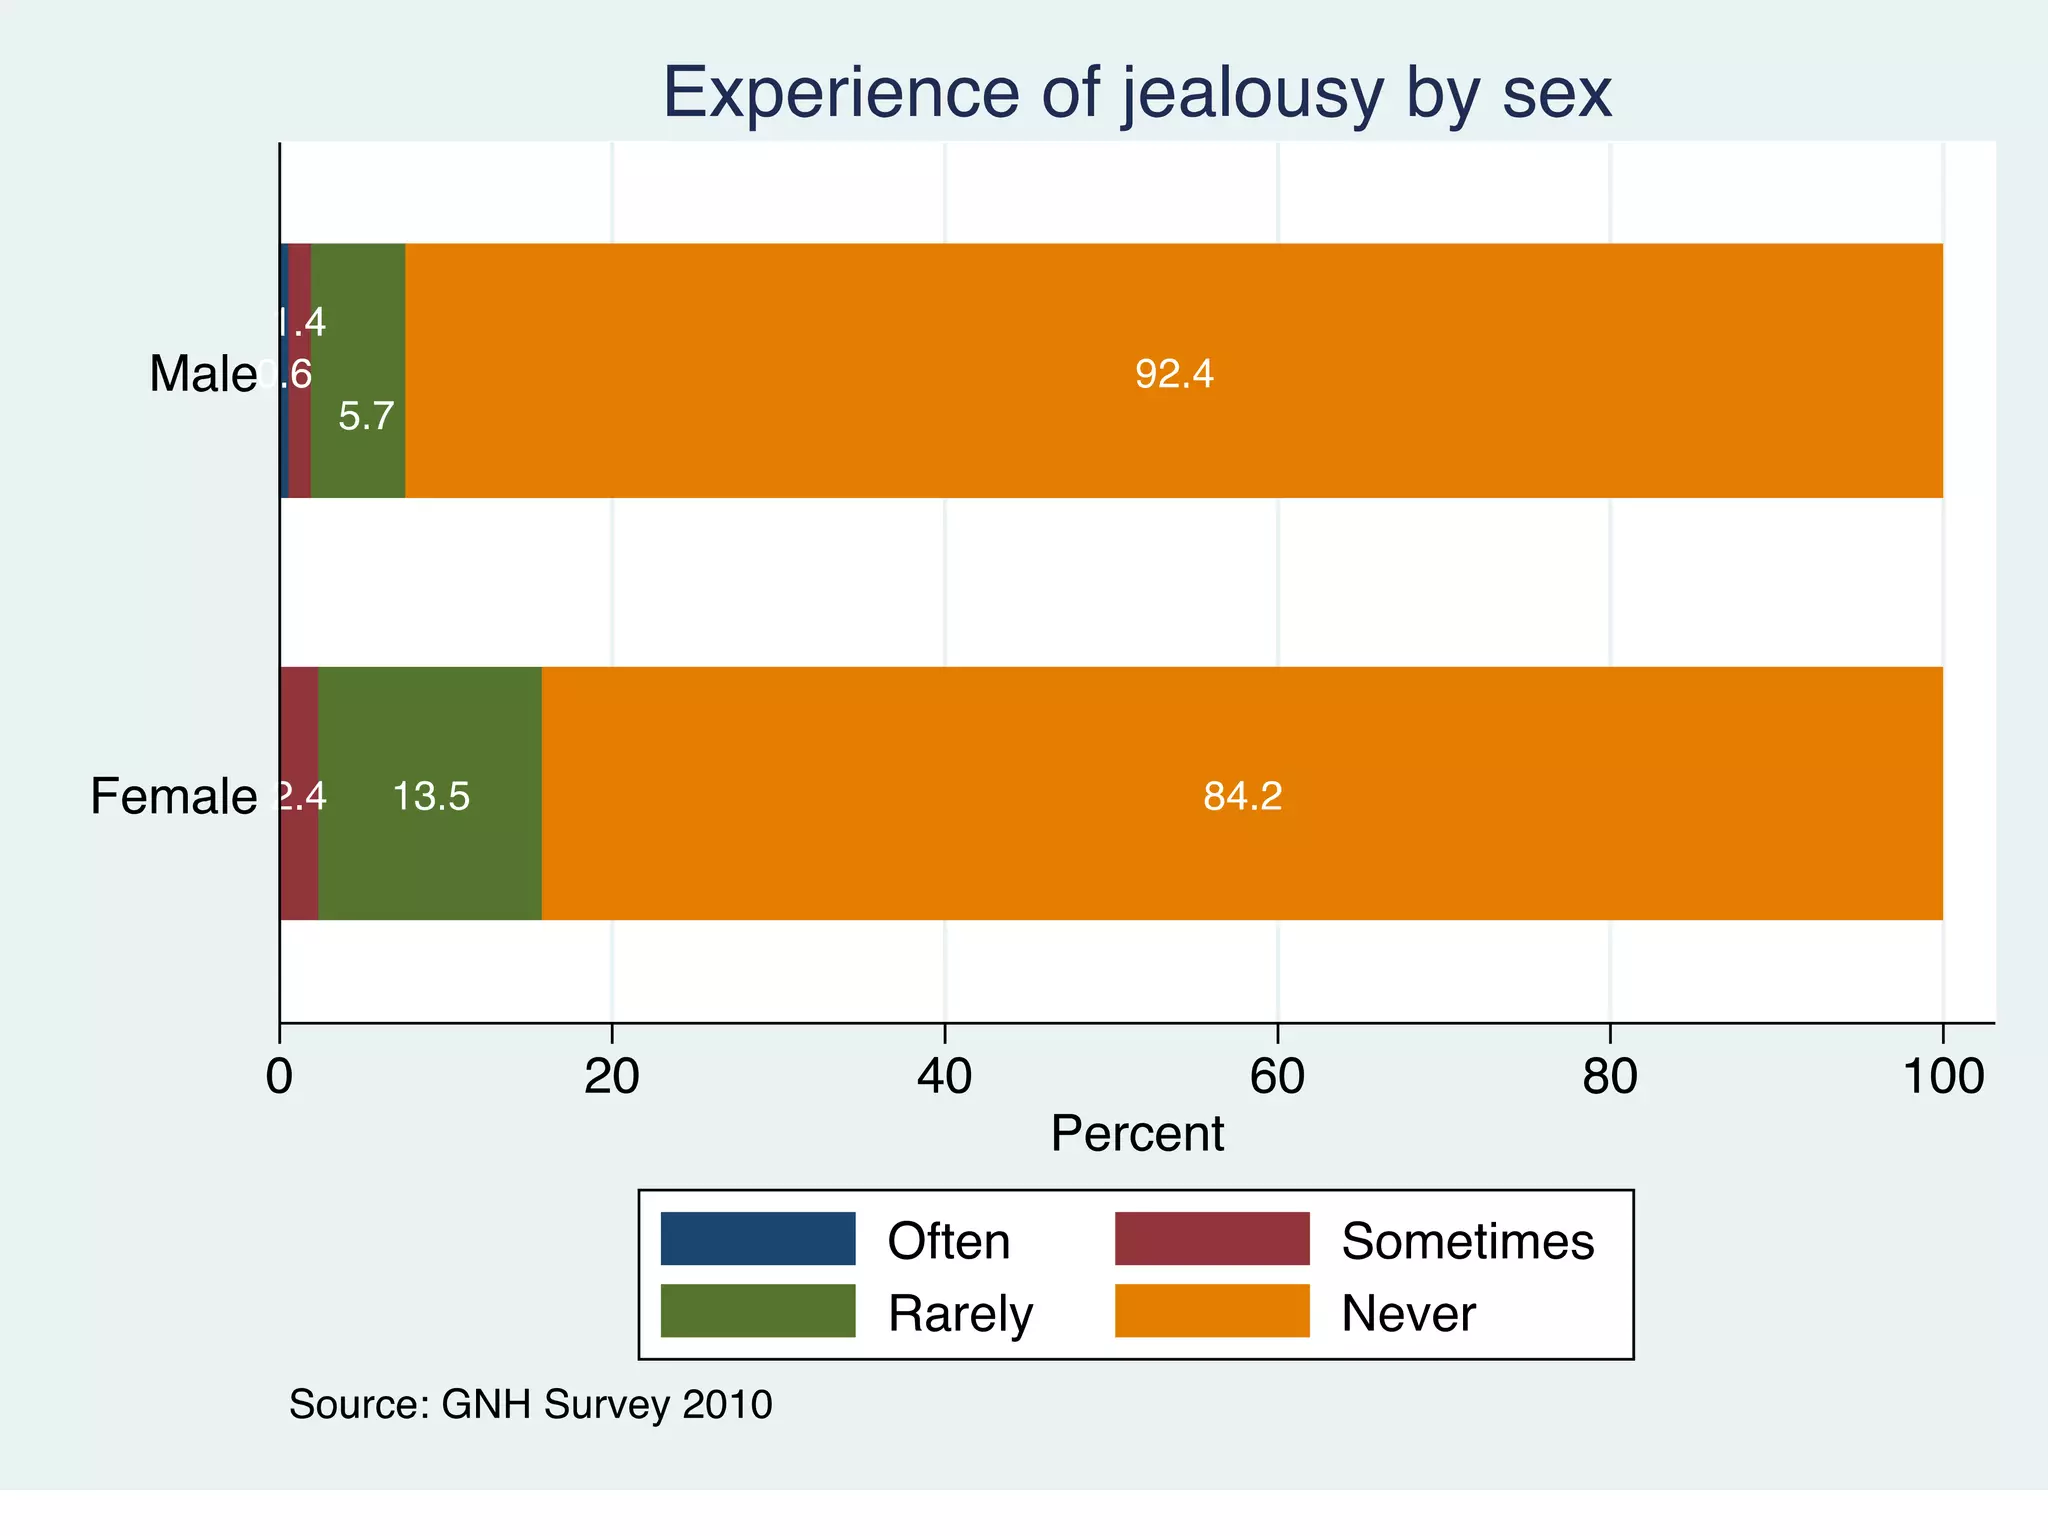
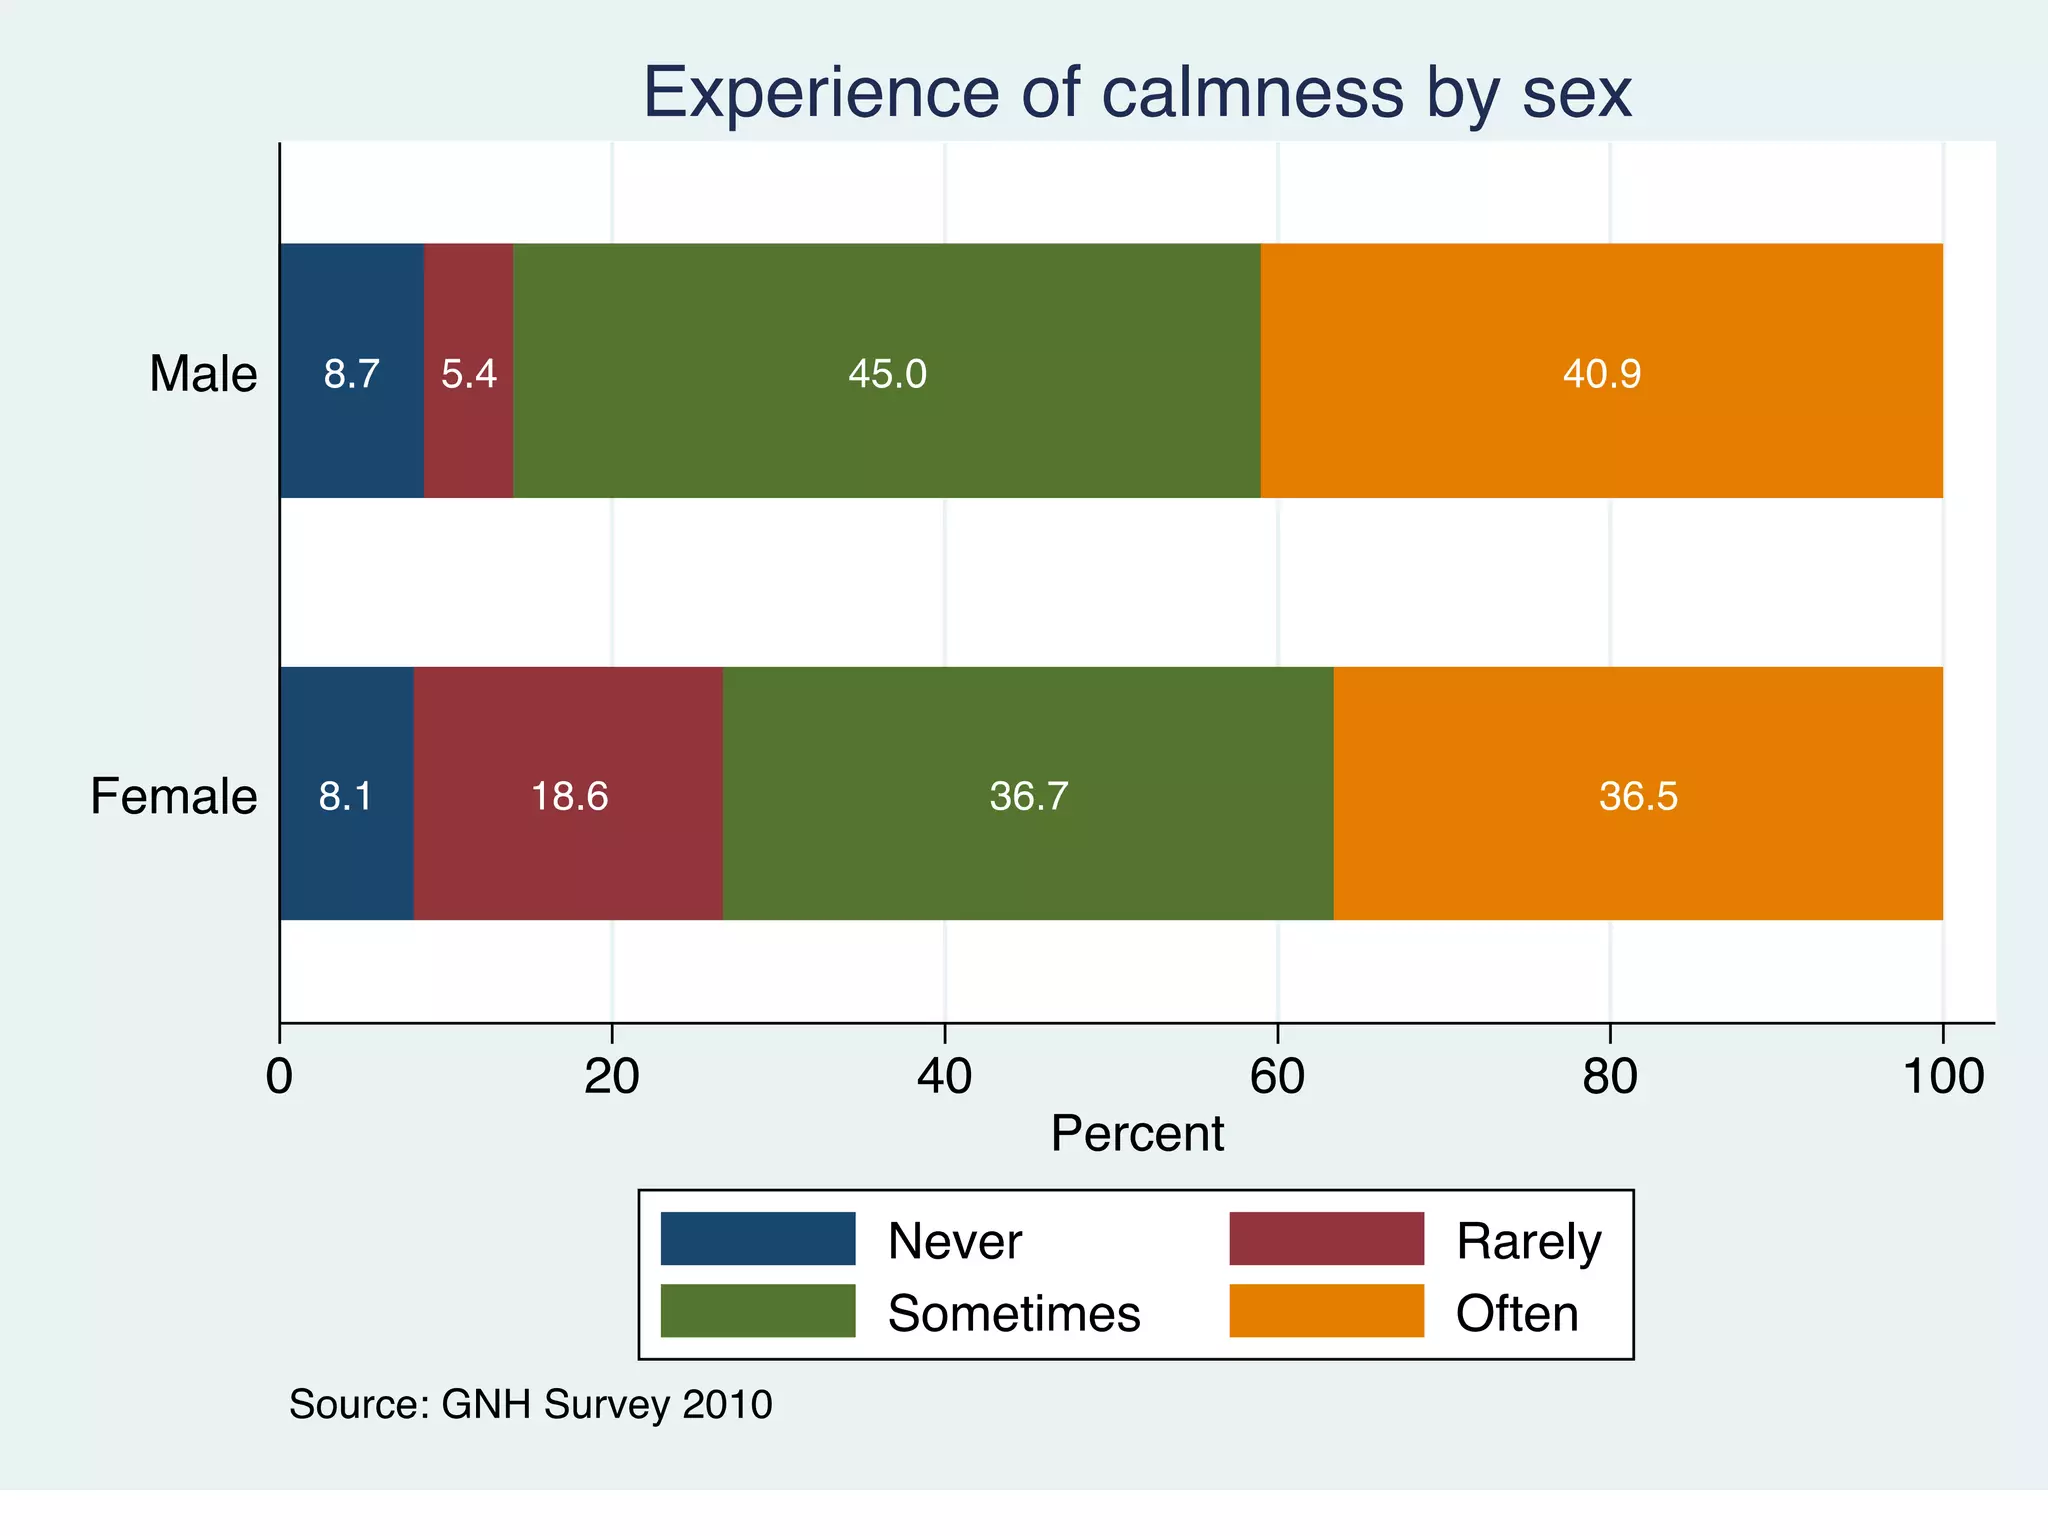
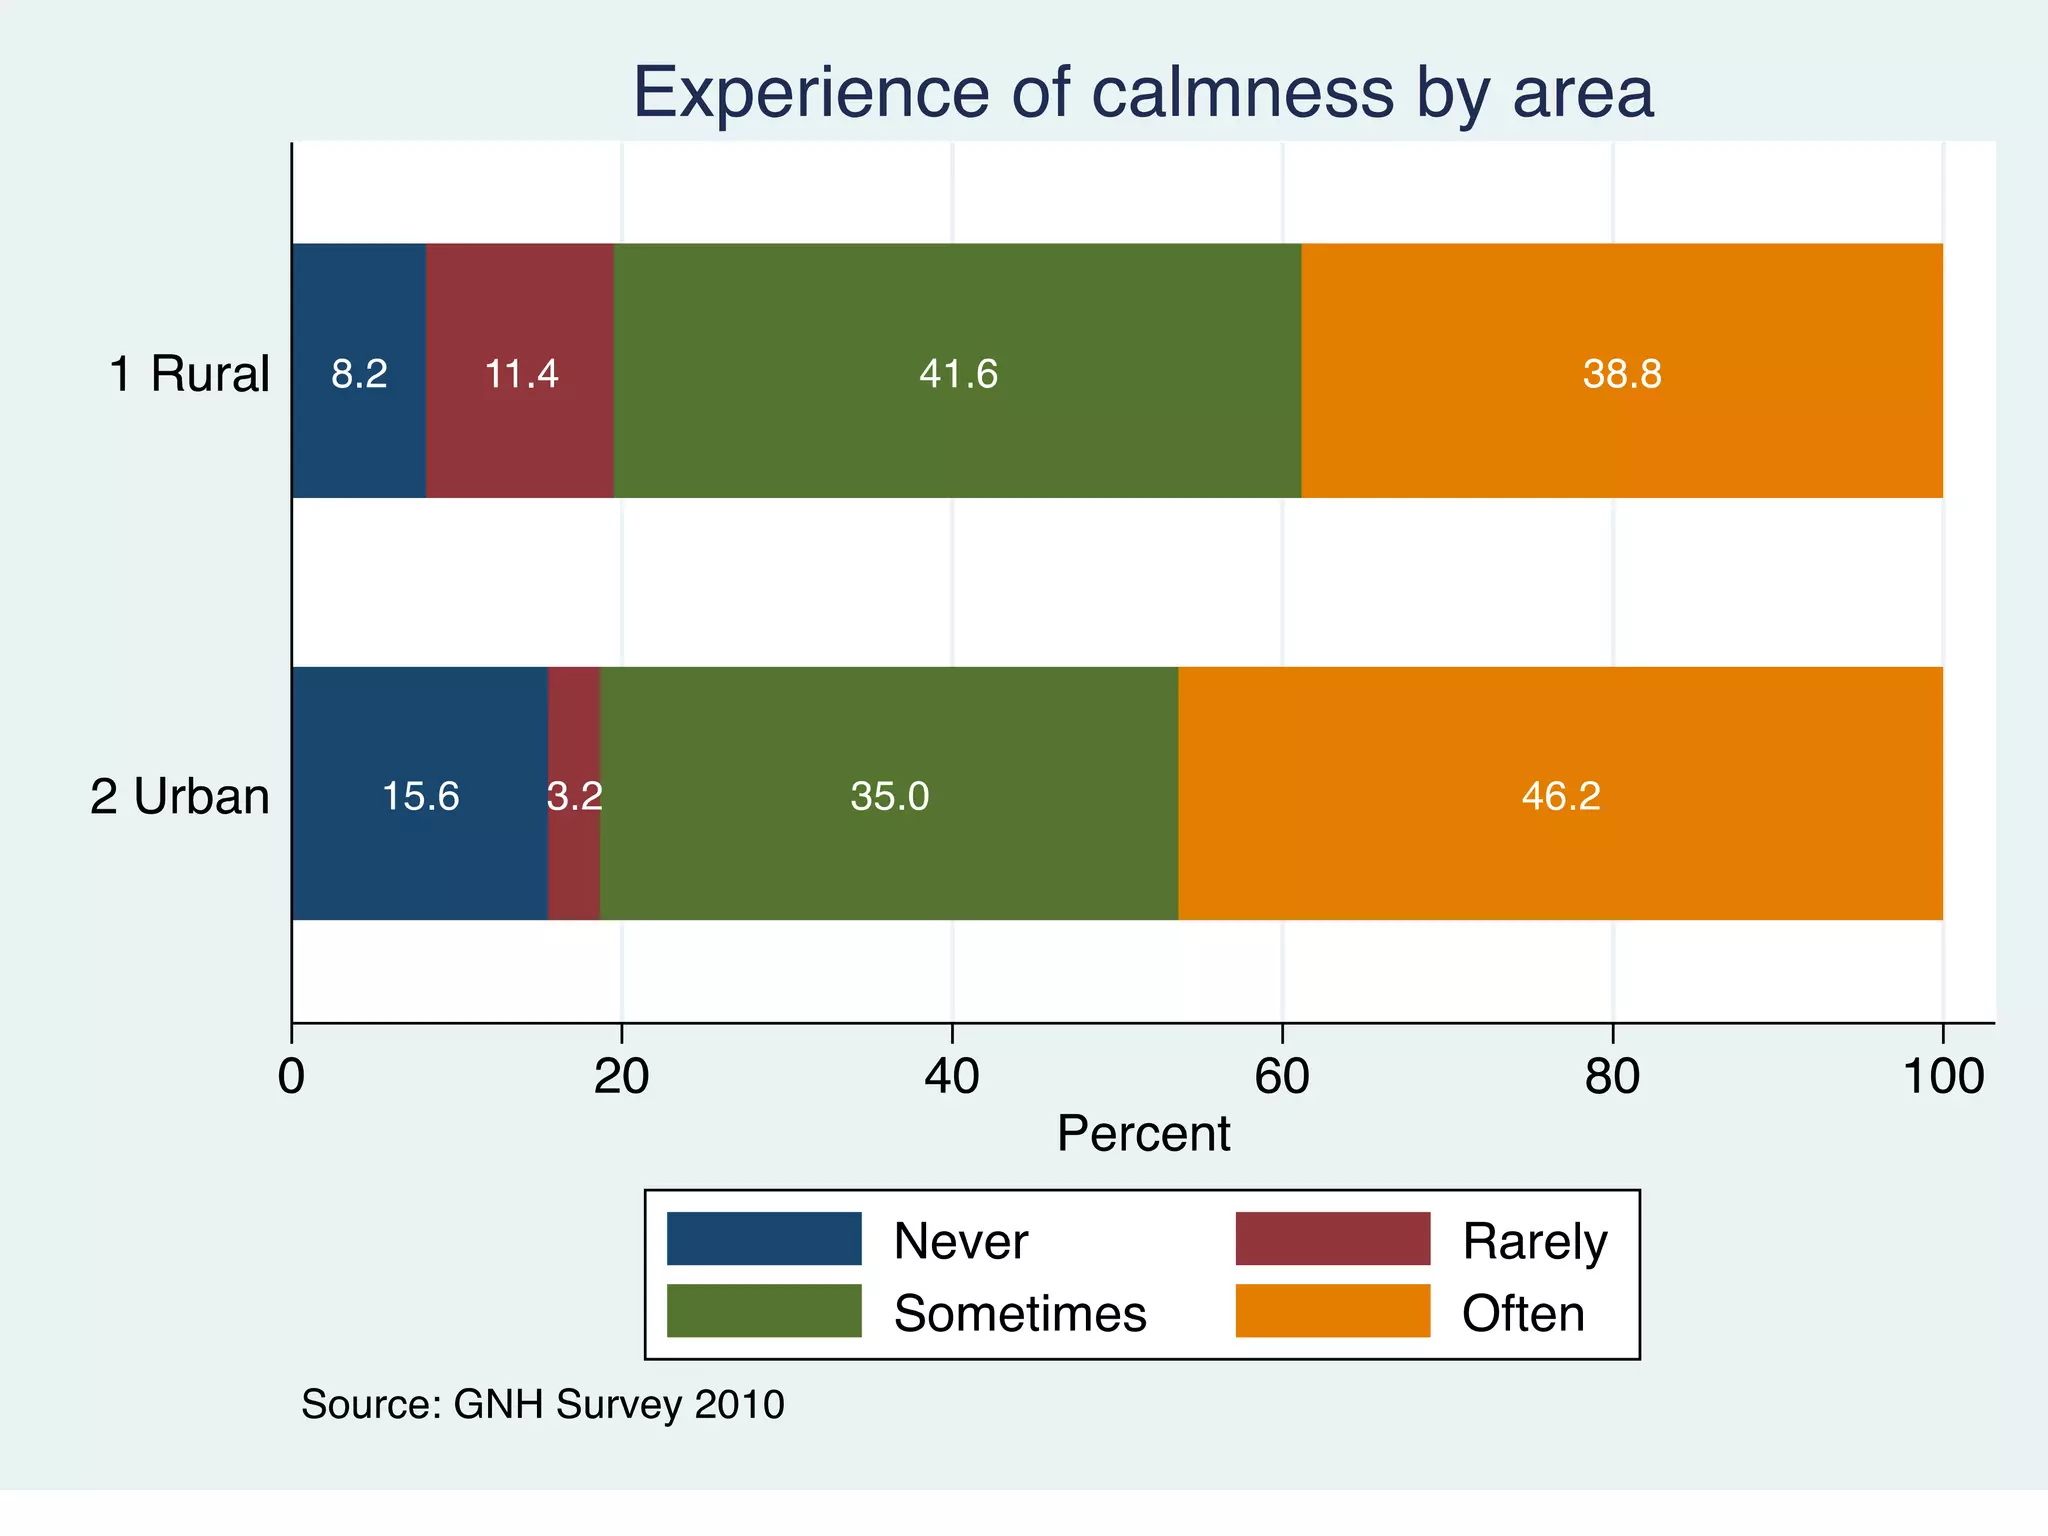
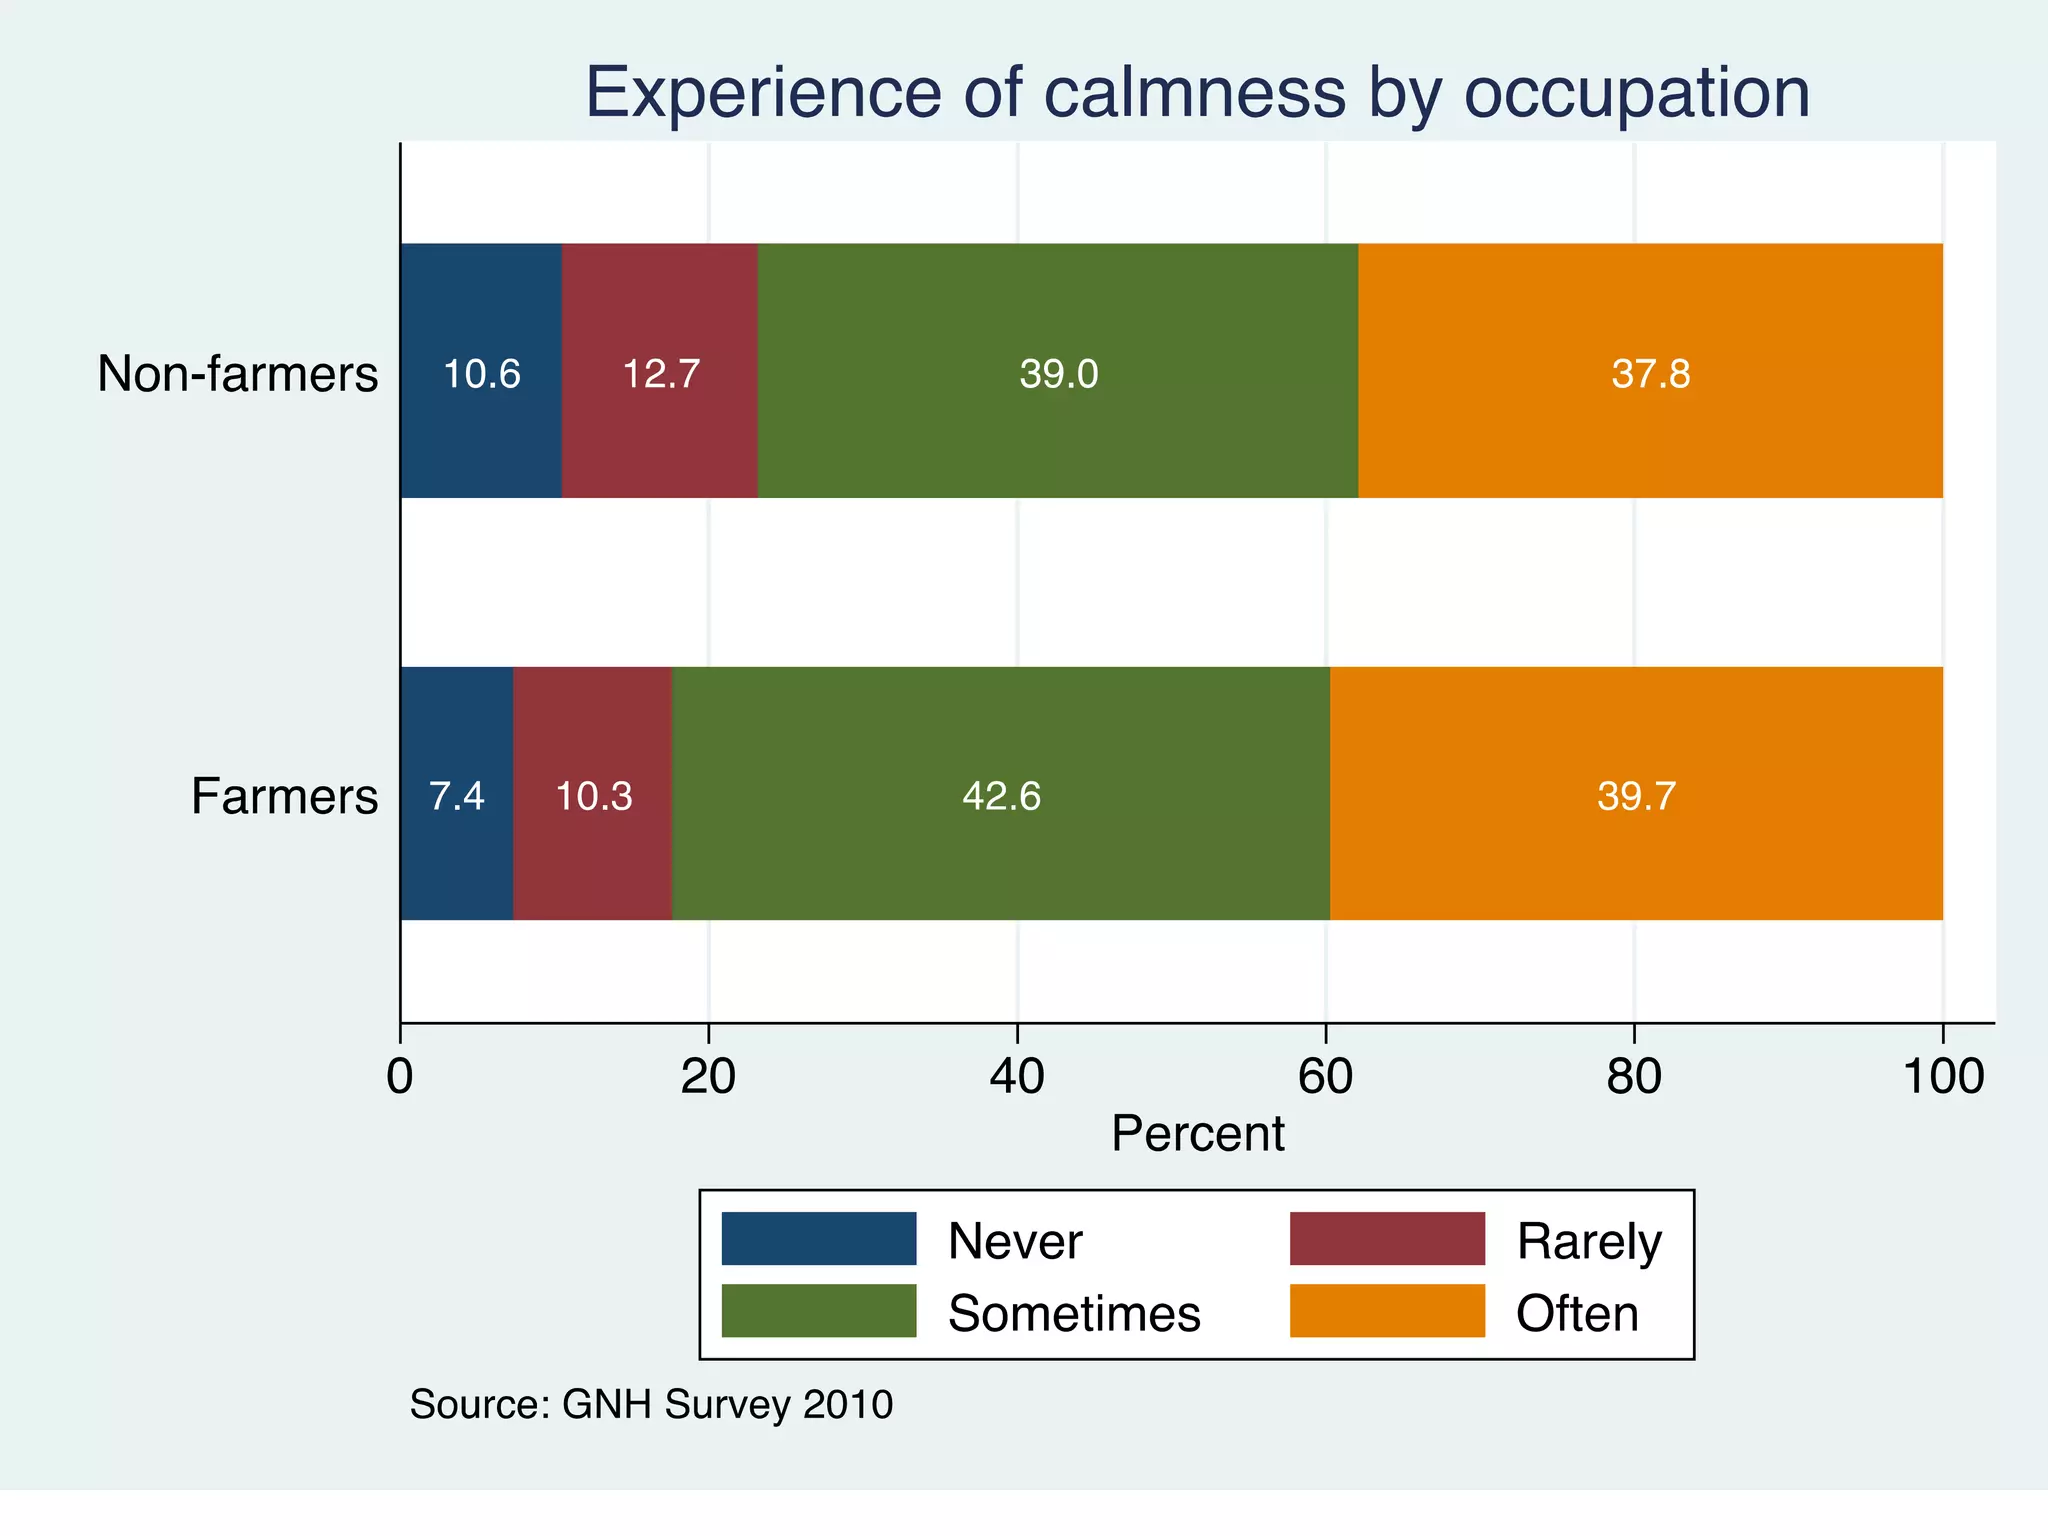
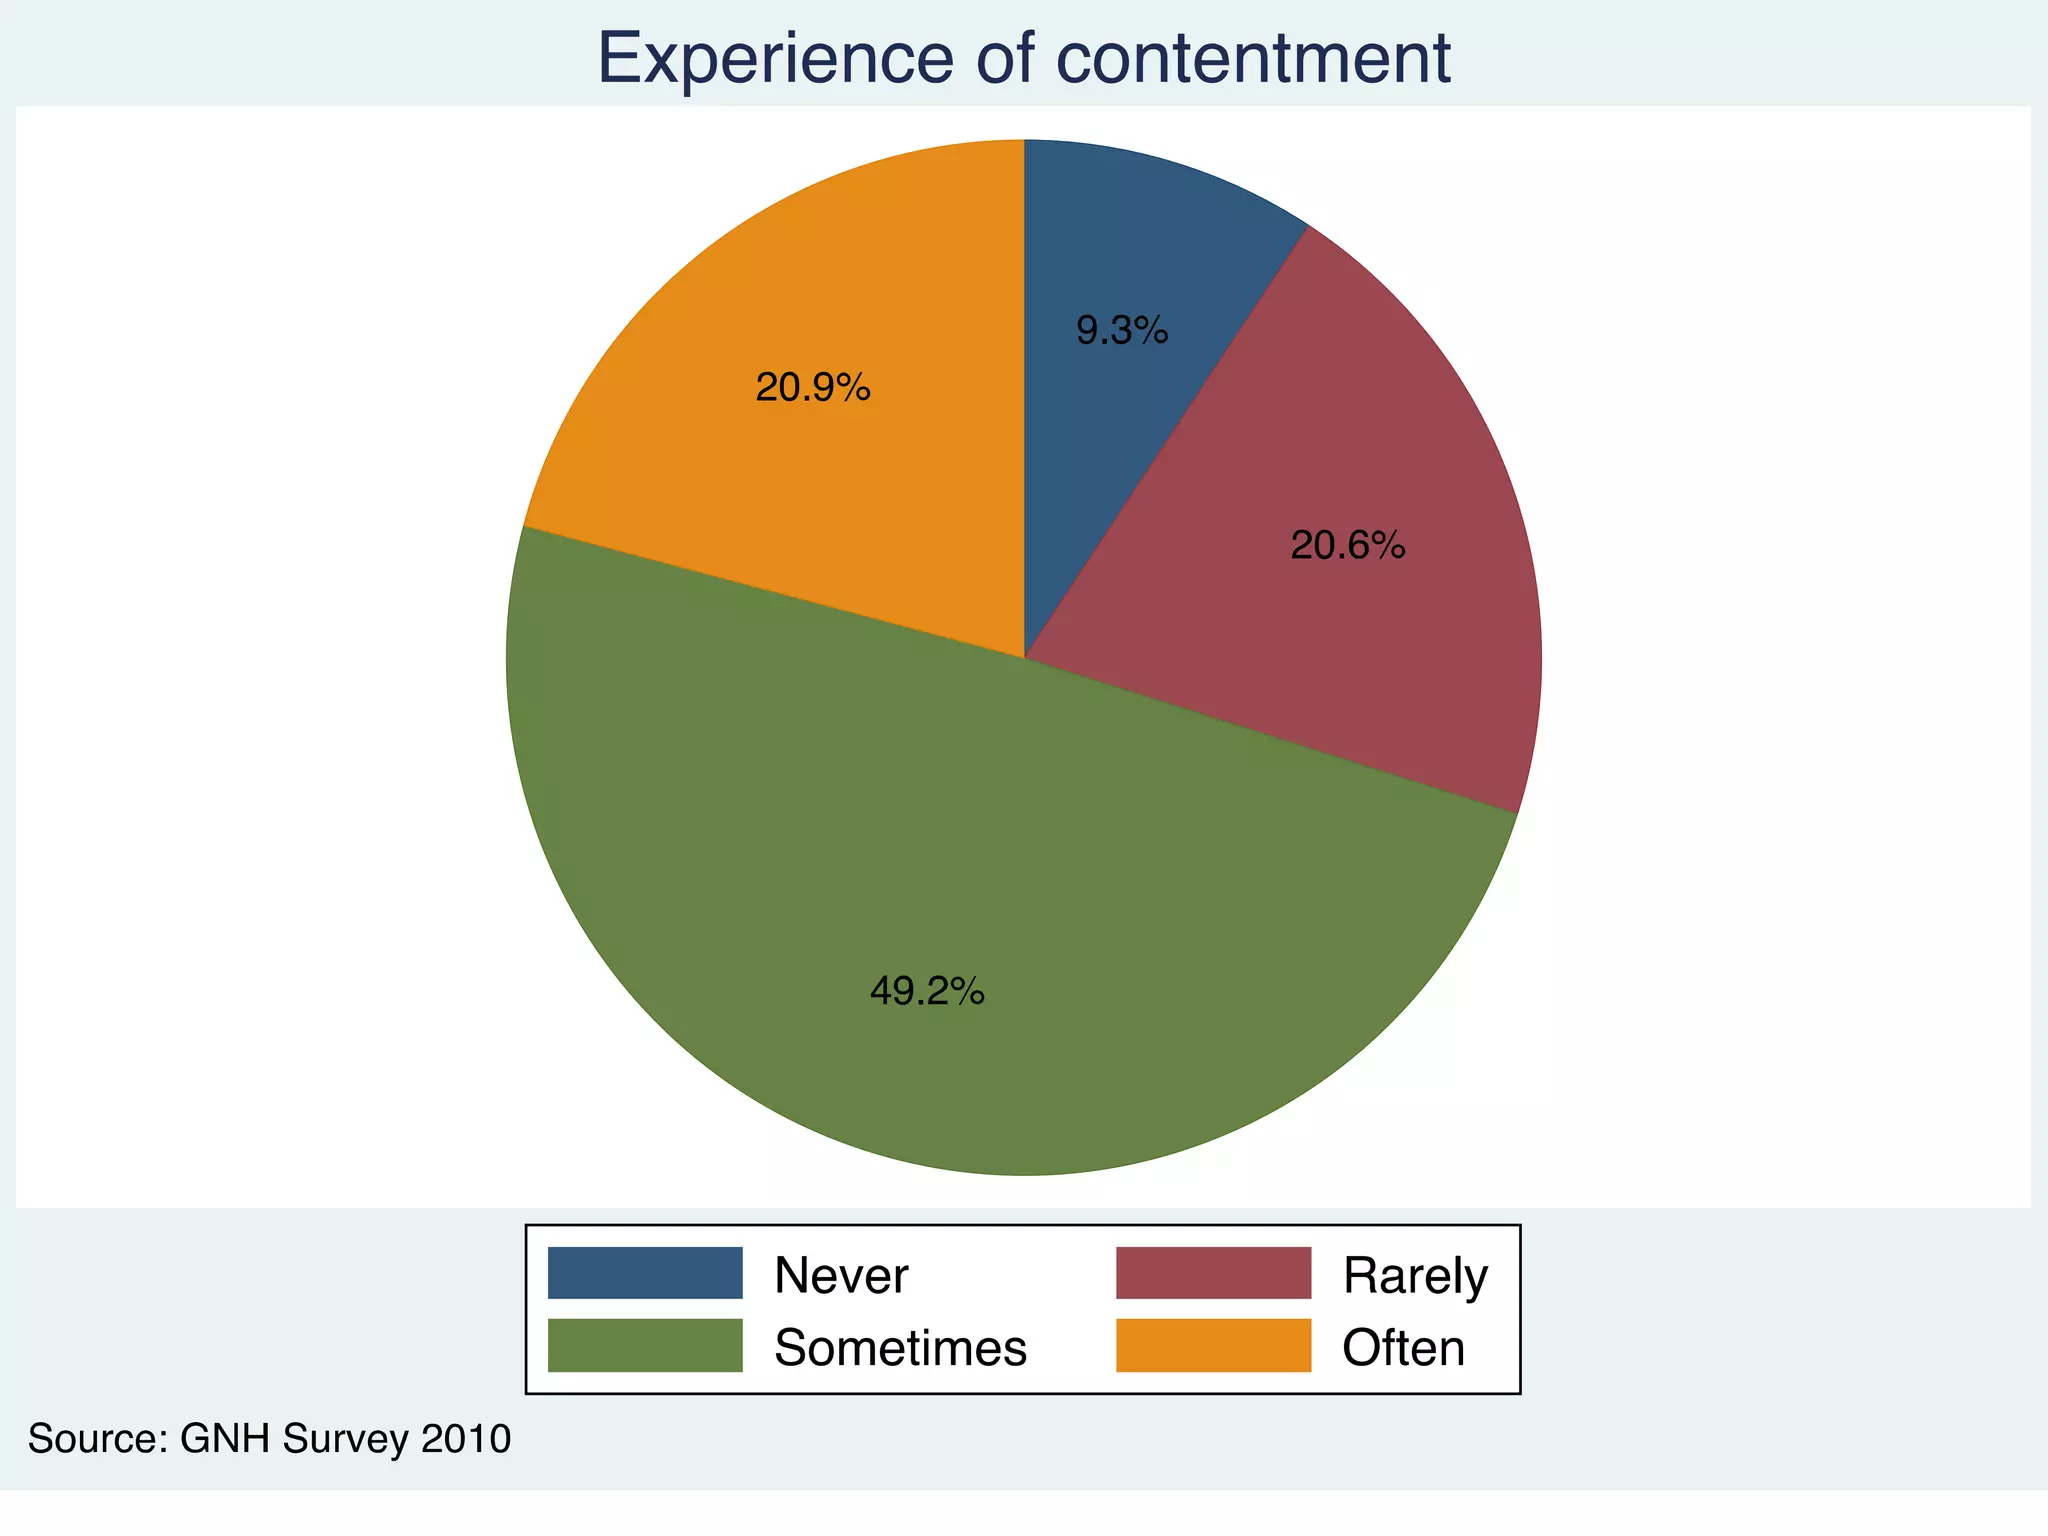
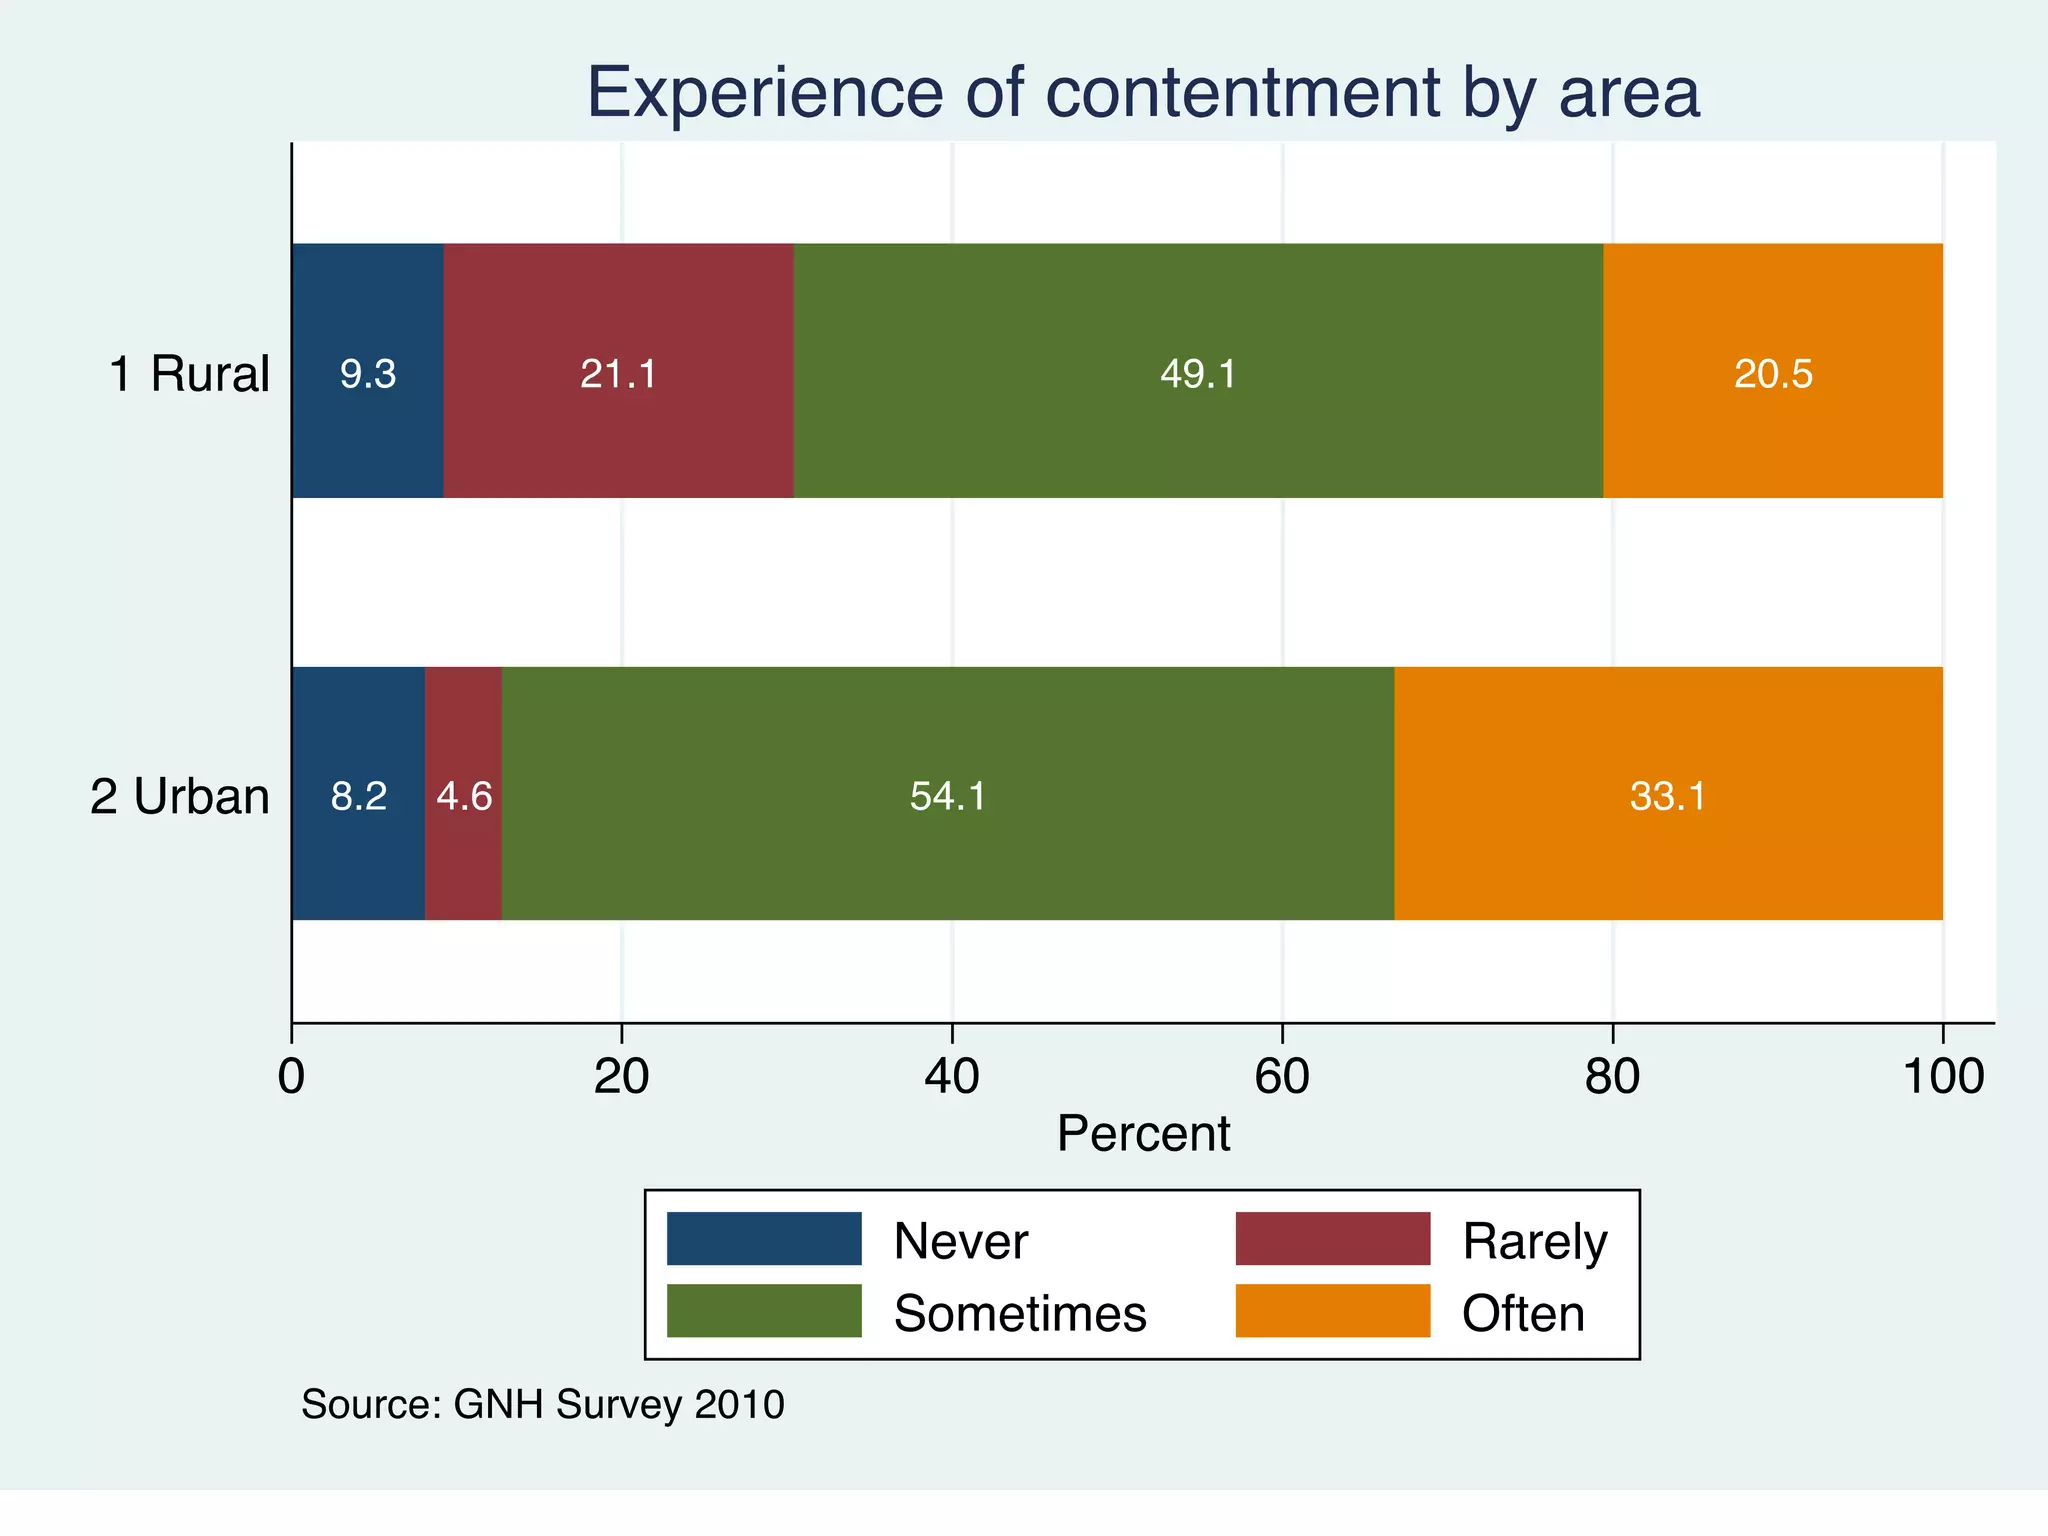
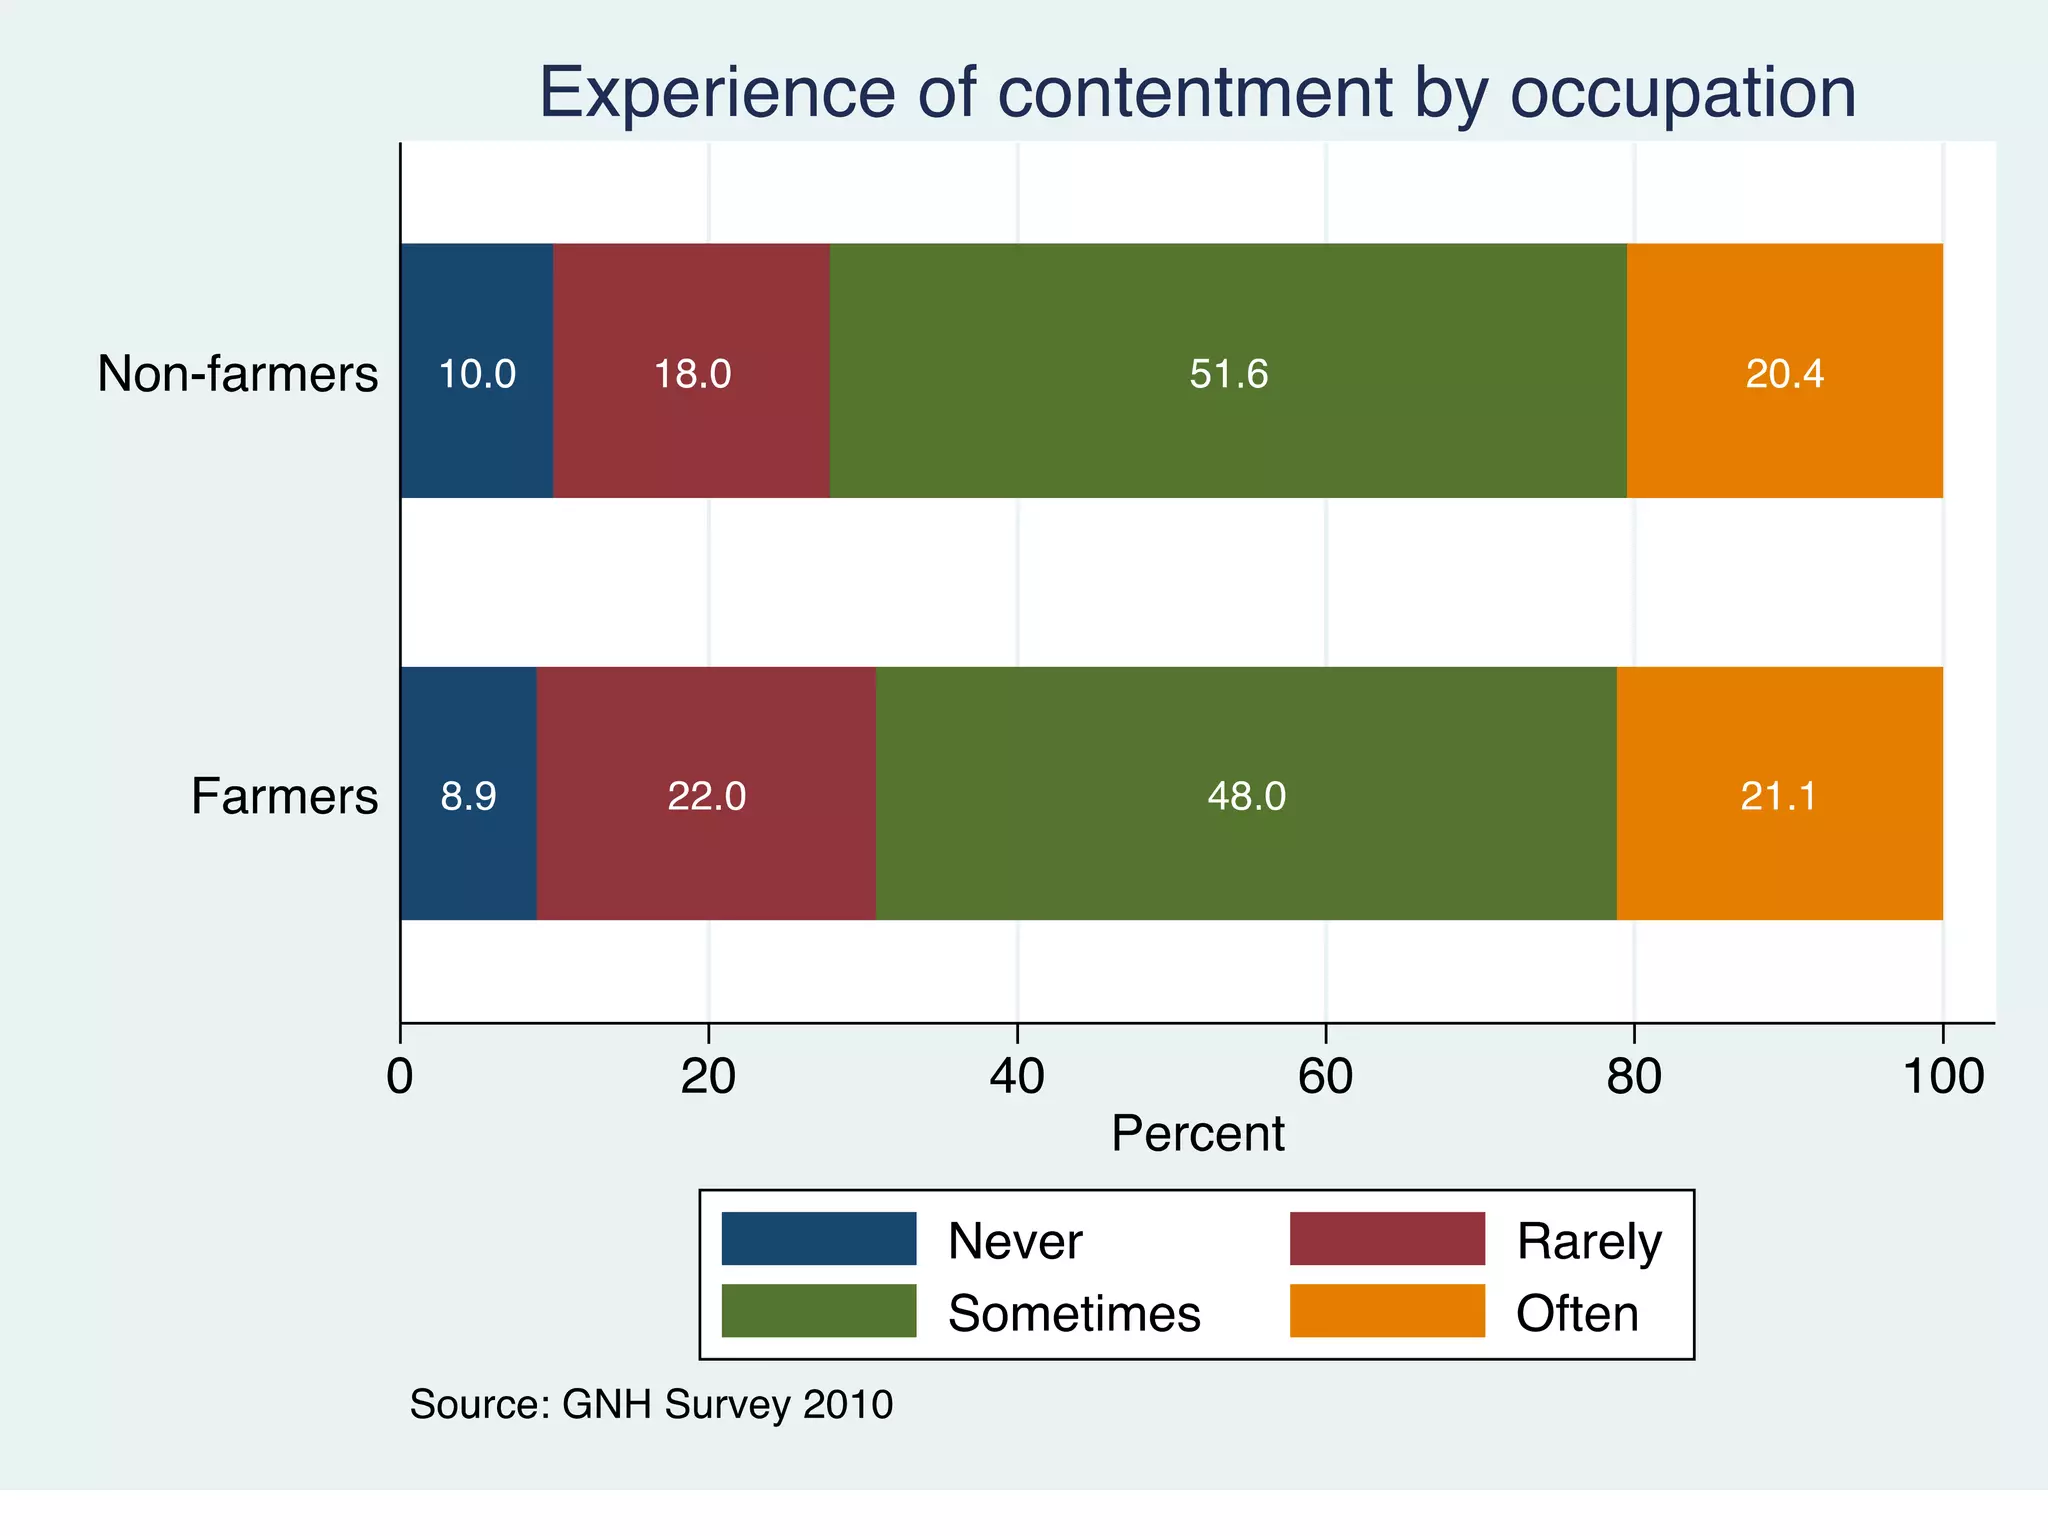
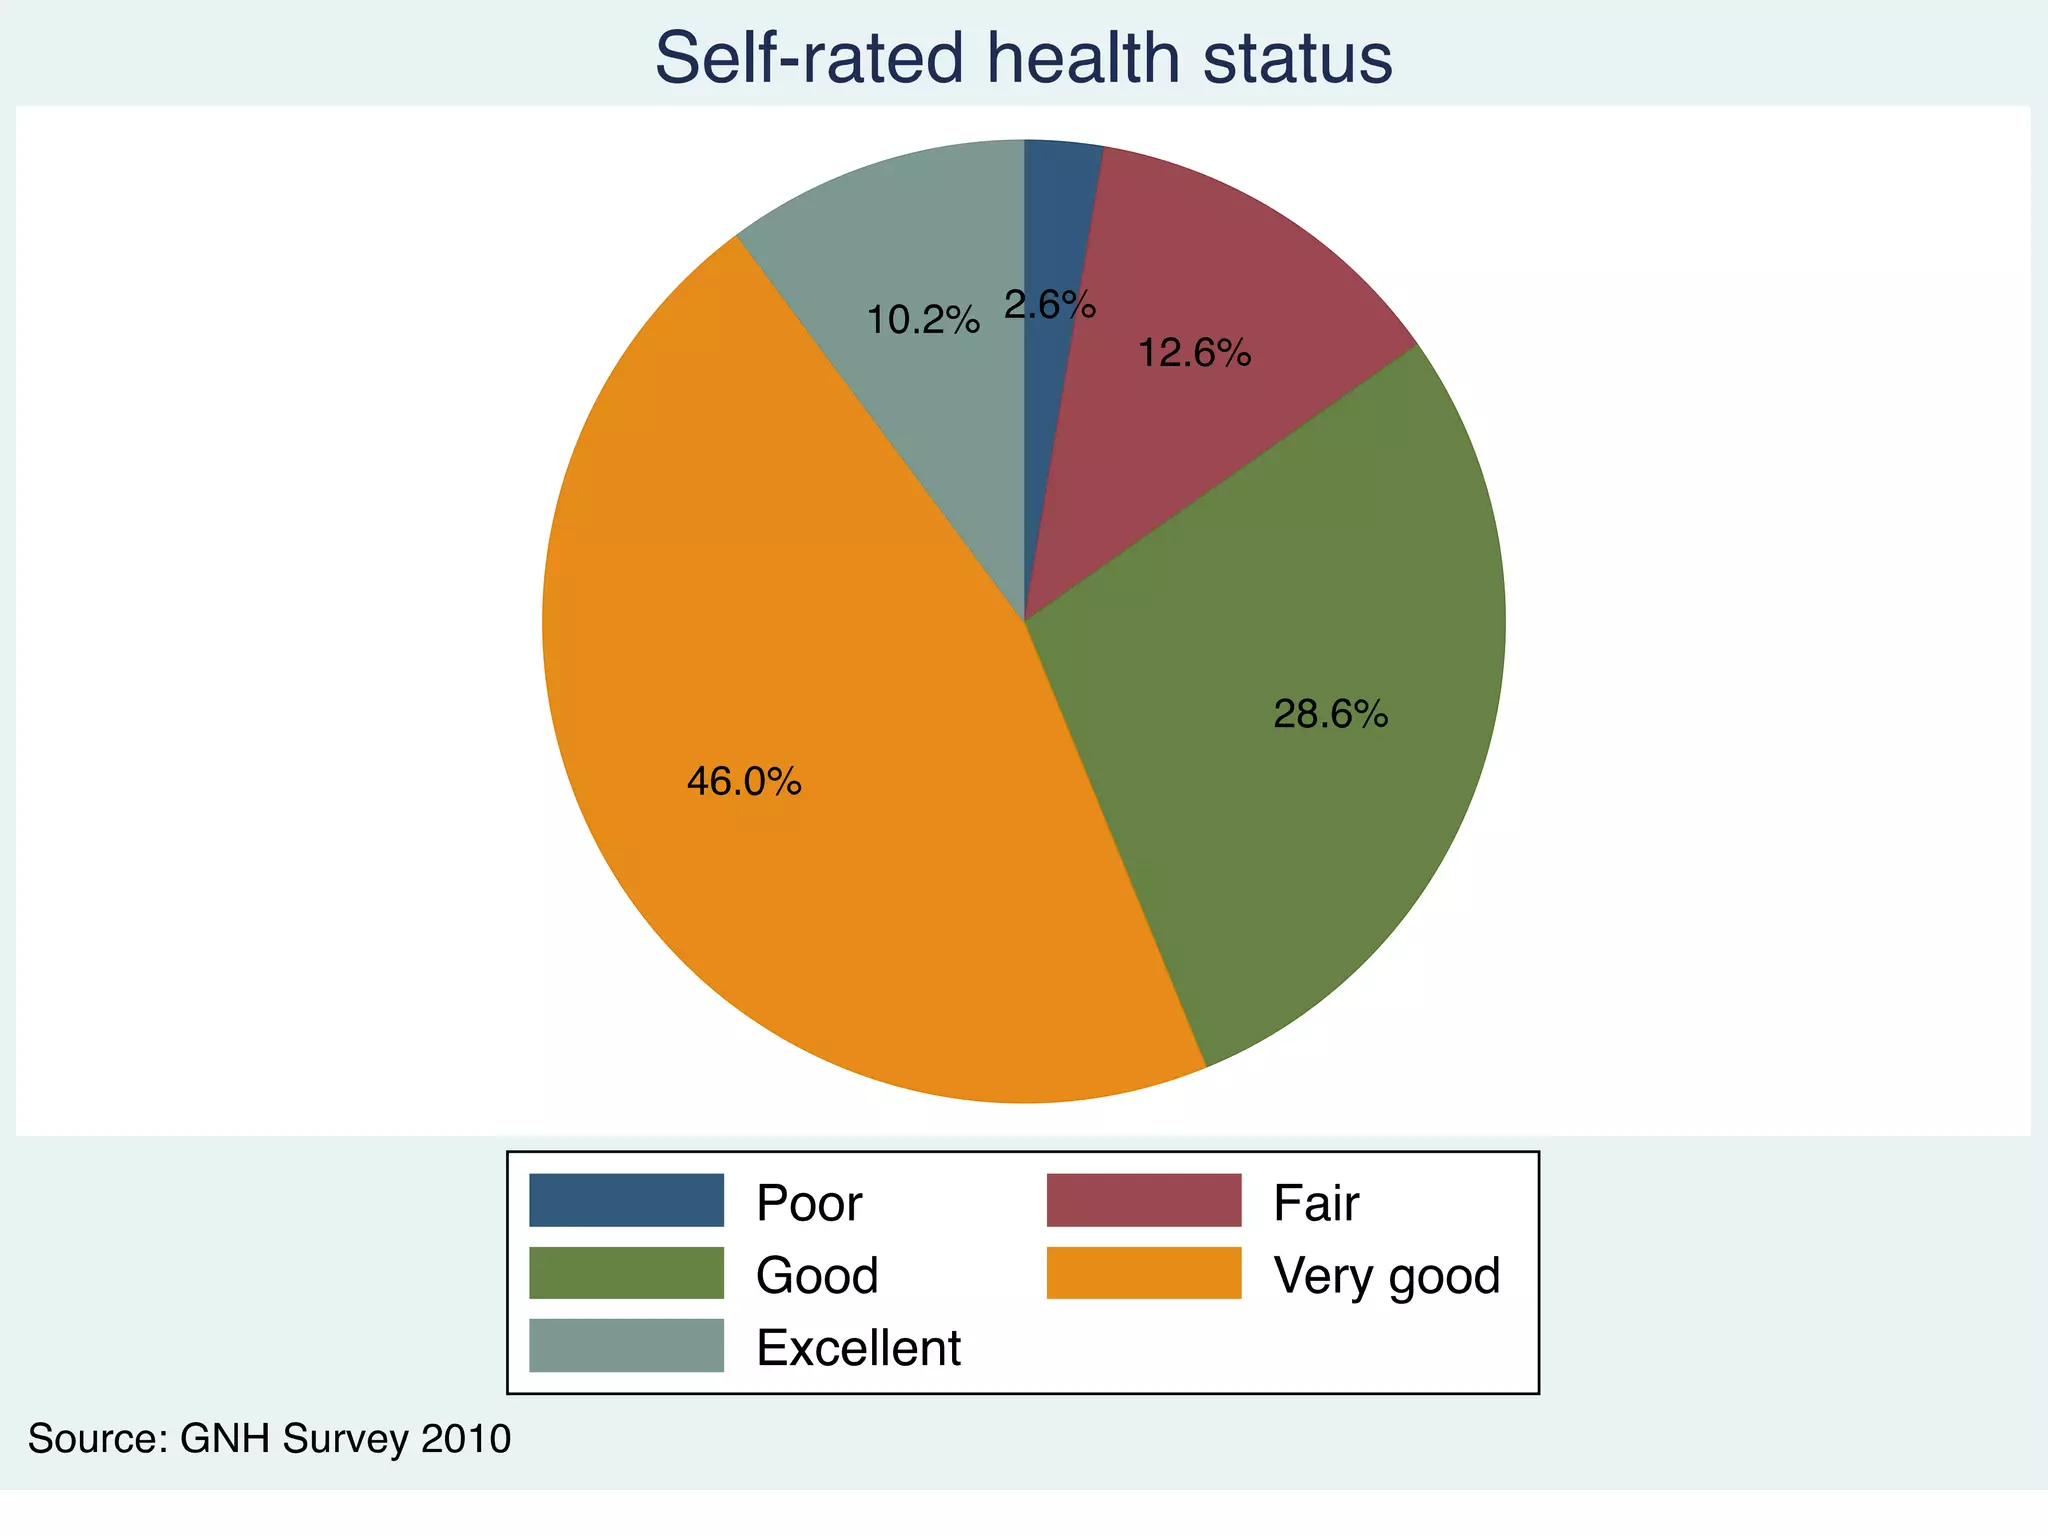
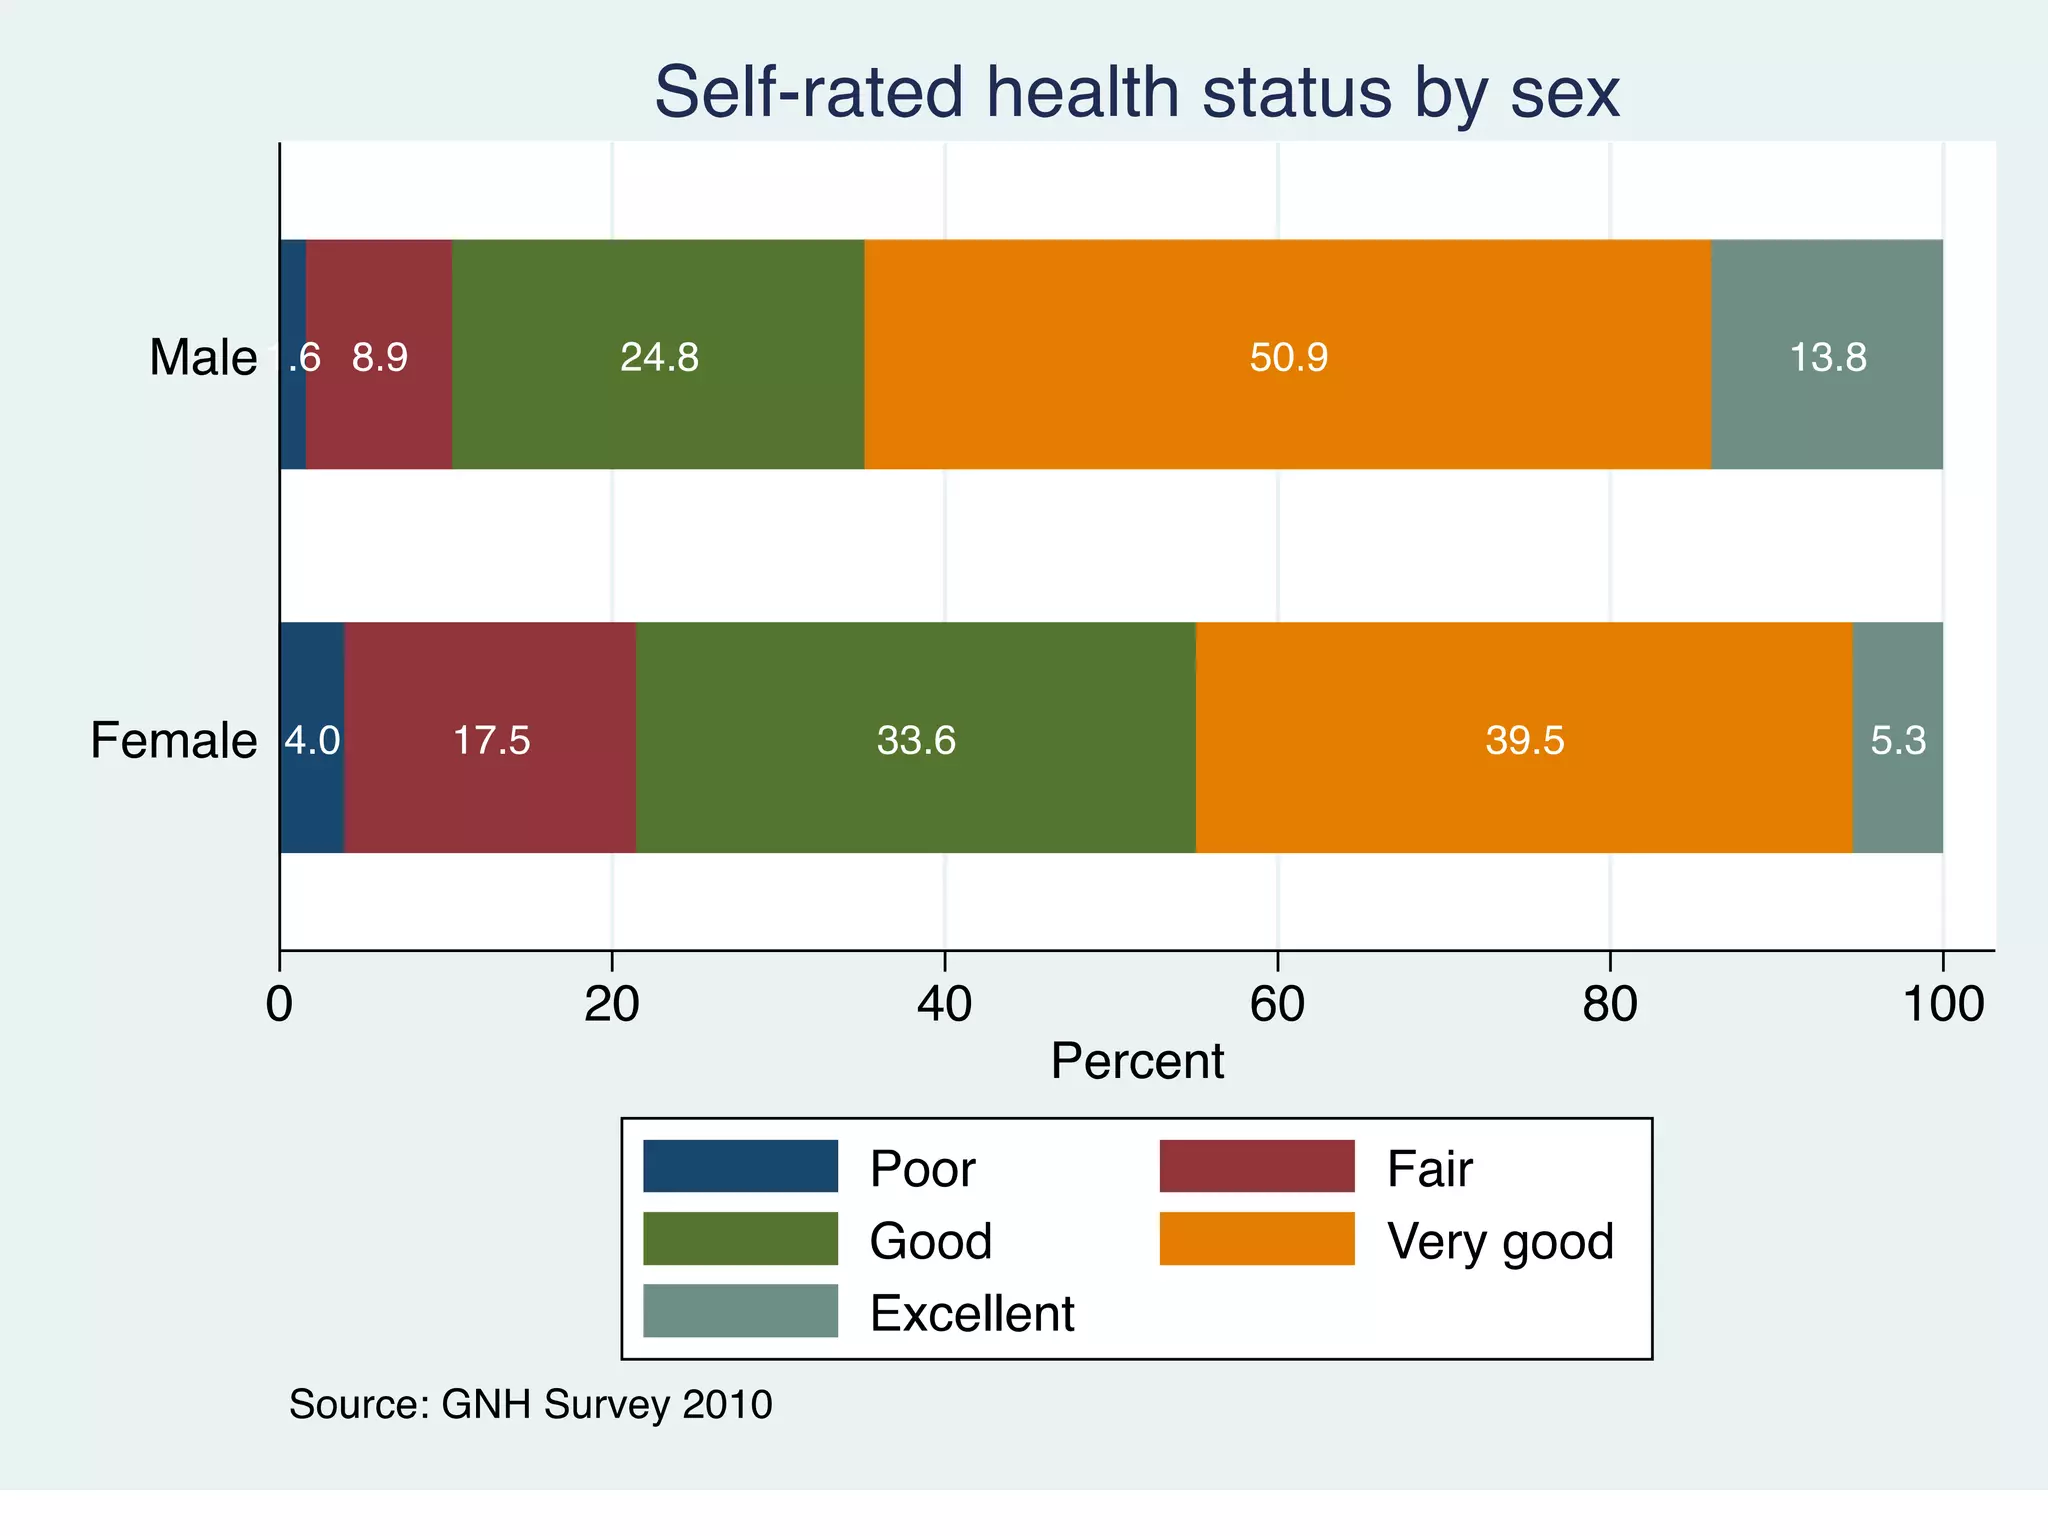
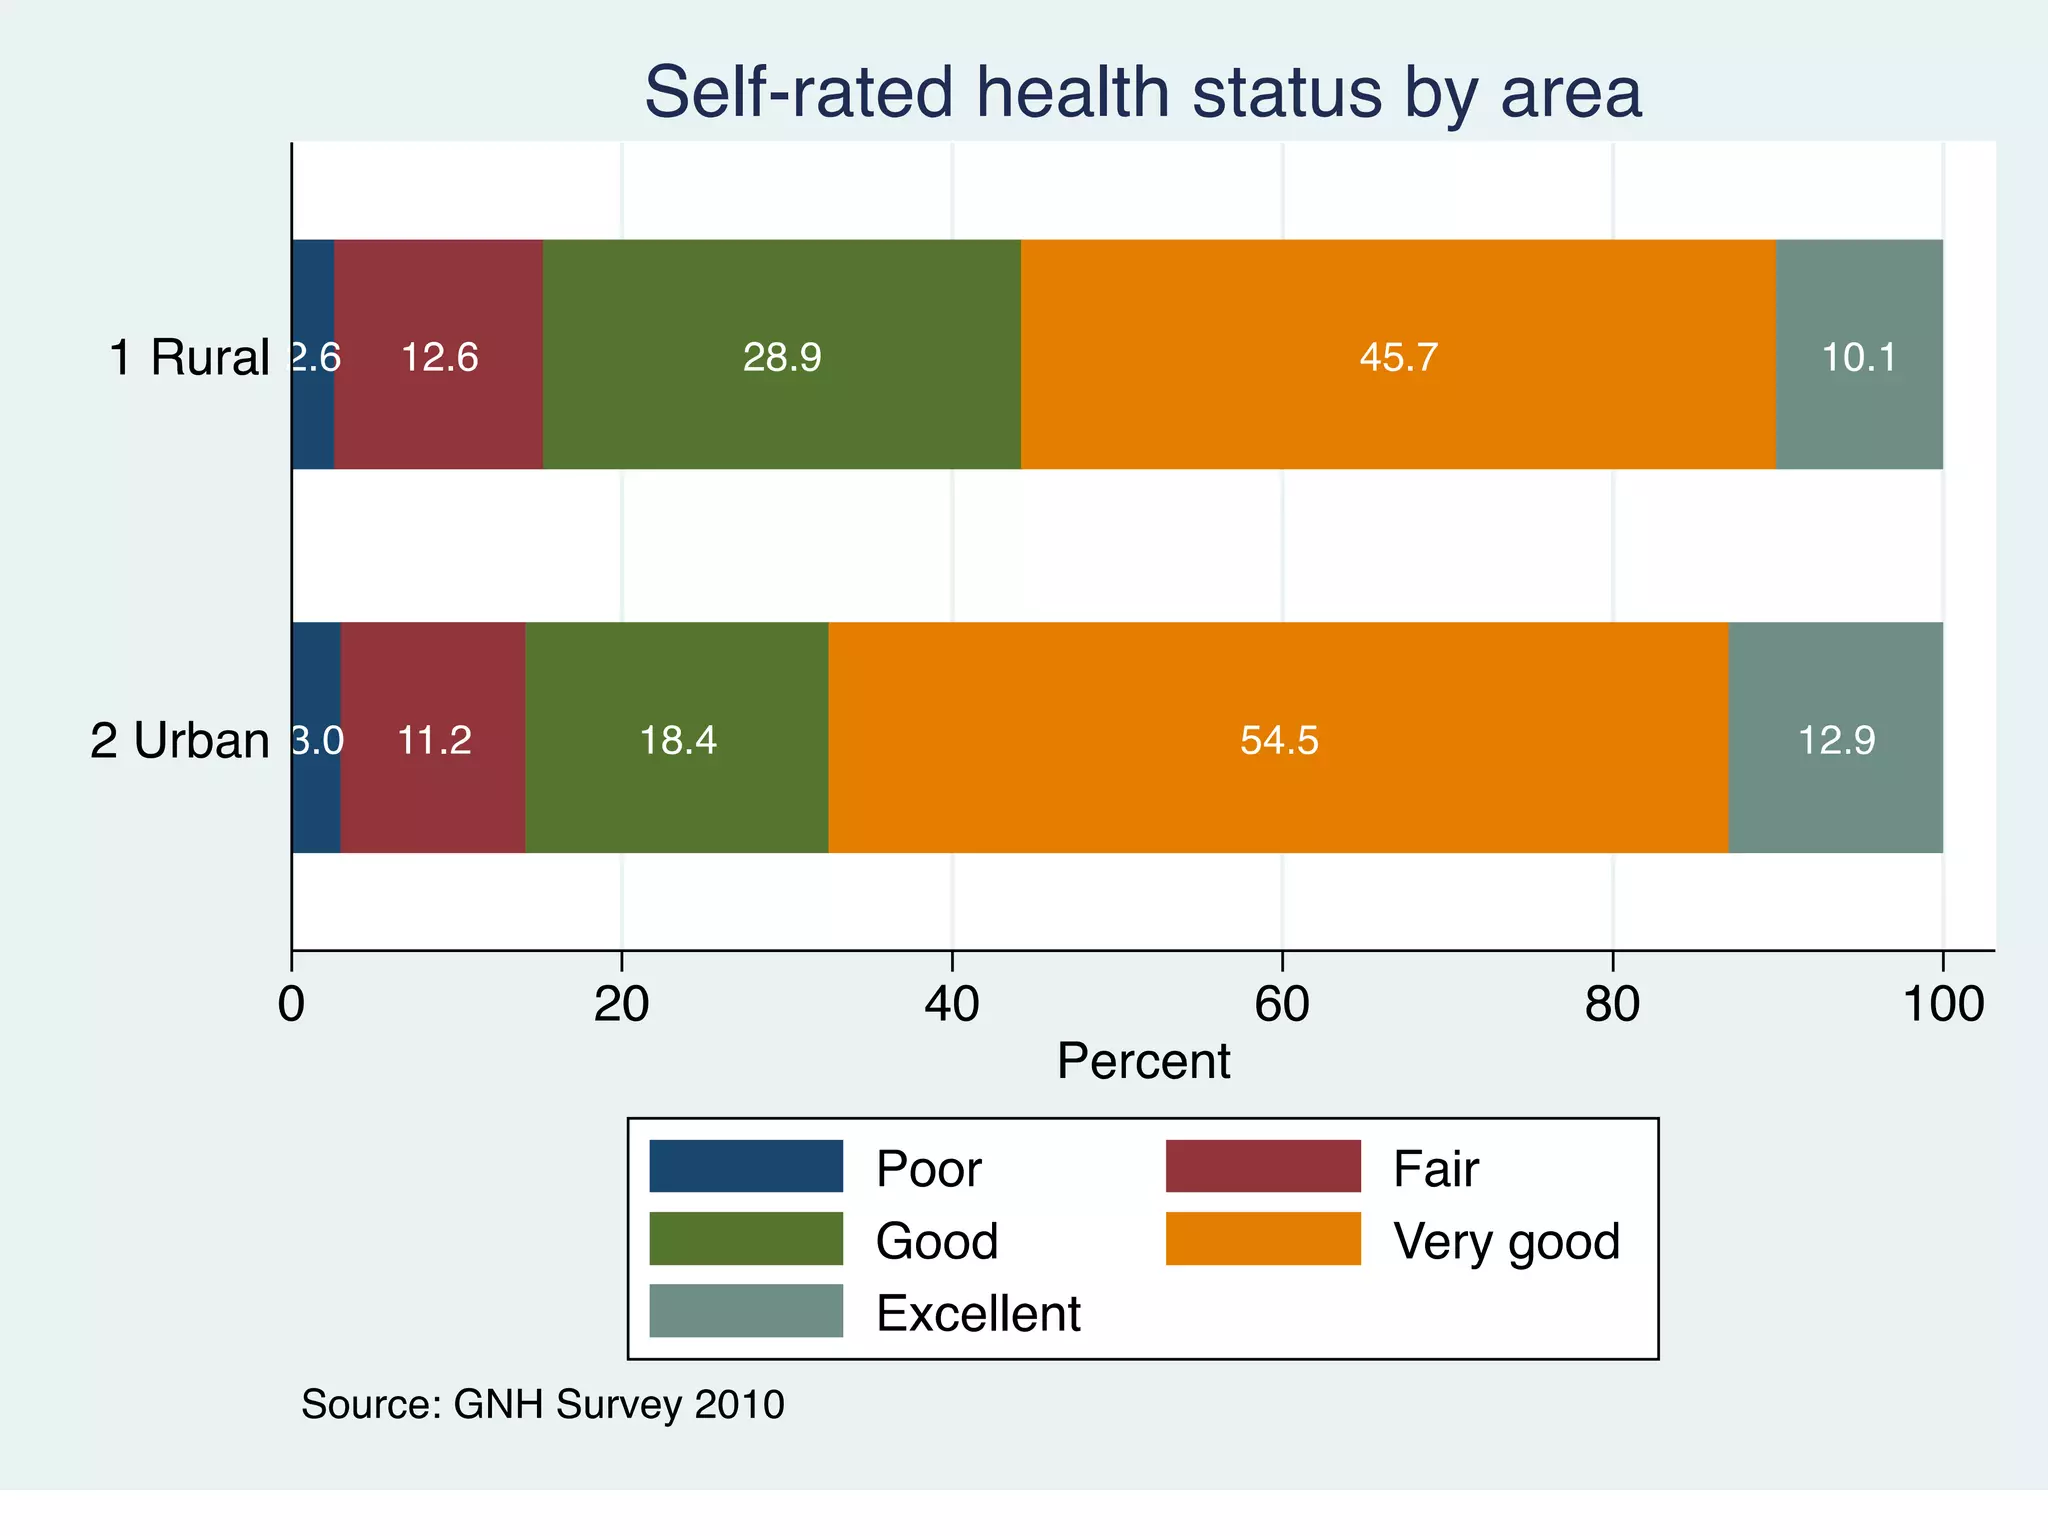
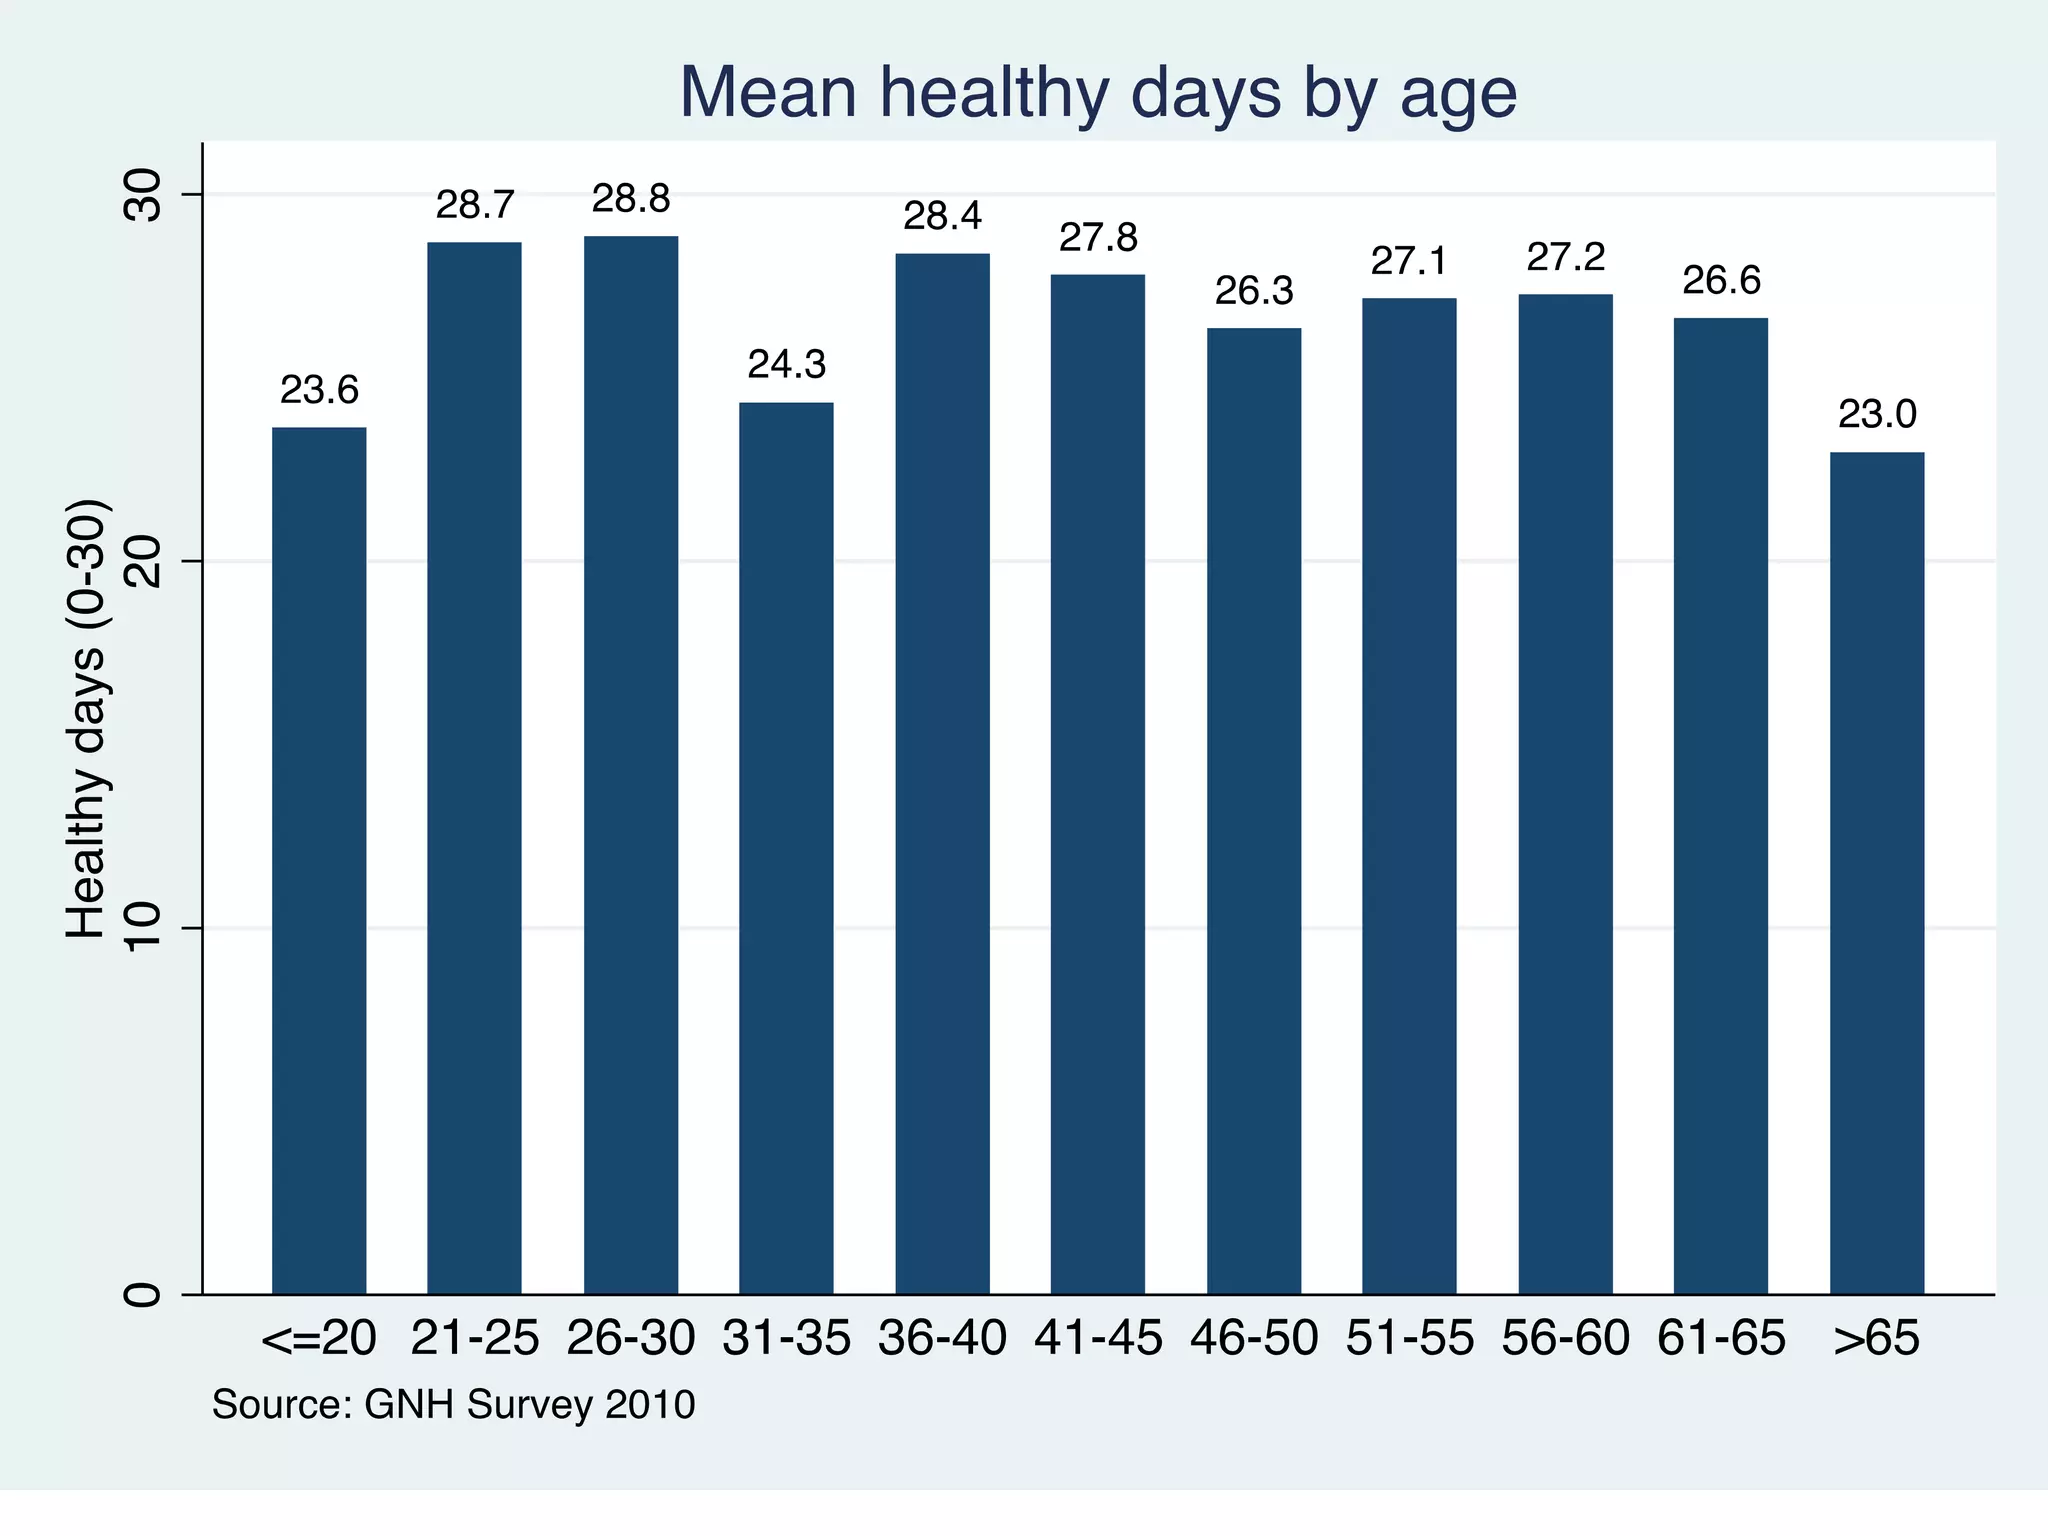
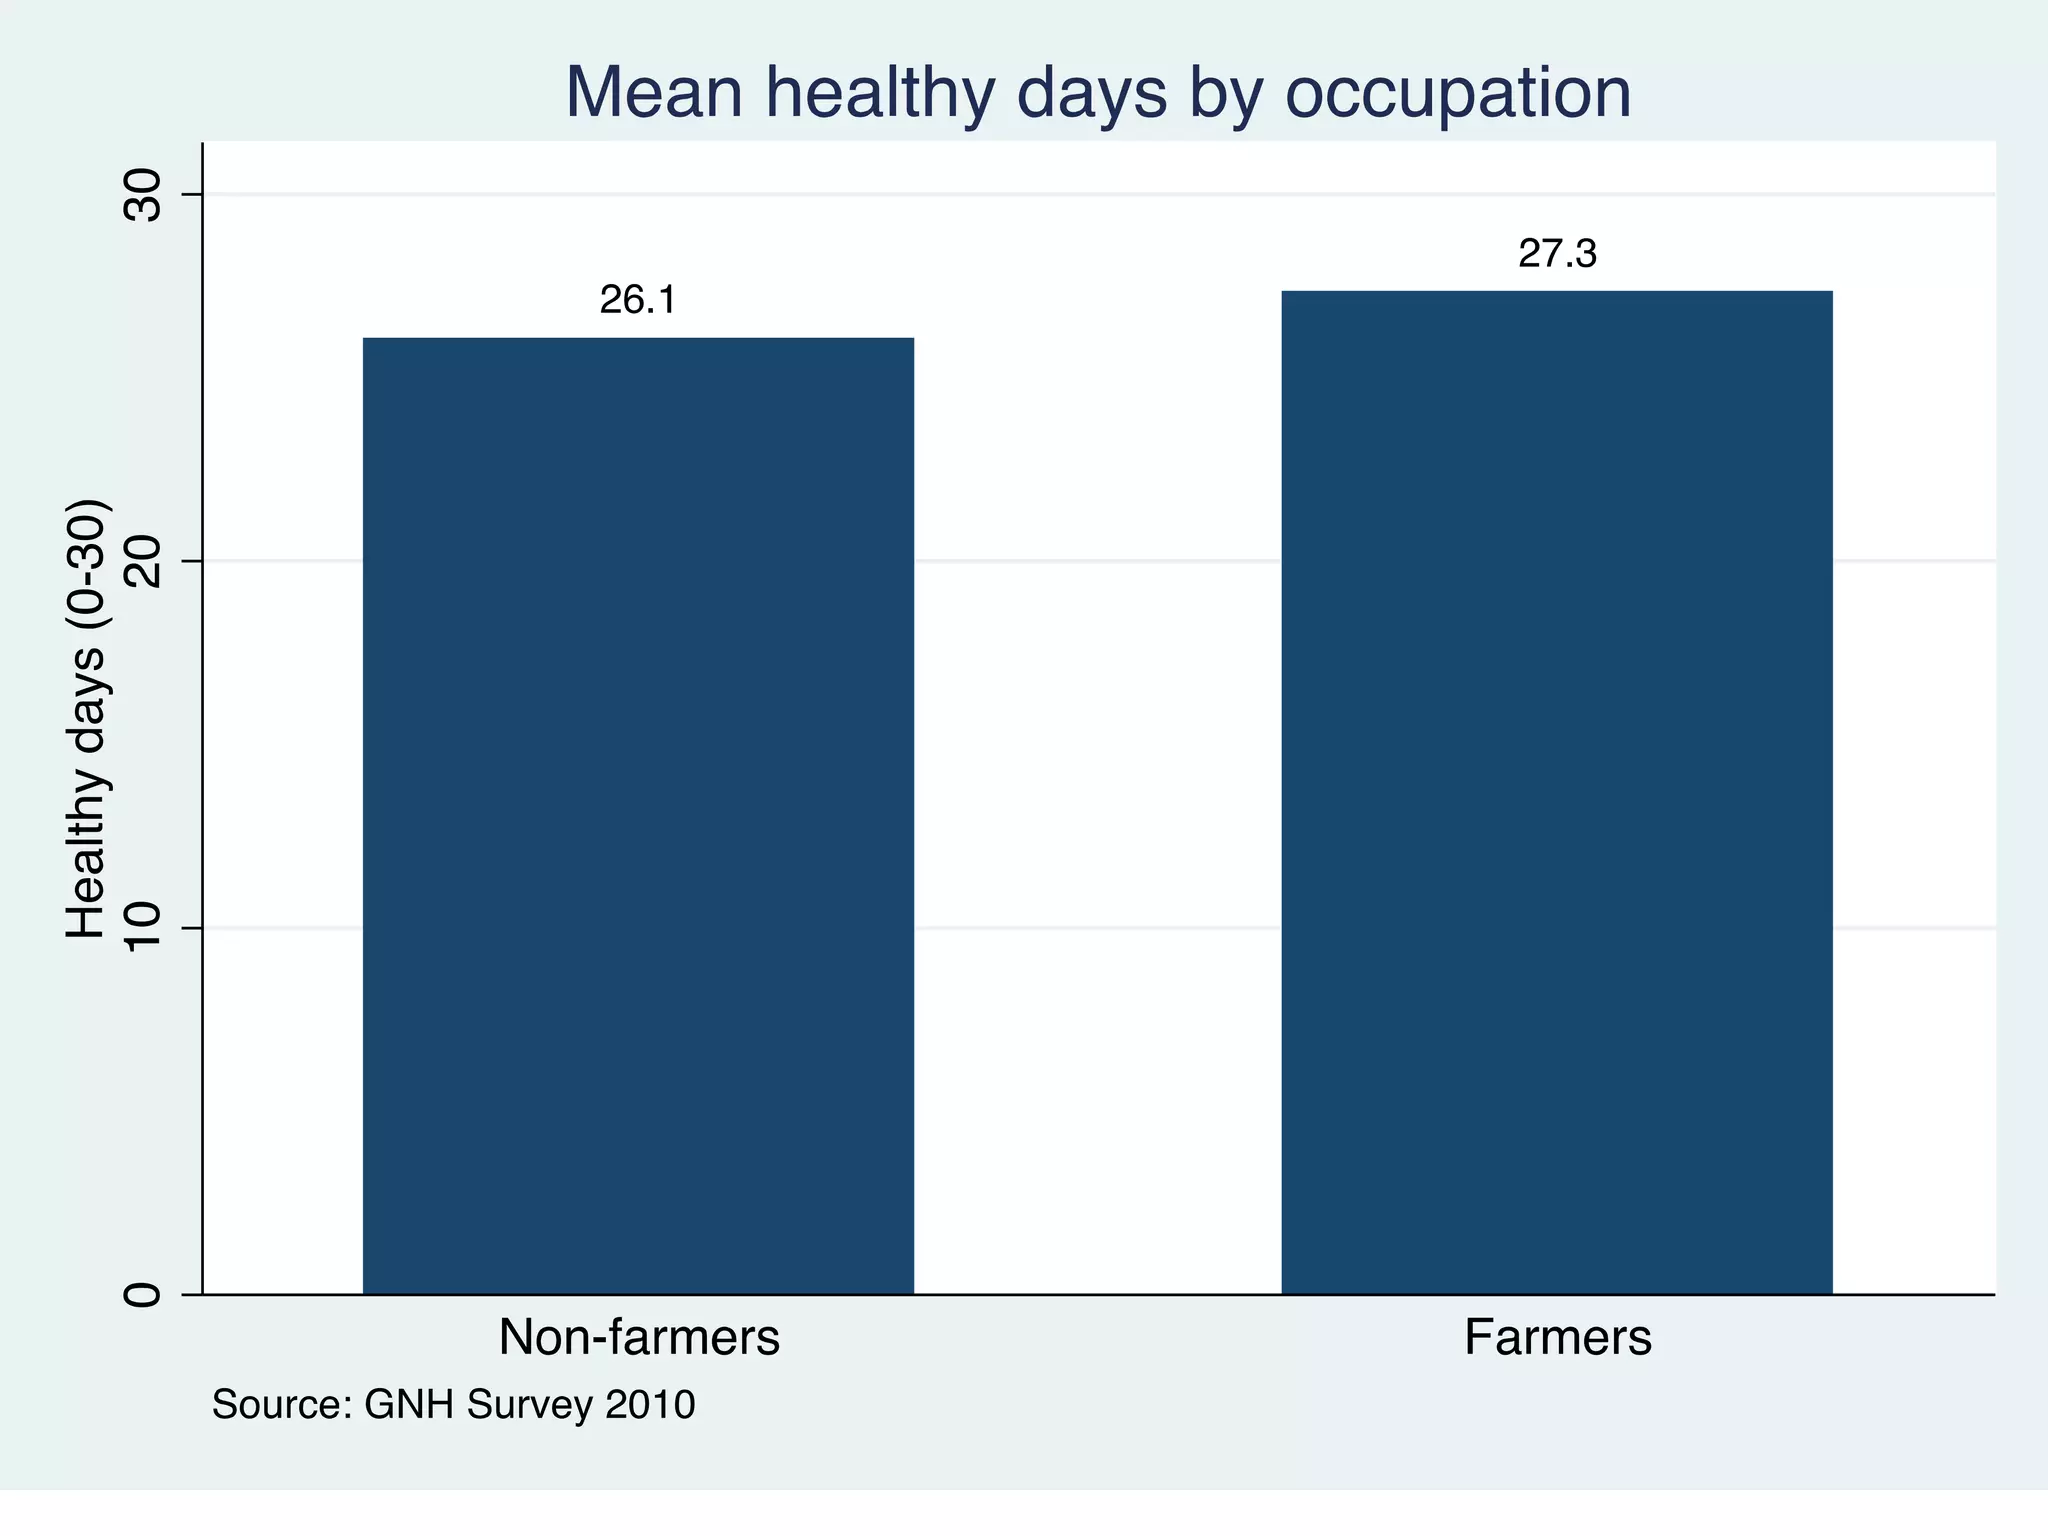
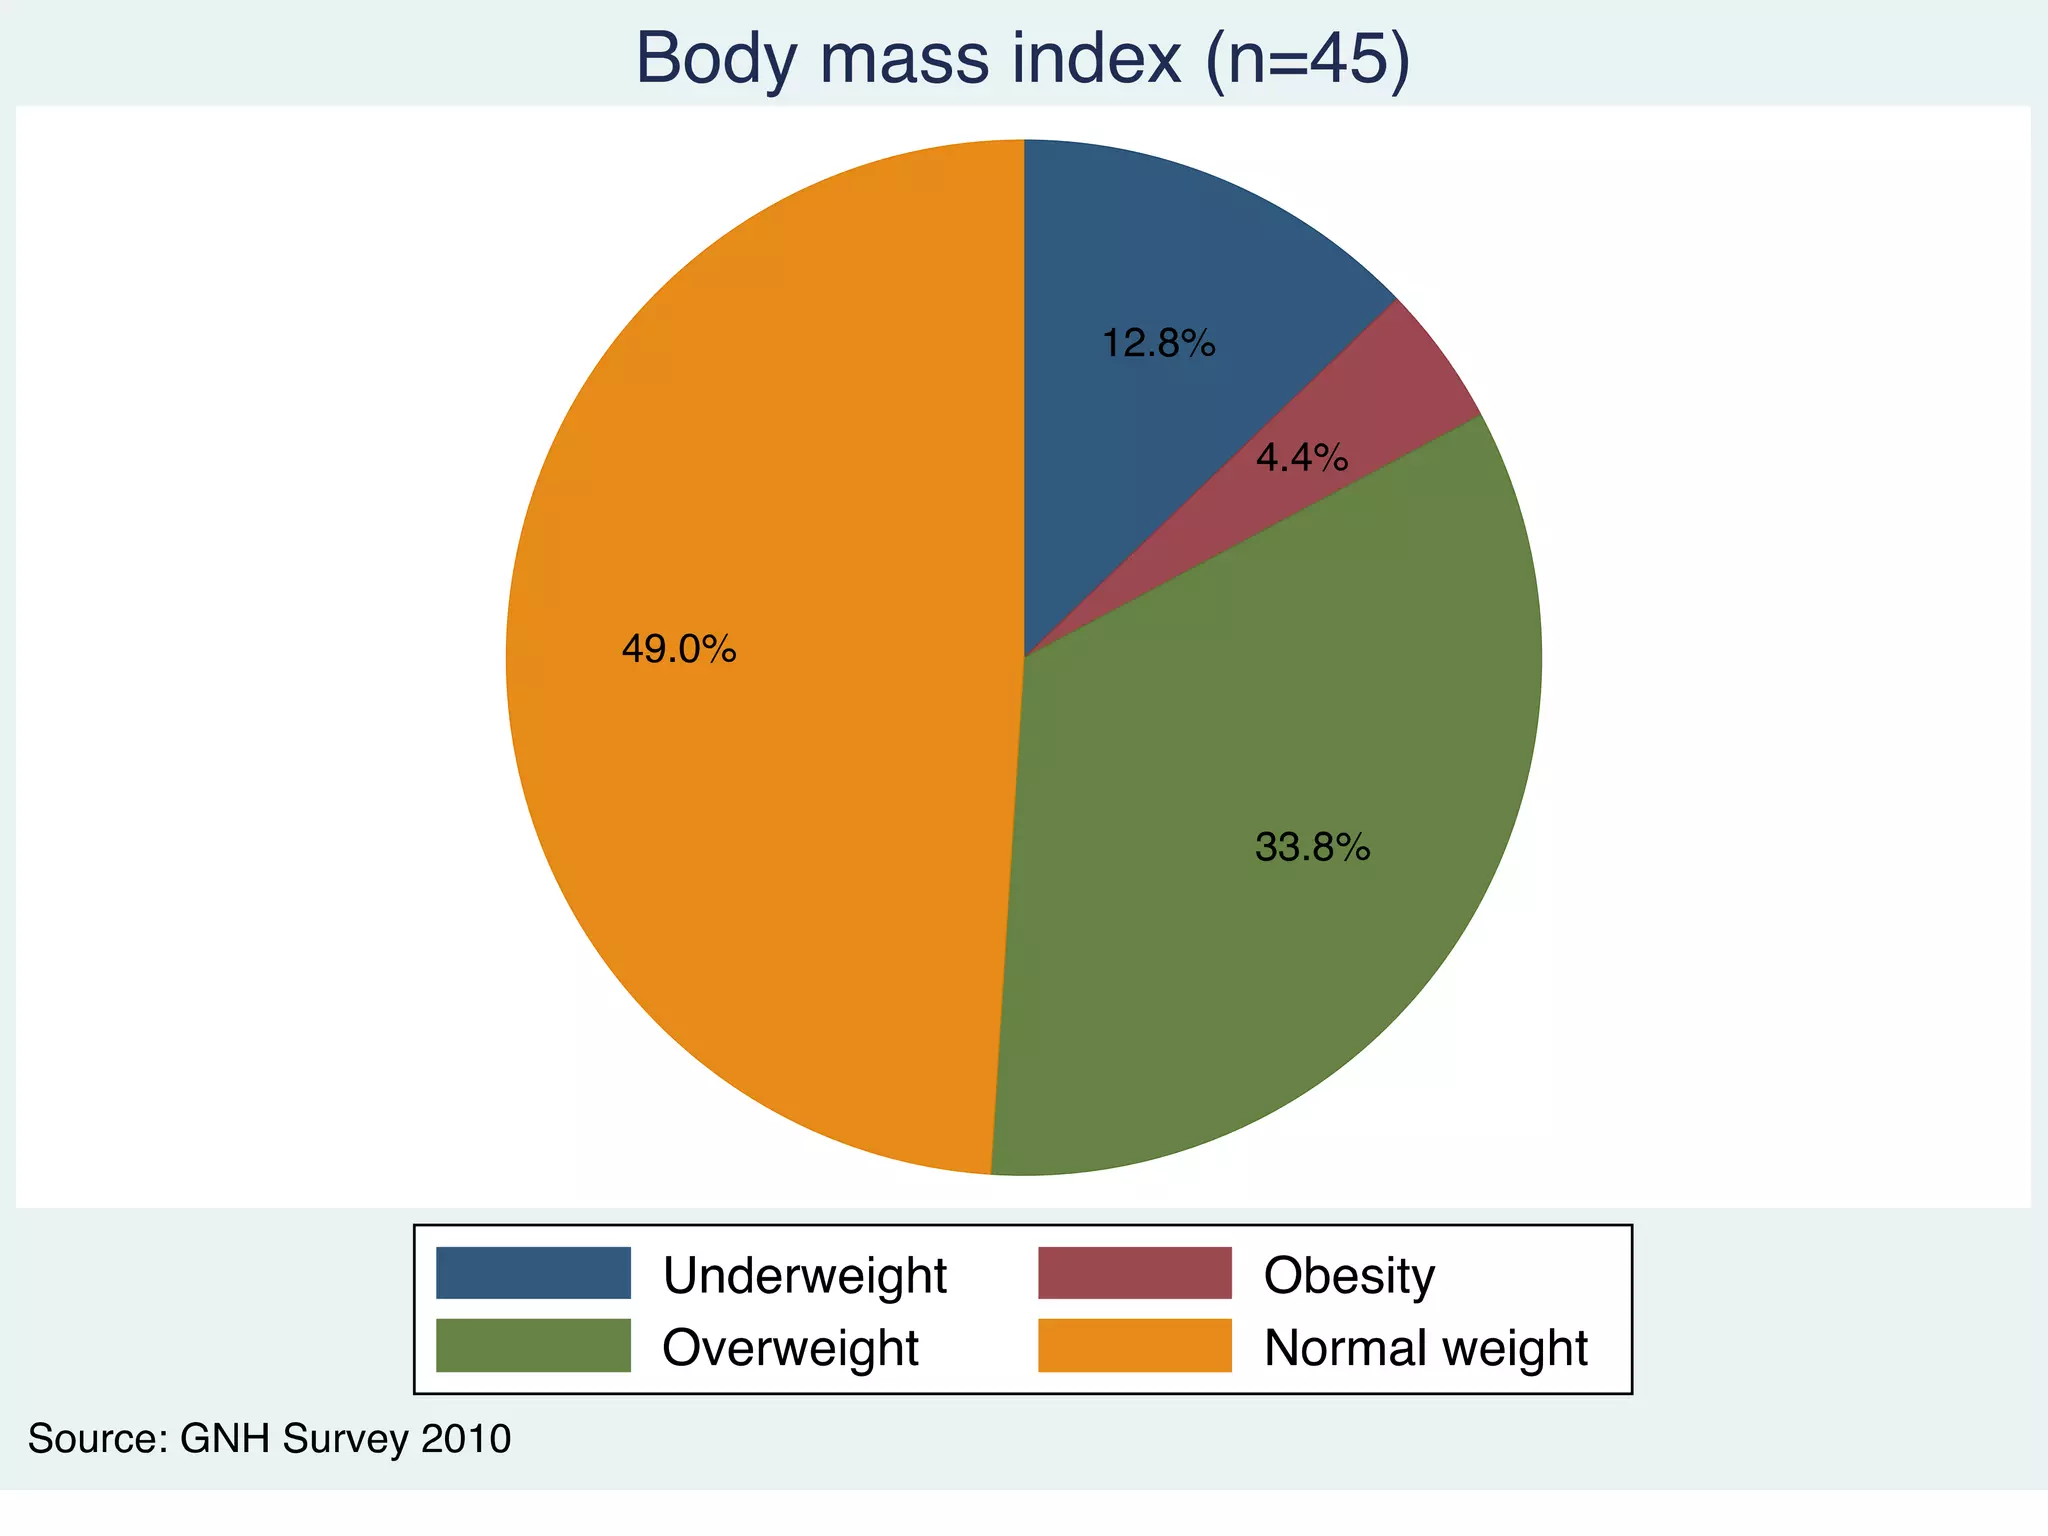
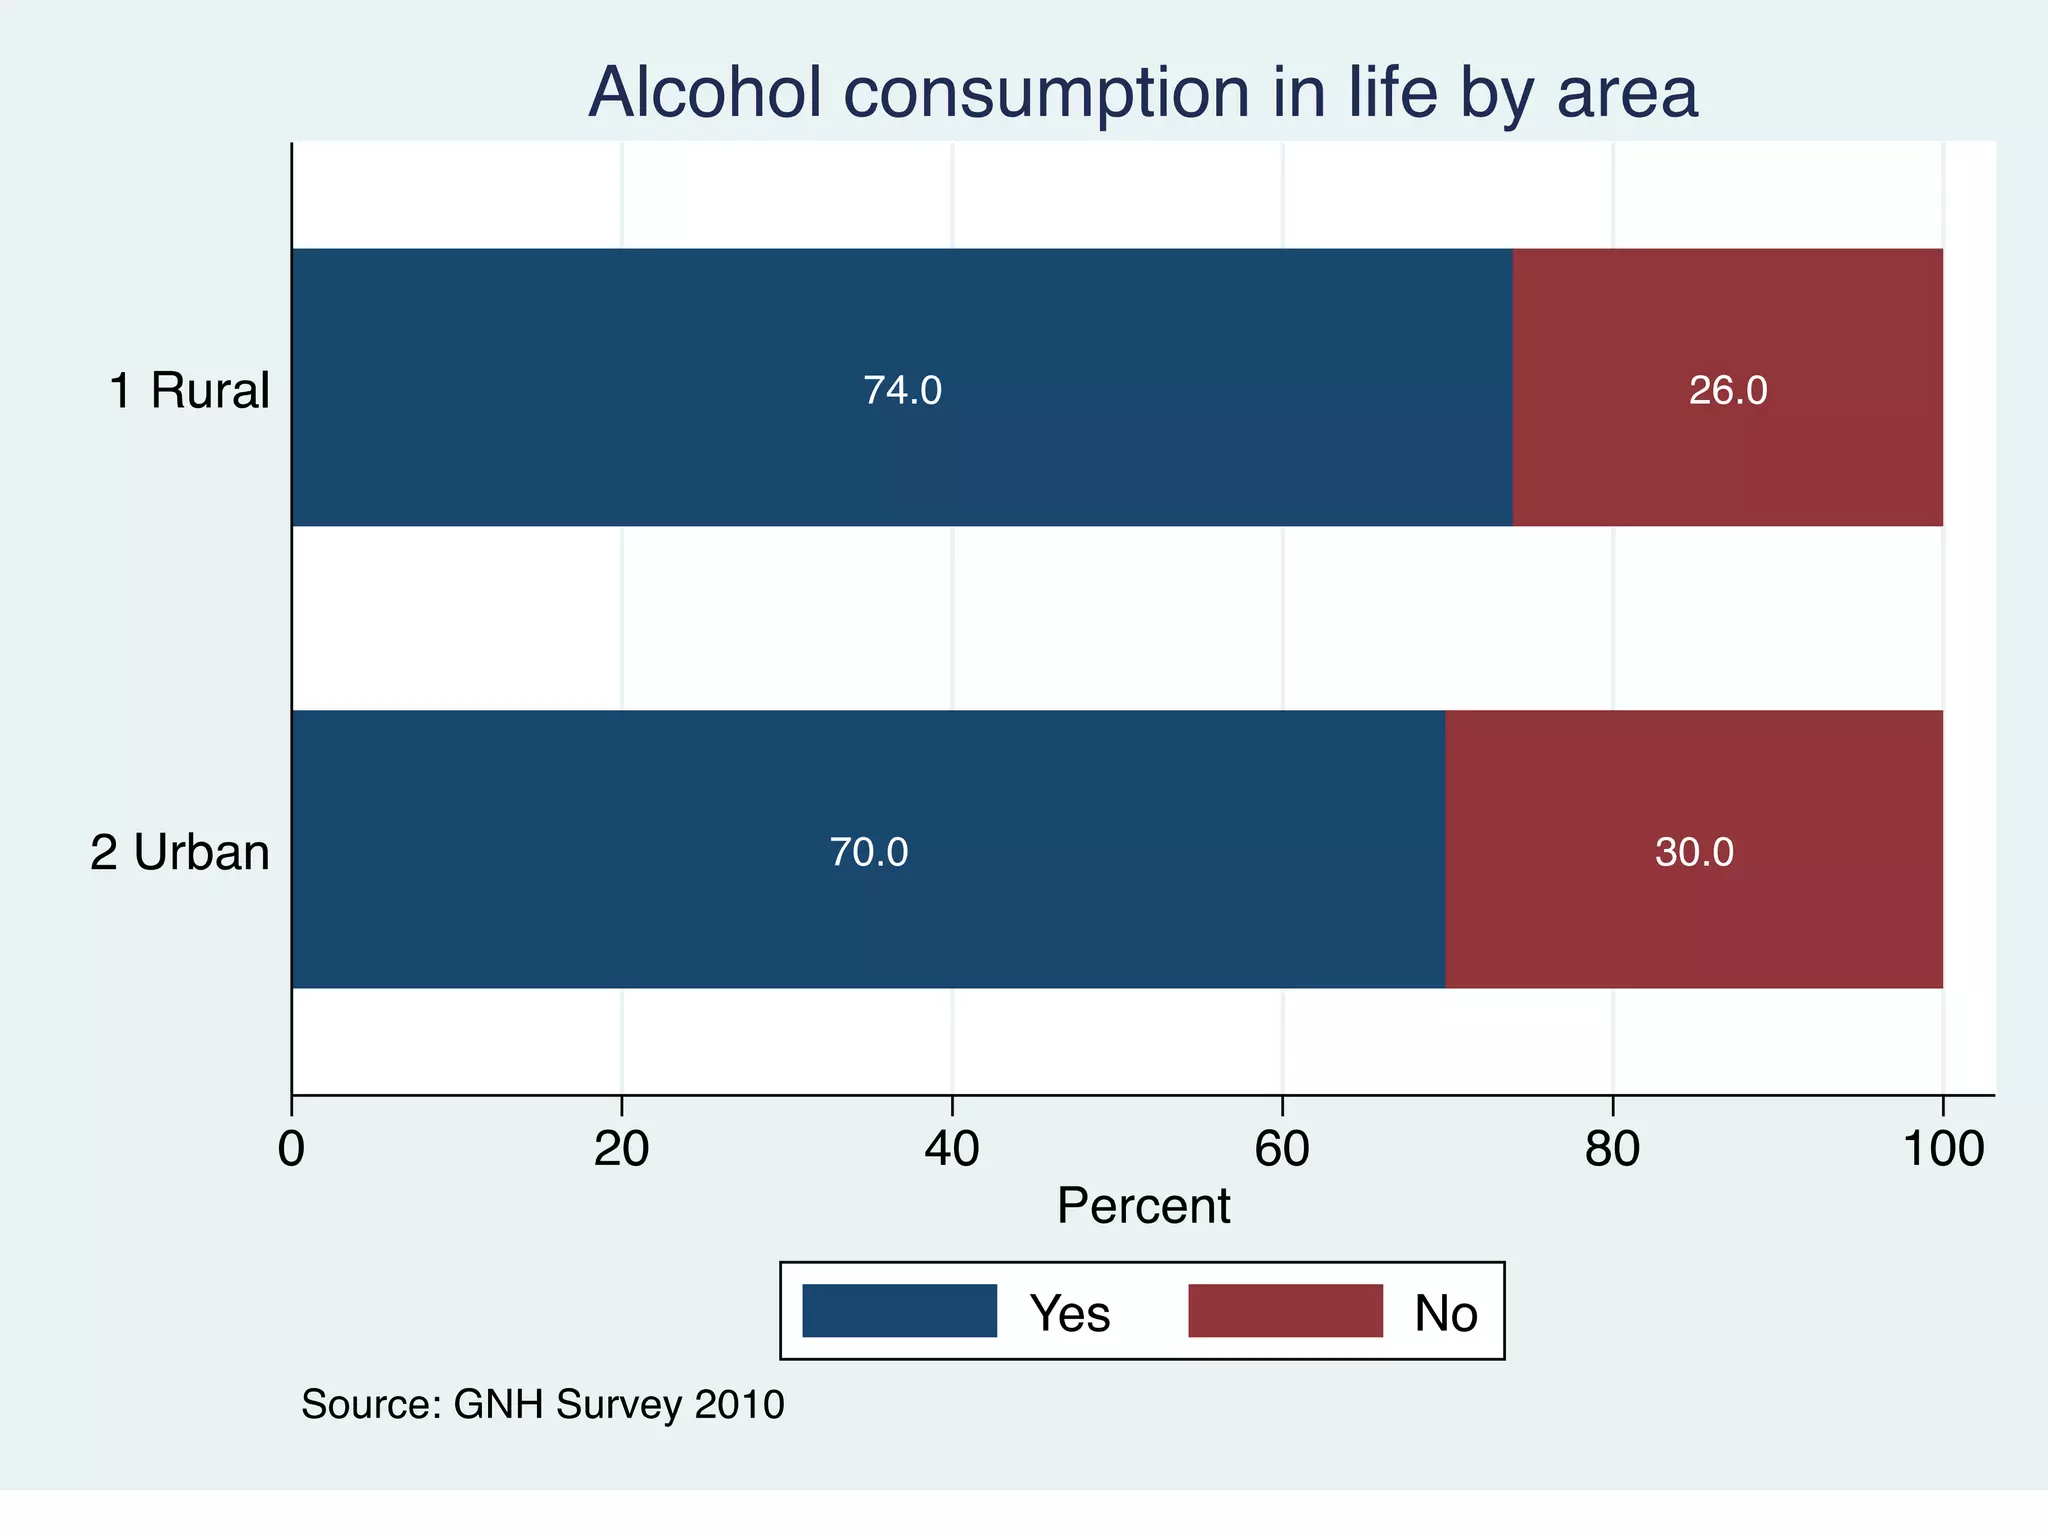
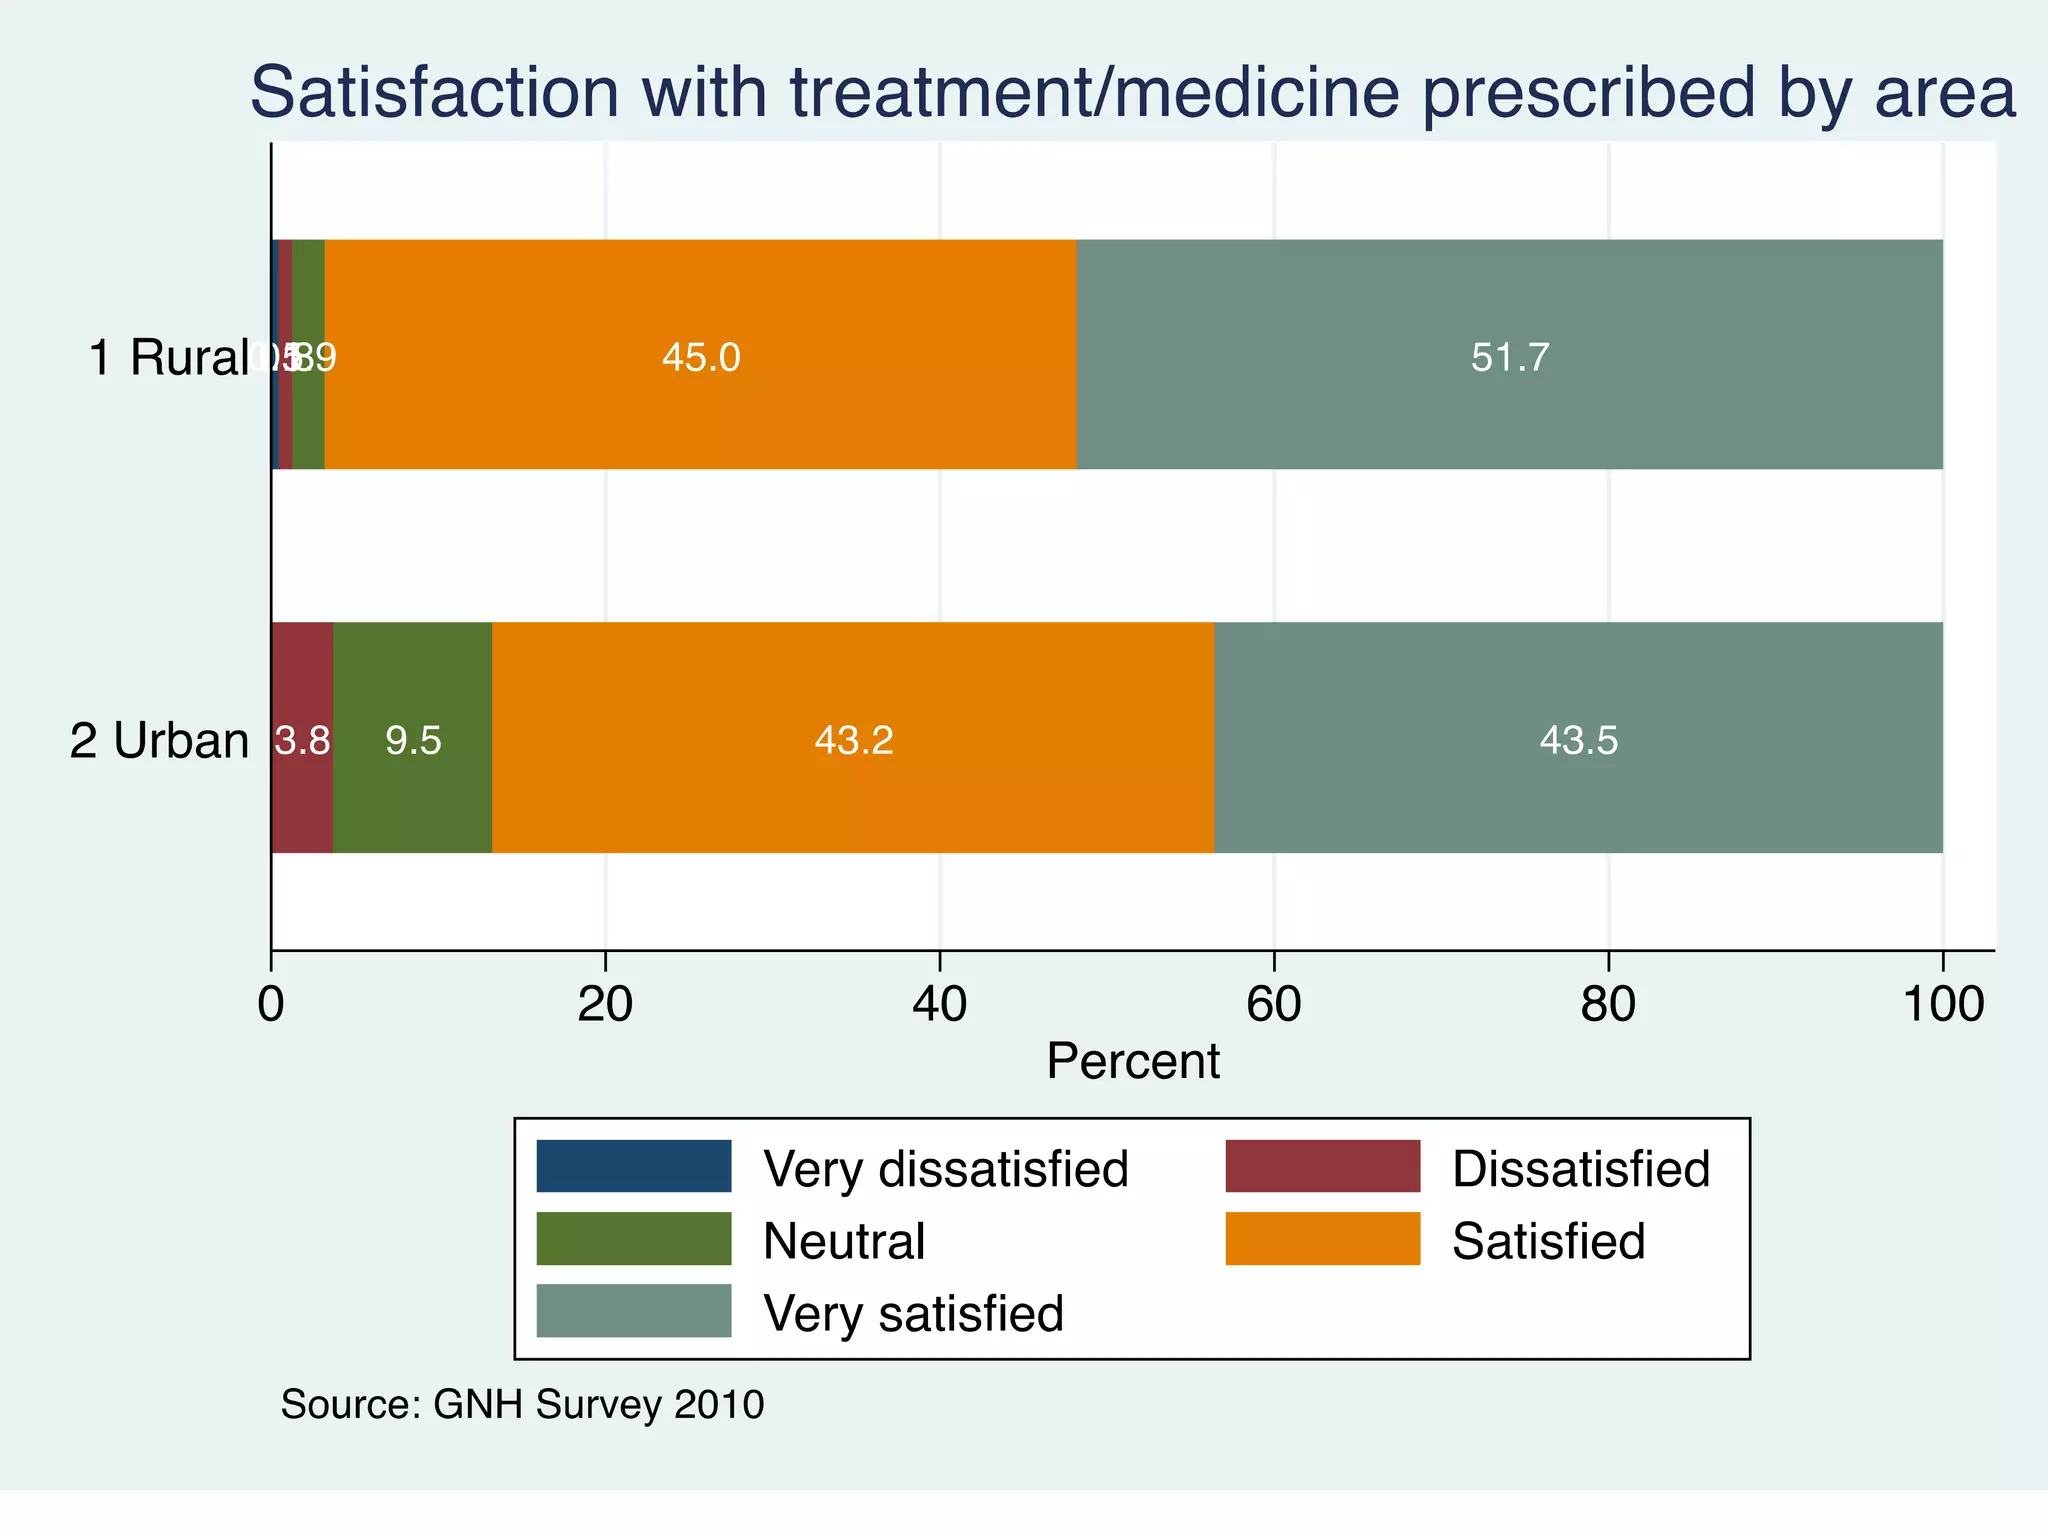
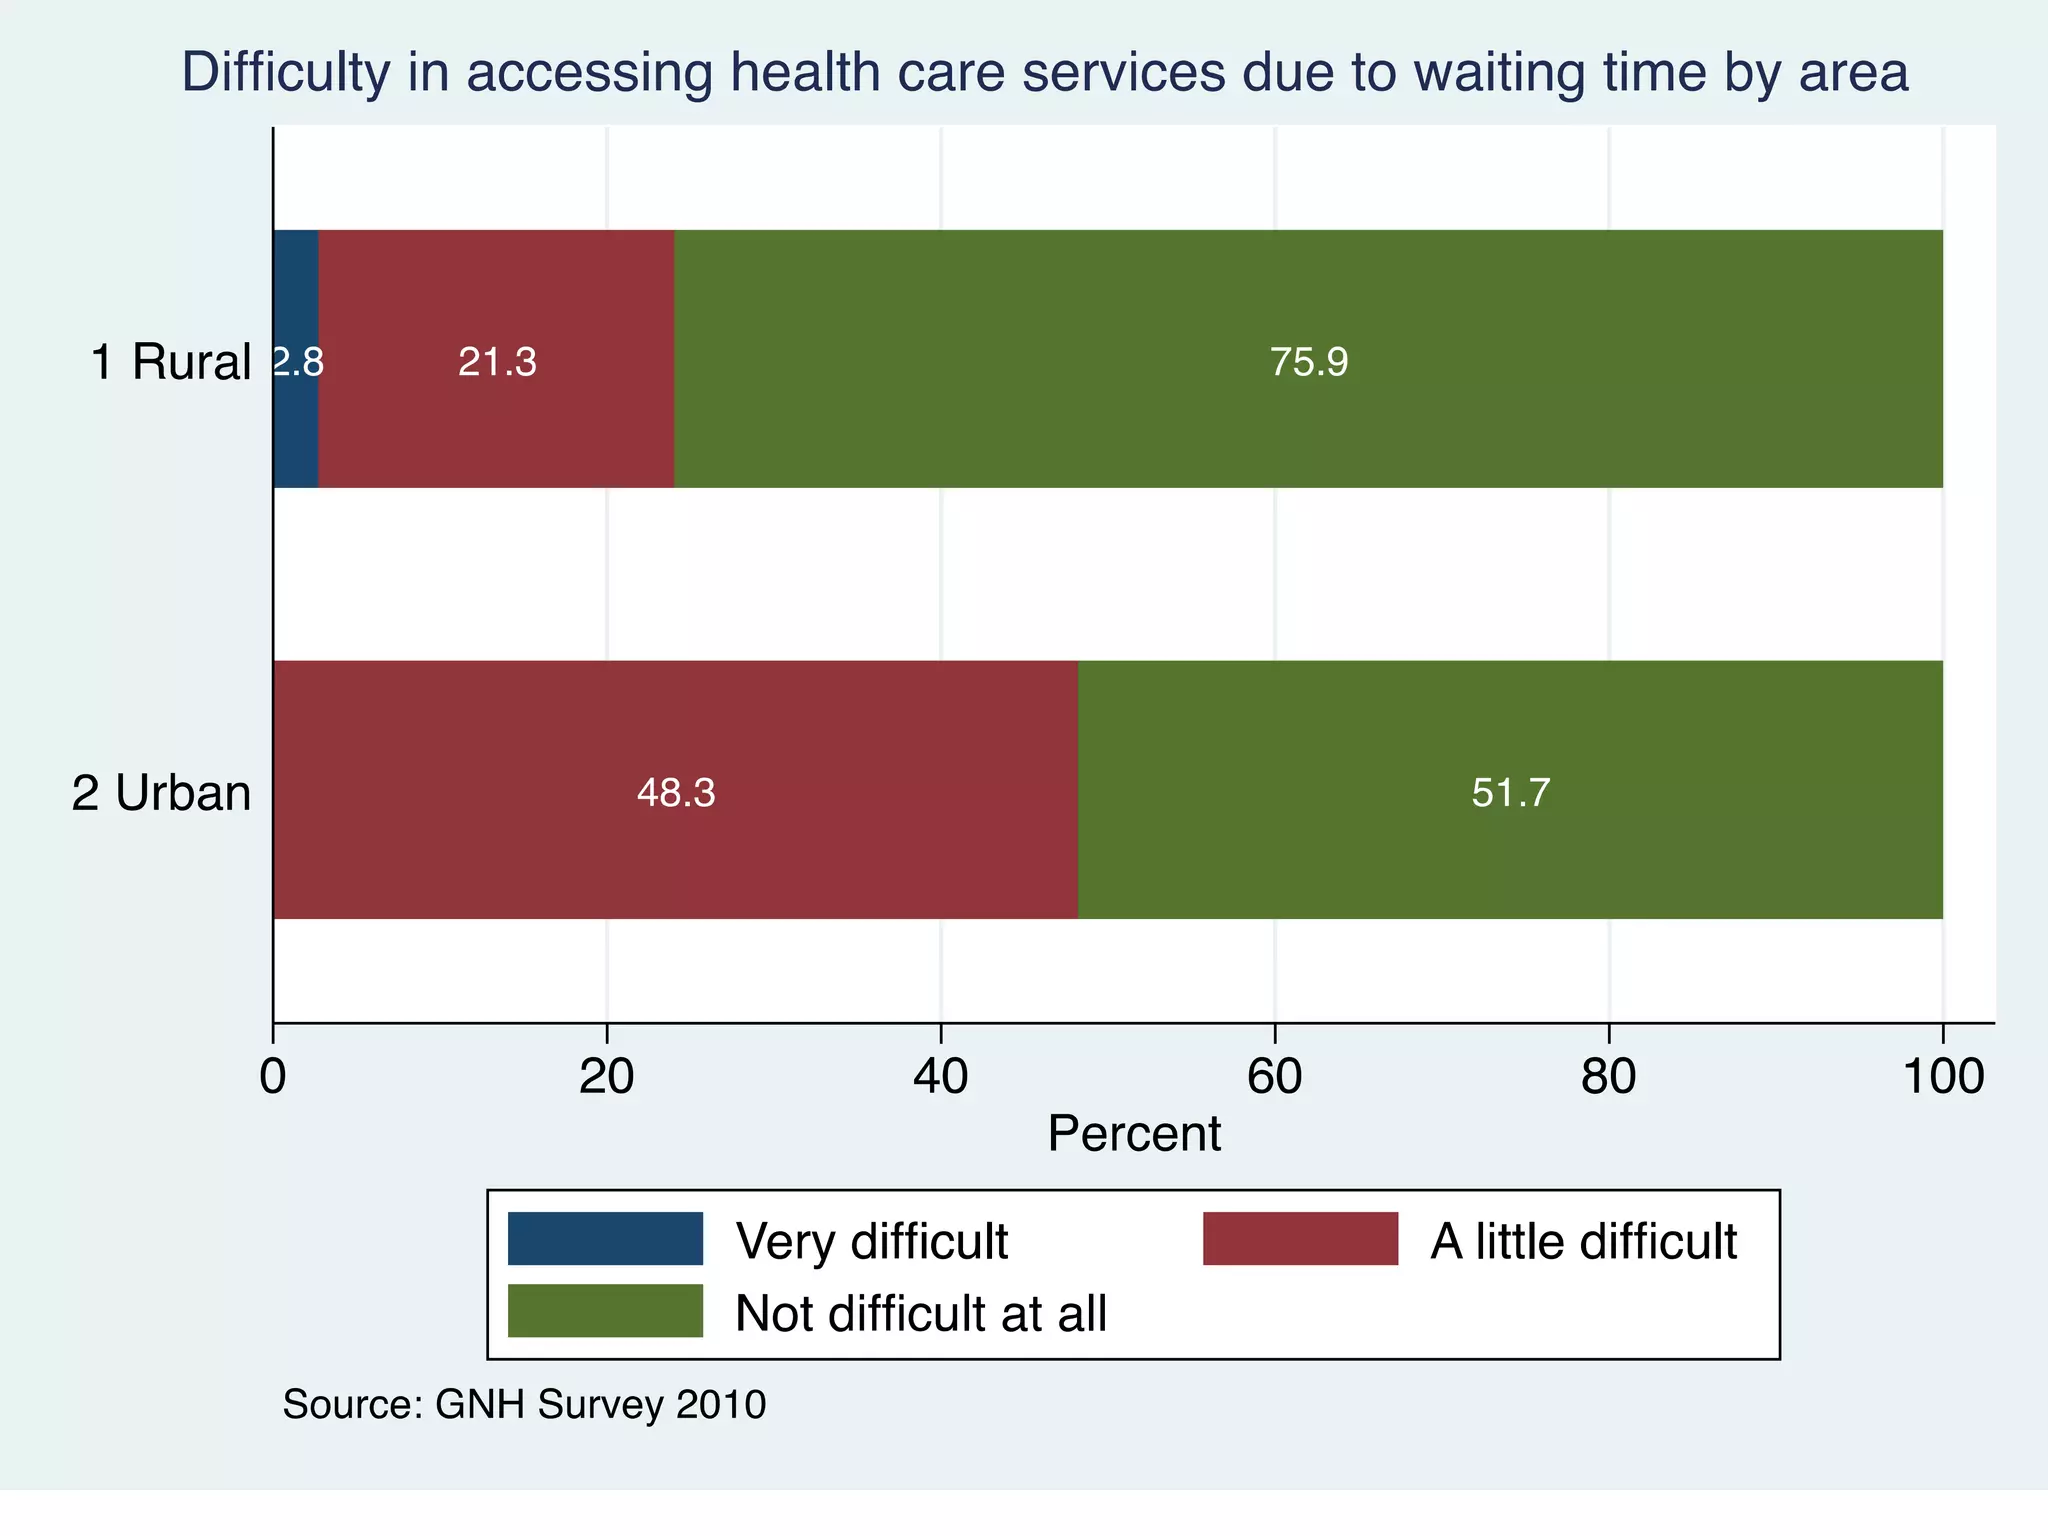
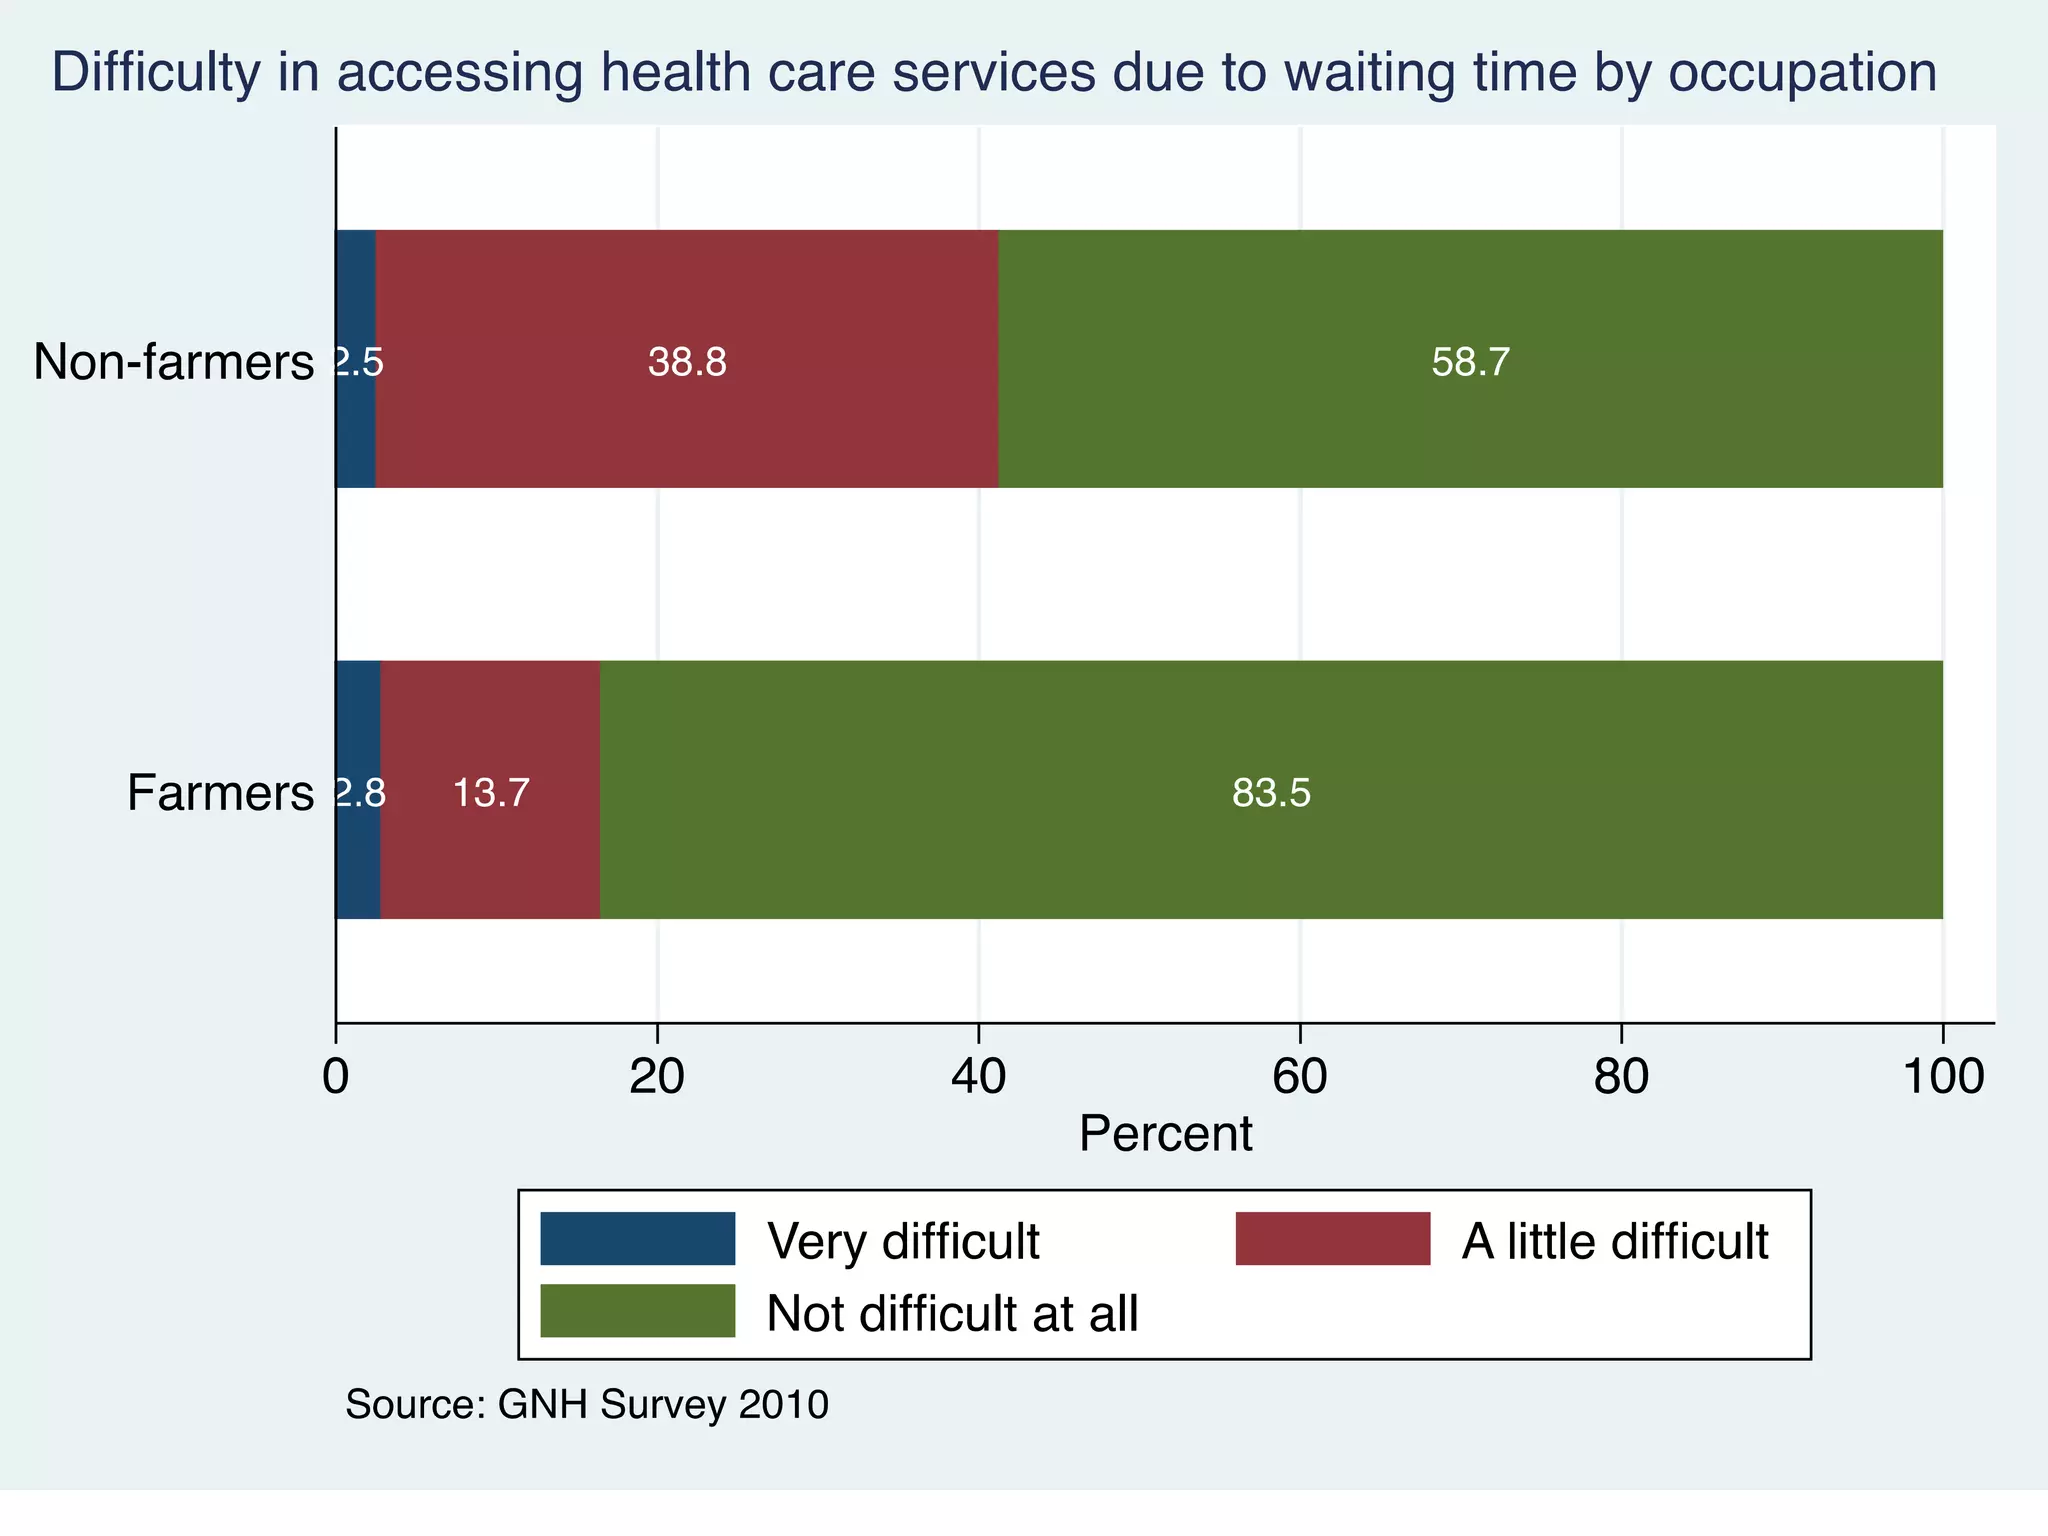
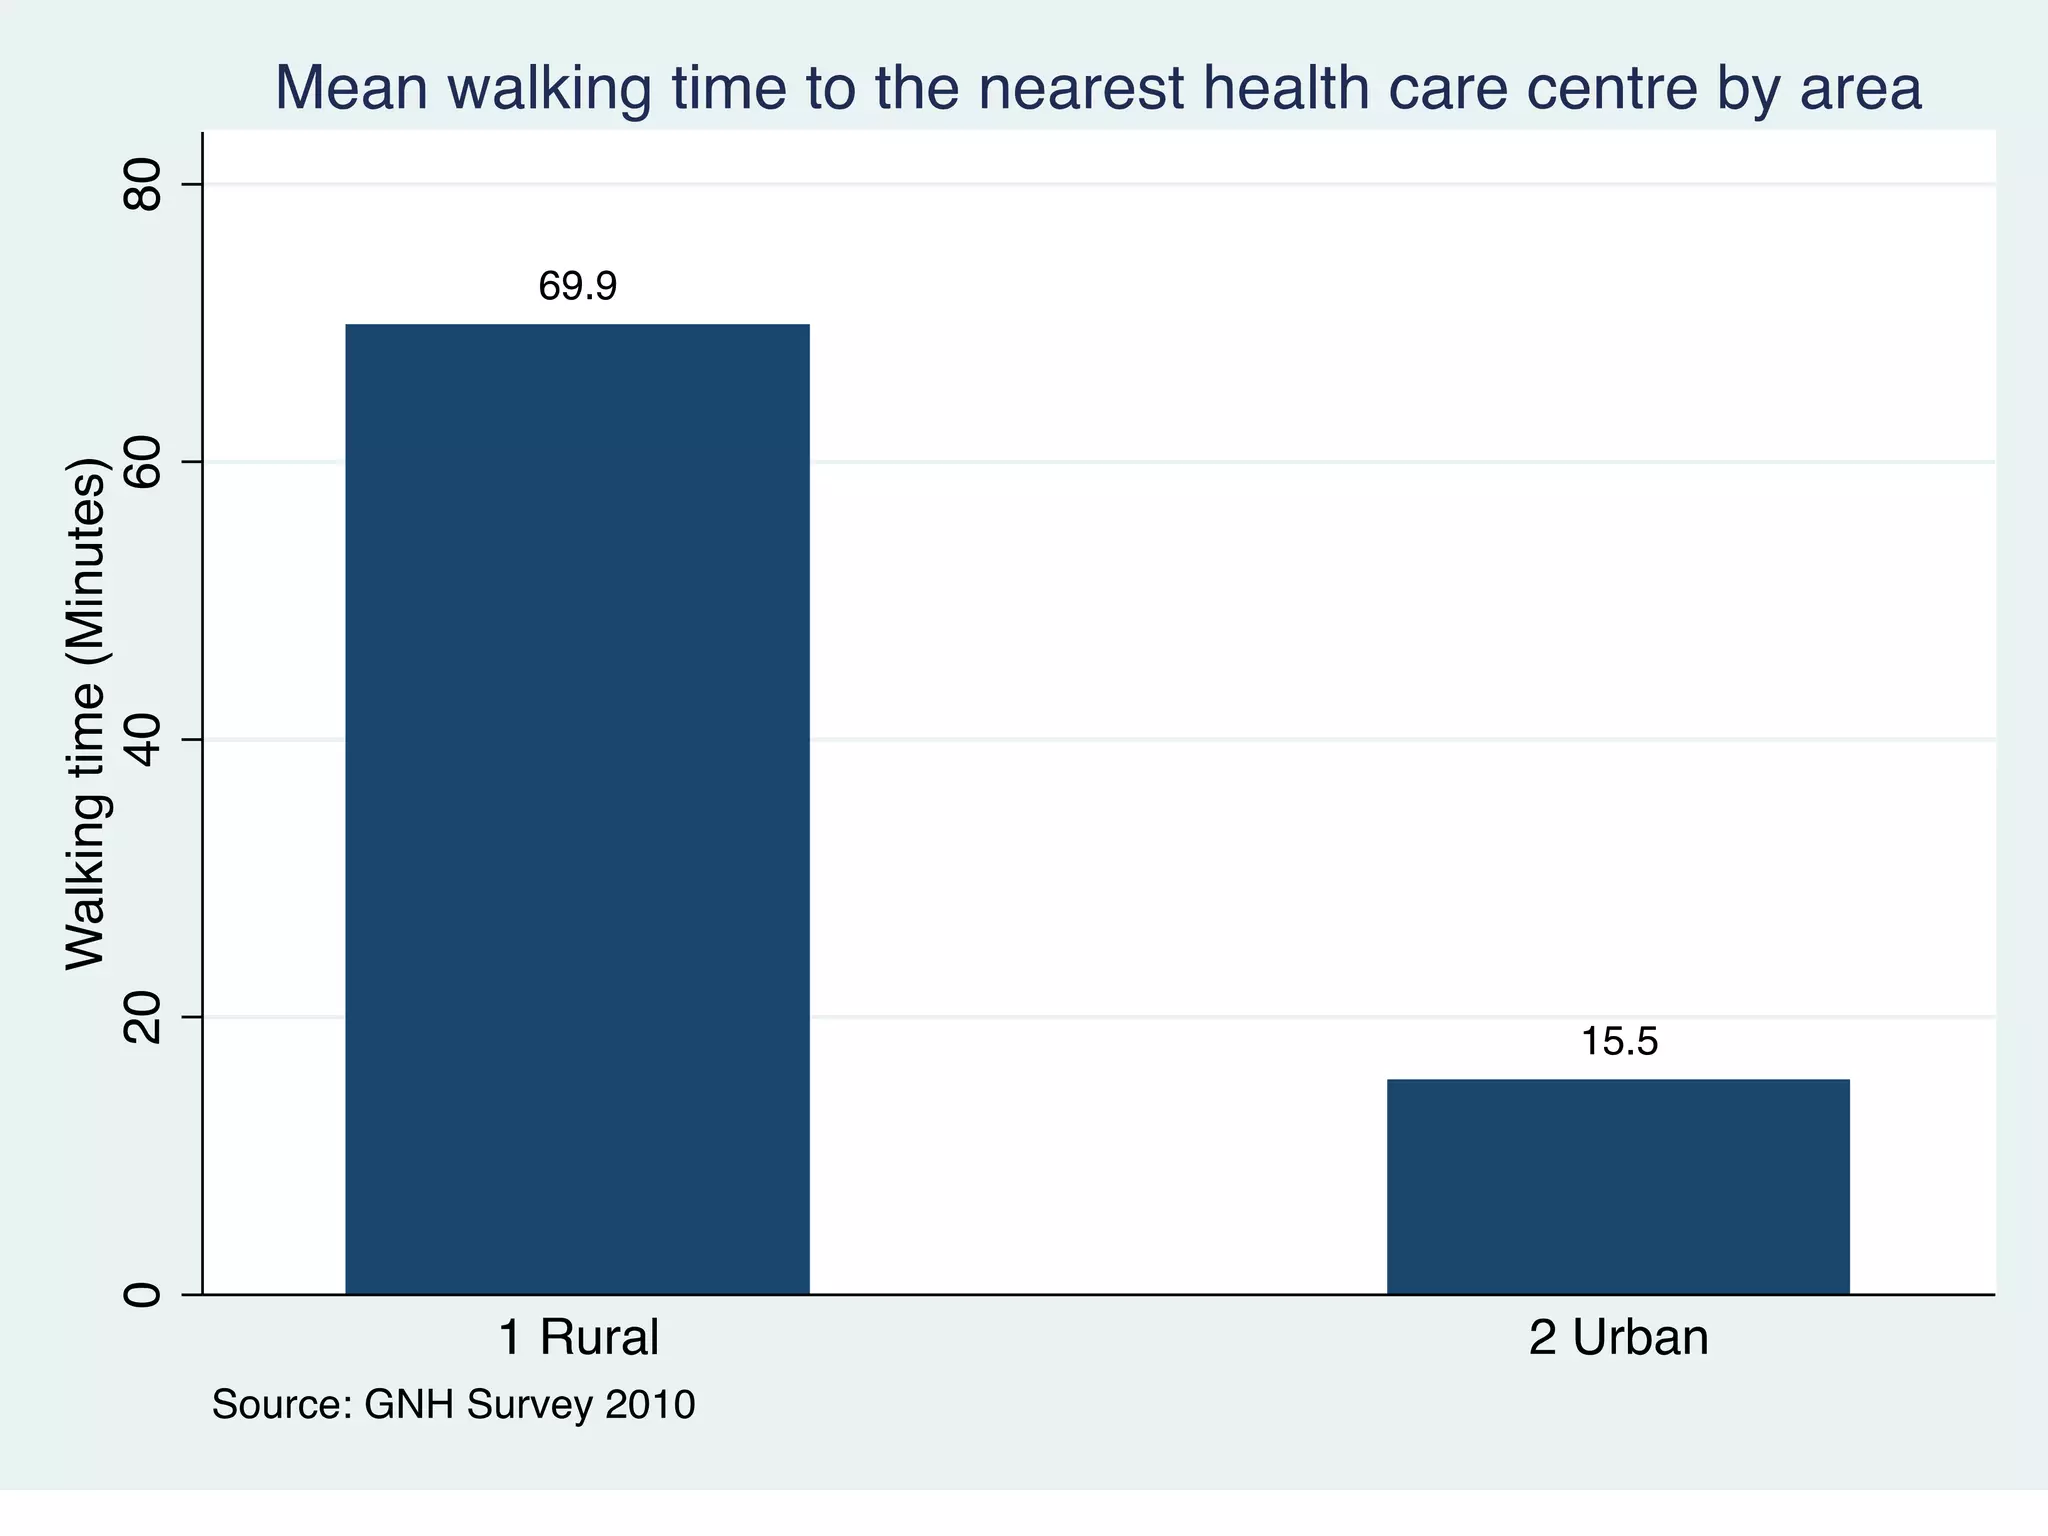
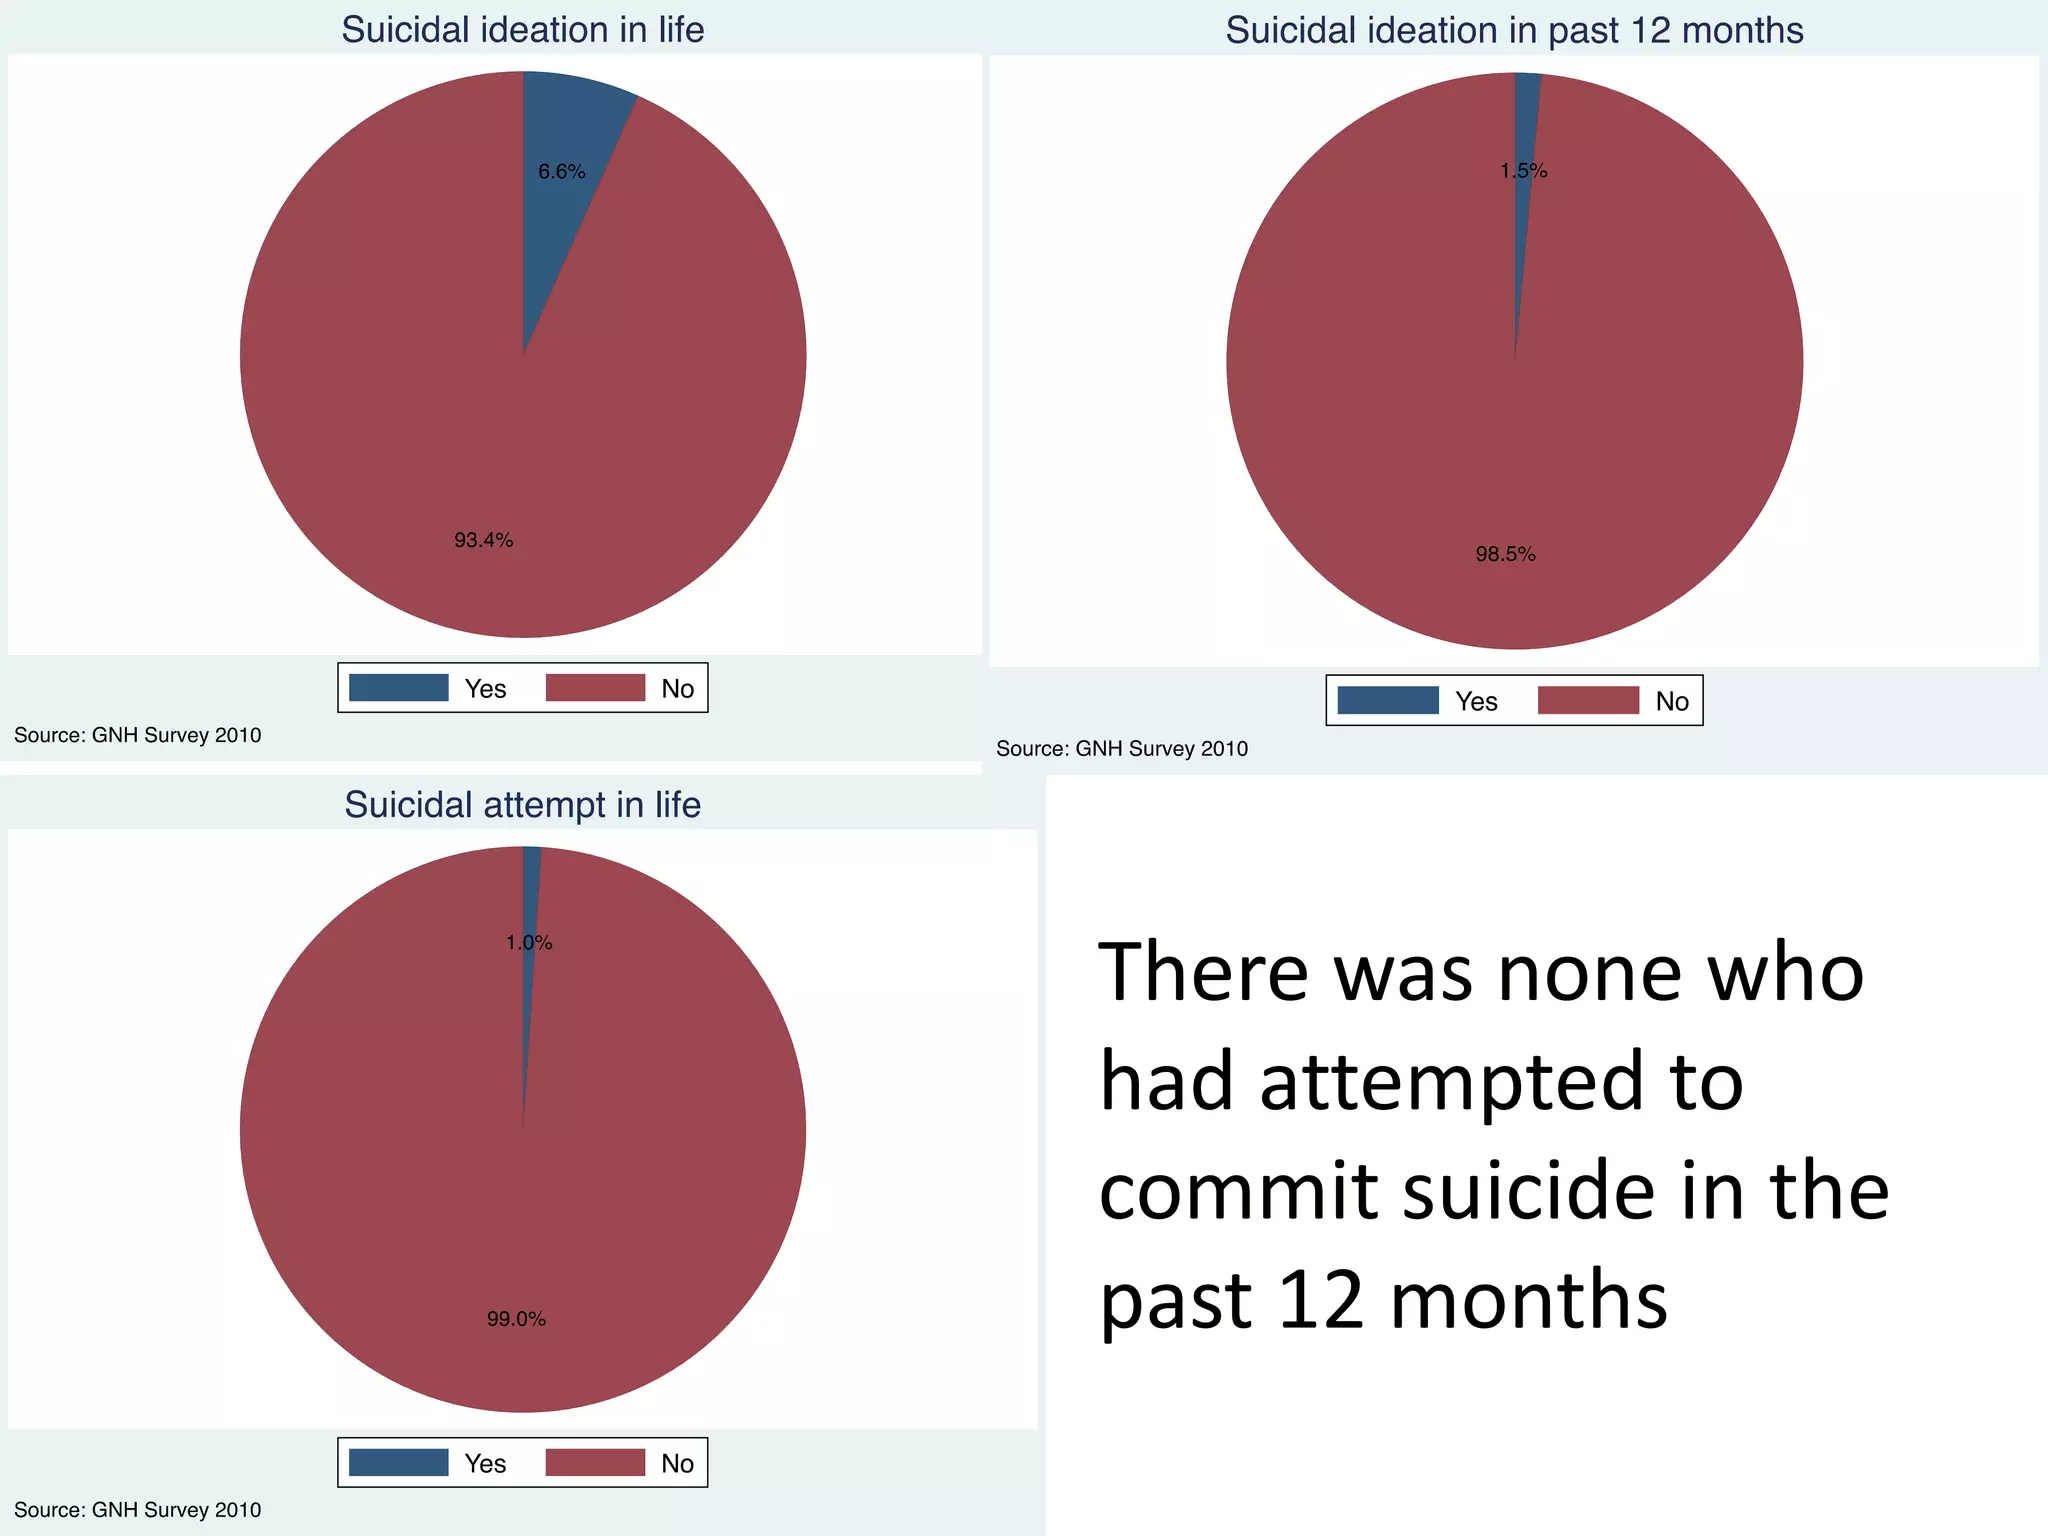
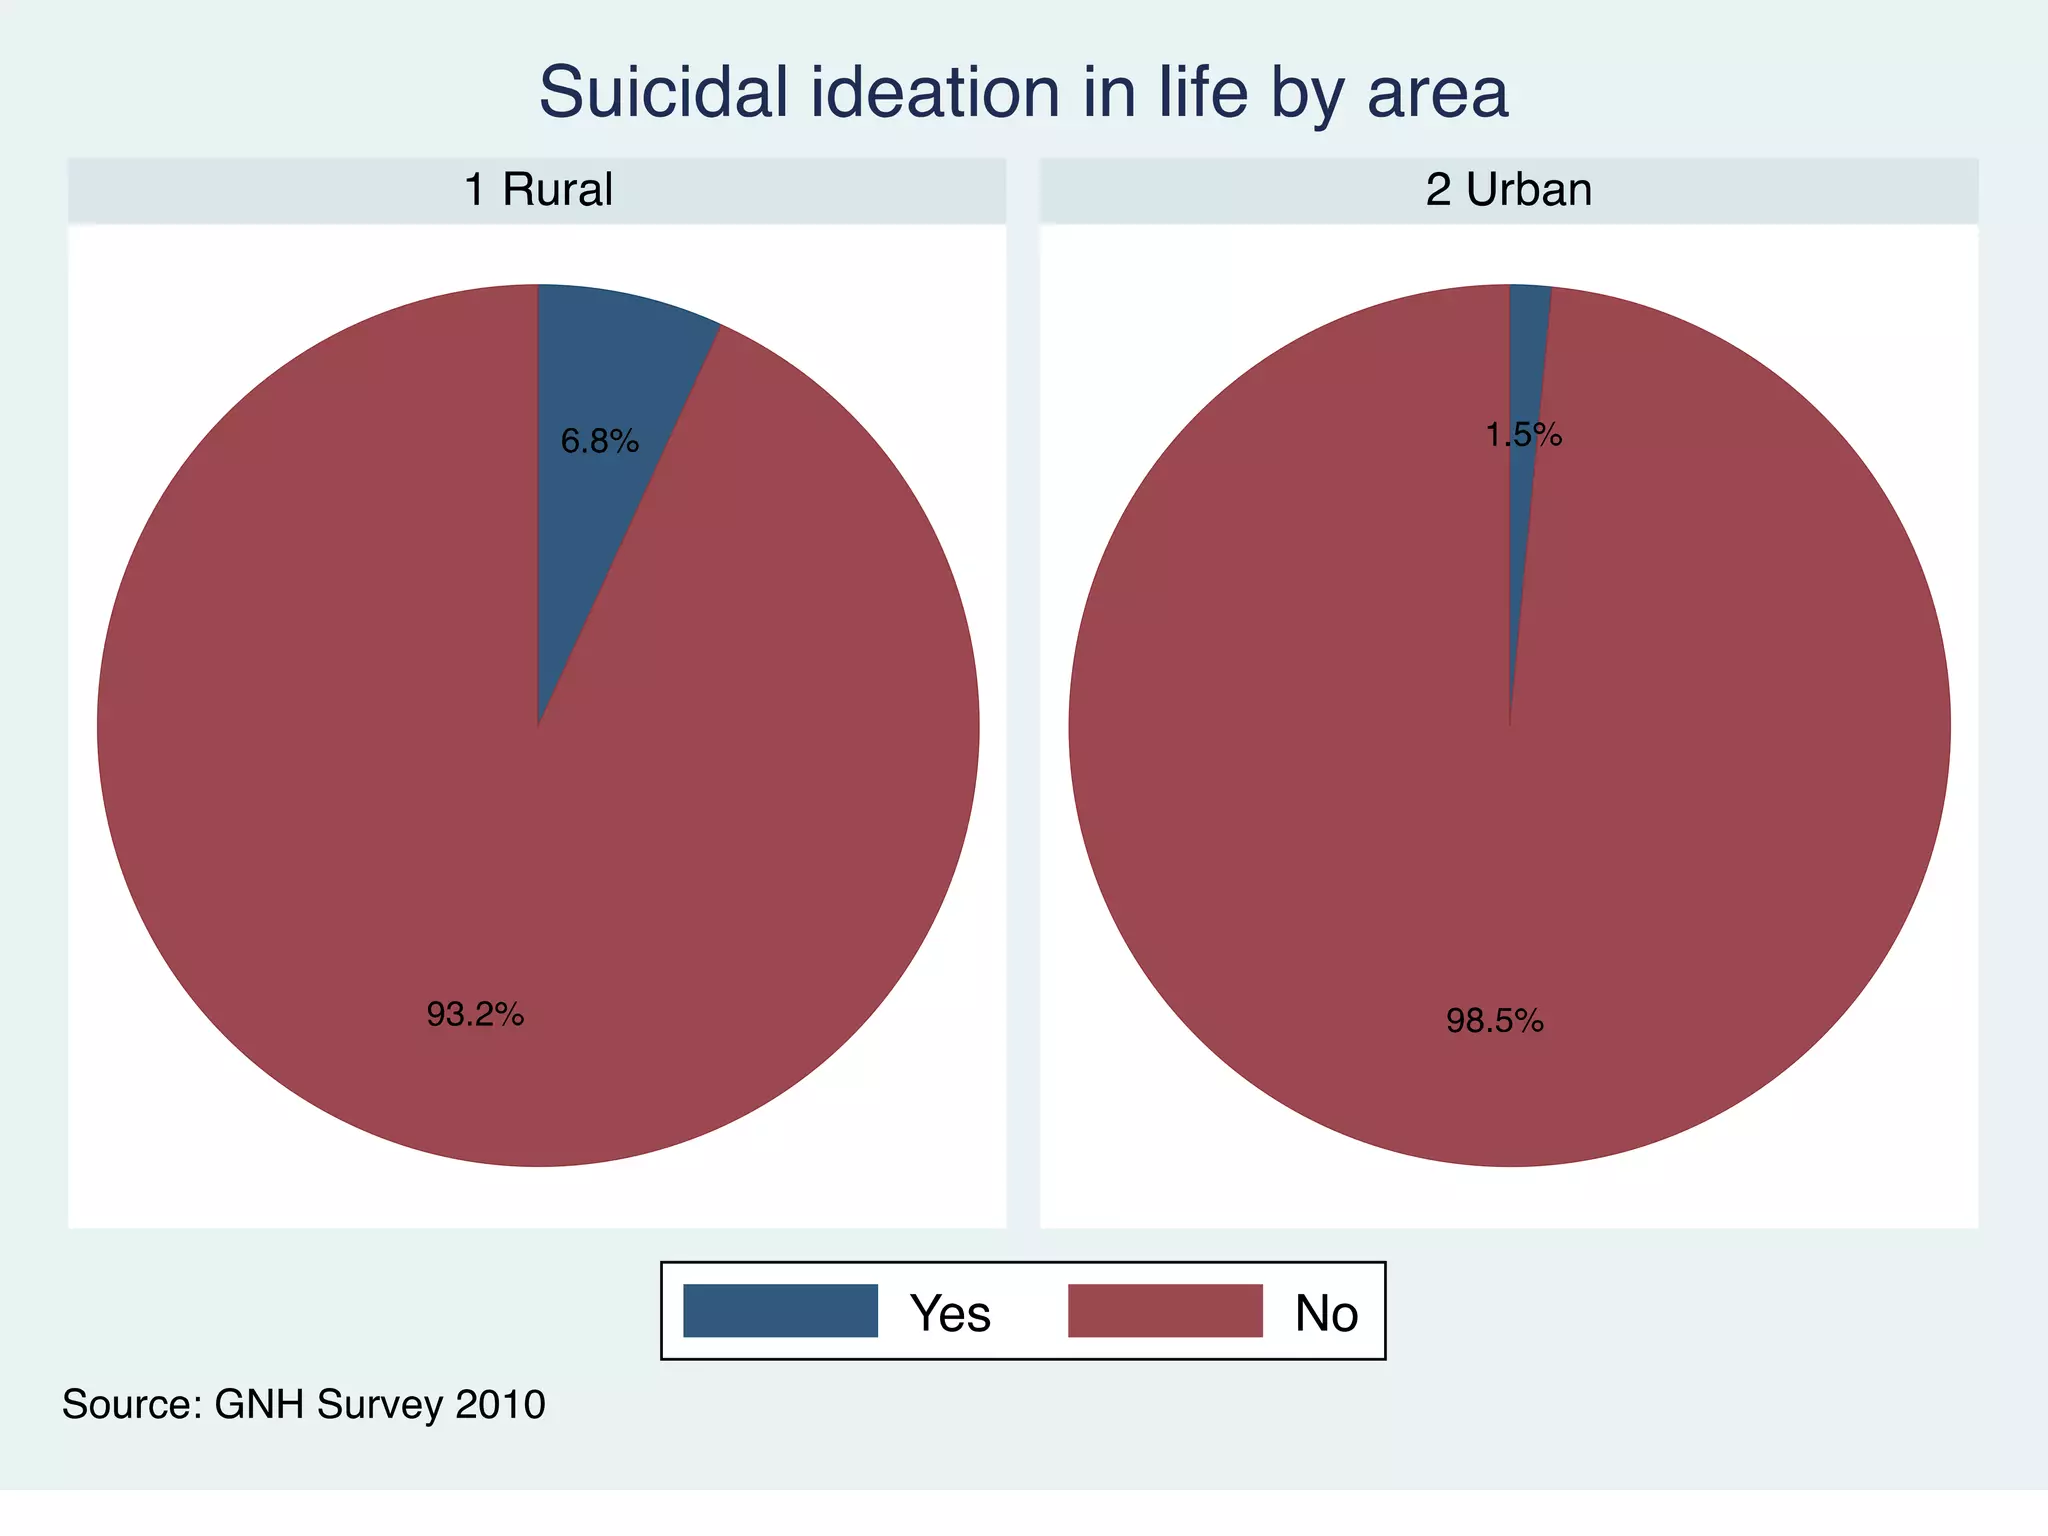
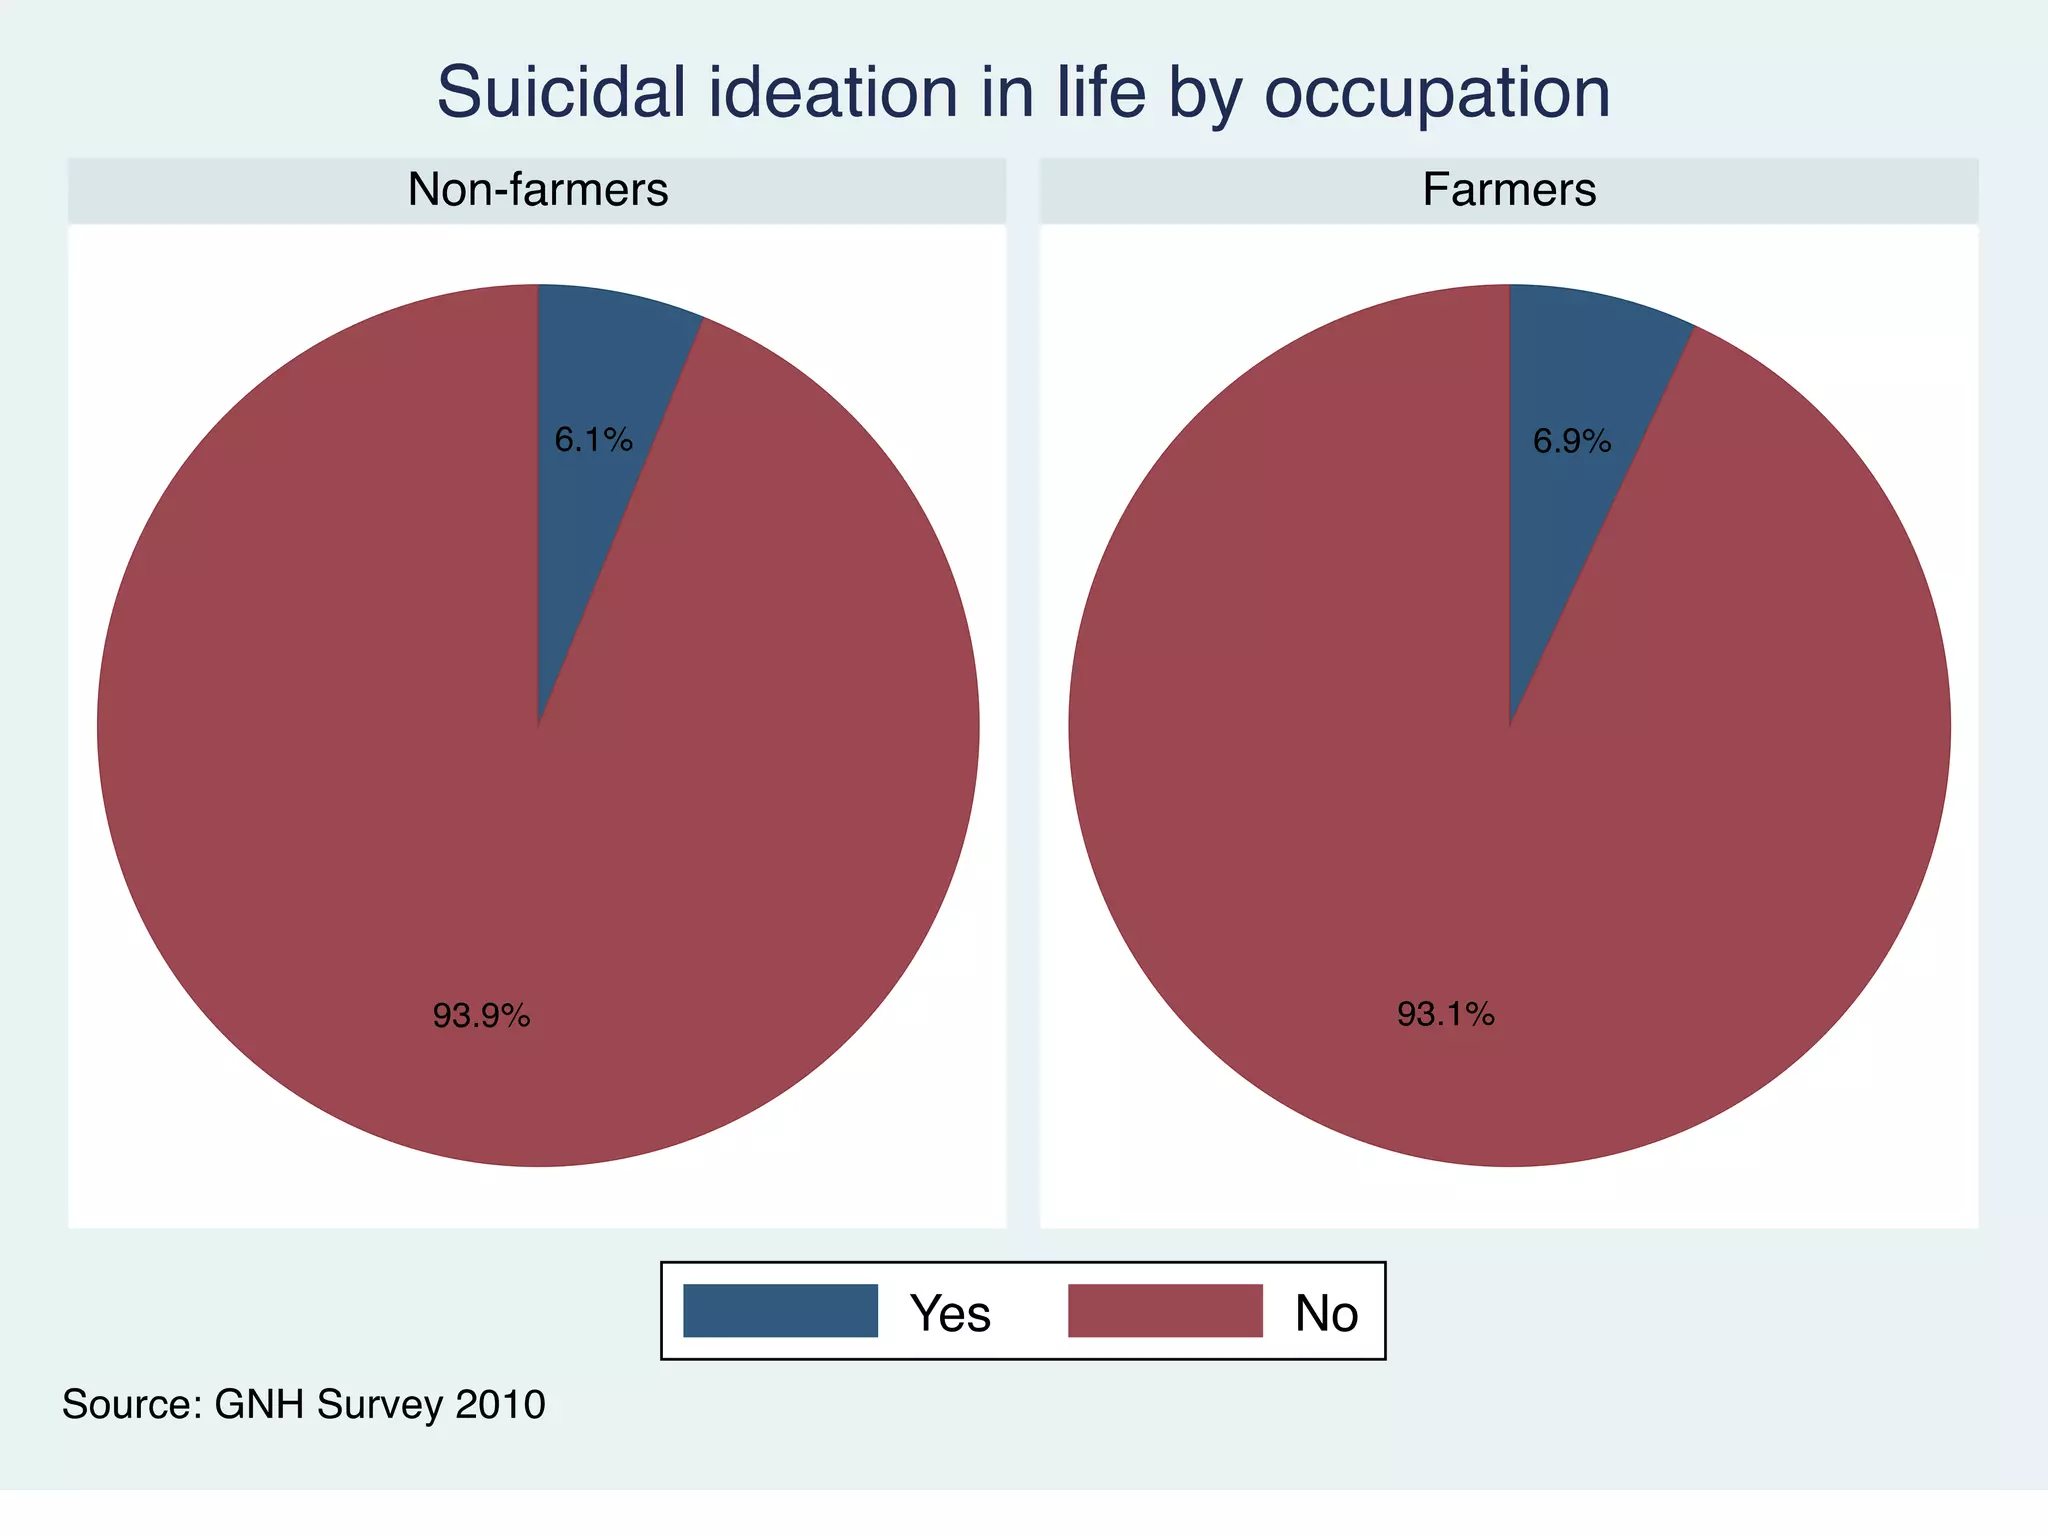
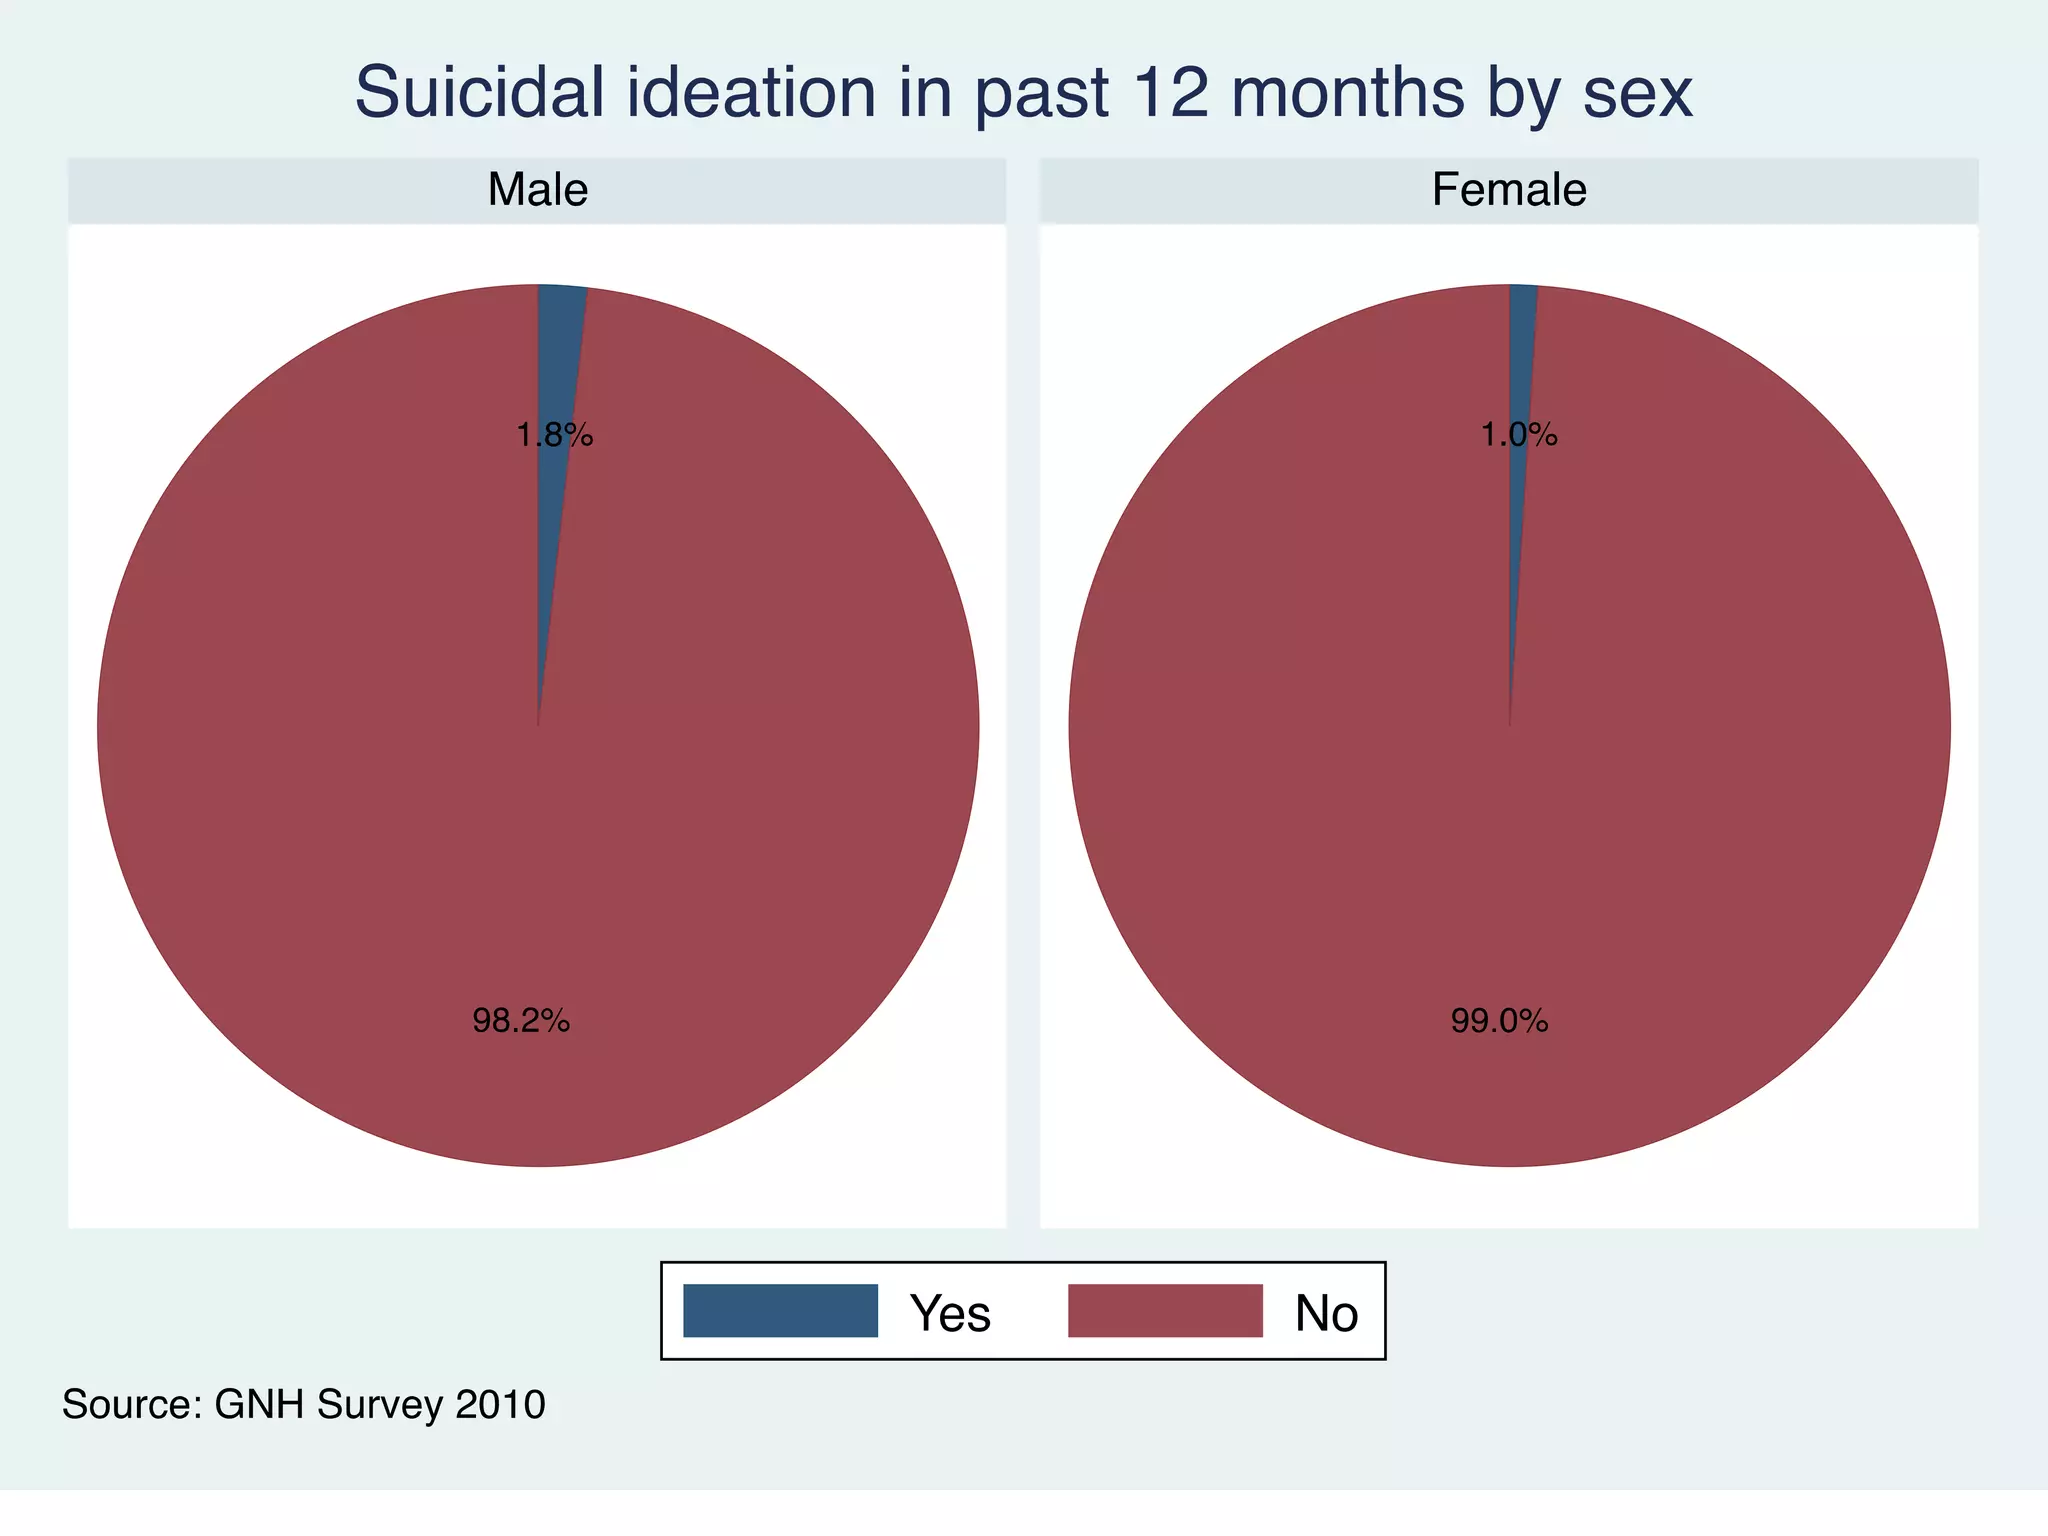
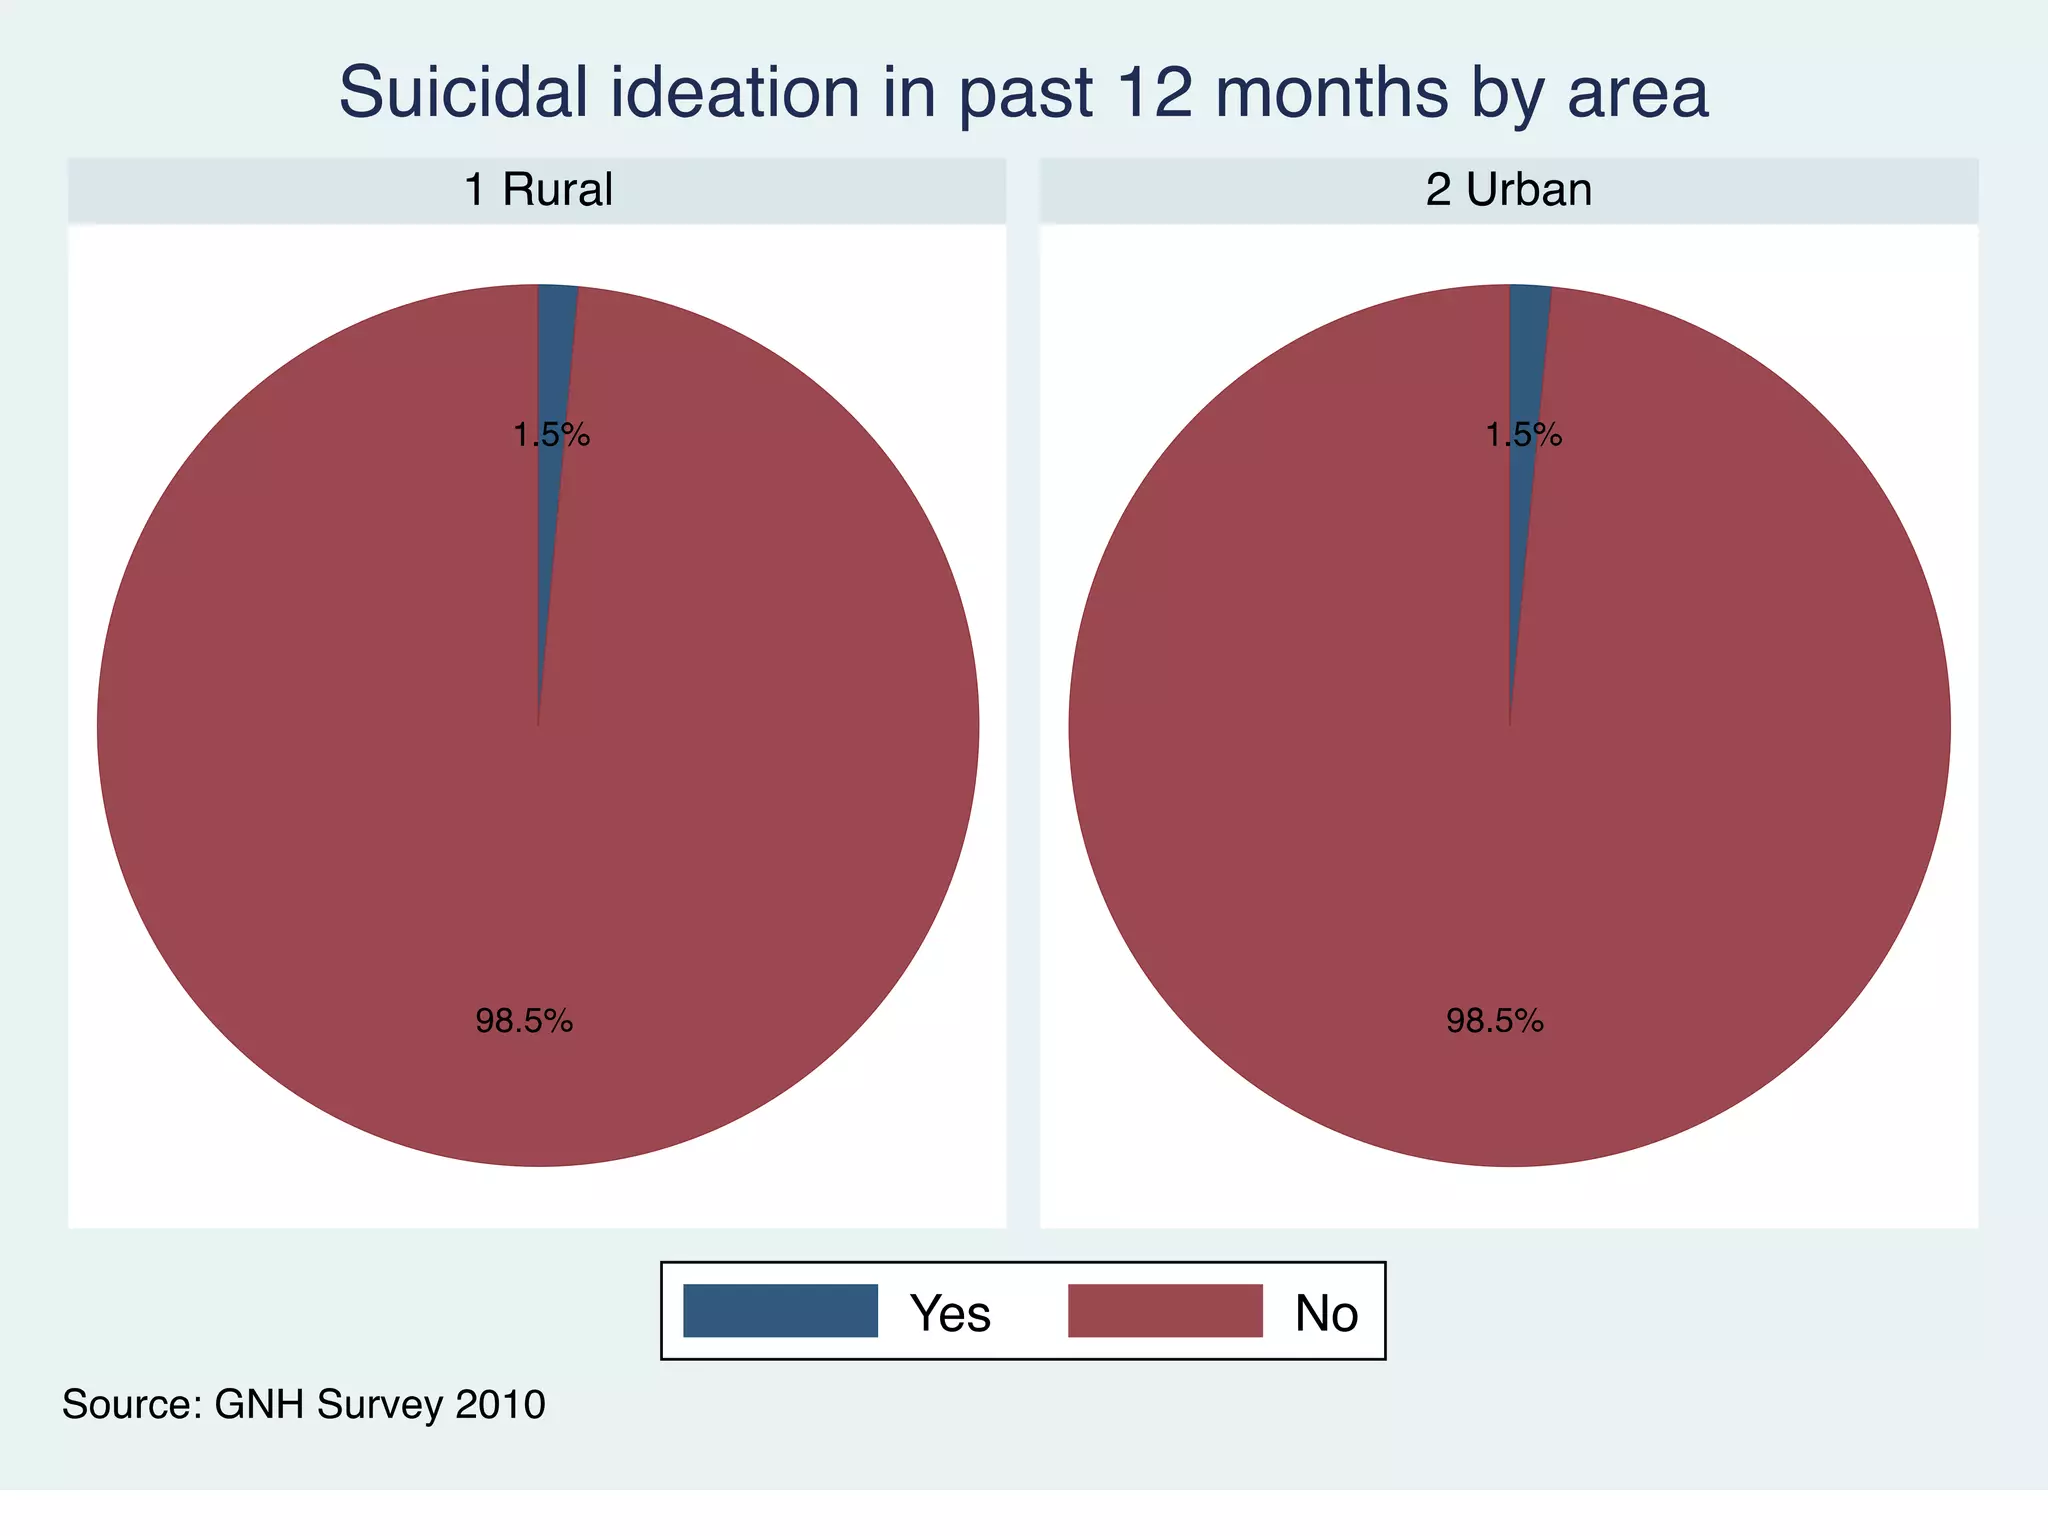
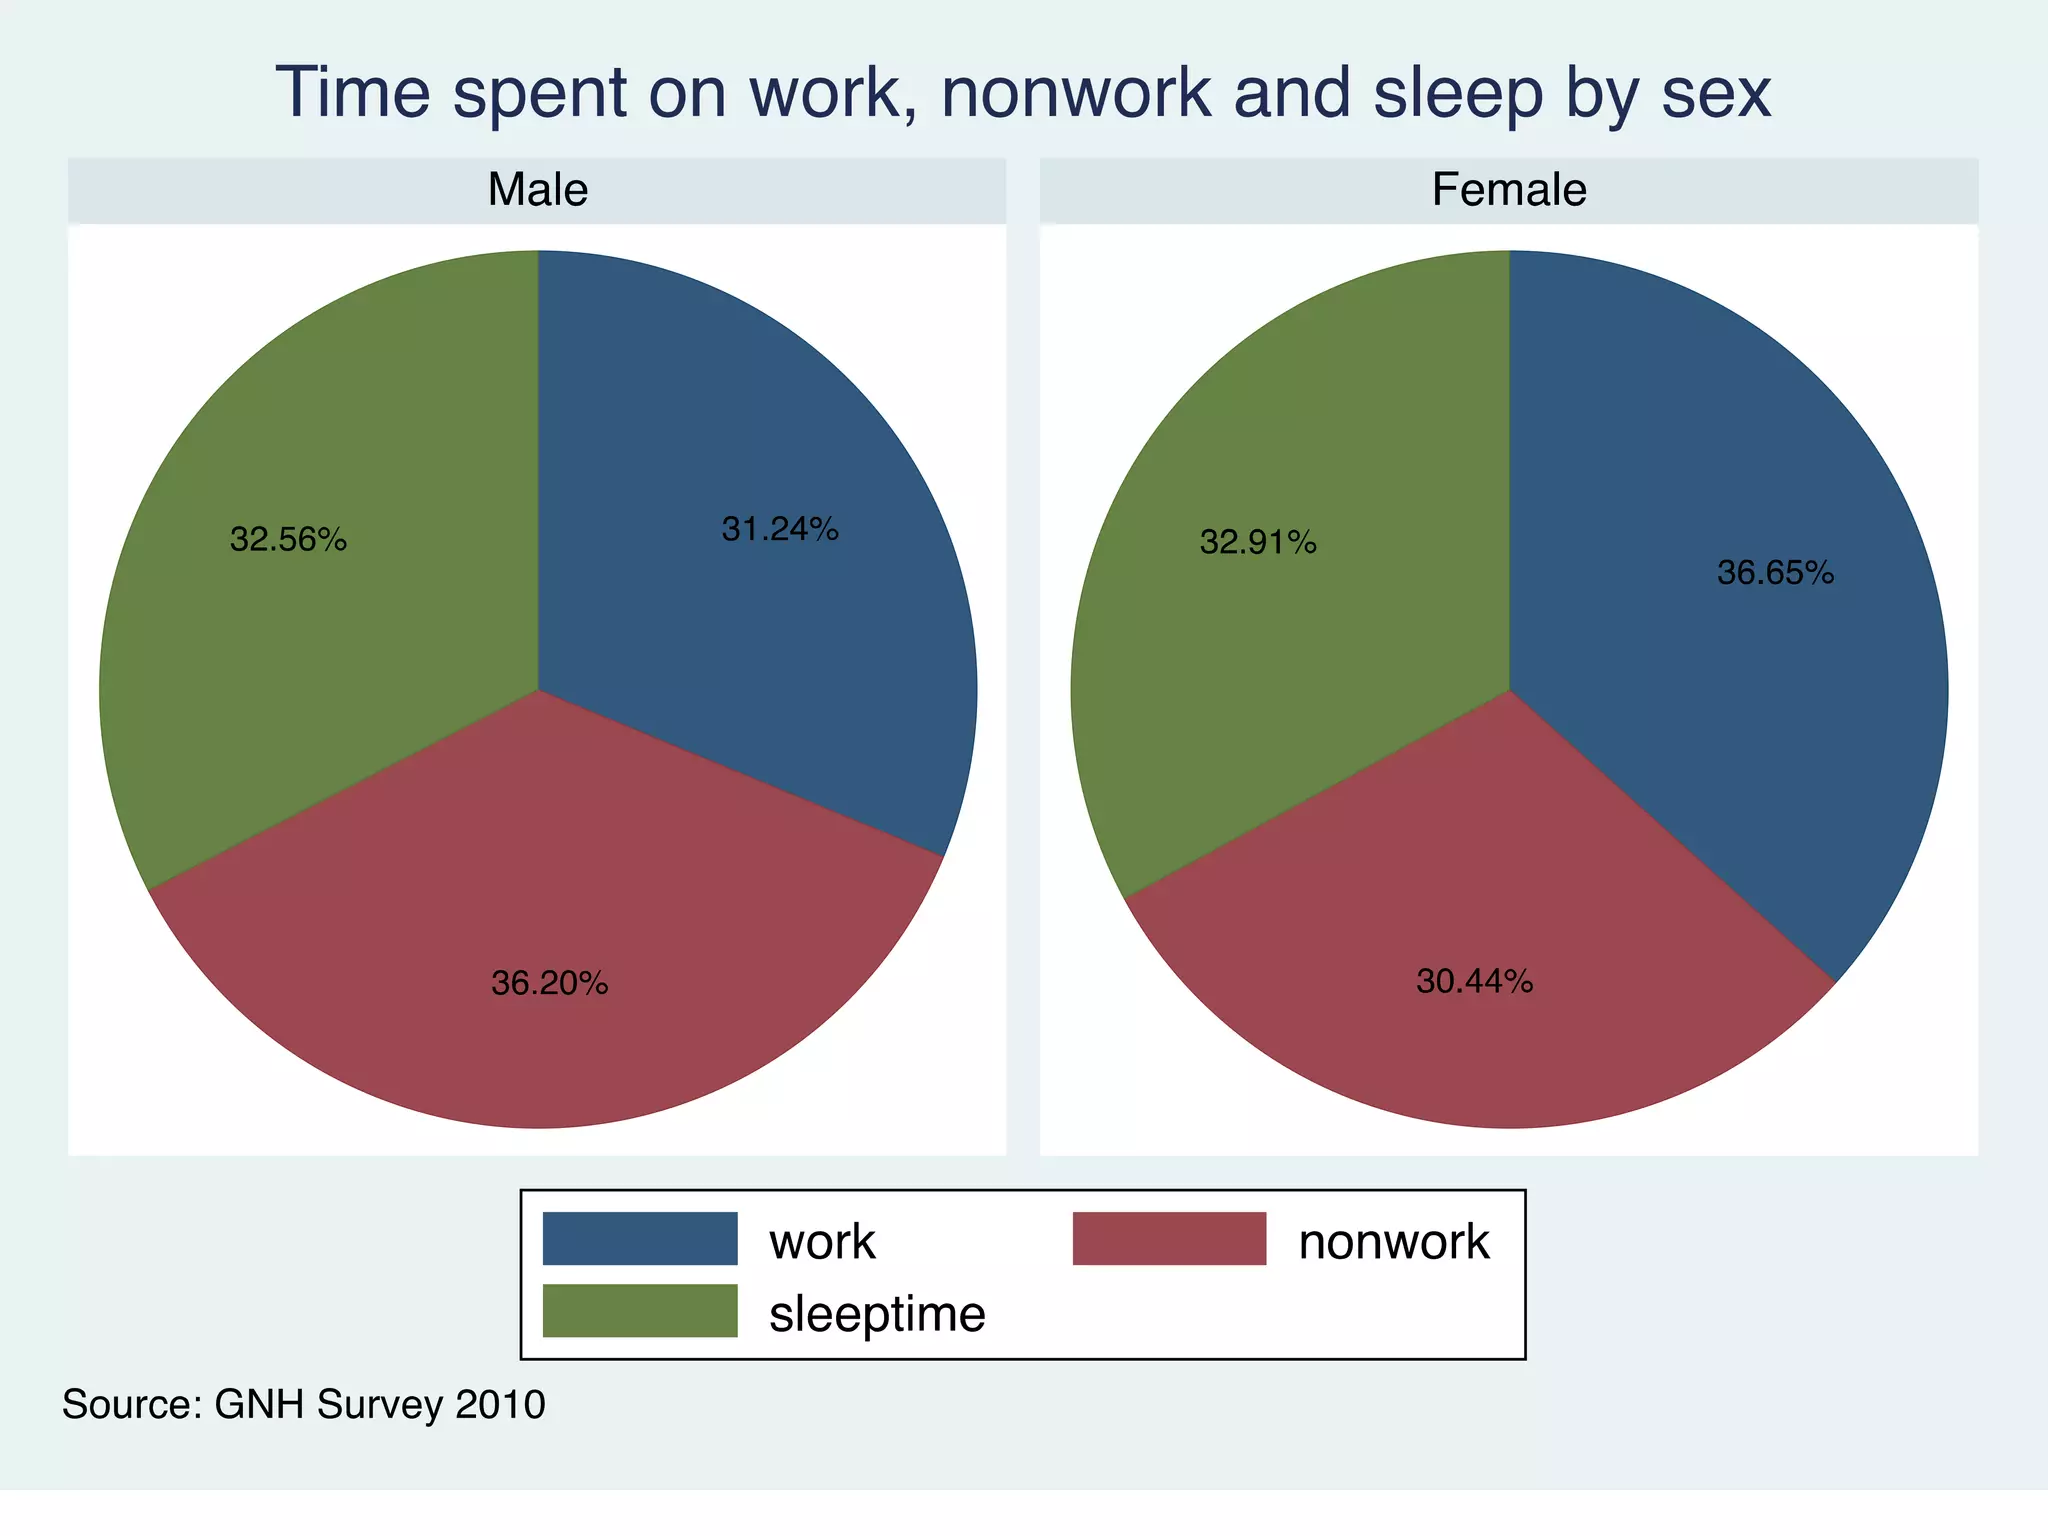
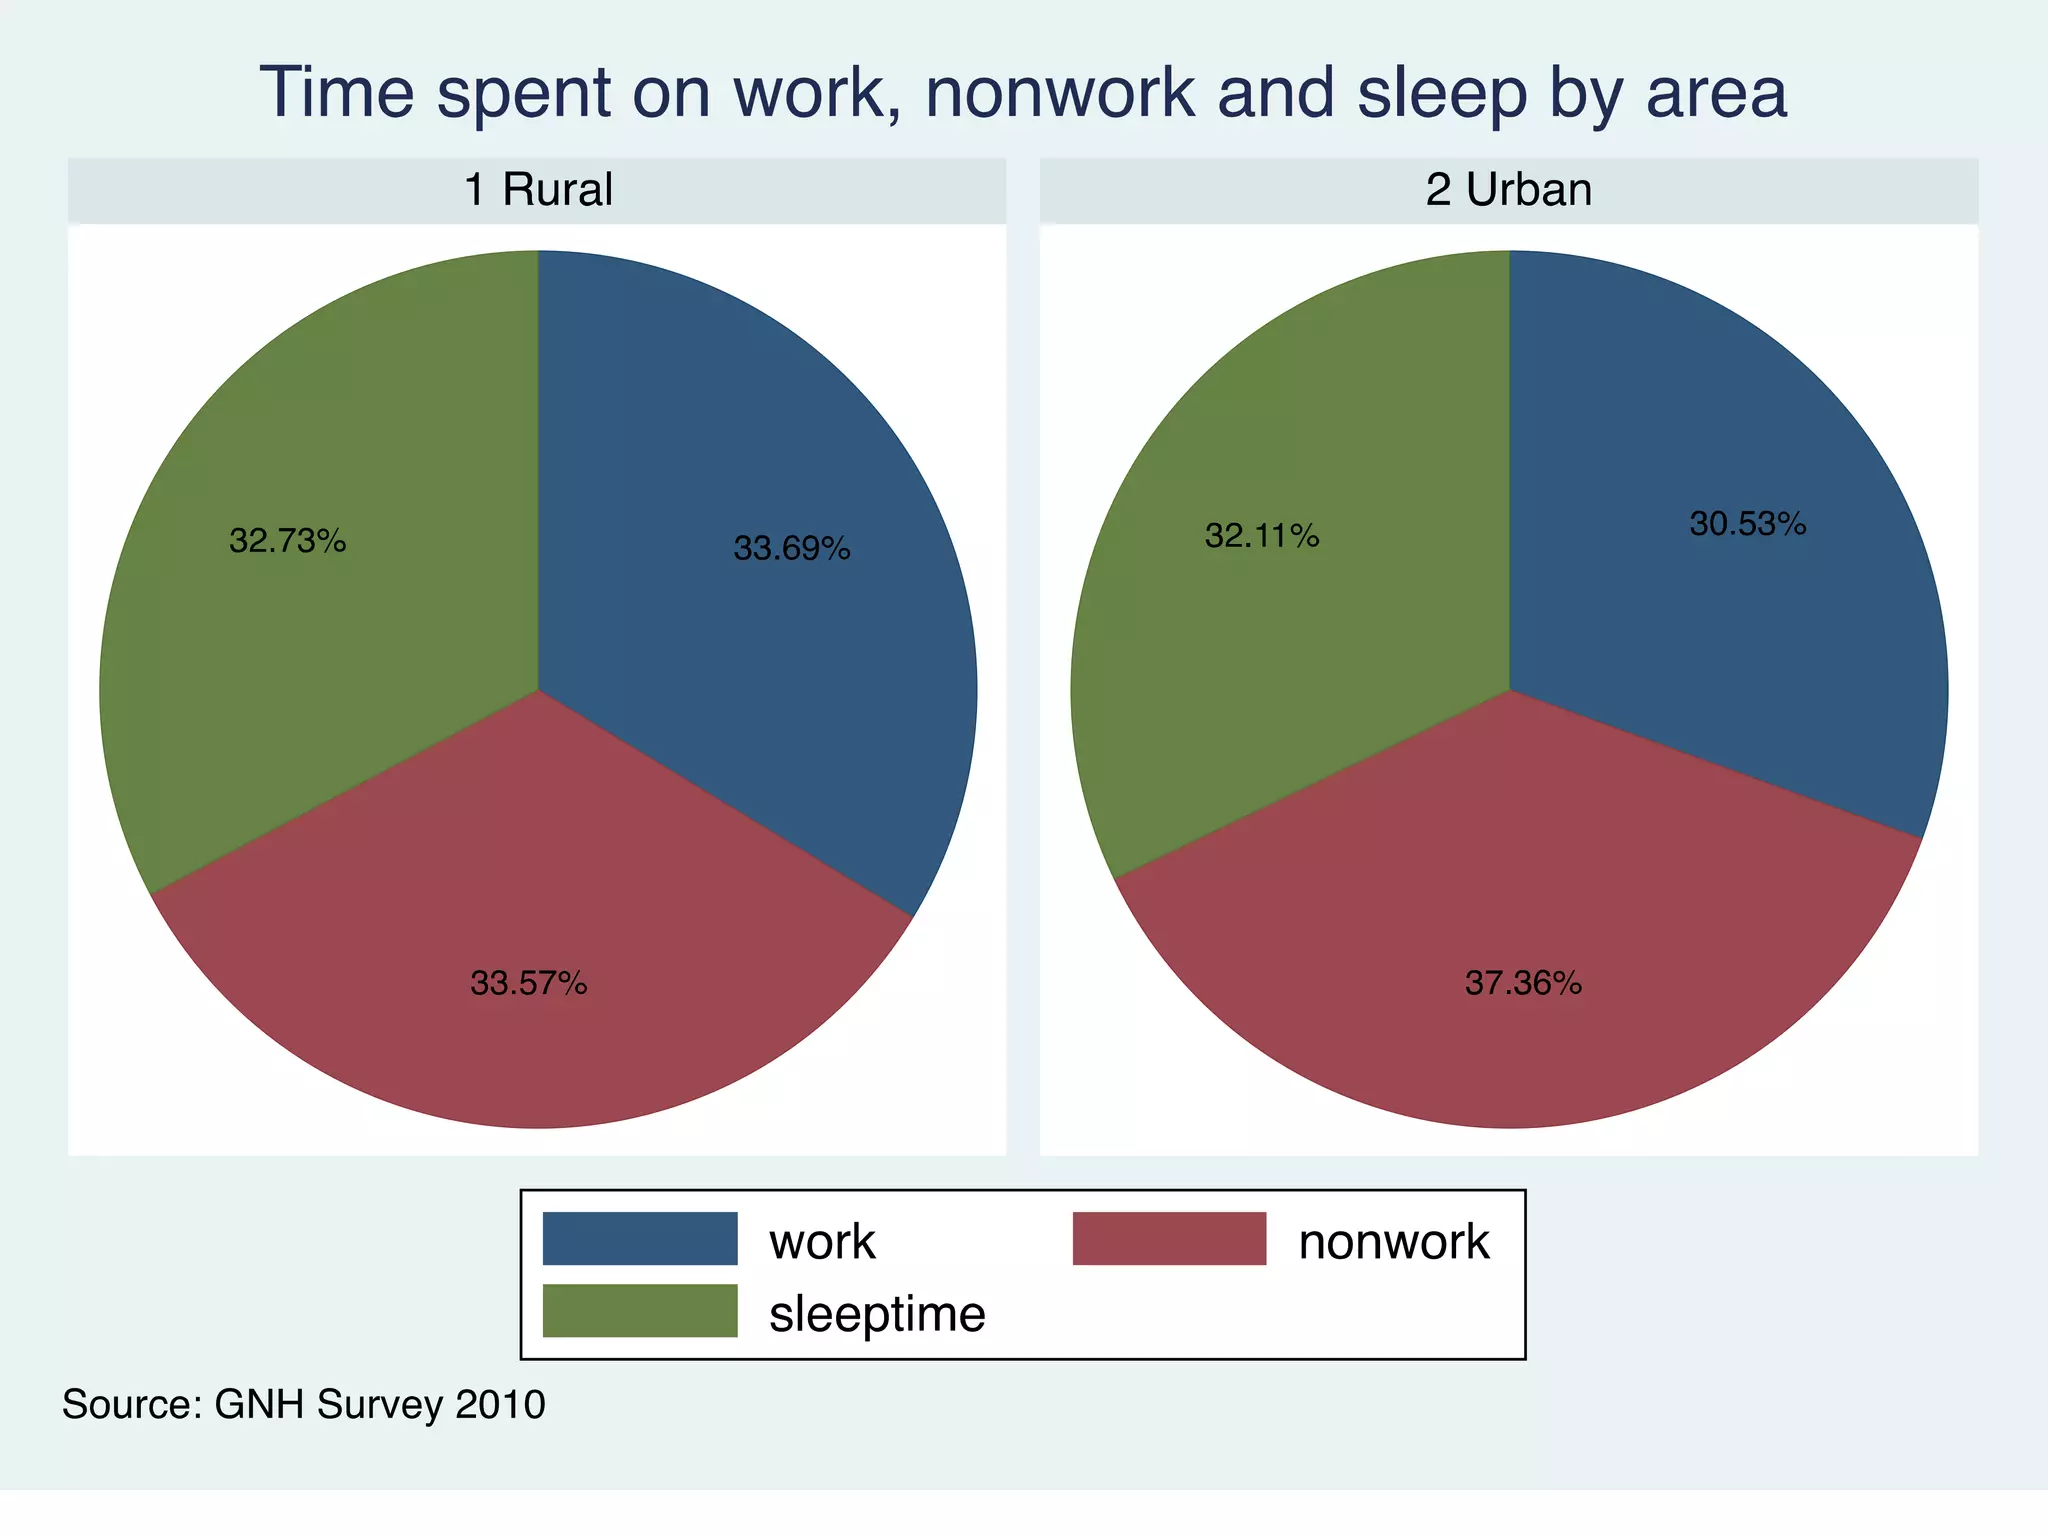
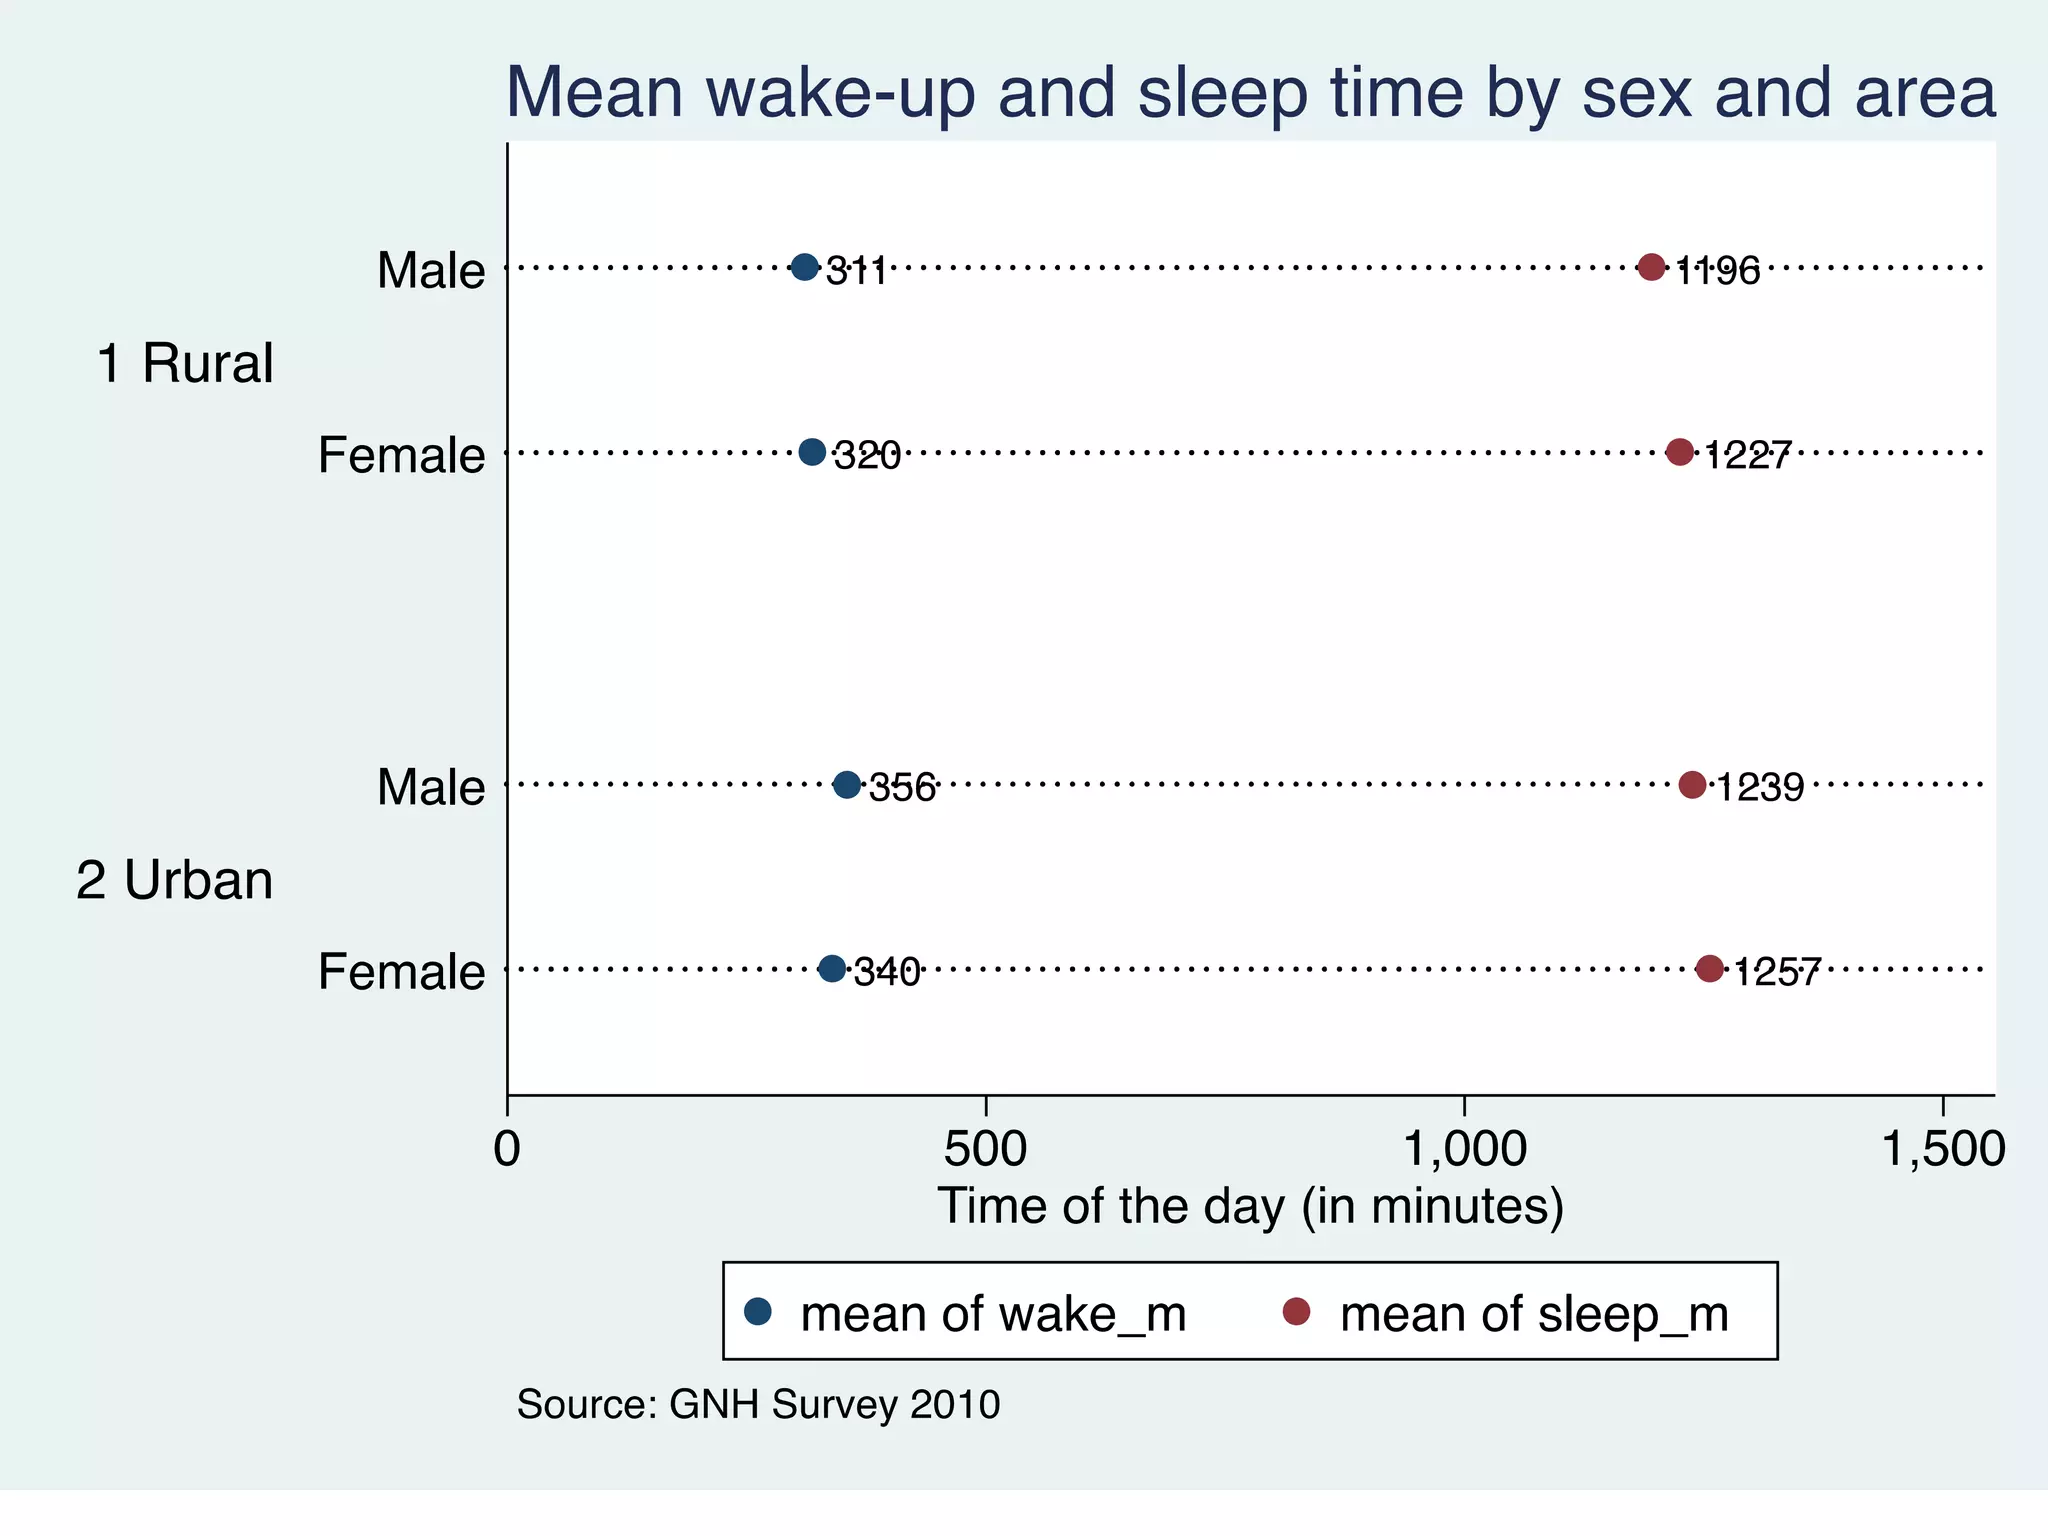
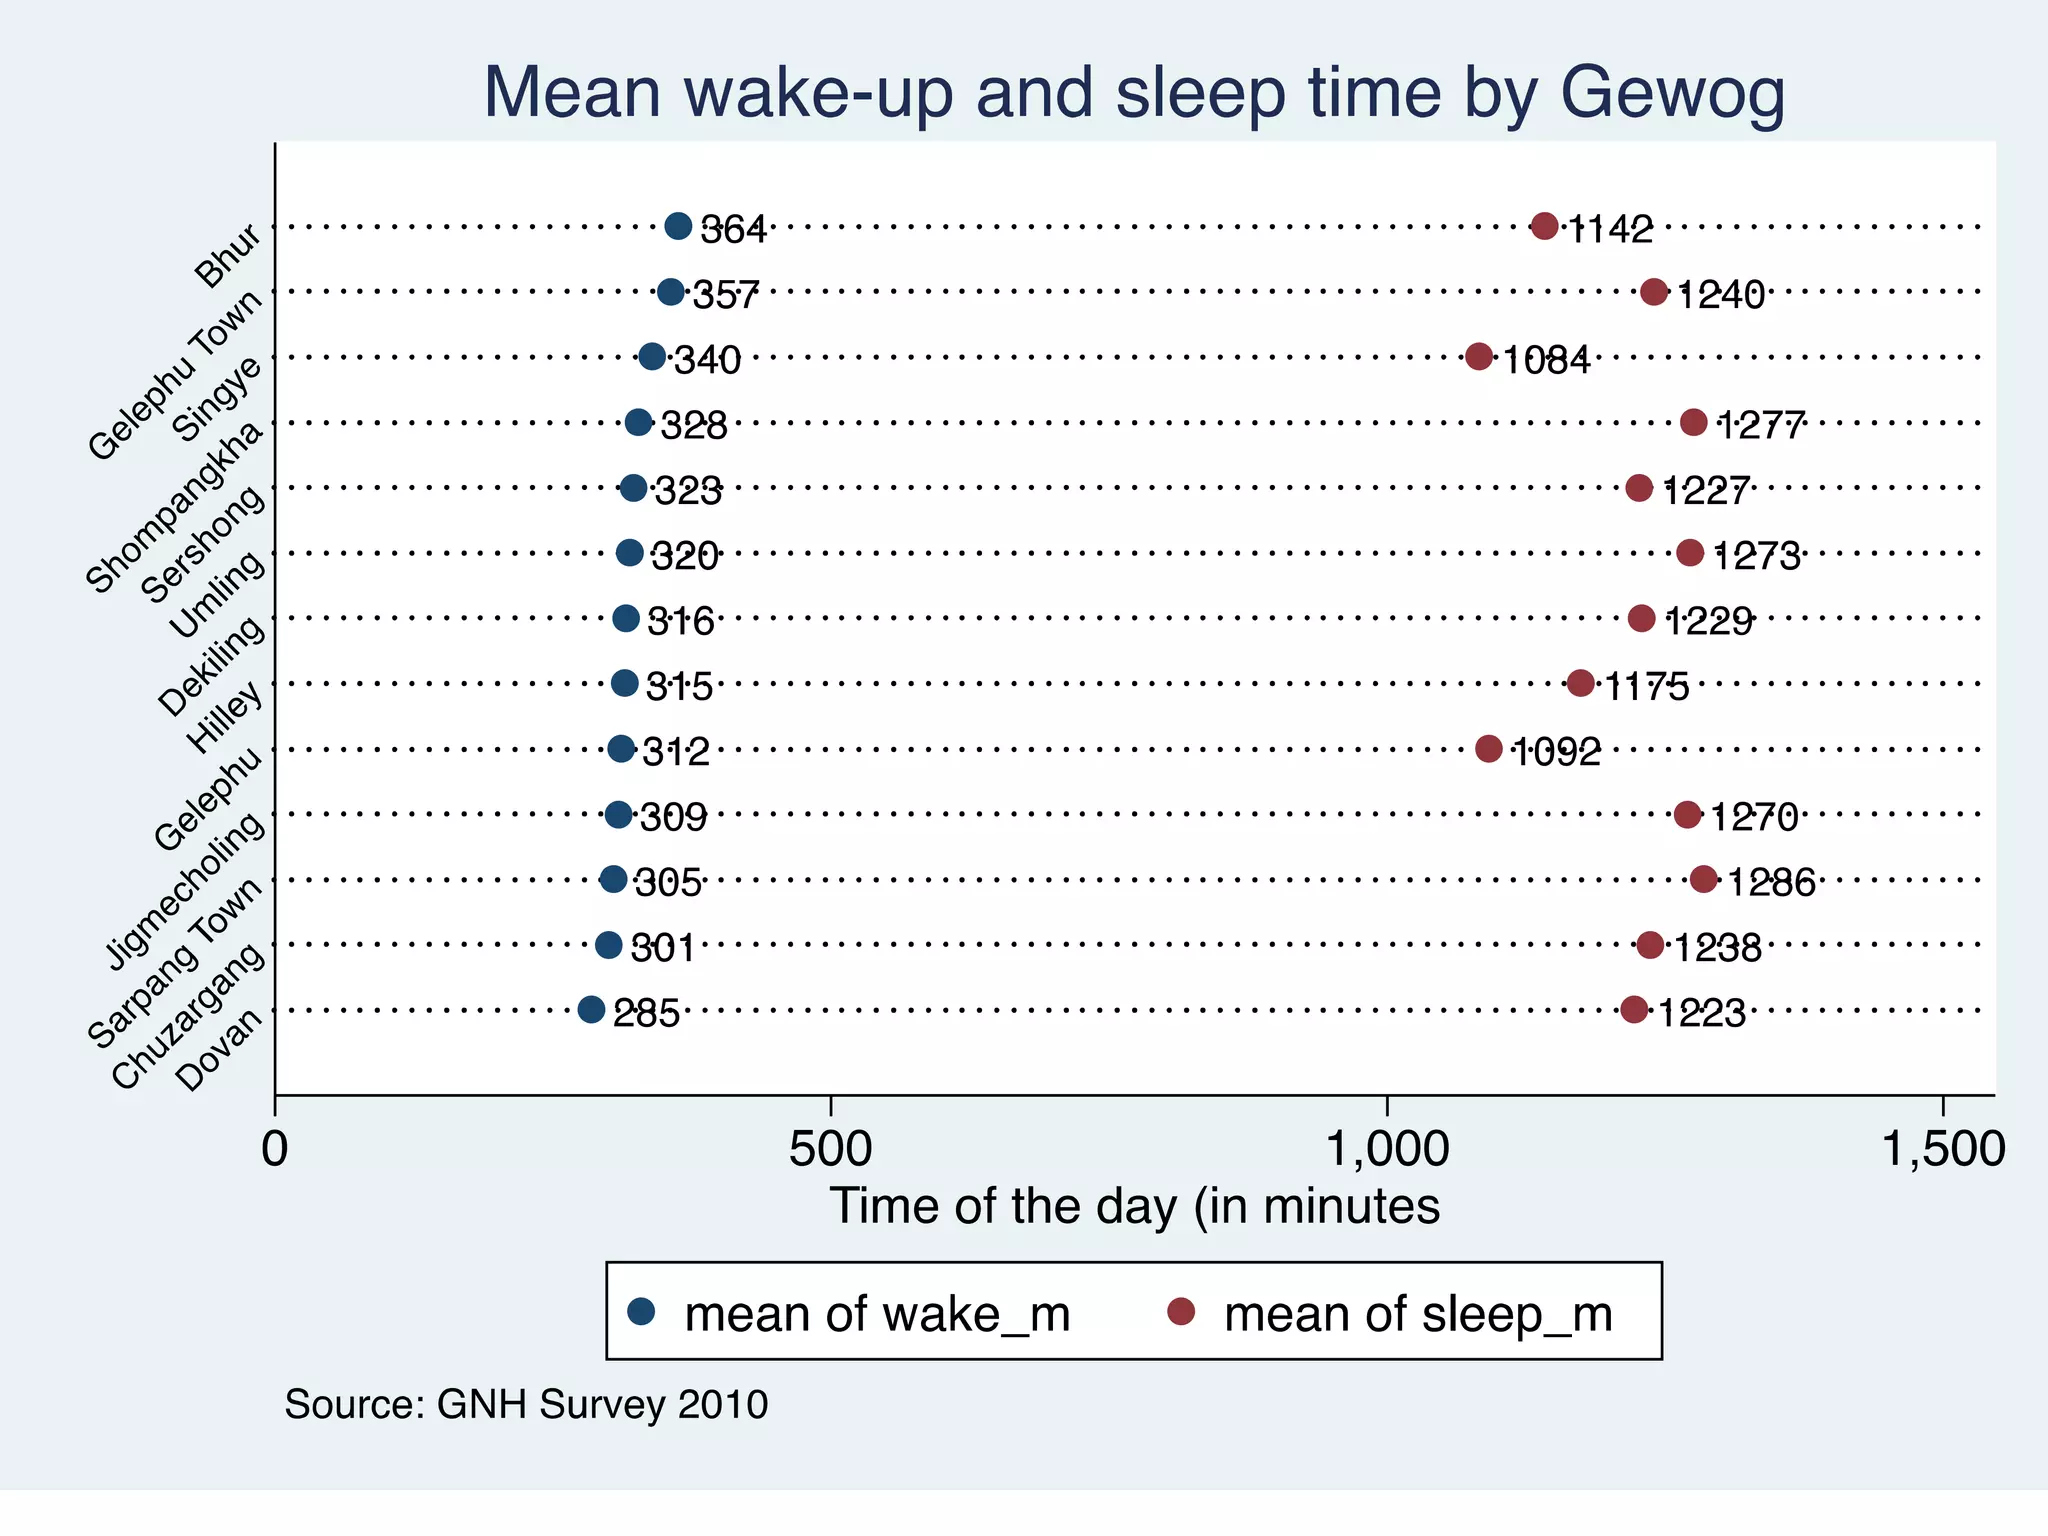
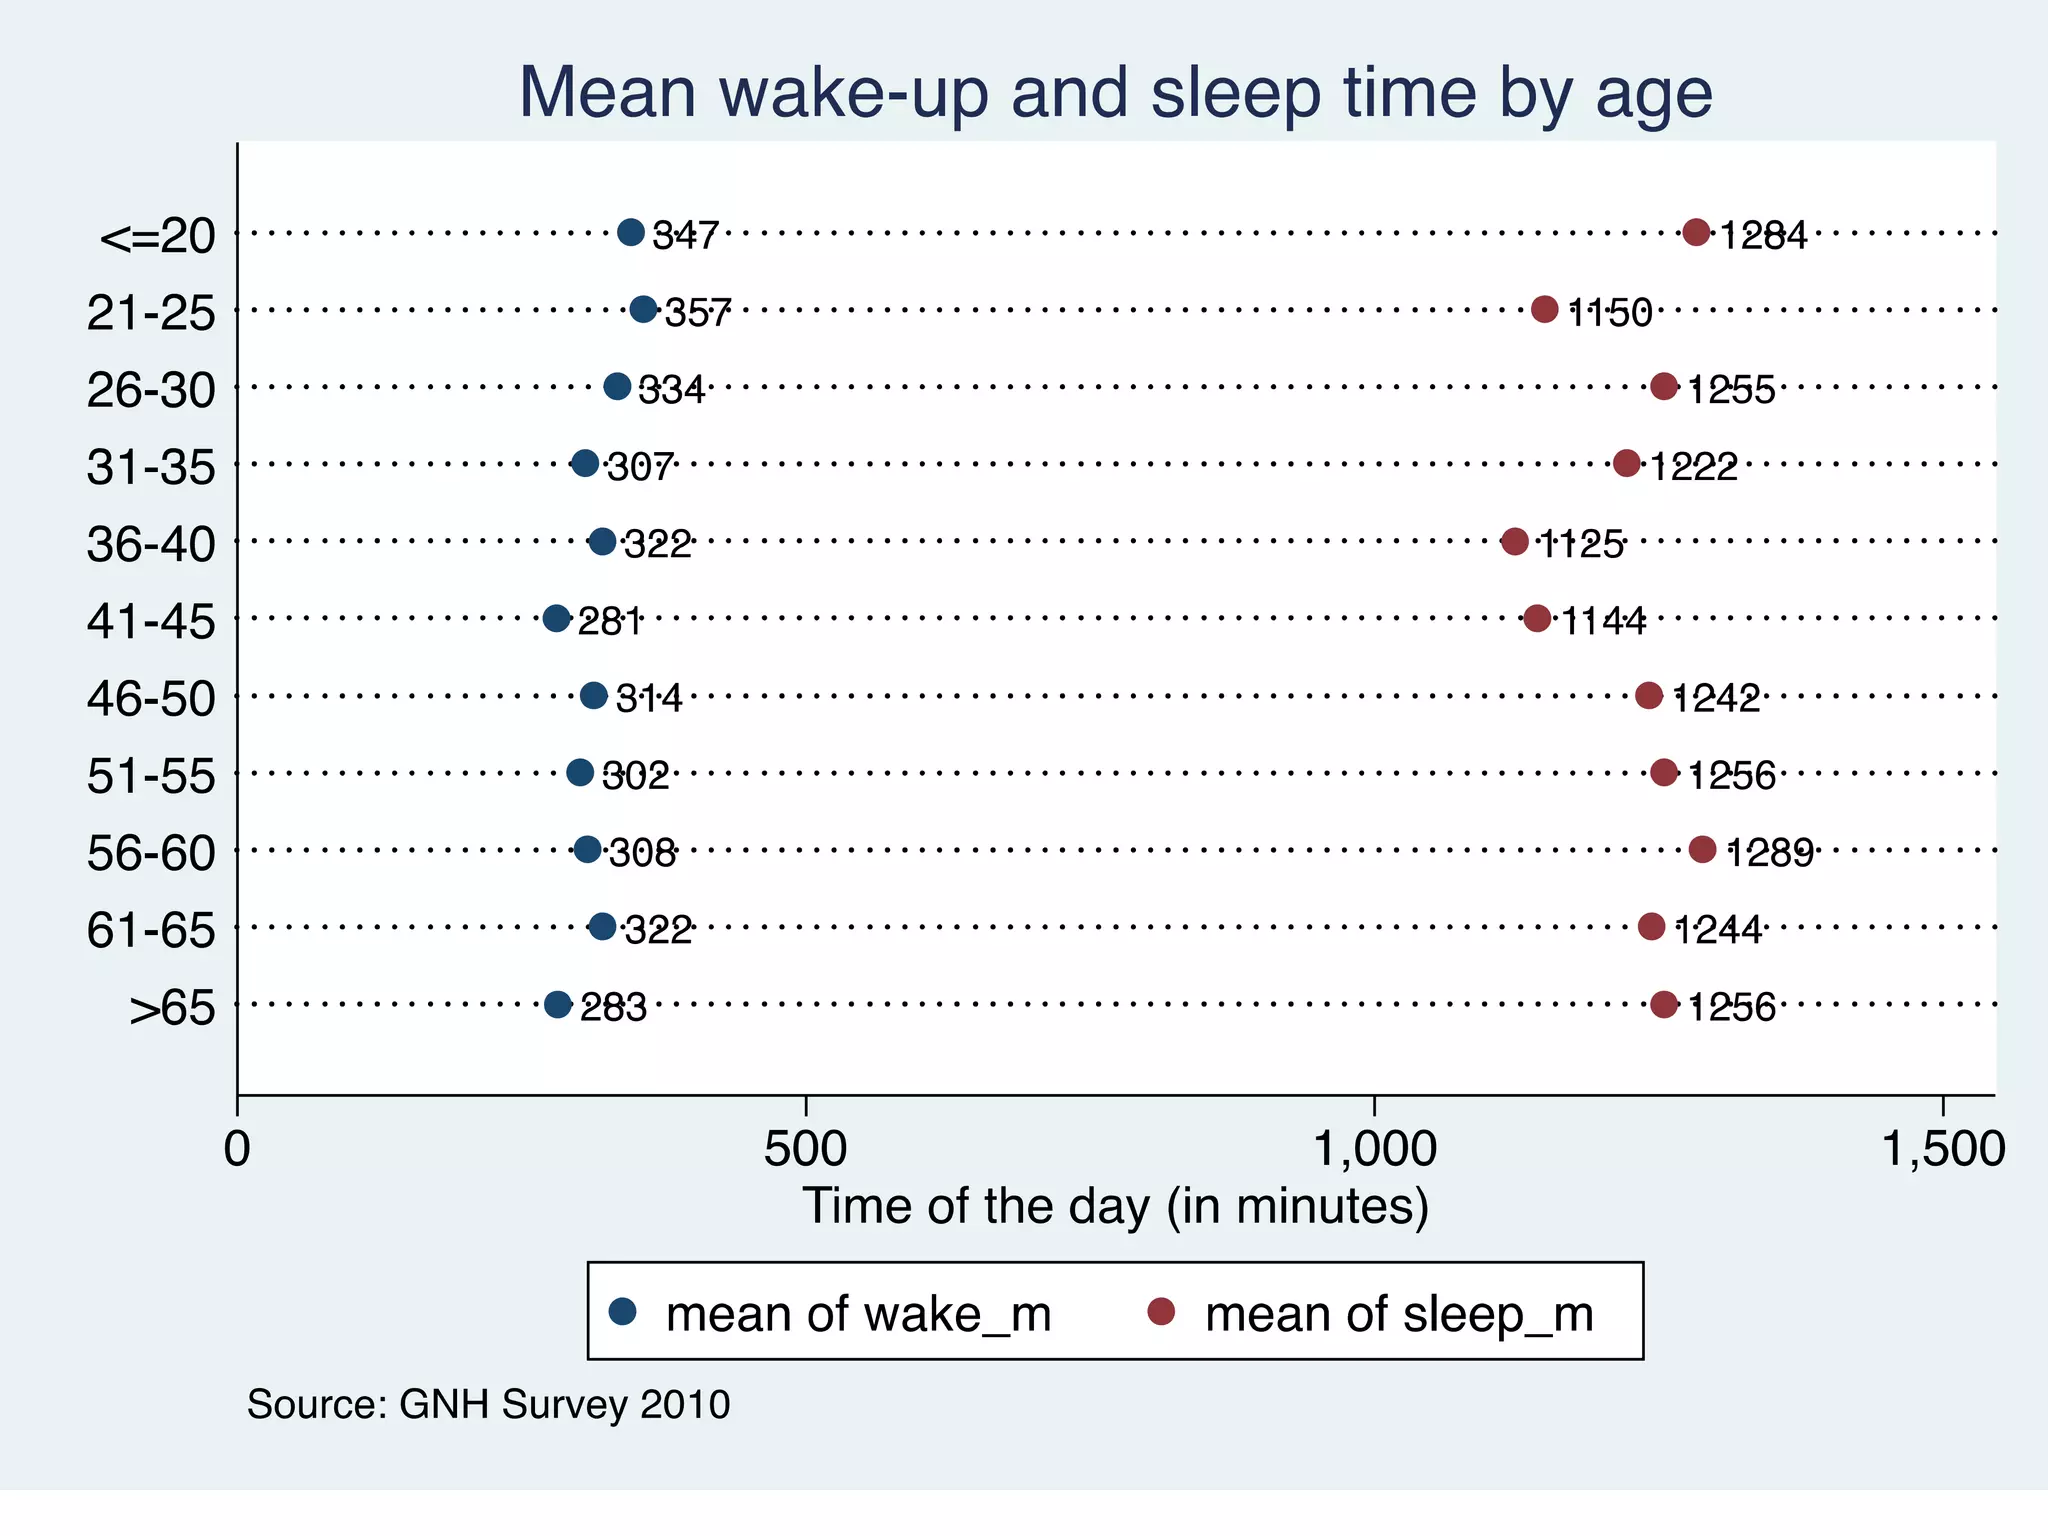
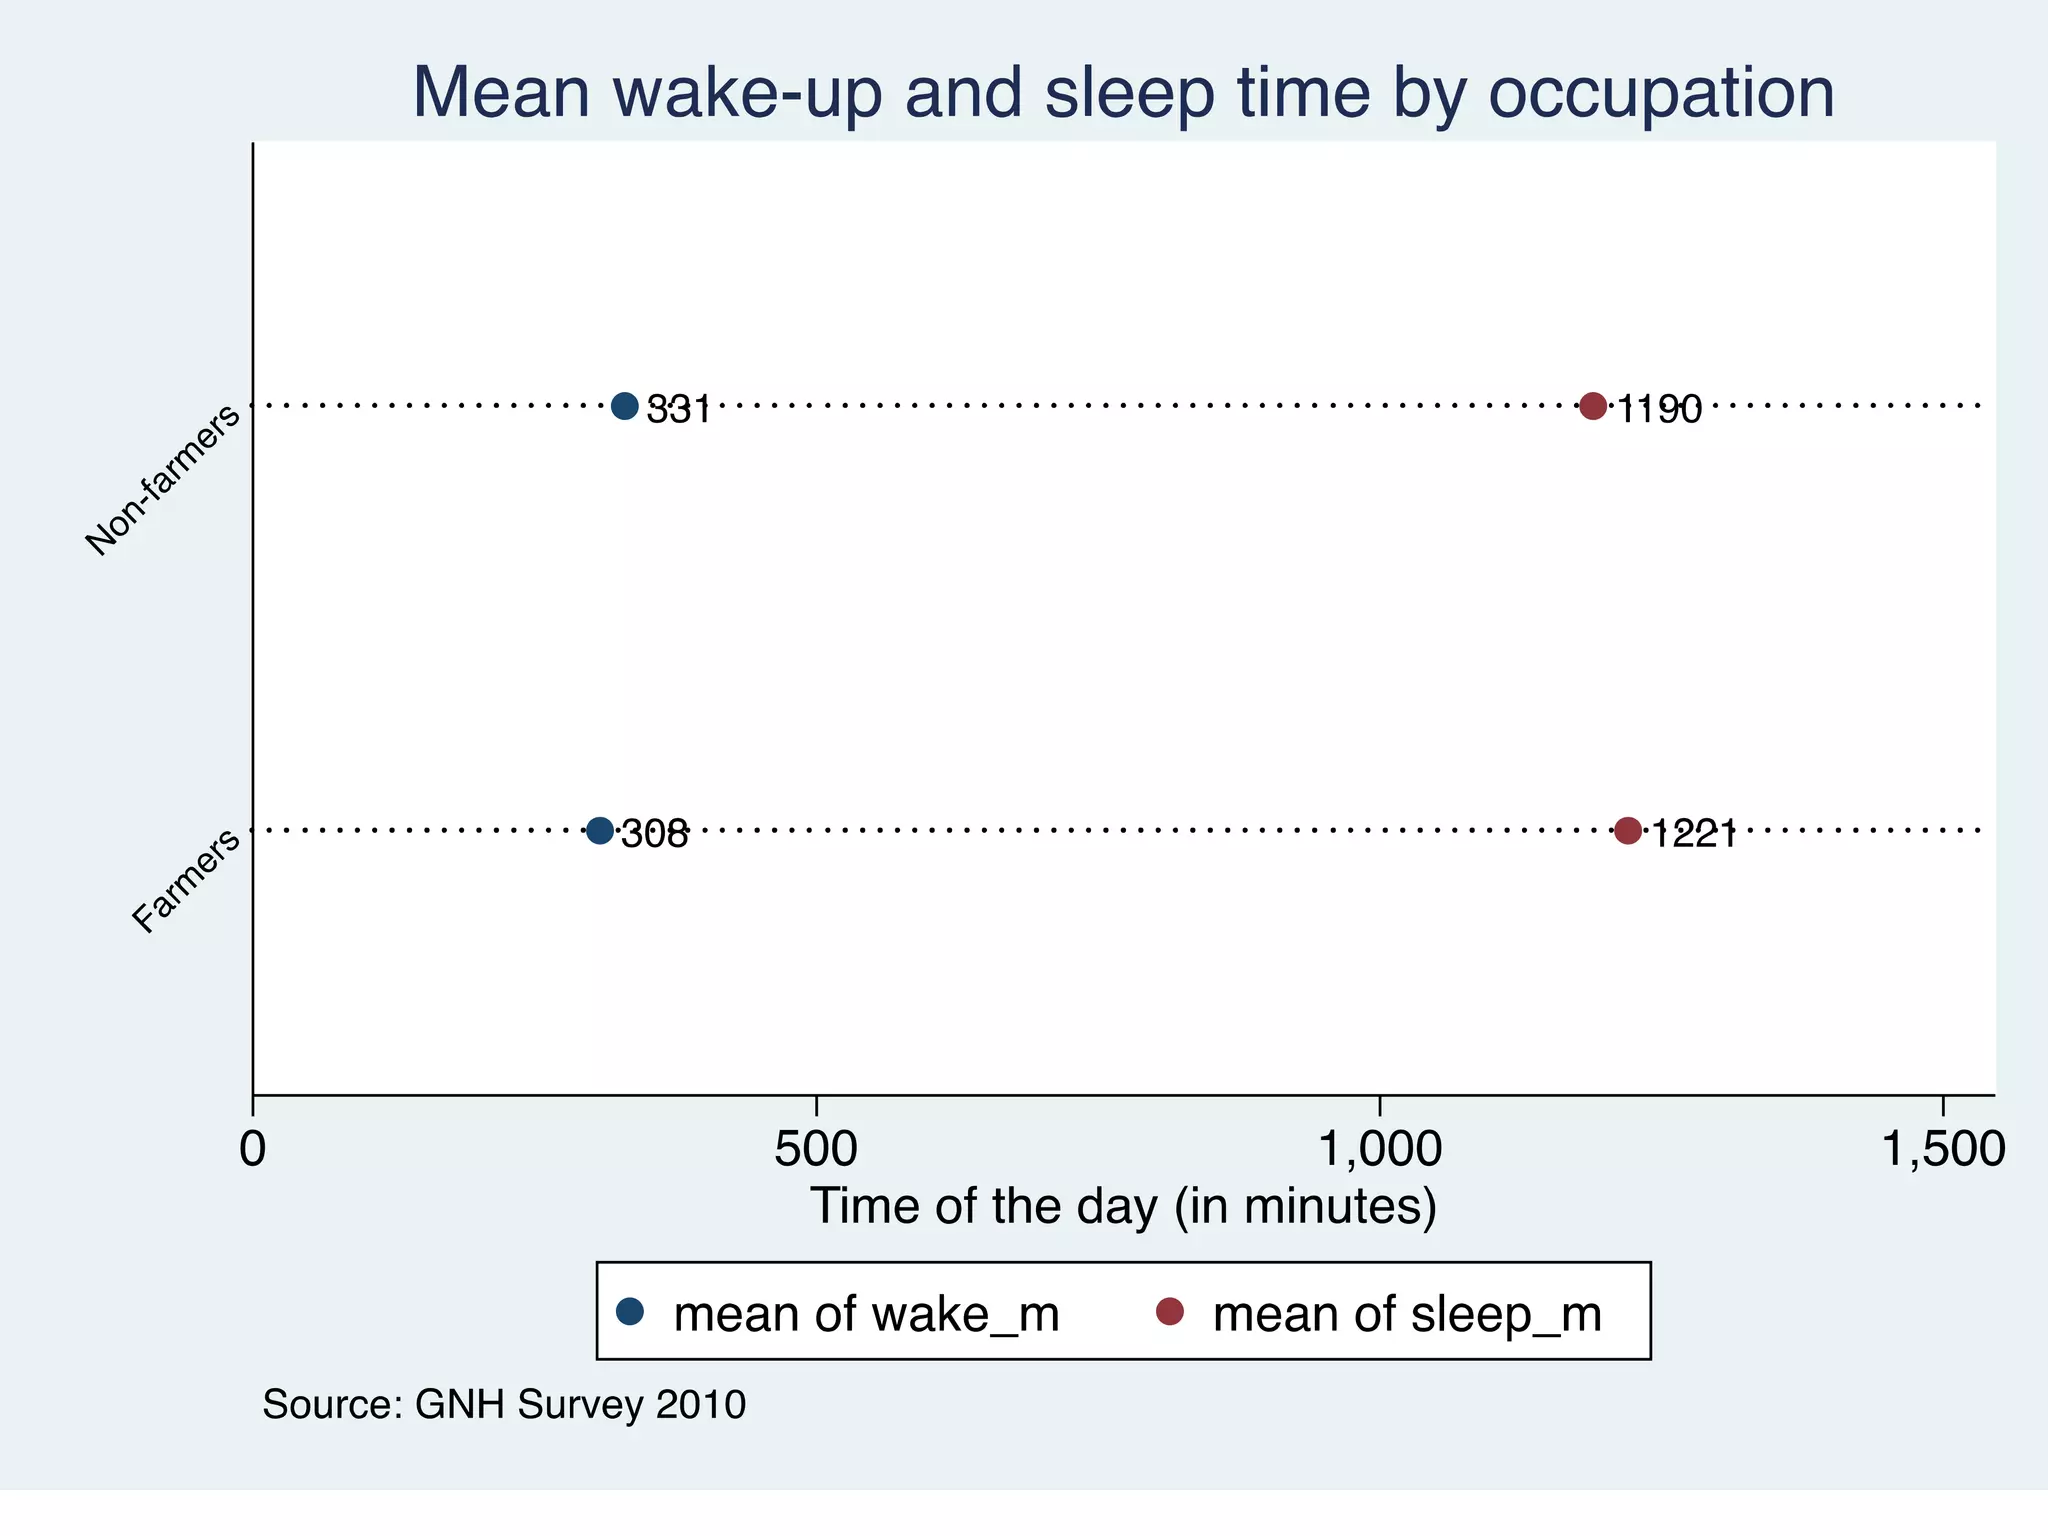
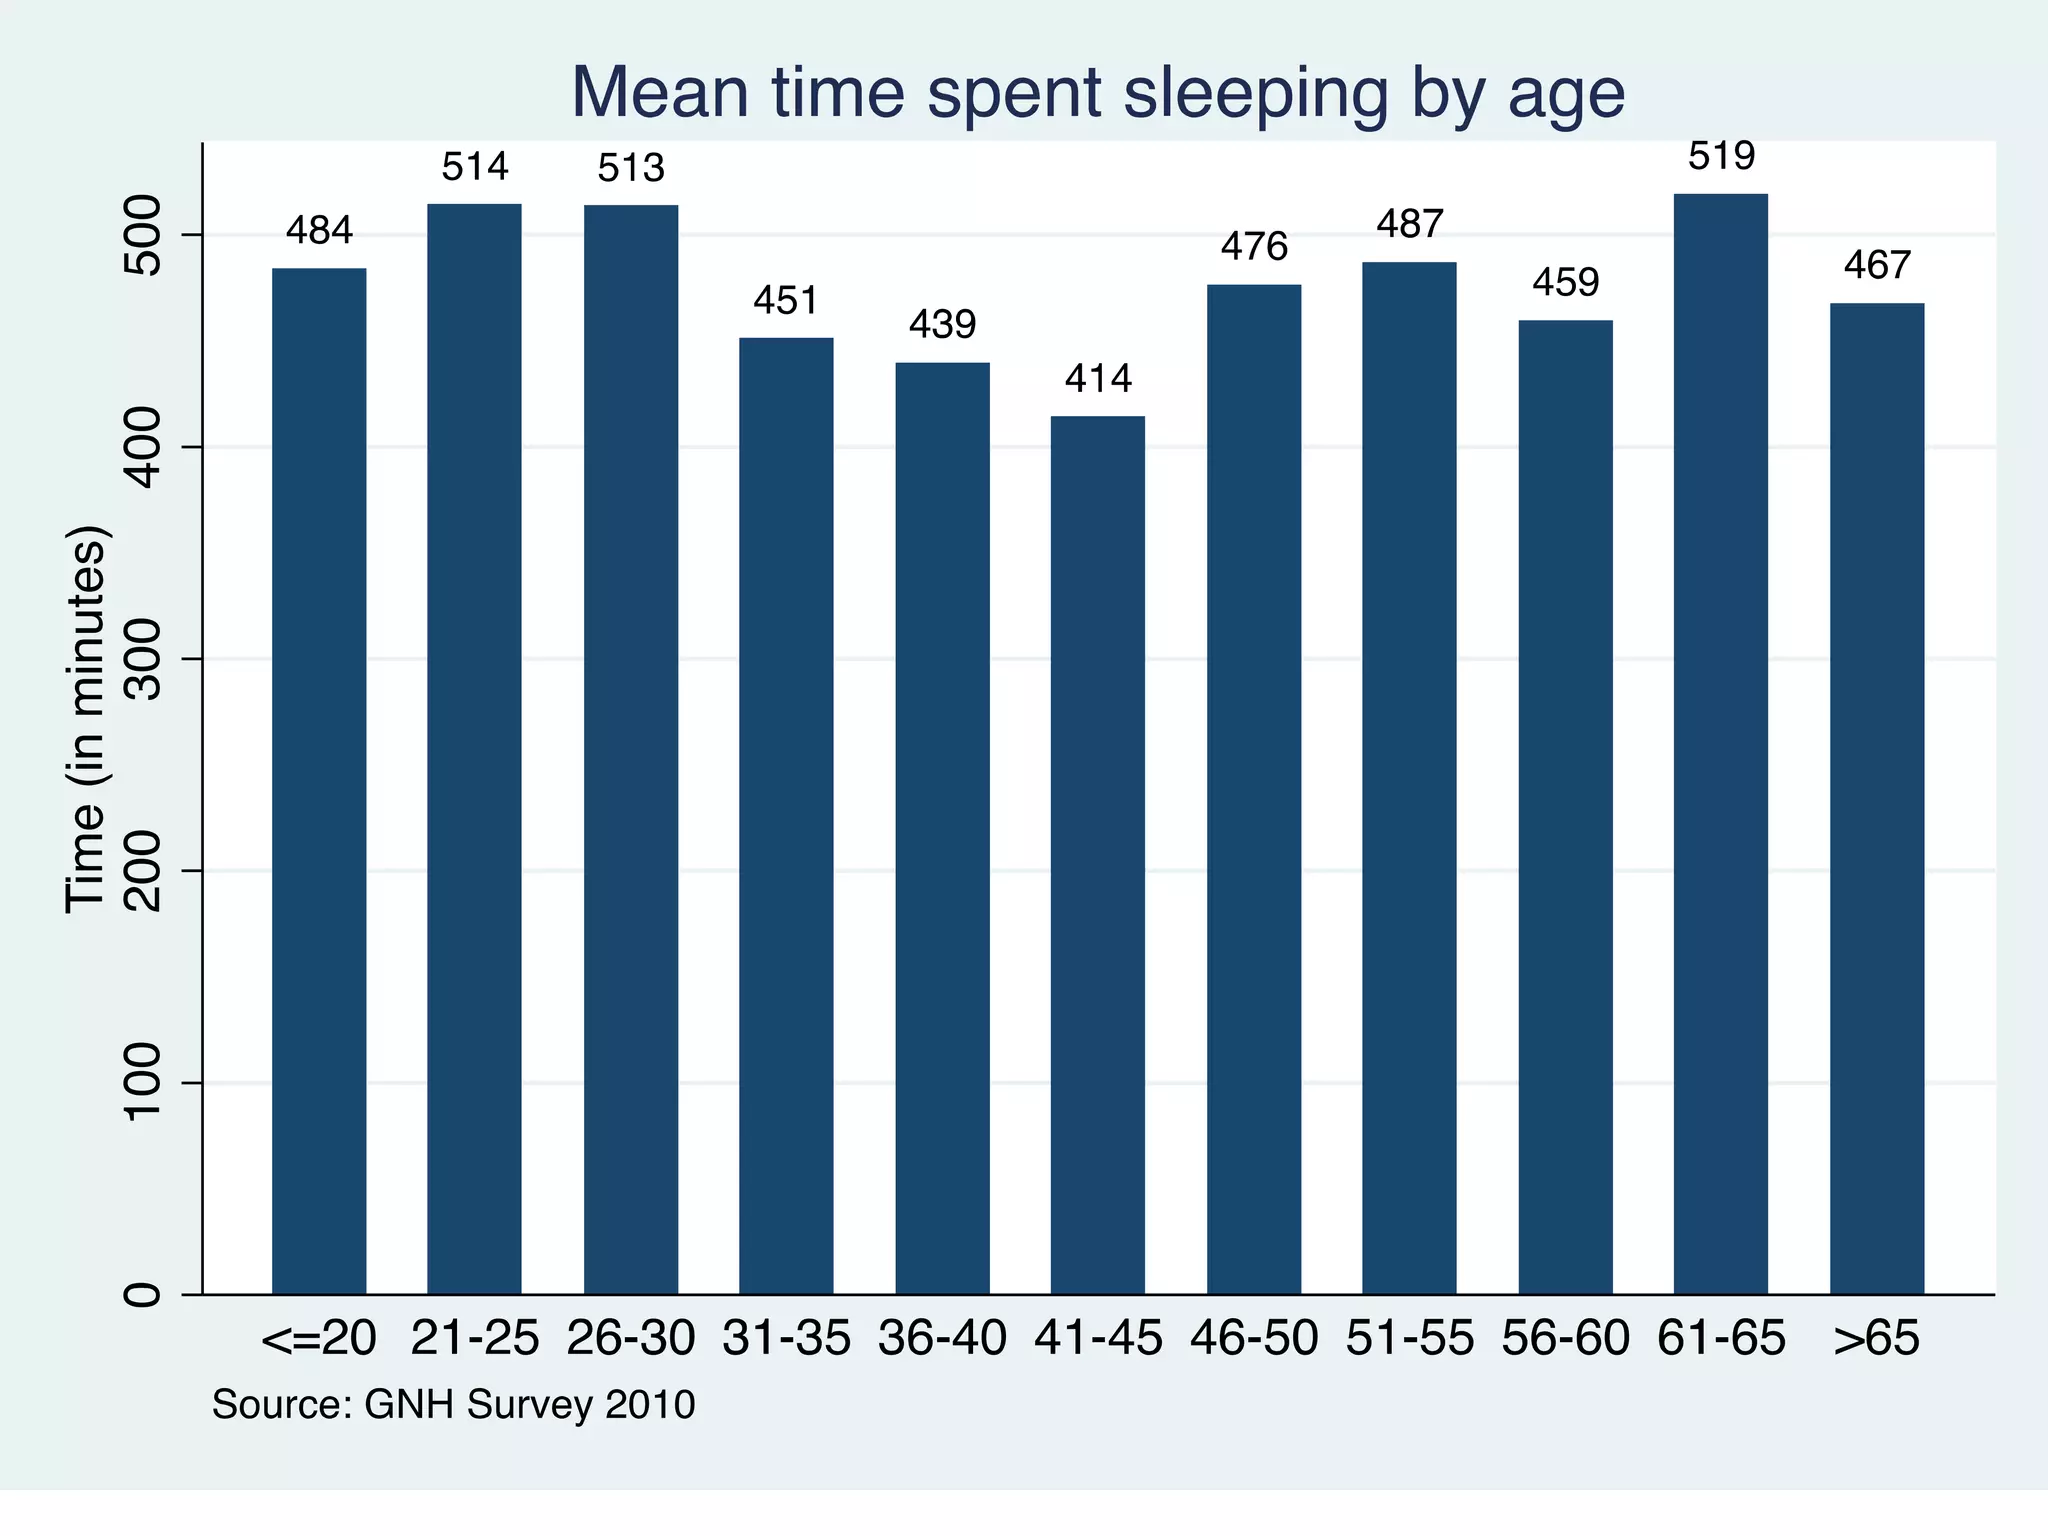
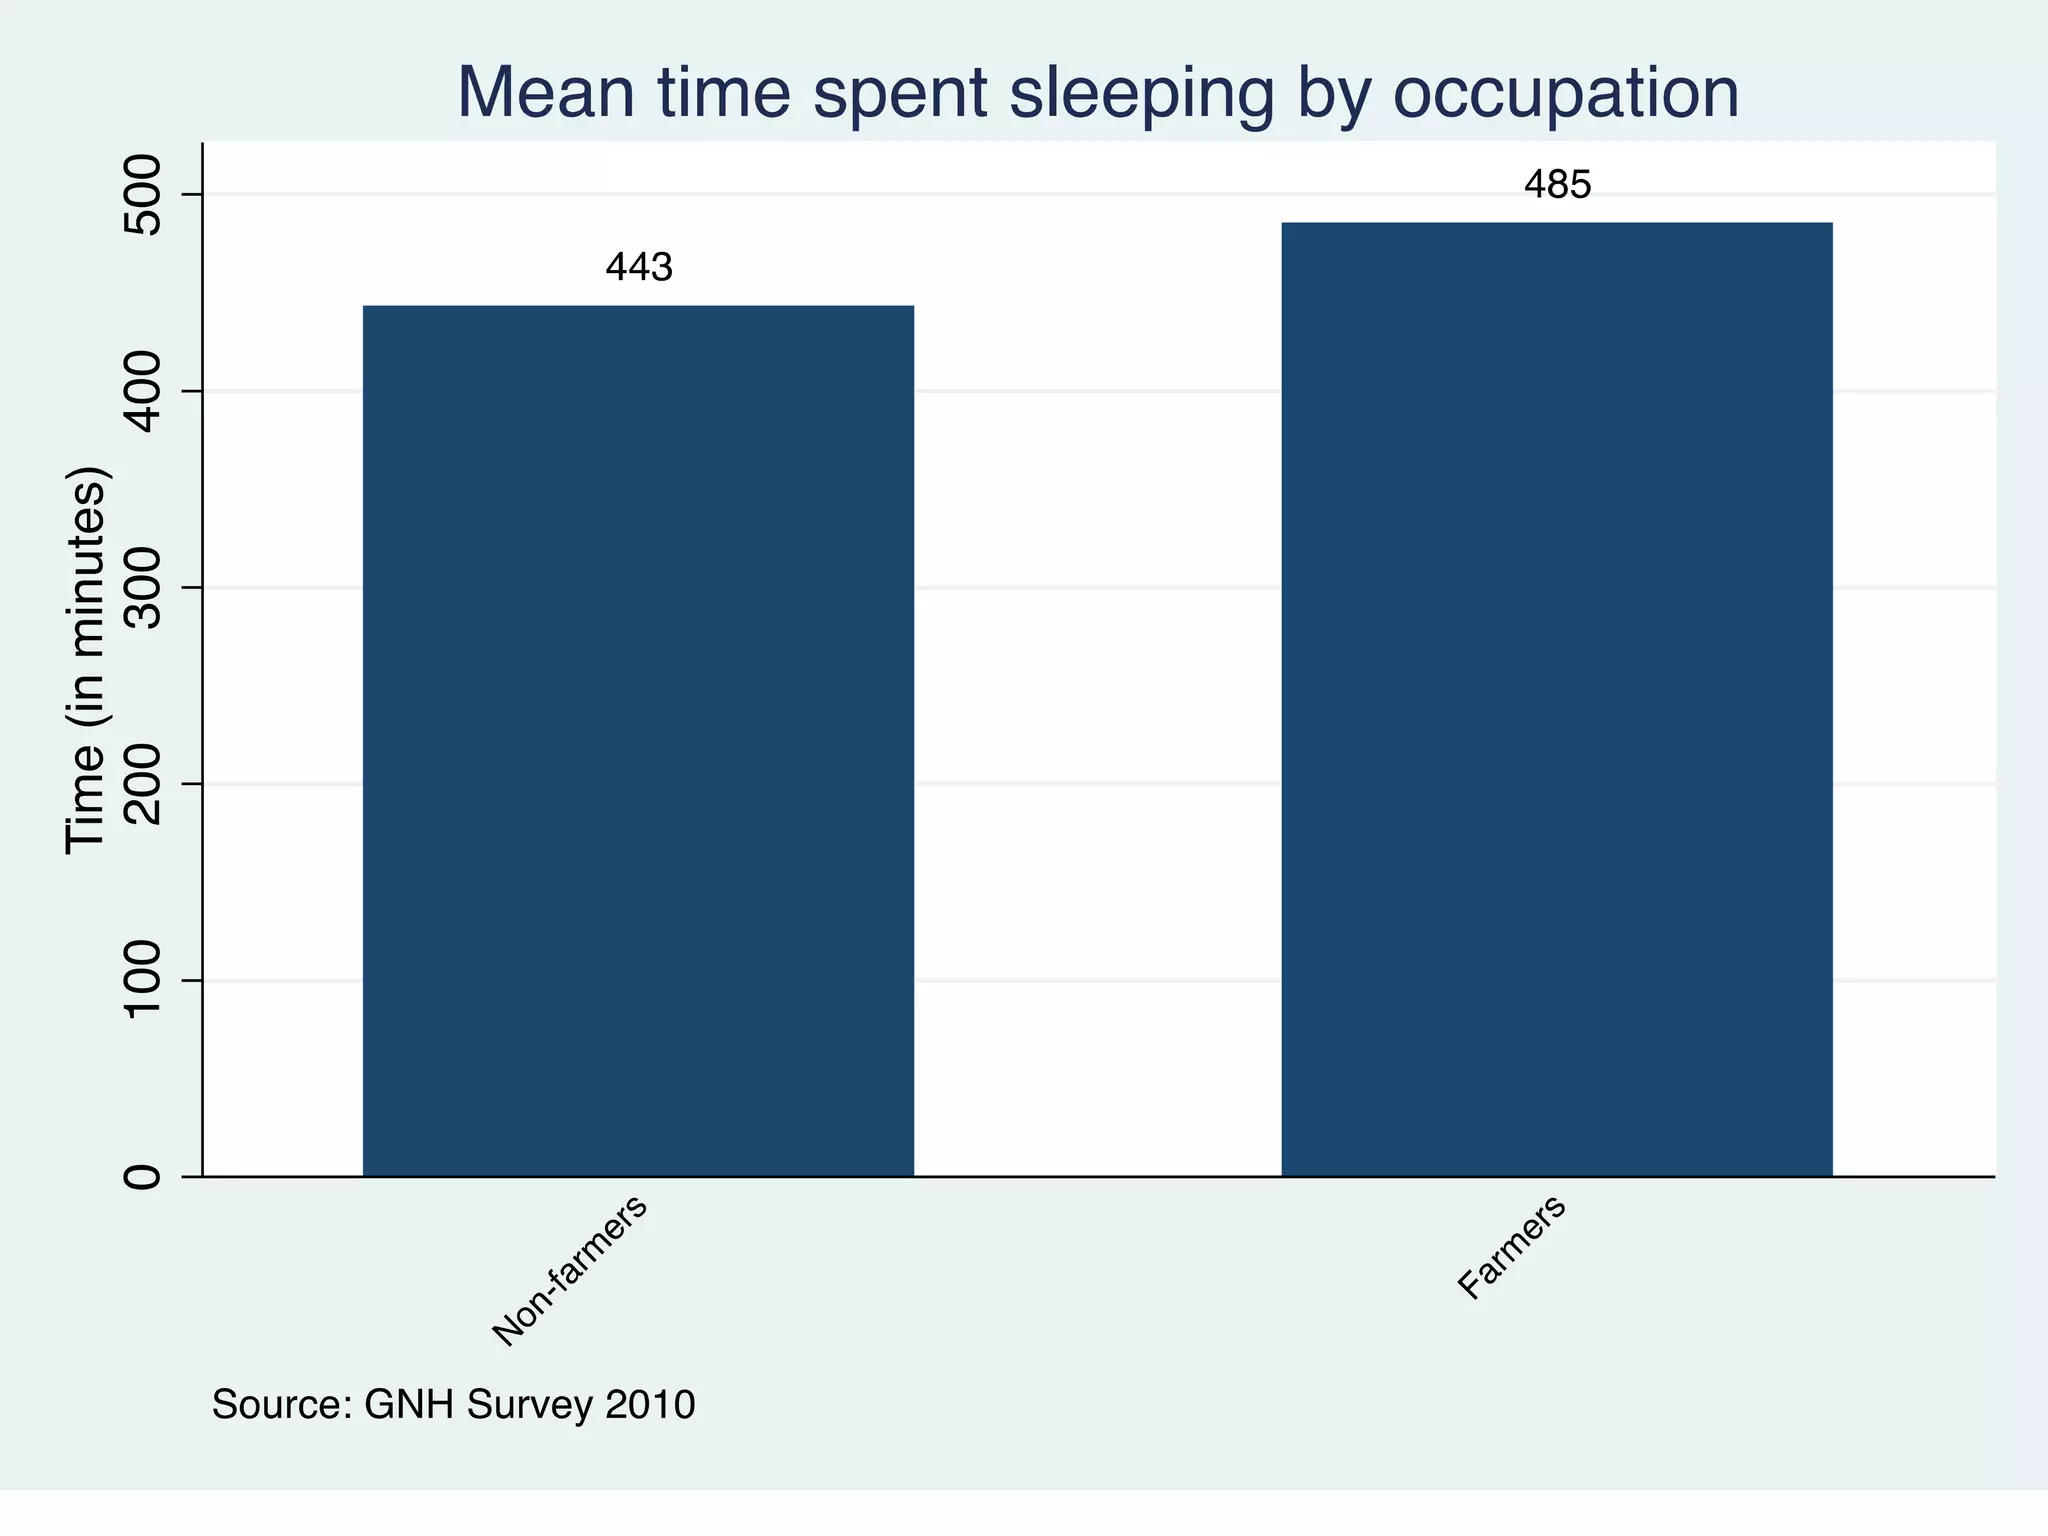
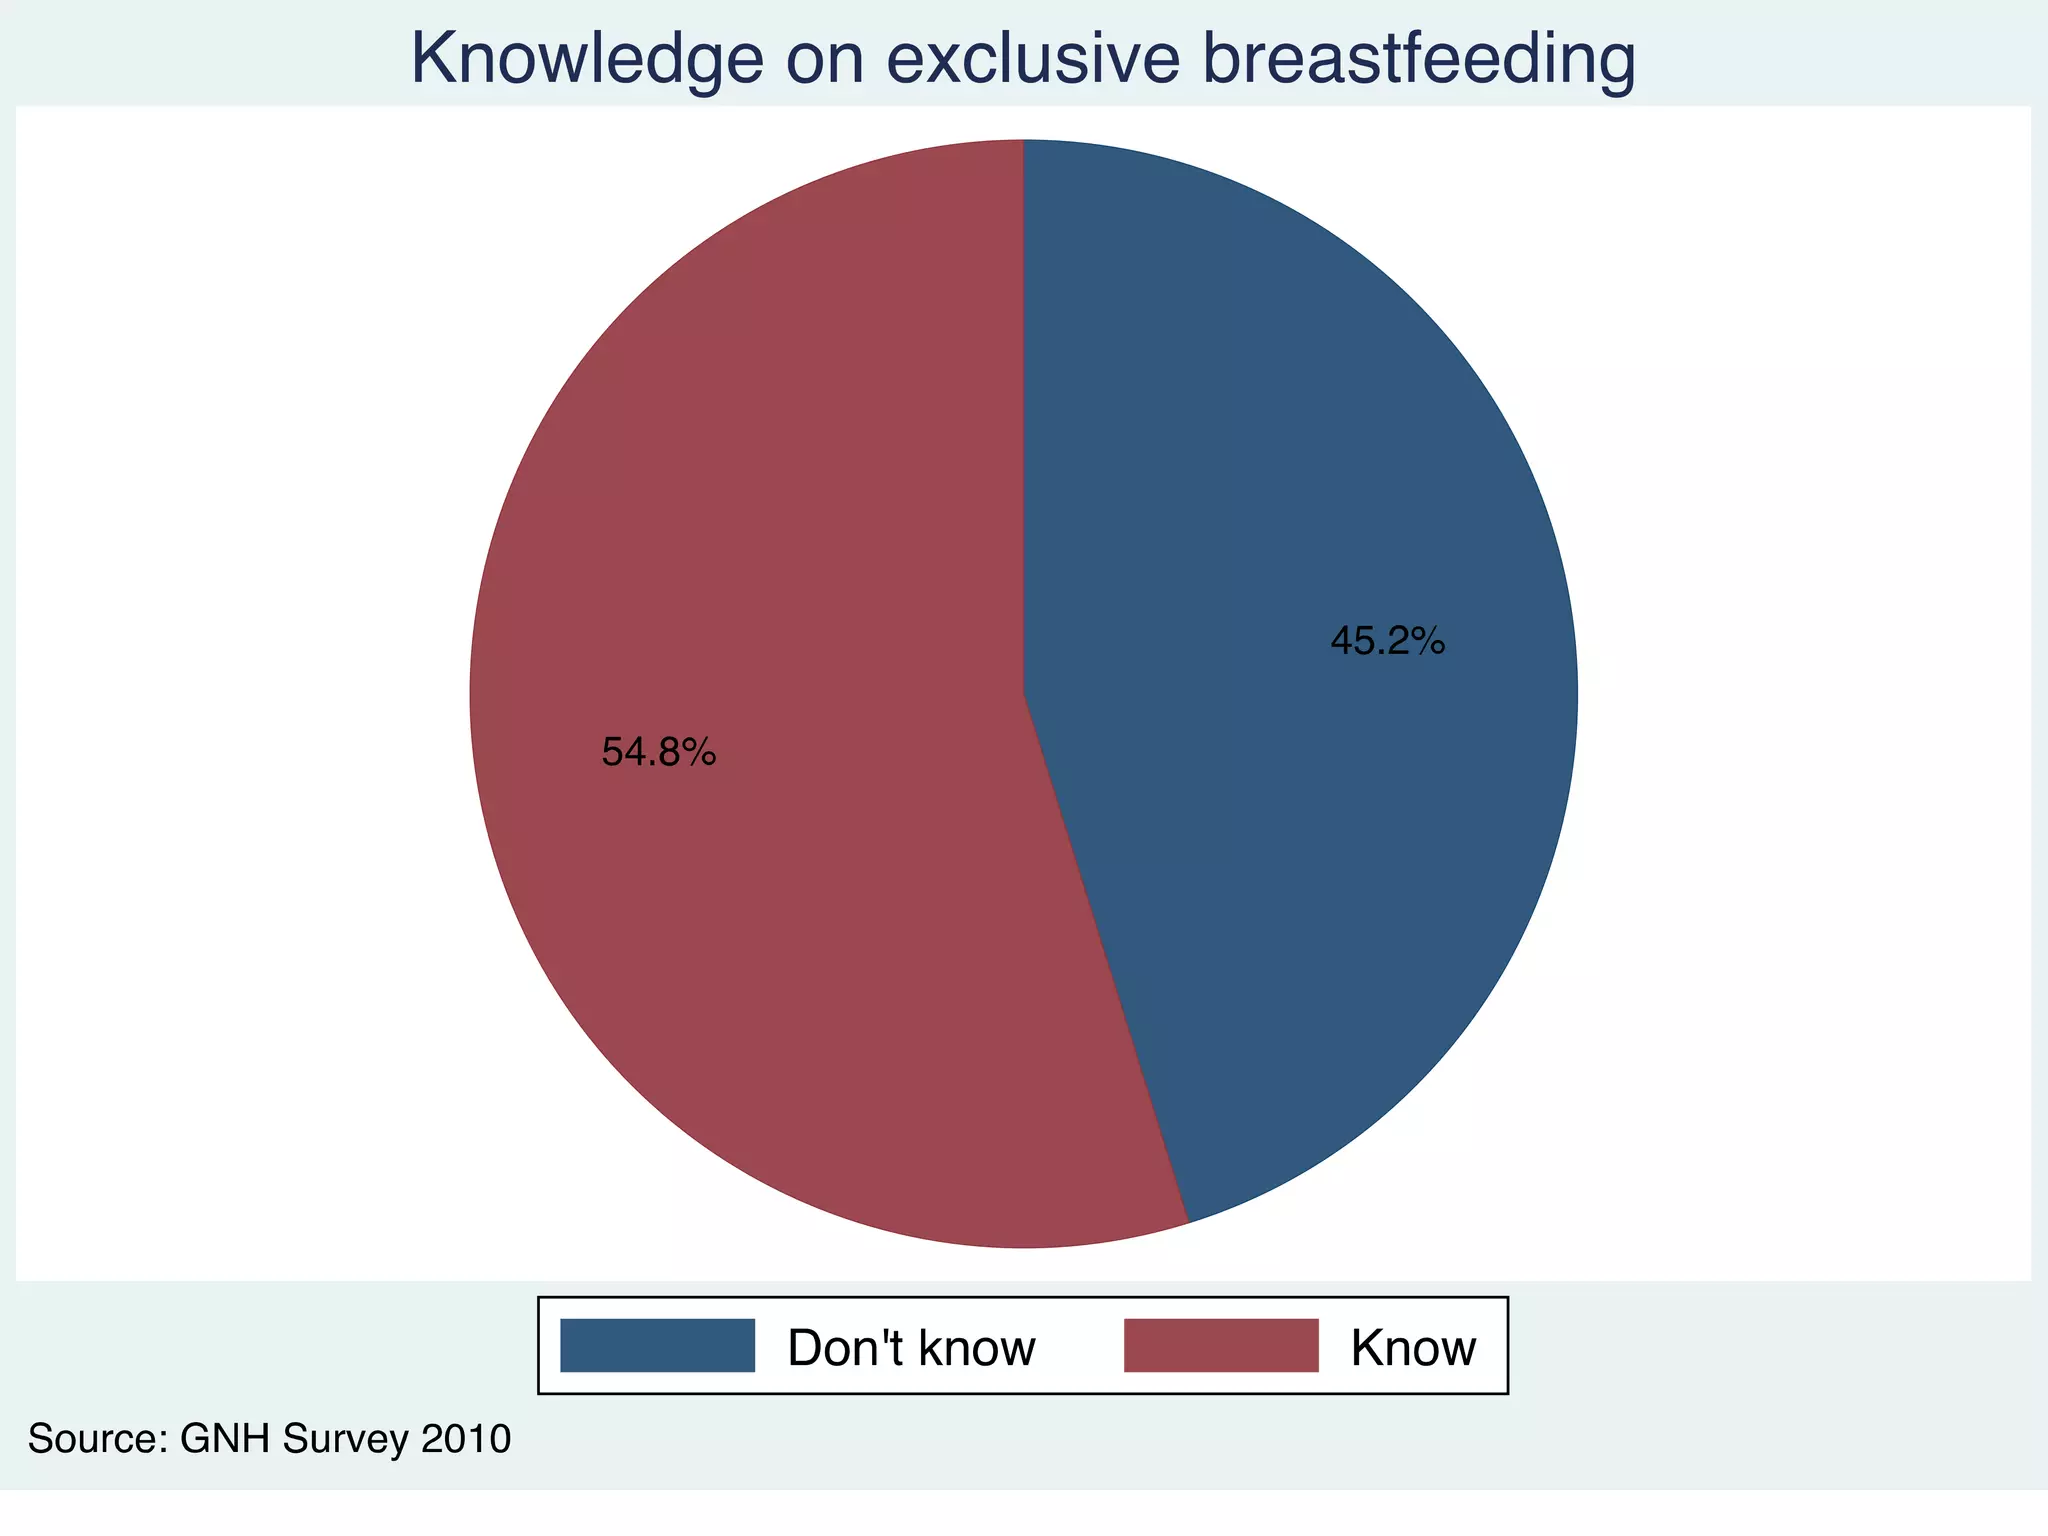
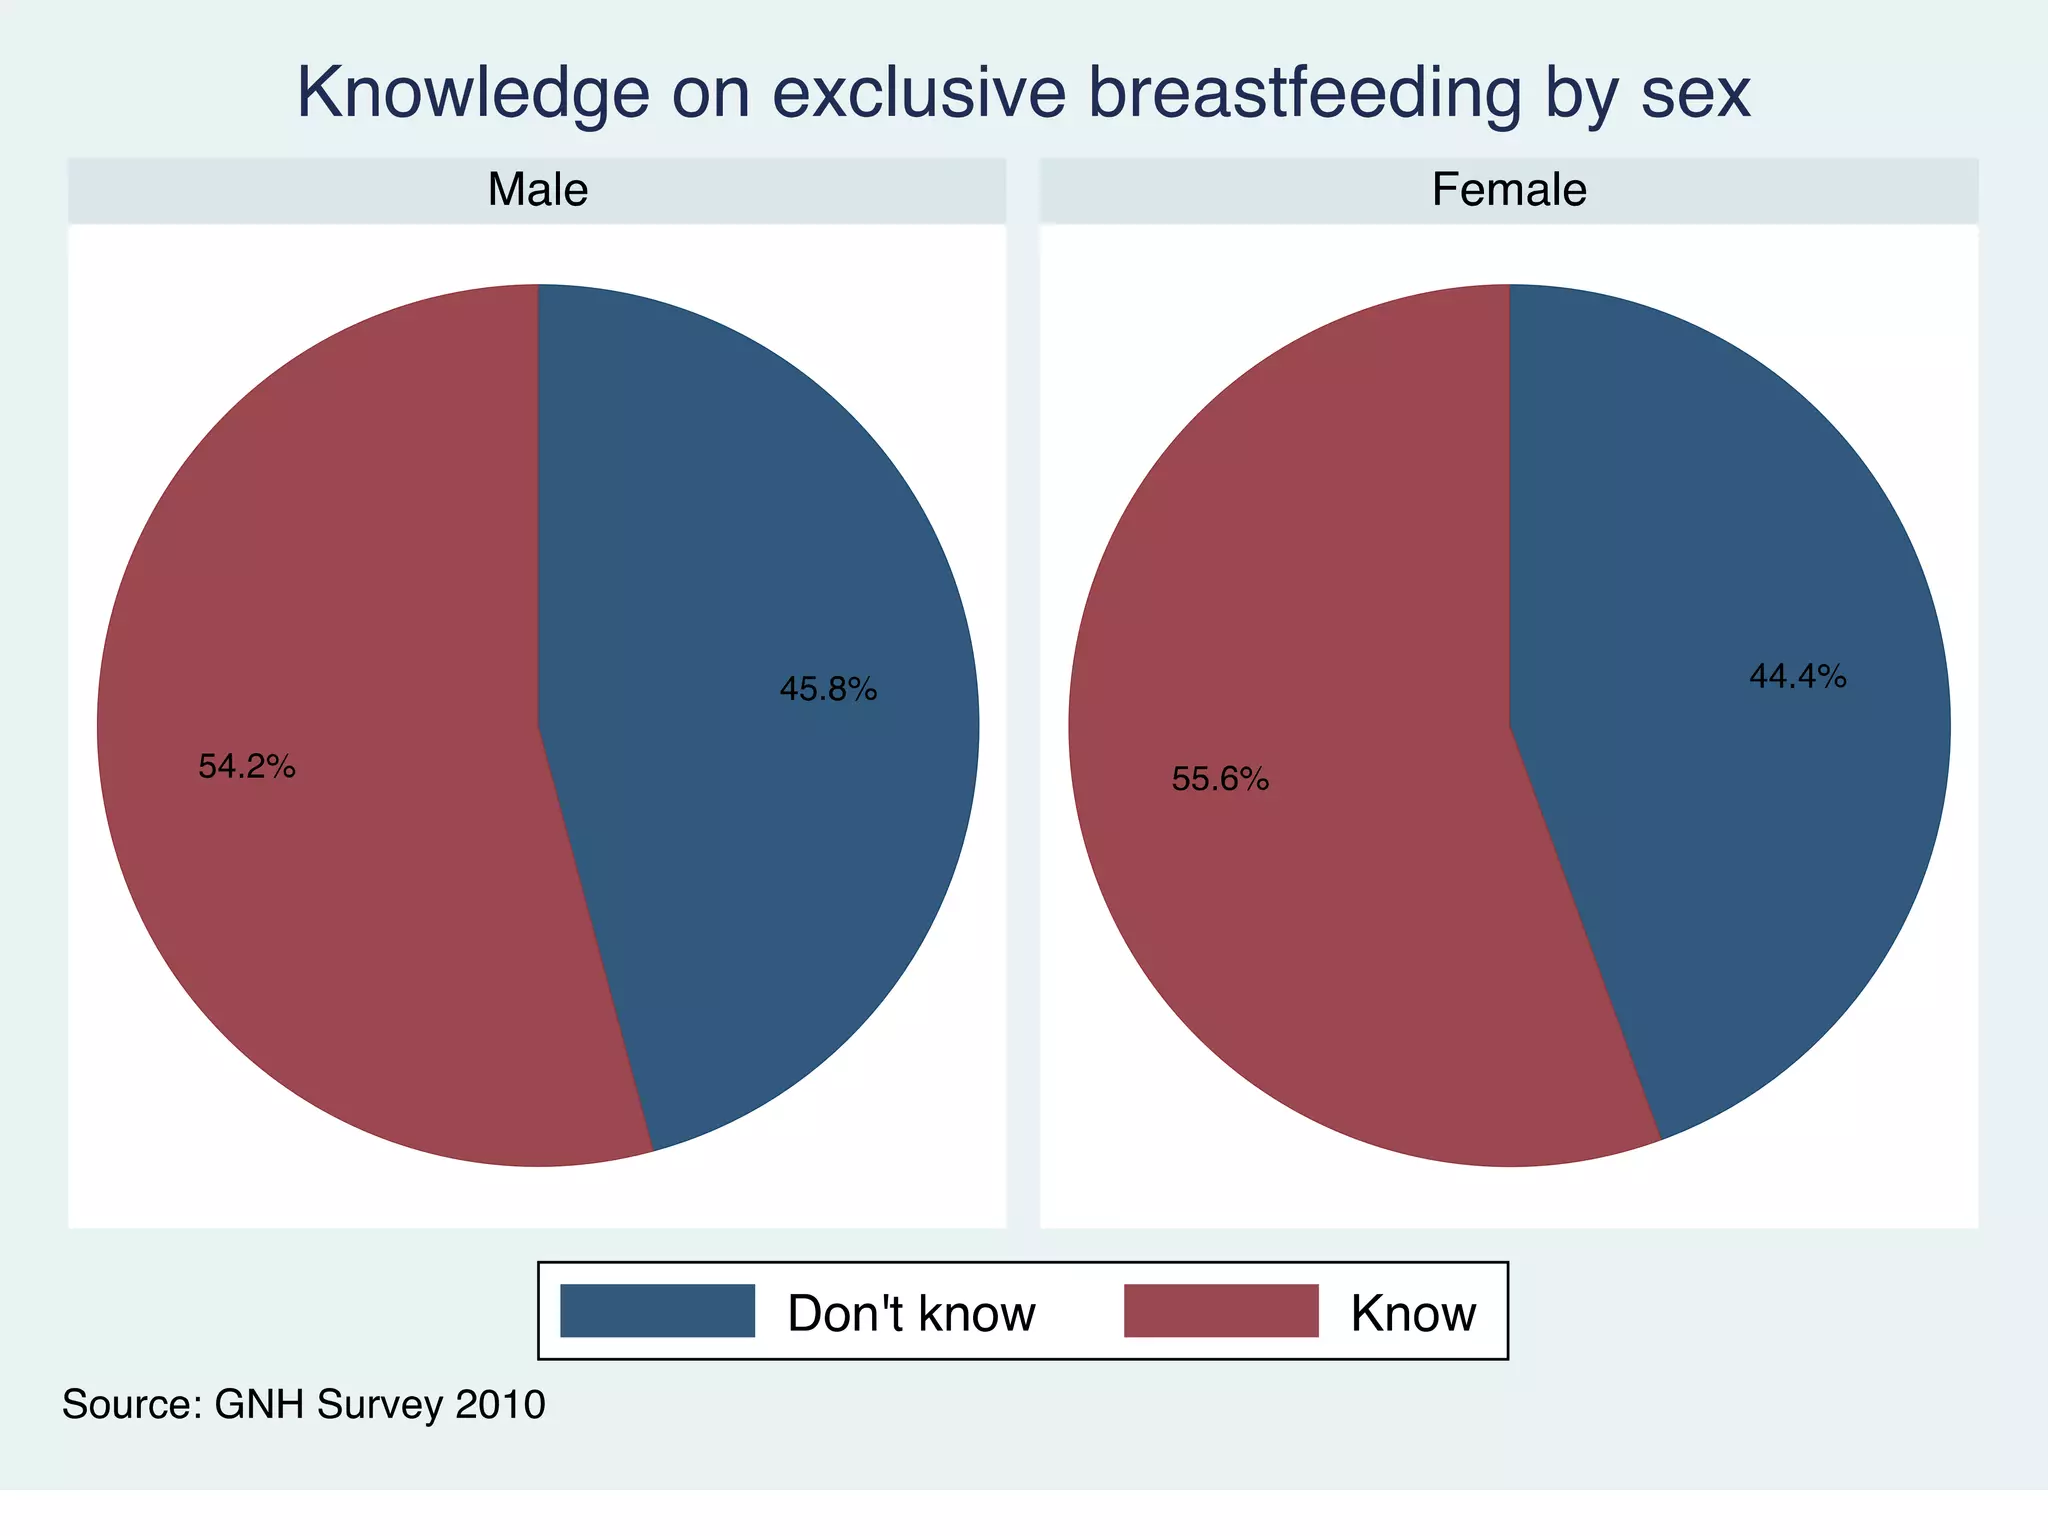
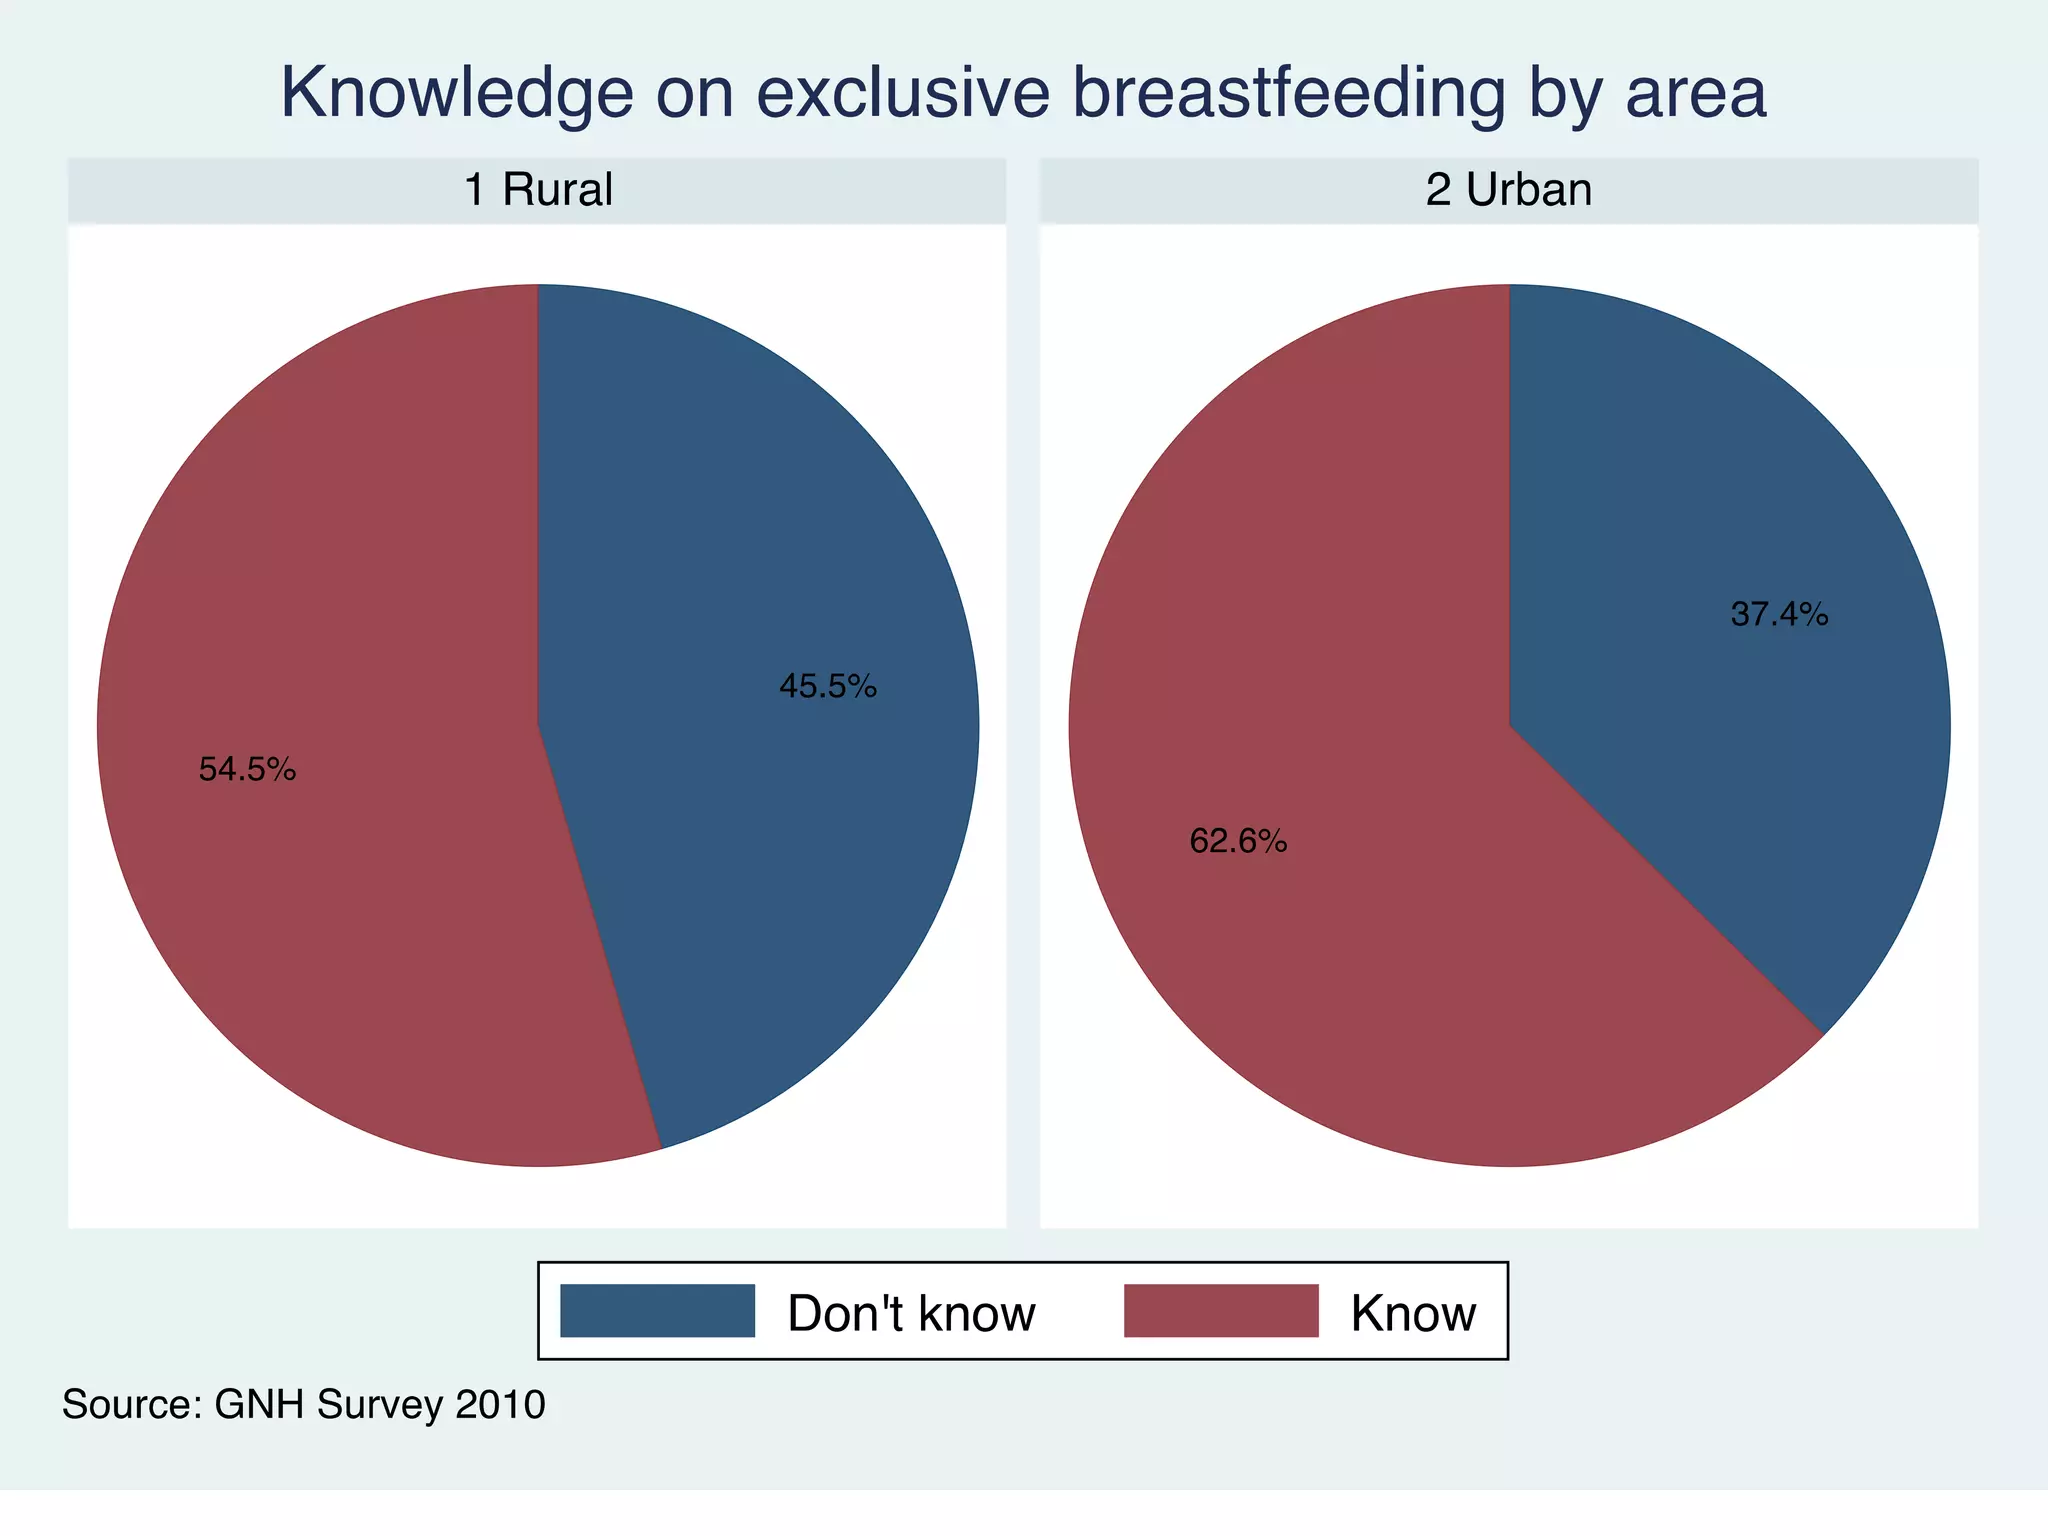
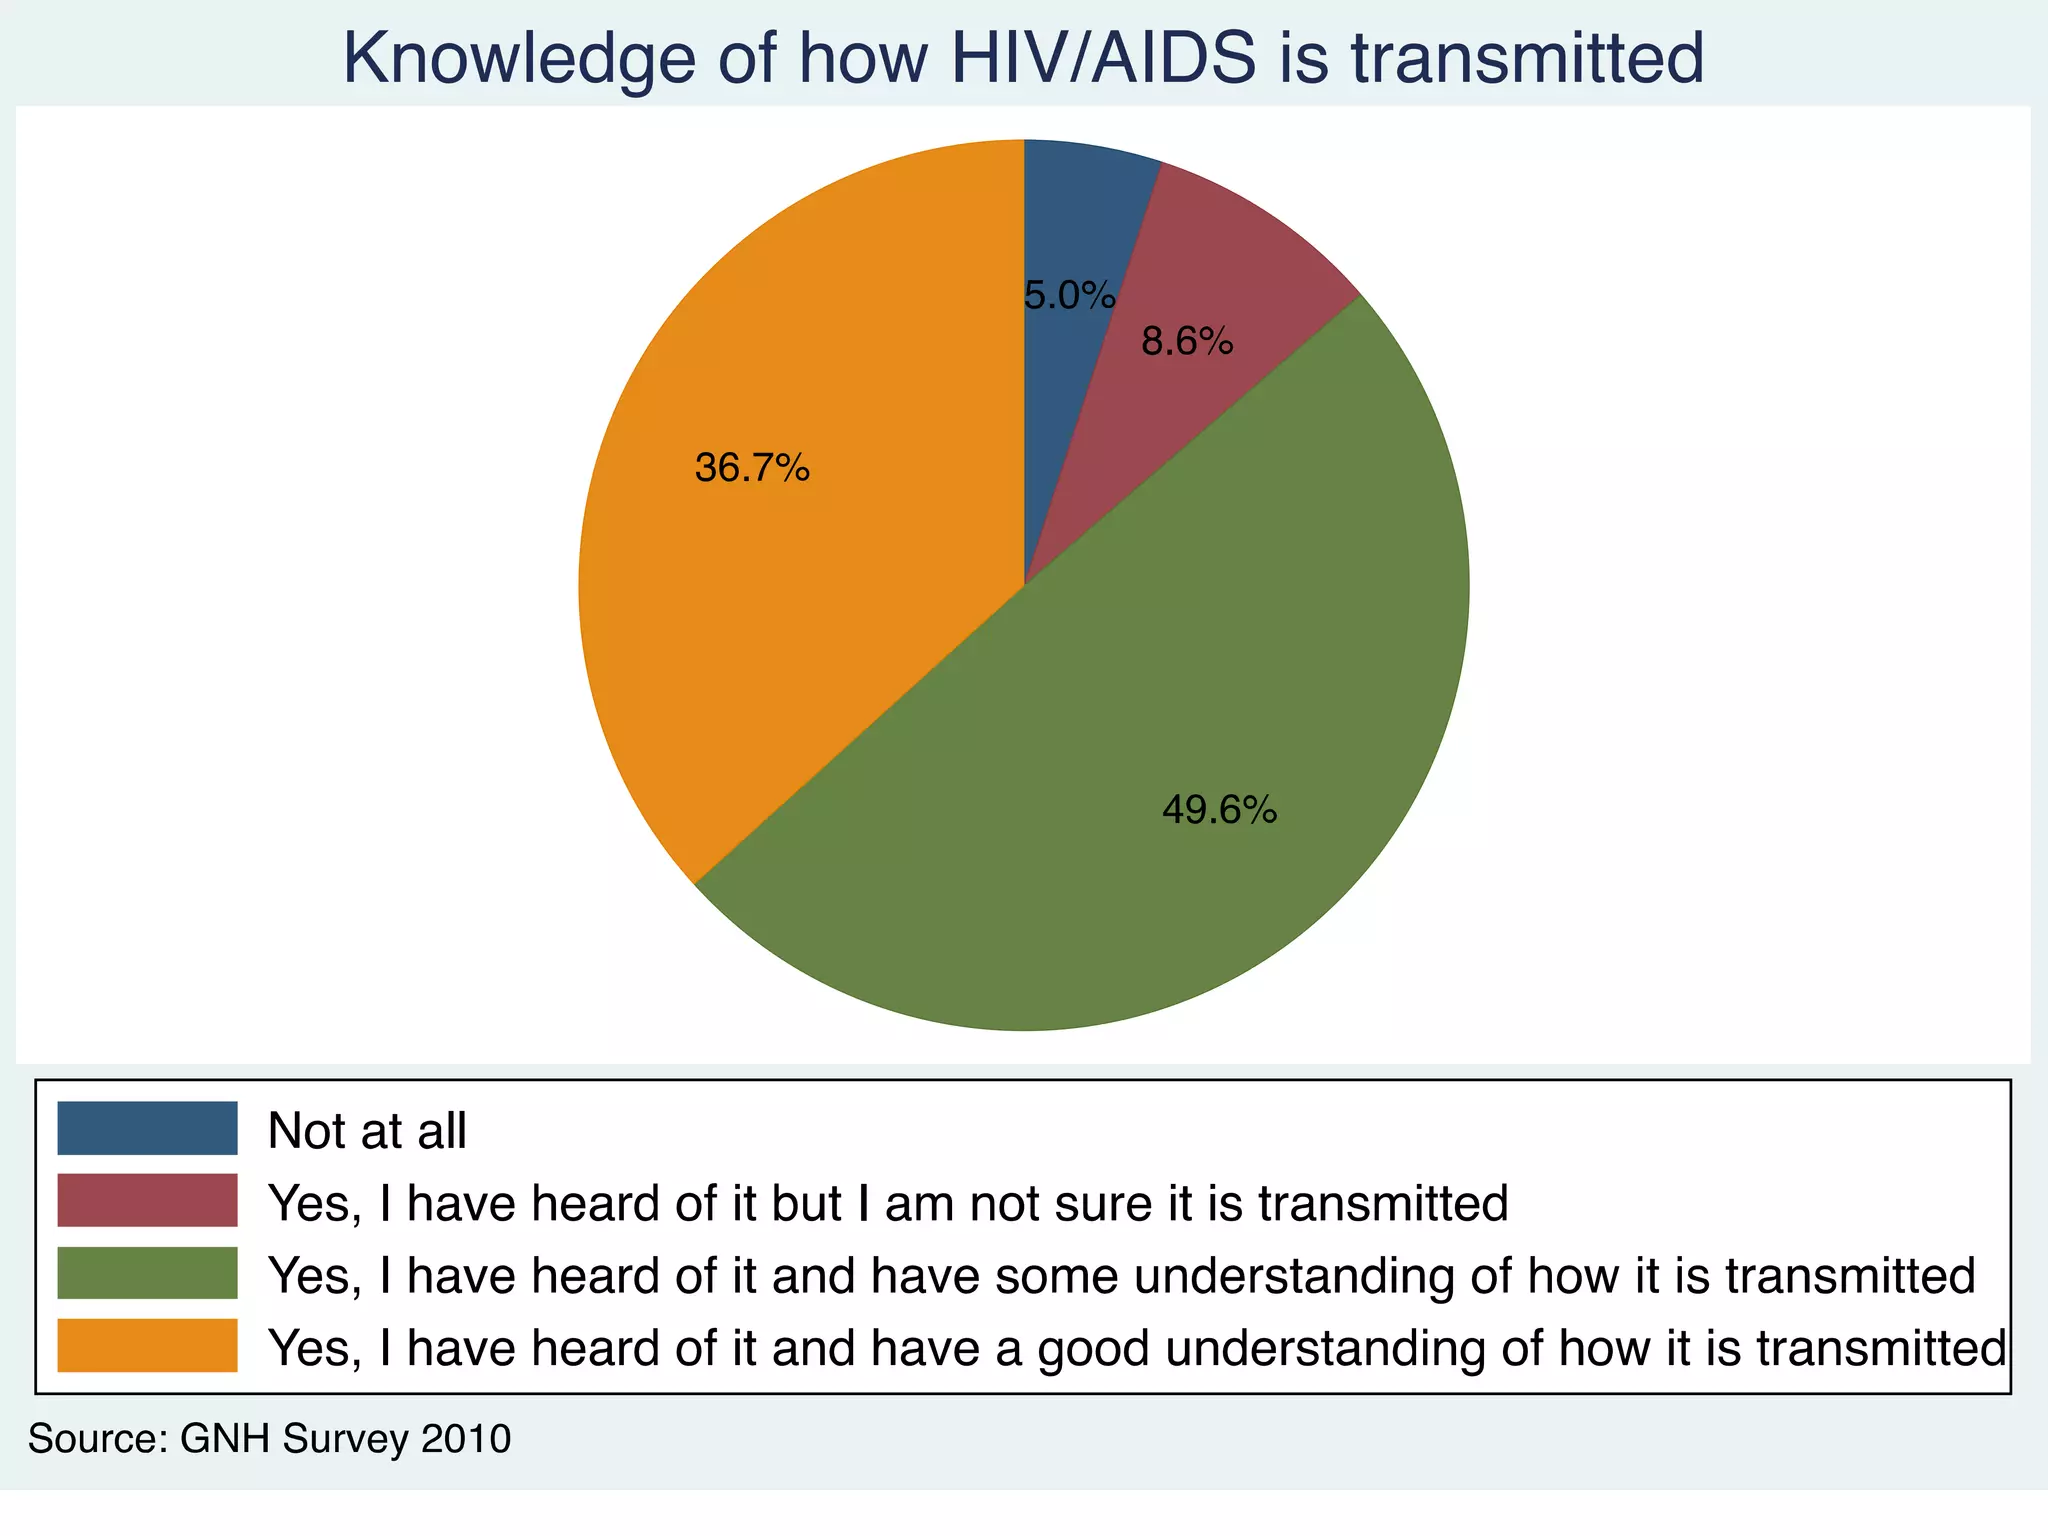
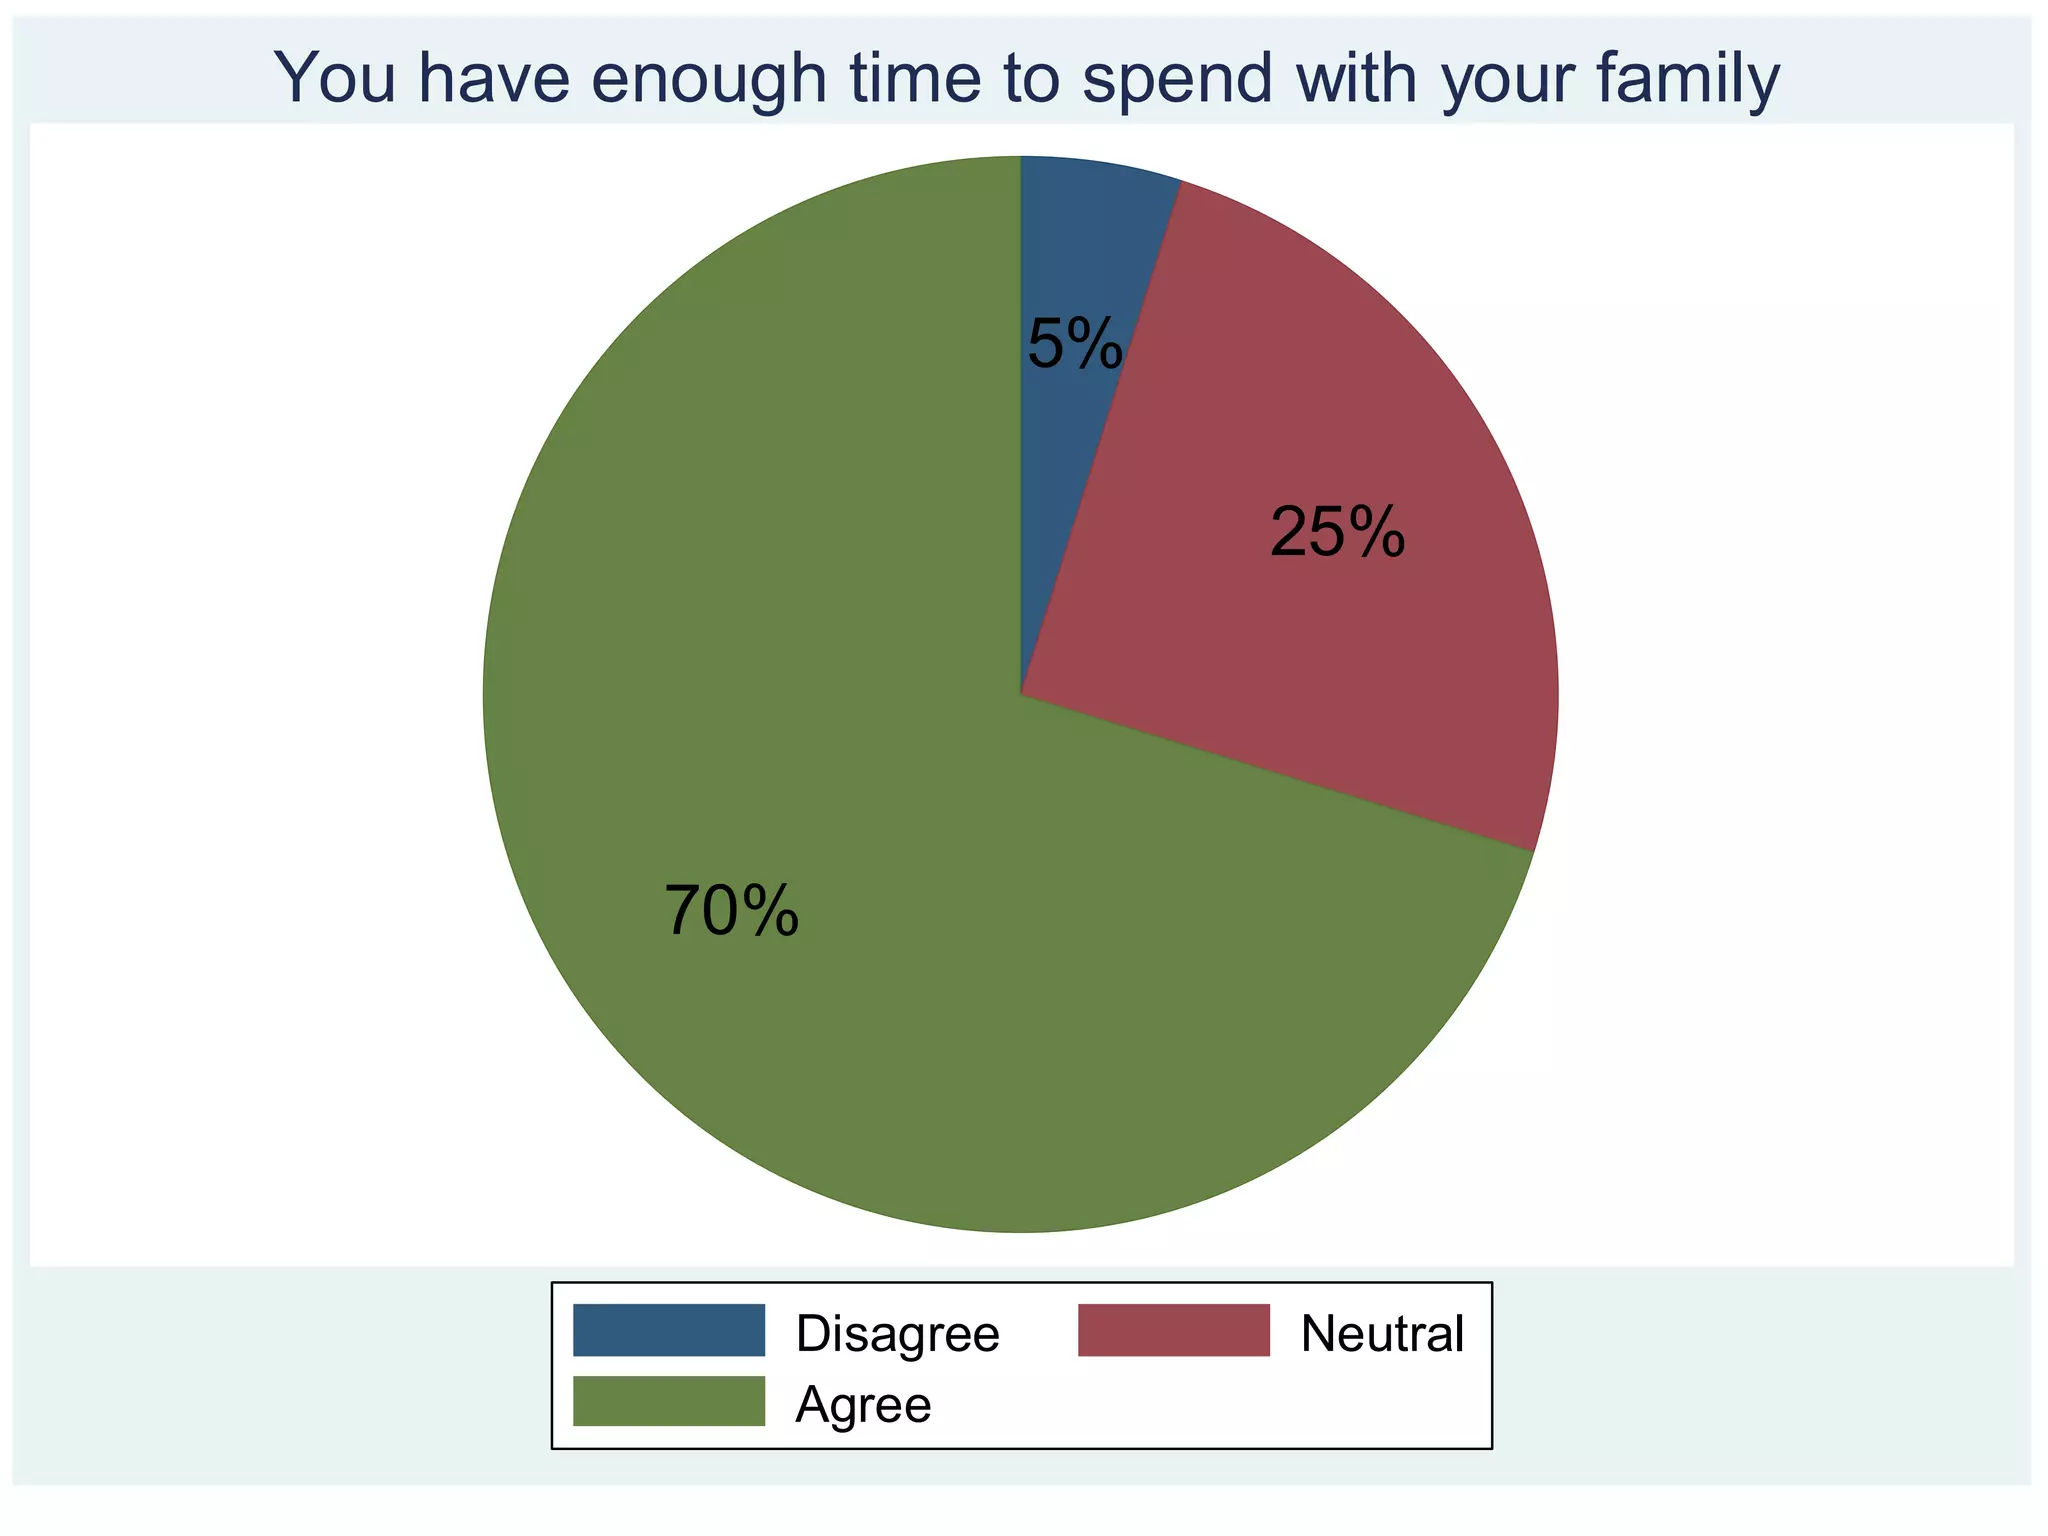
- Respondents reported high levels of psychological well-being, health, and time balance.
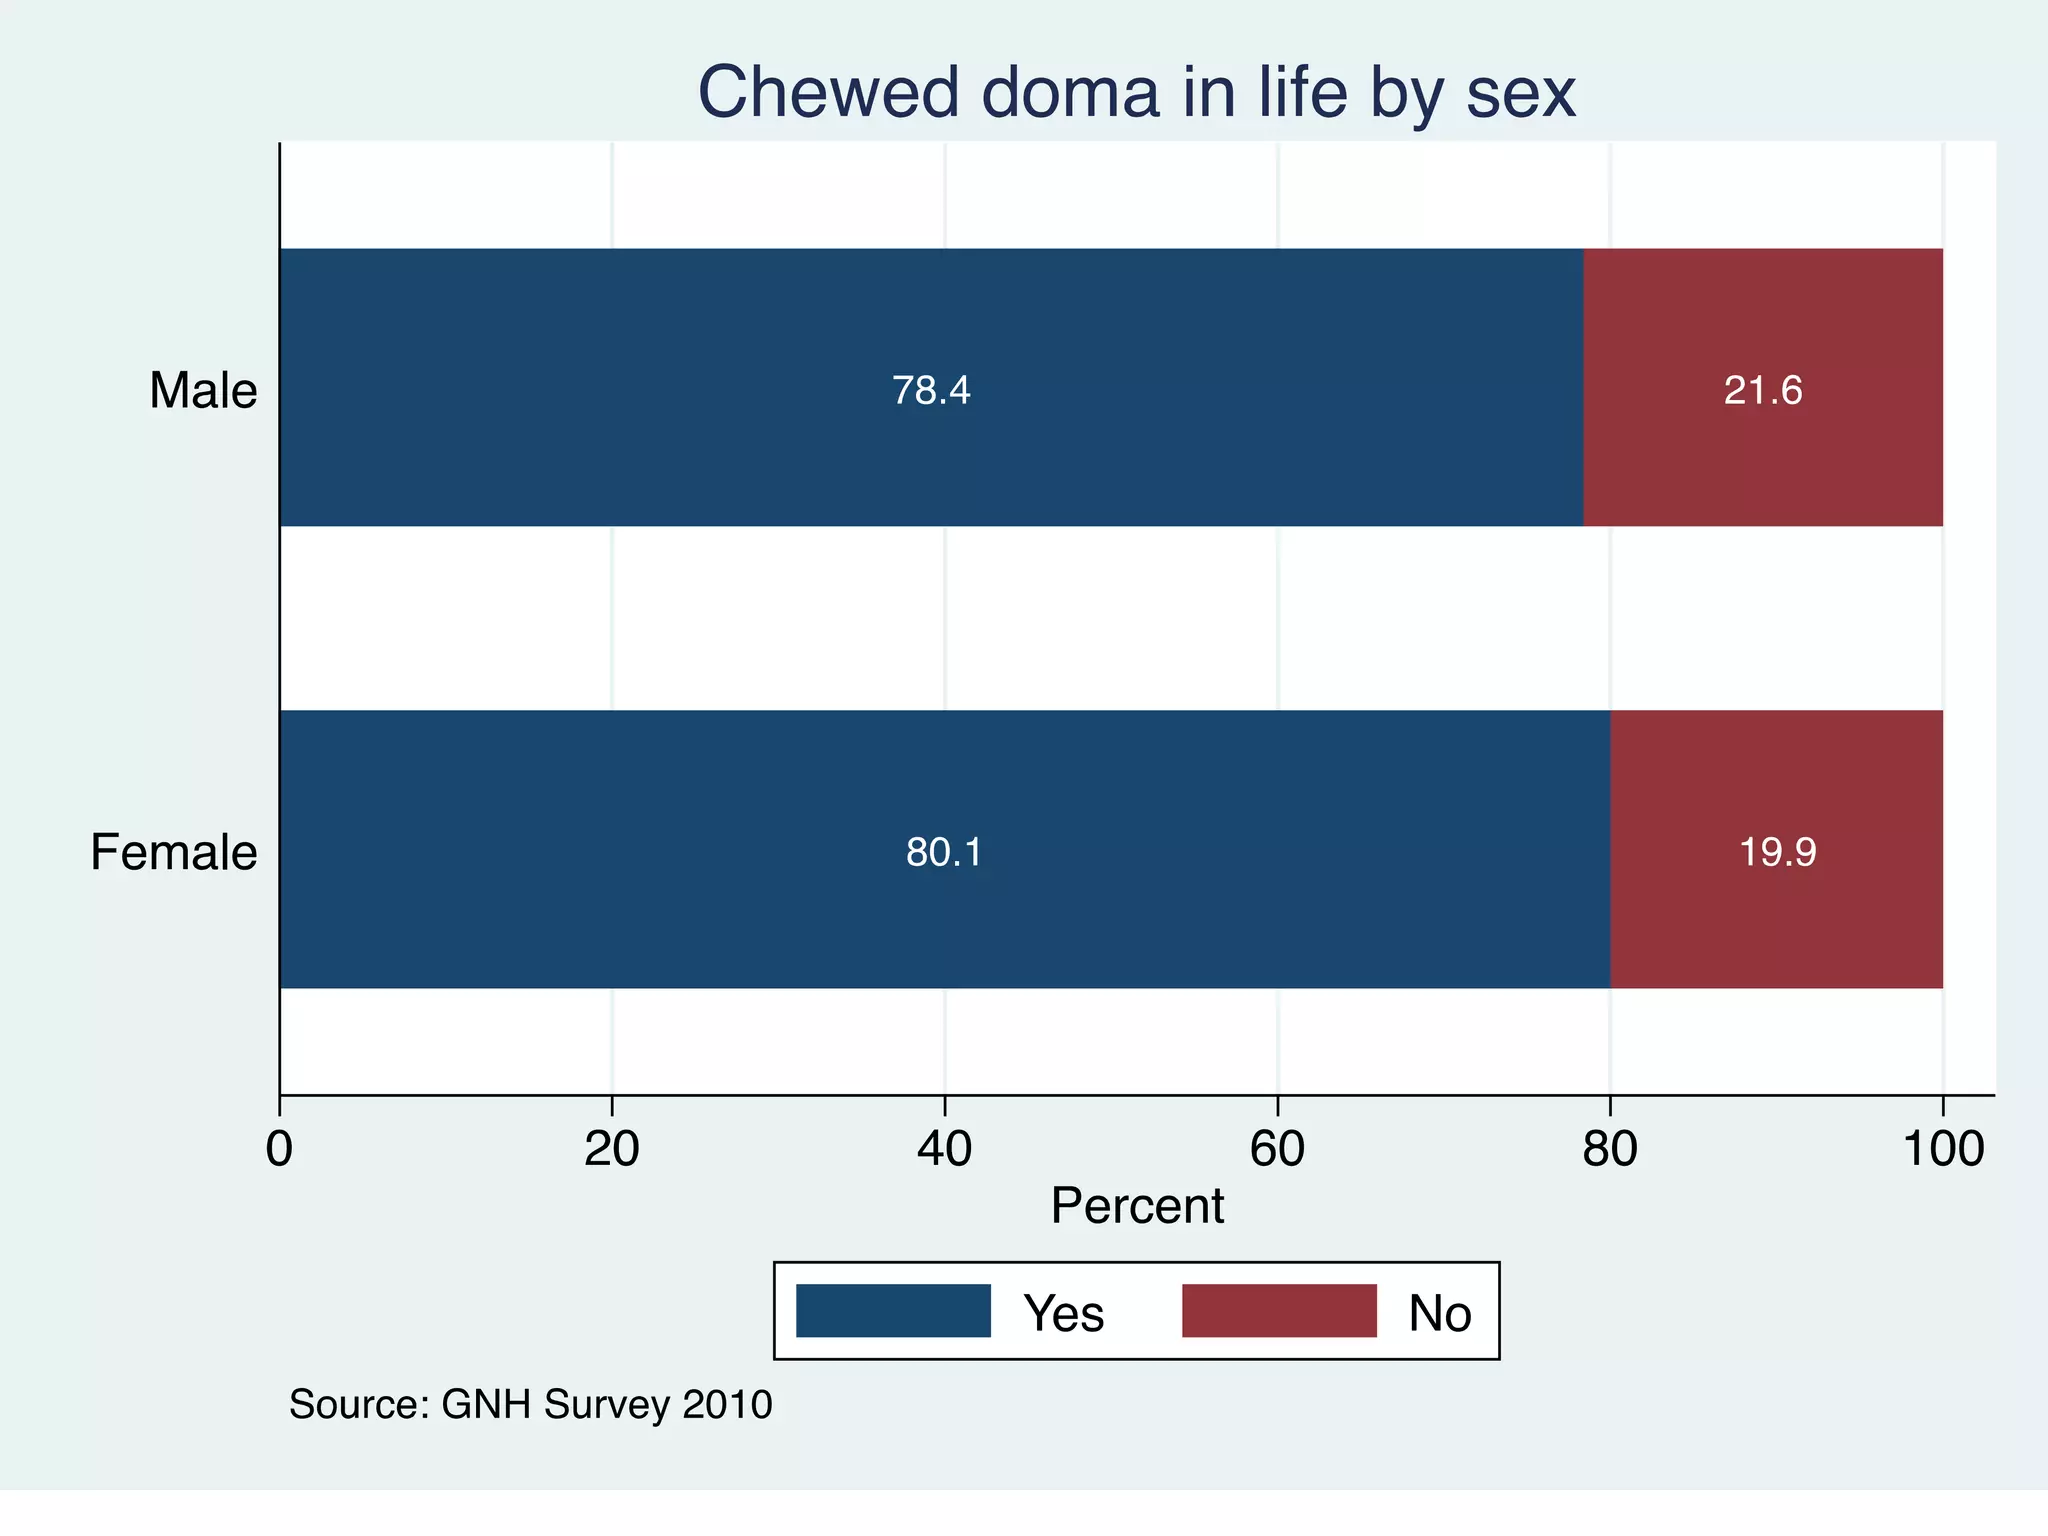
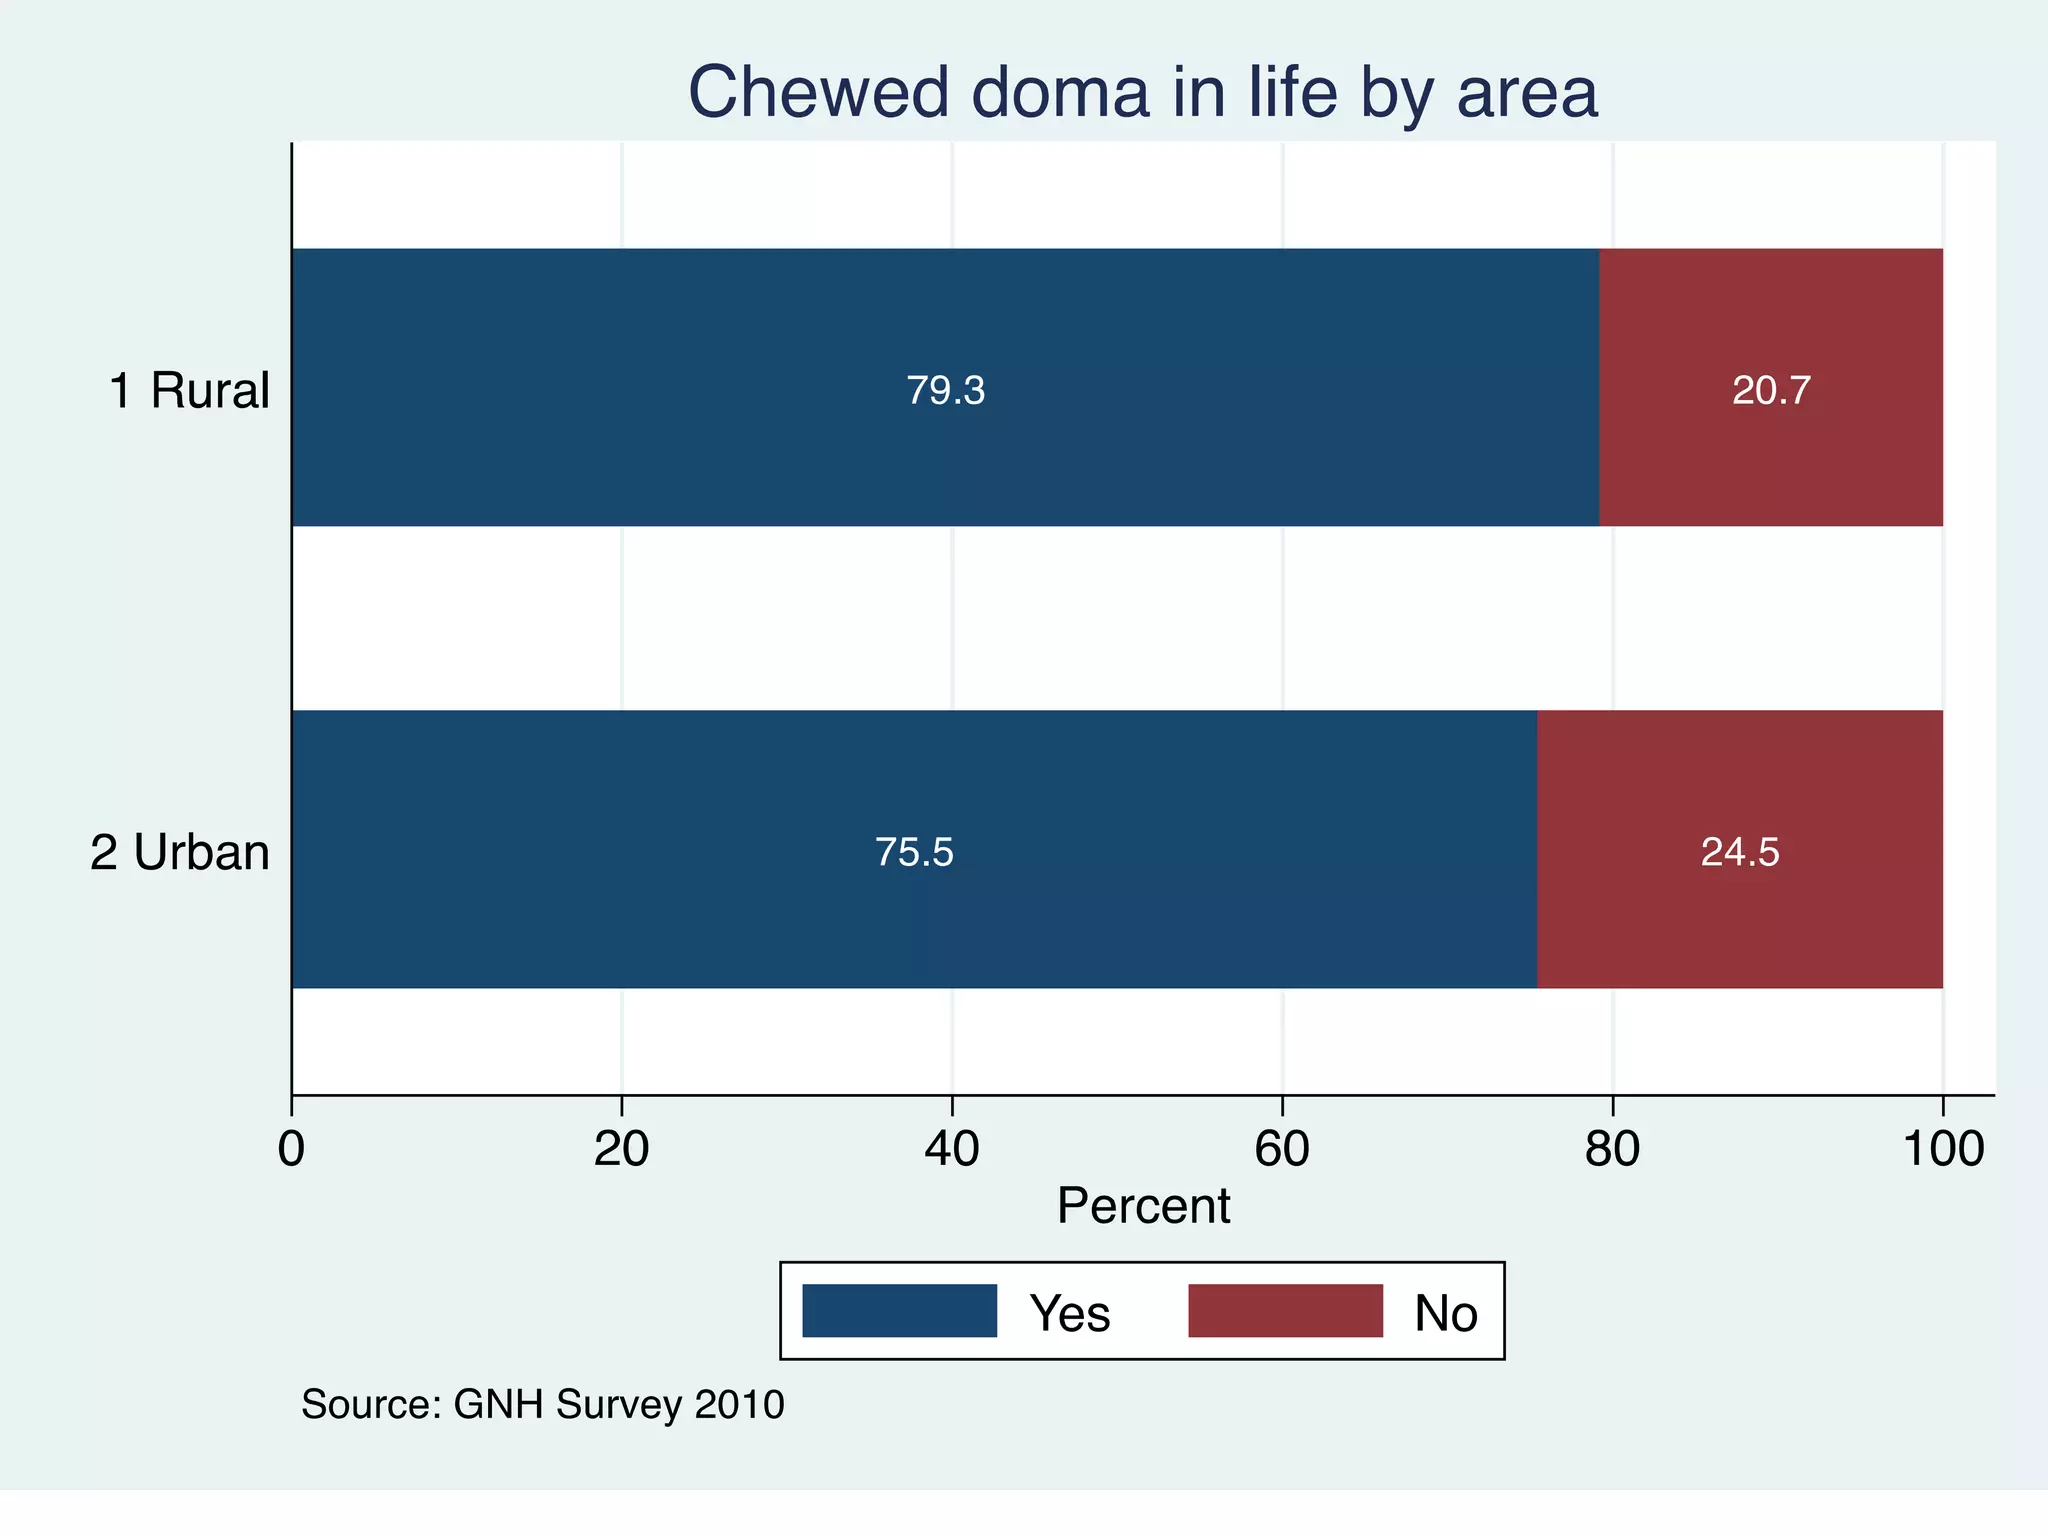
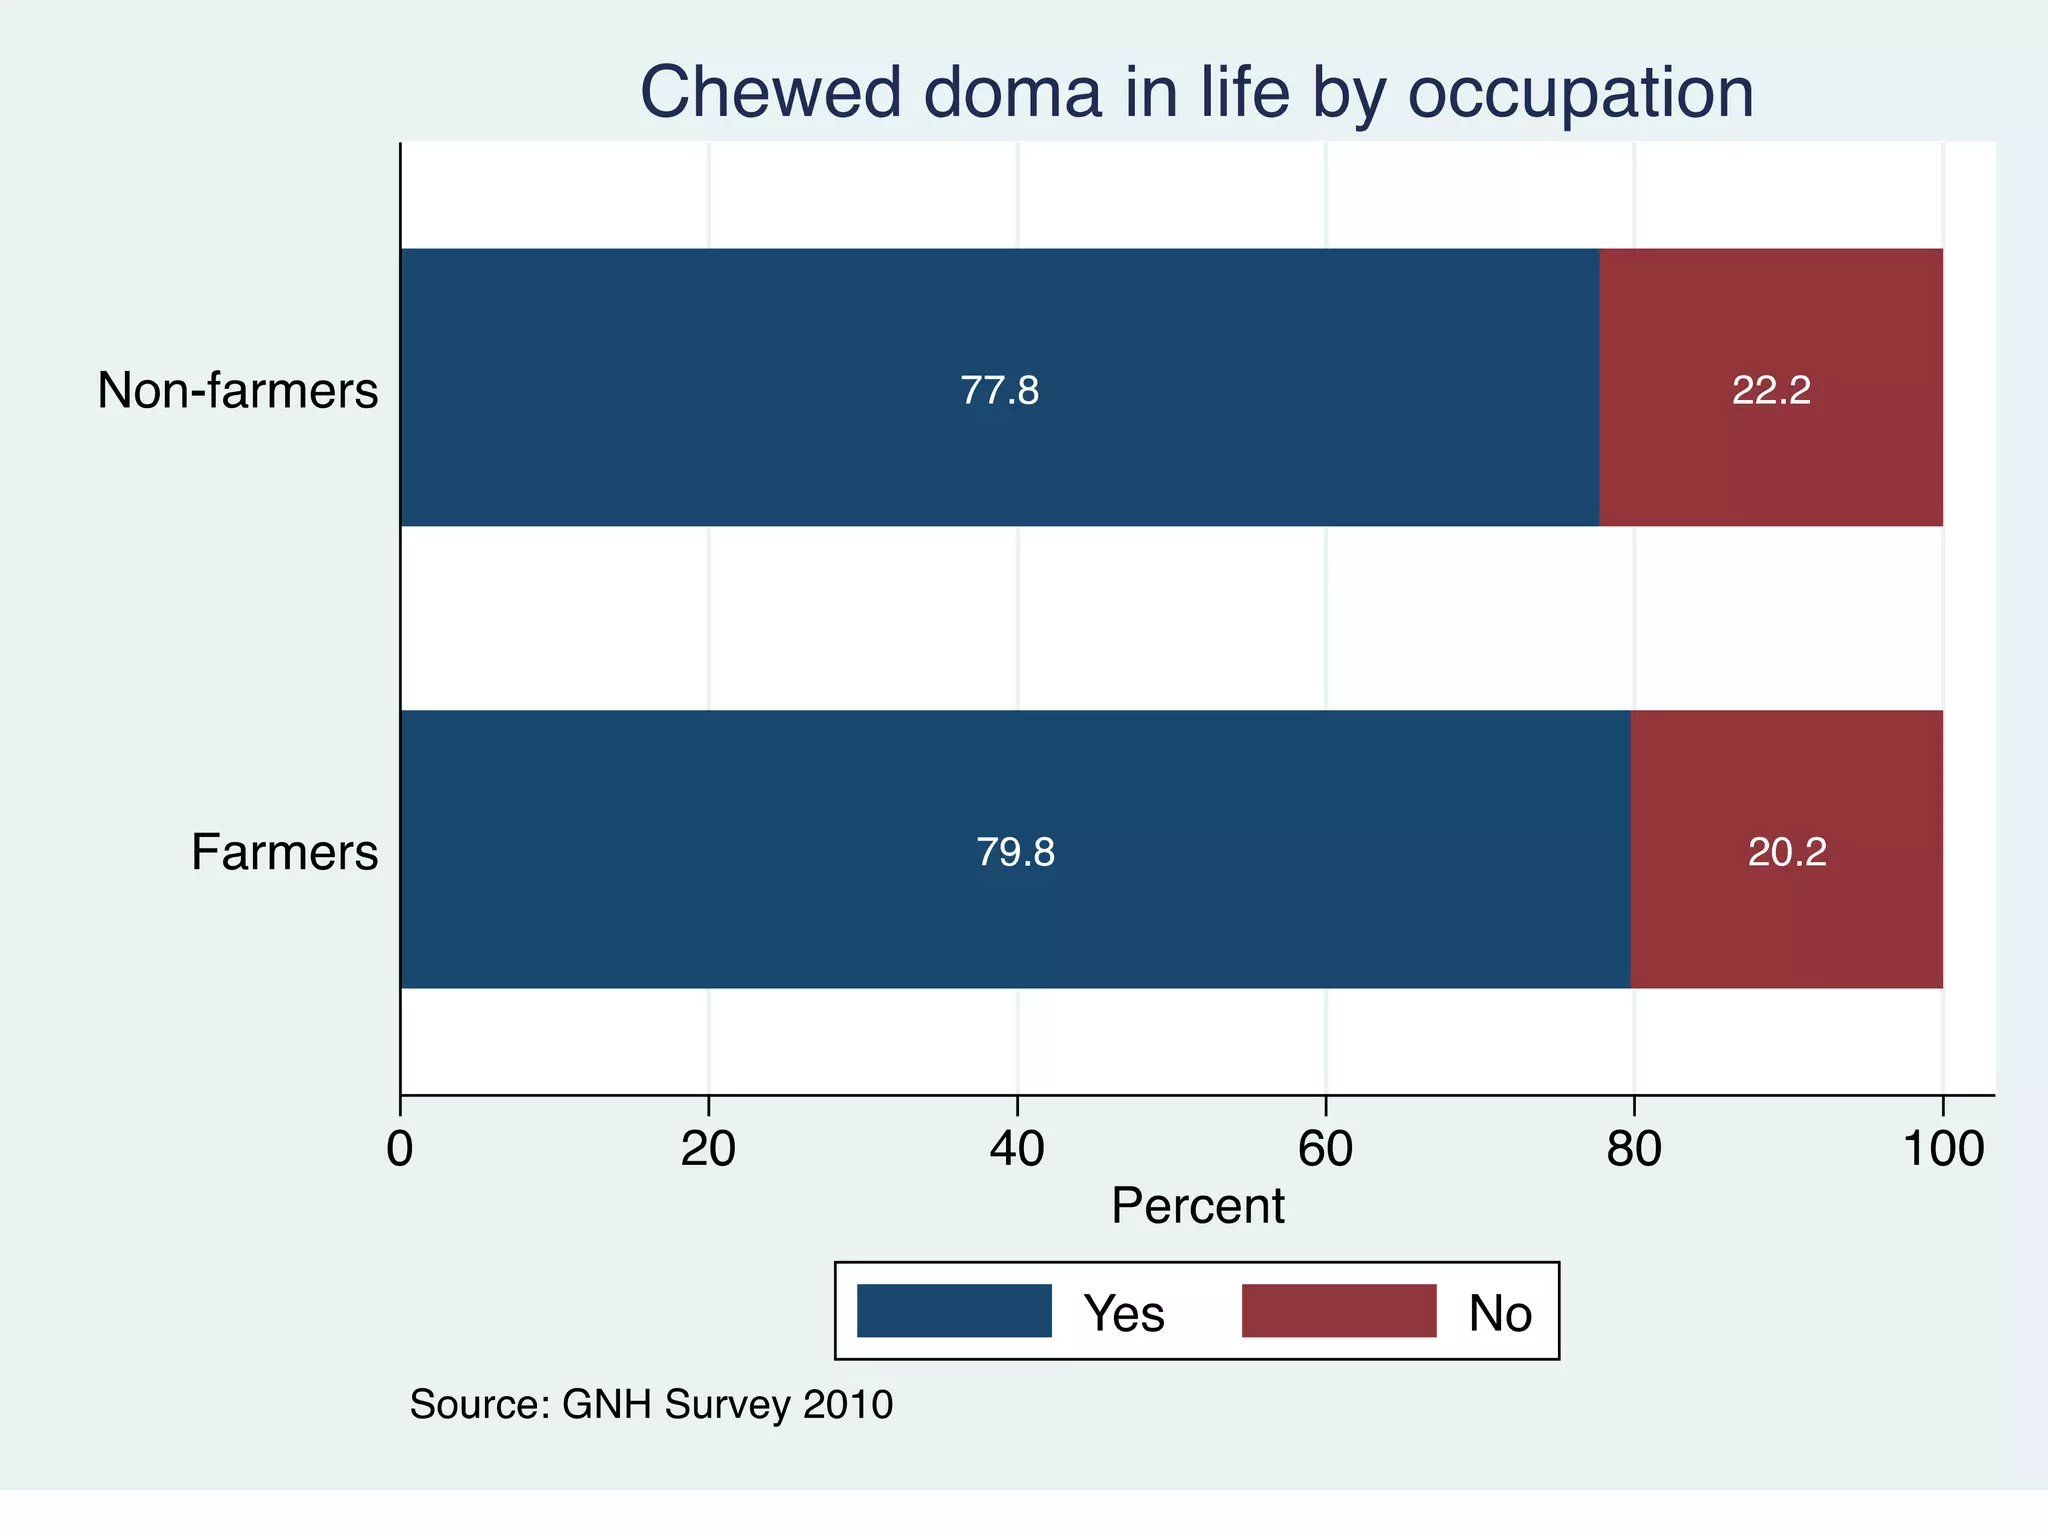
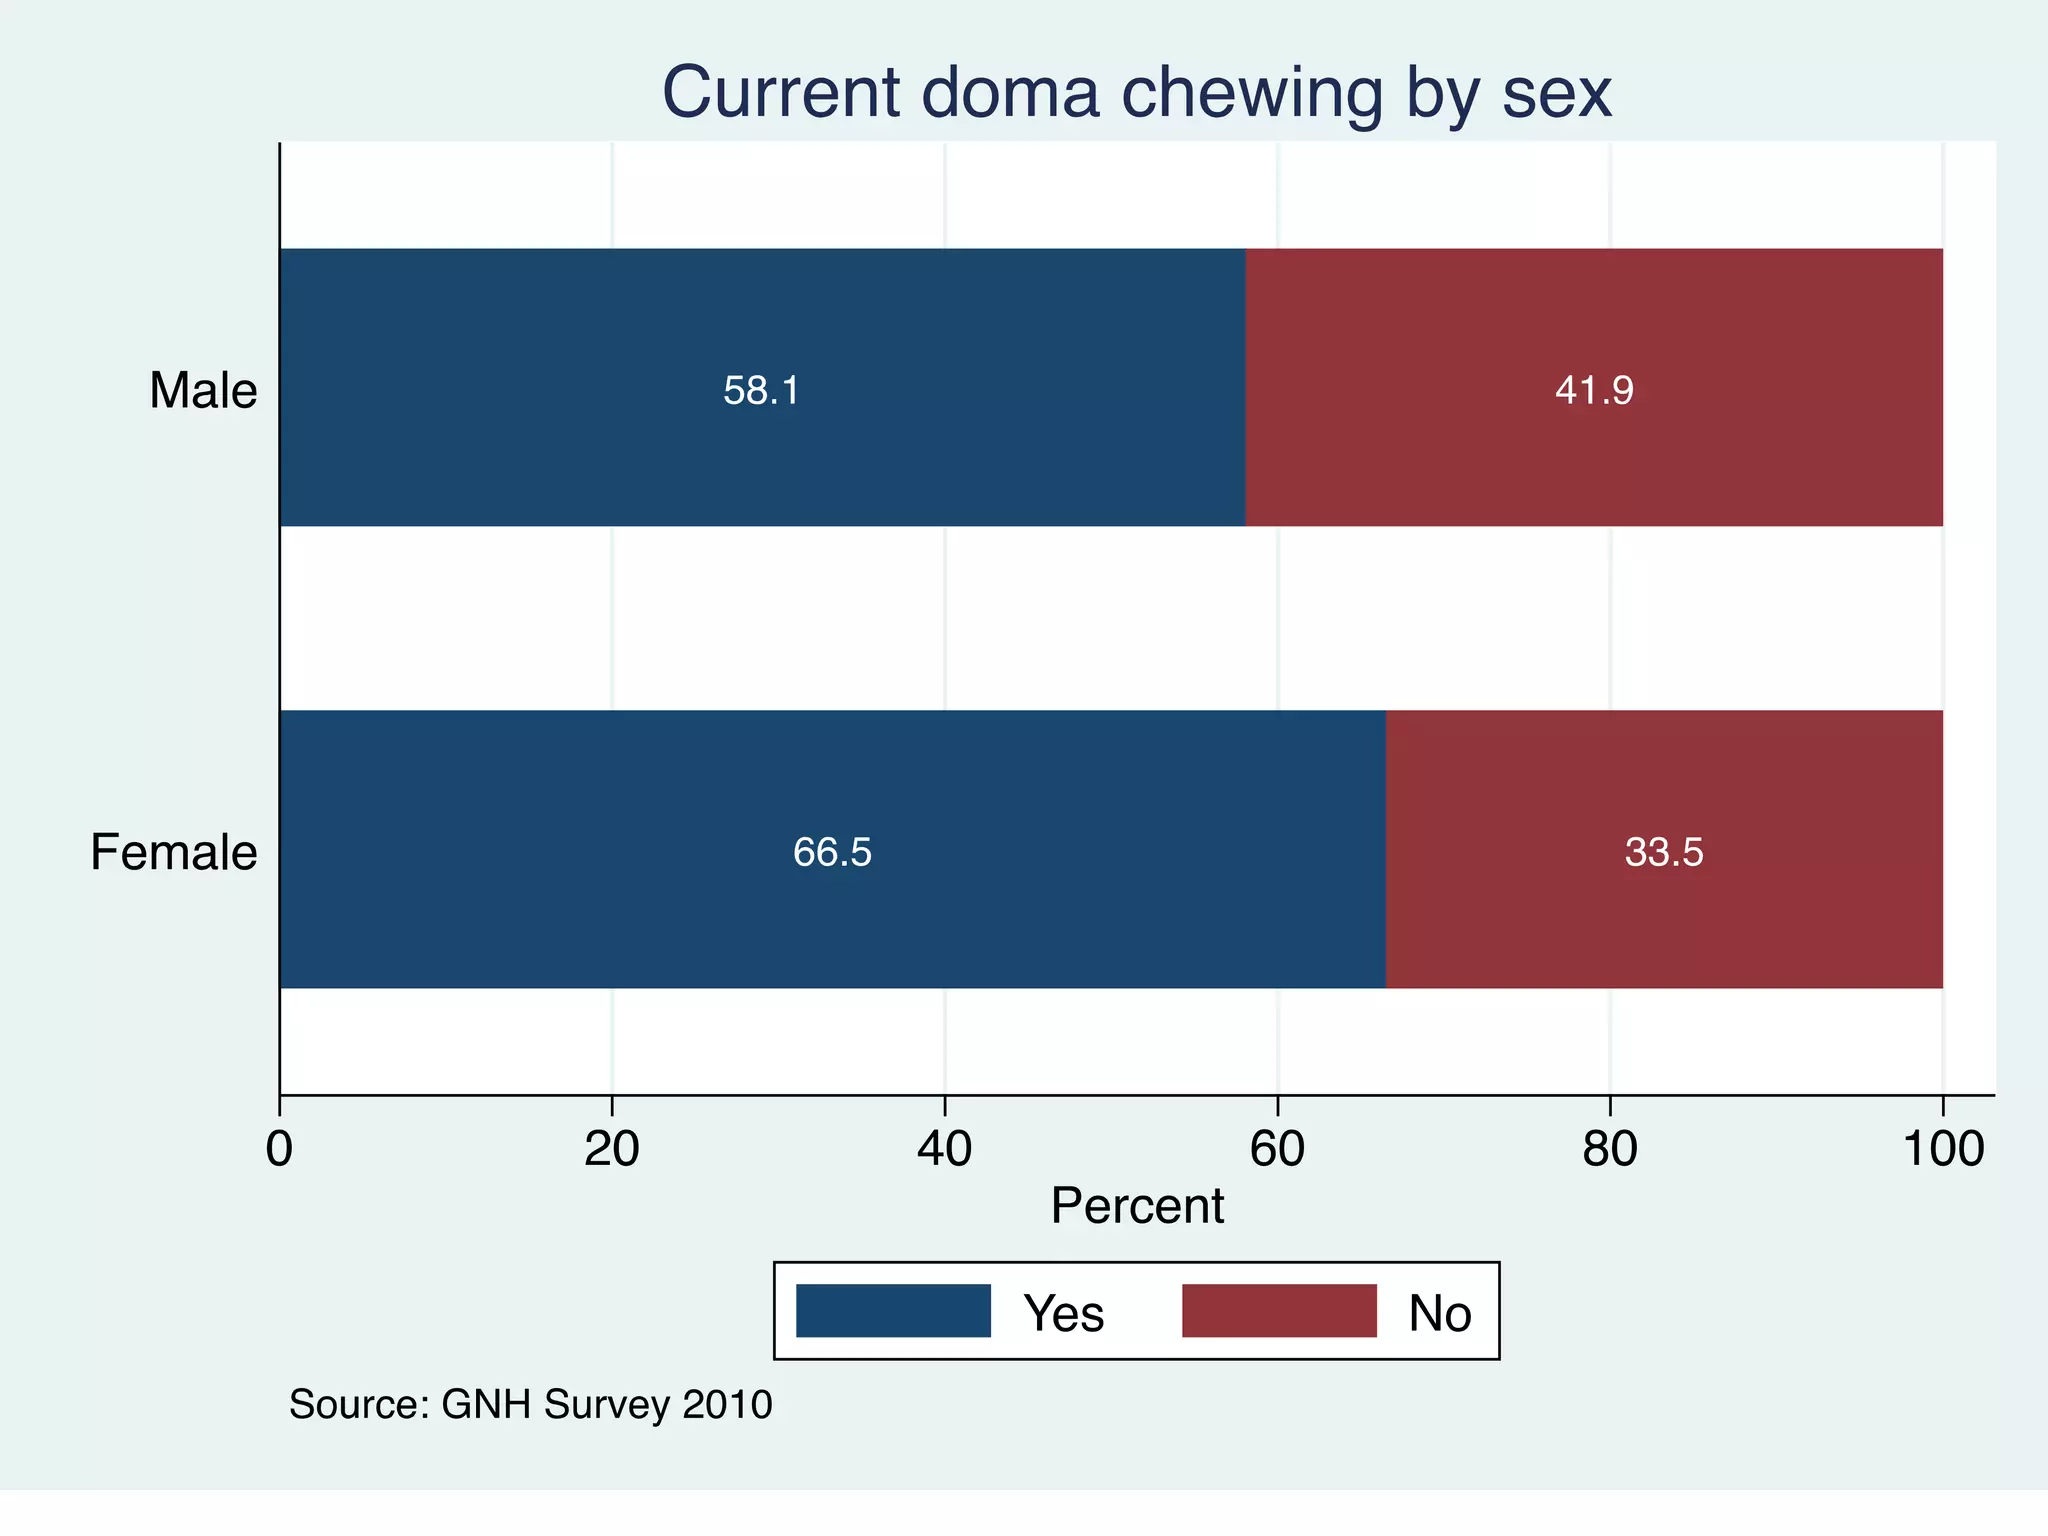
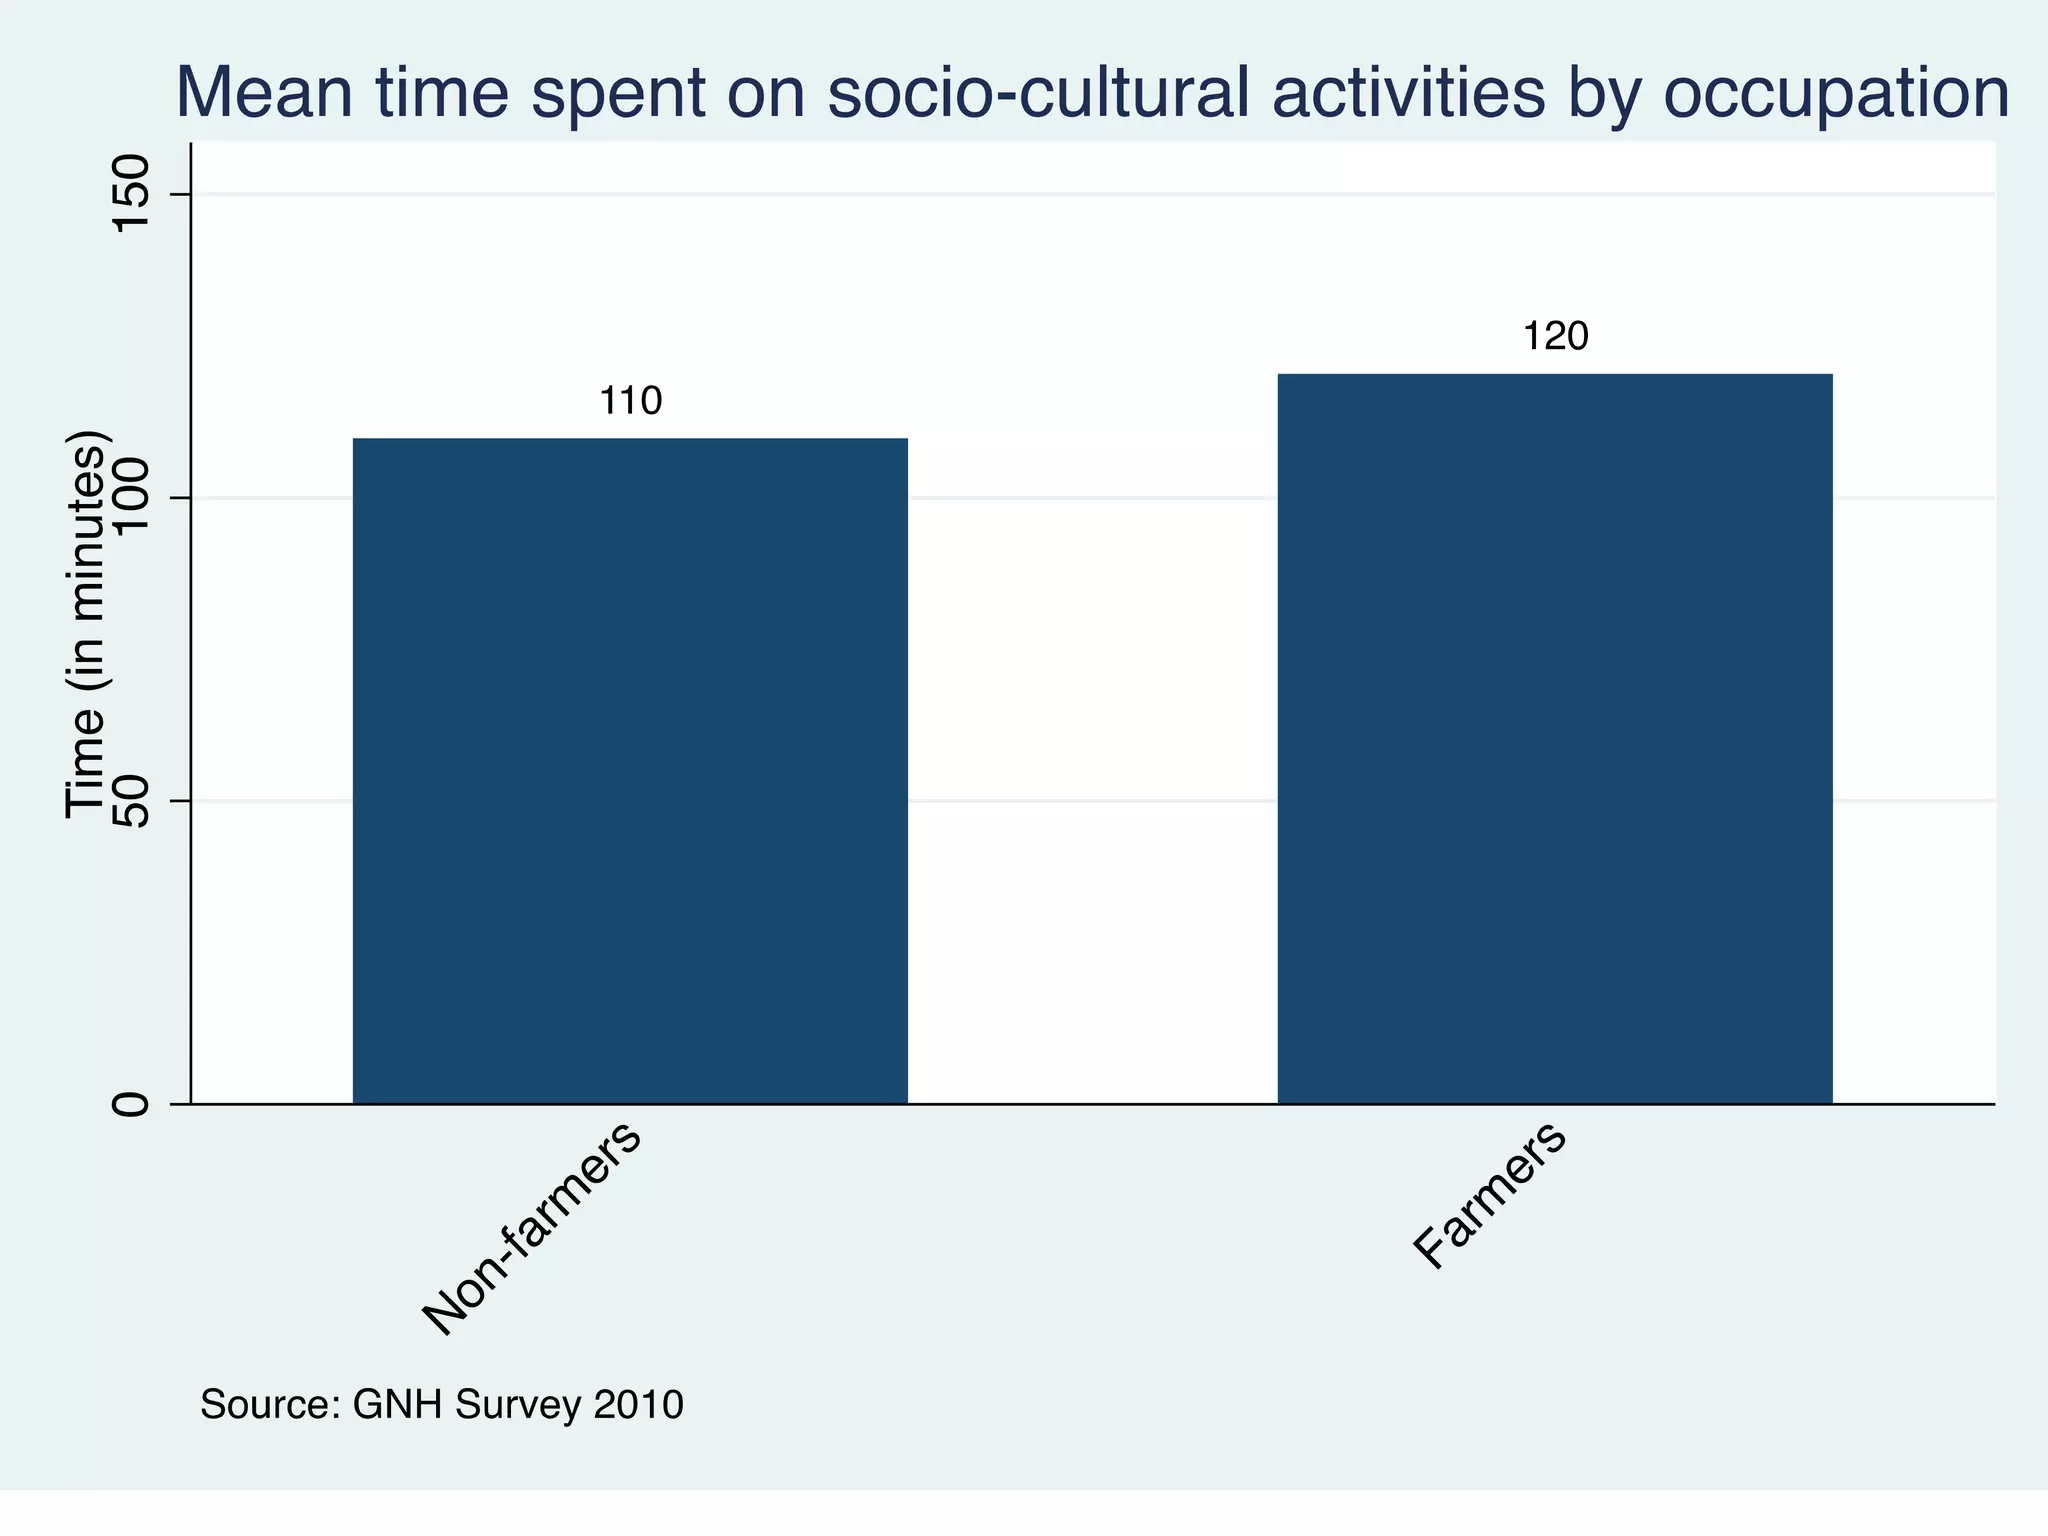
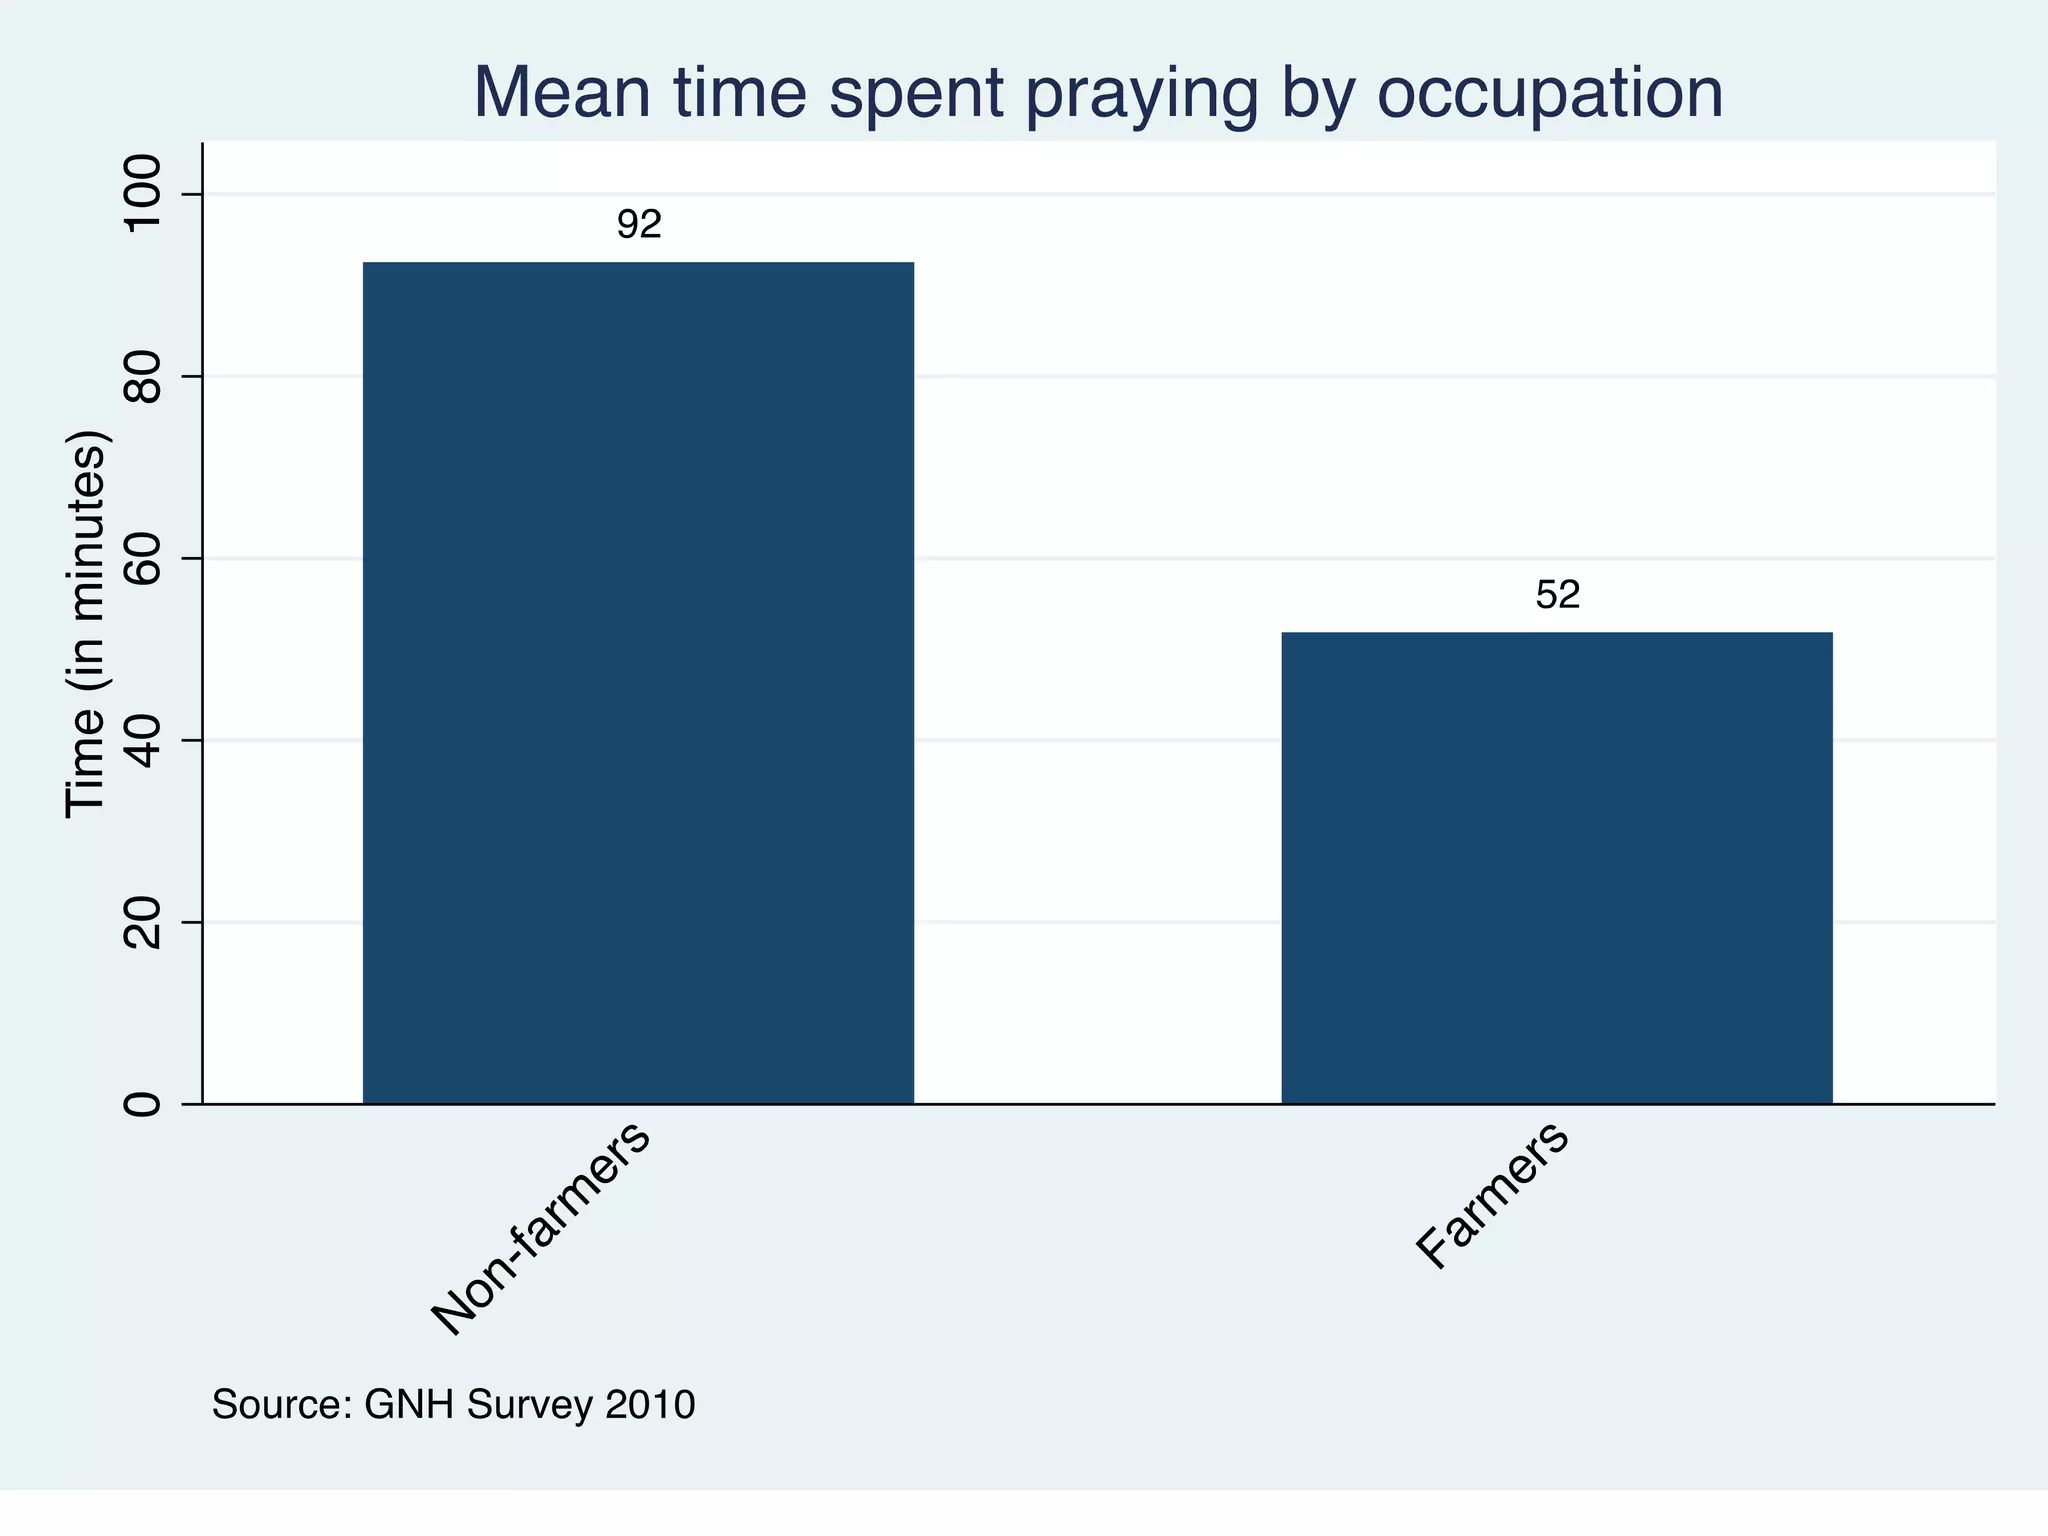
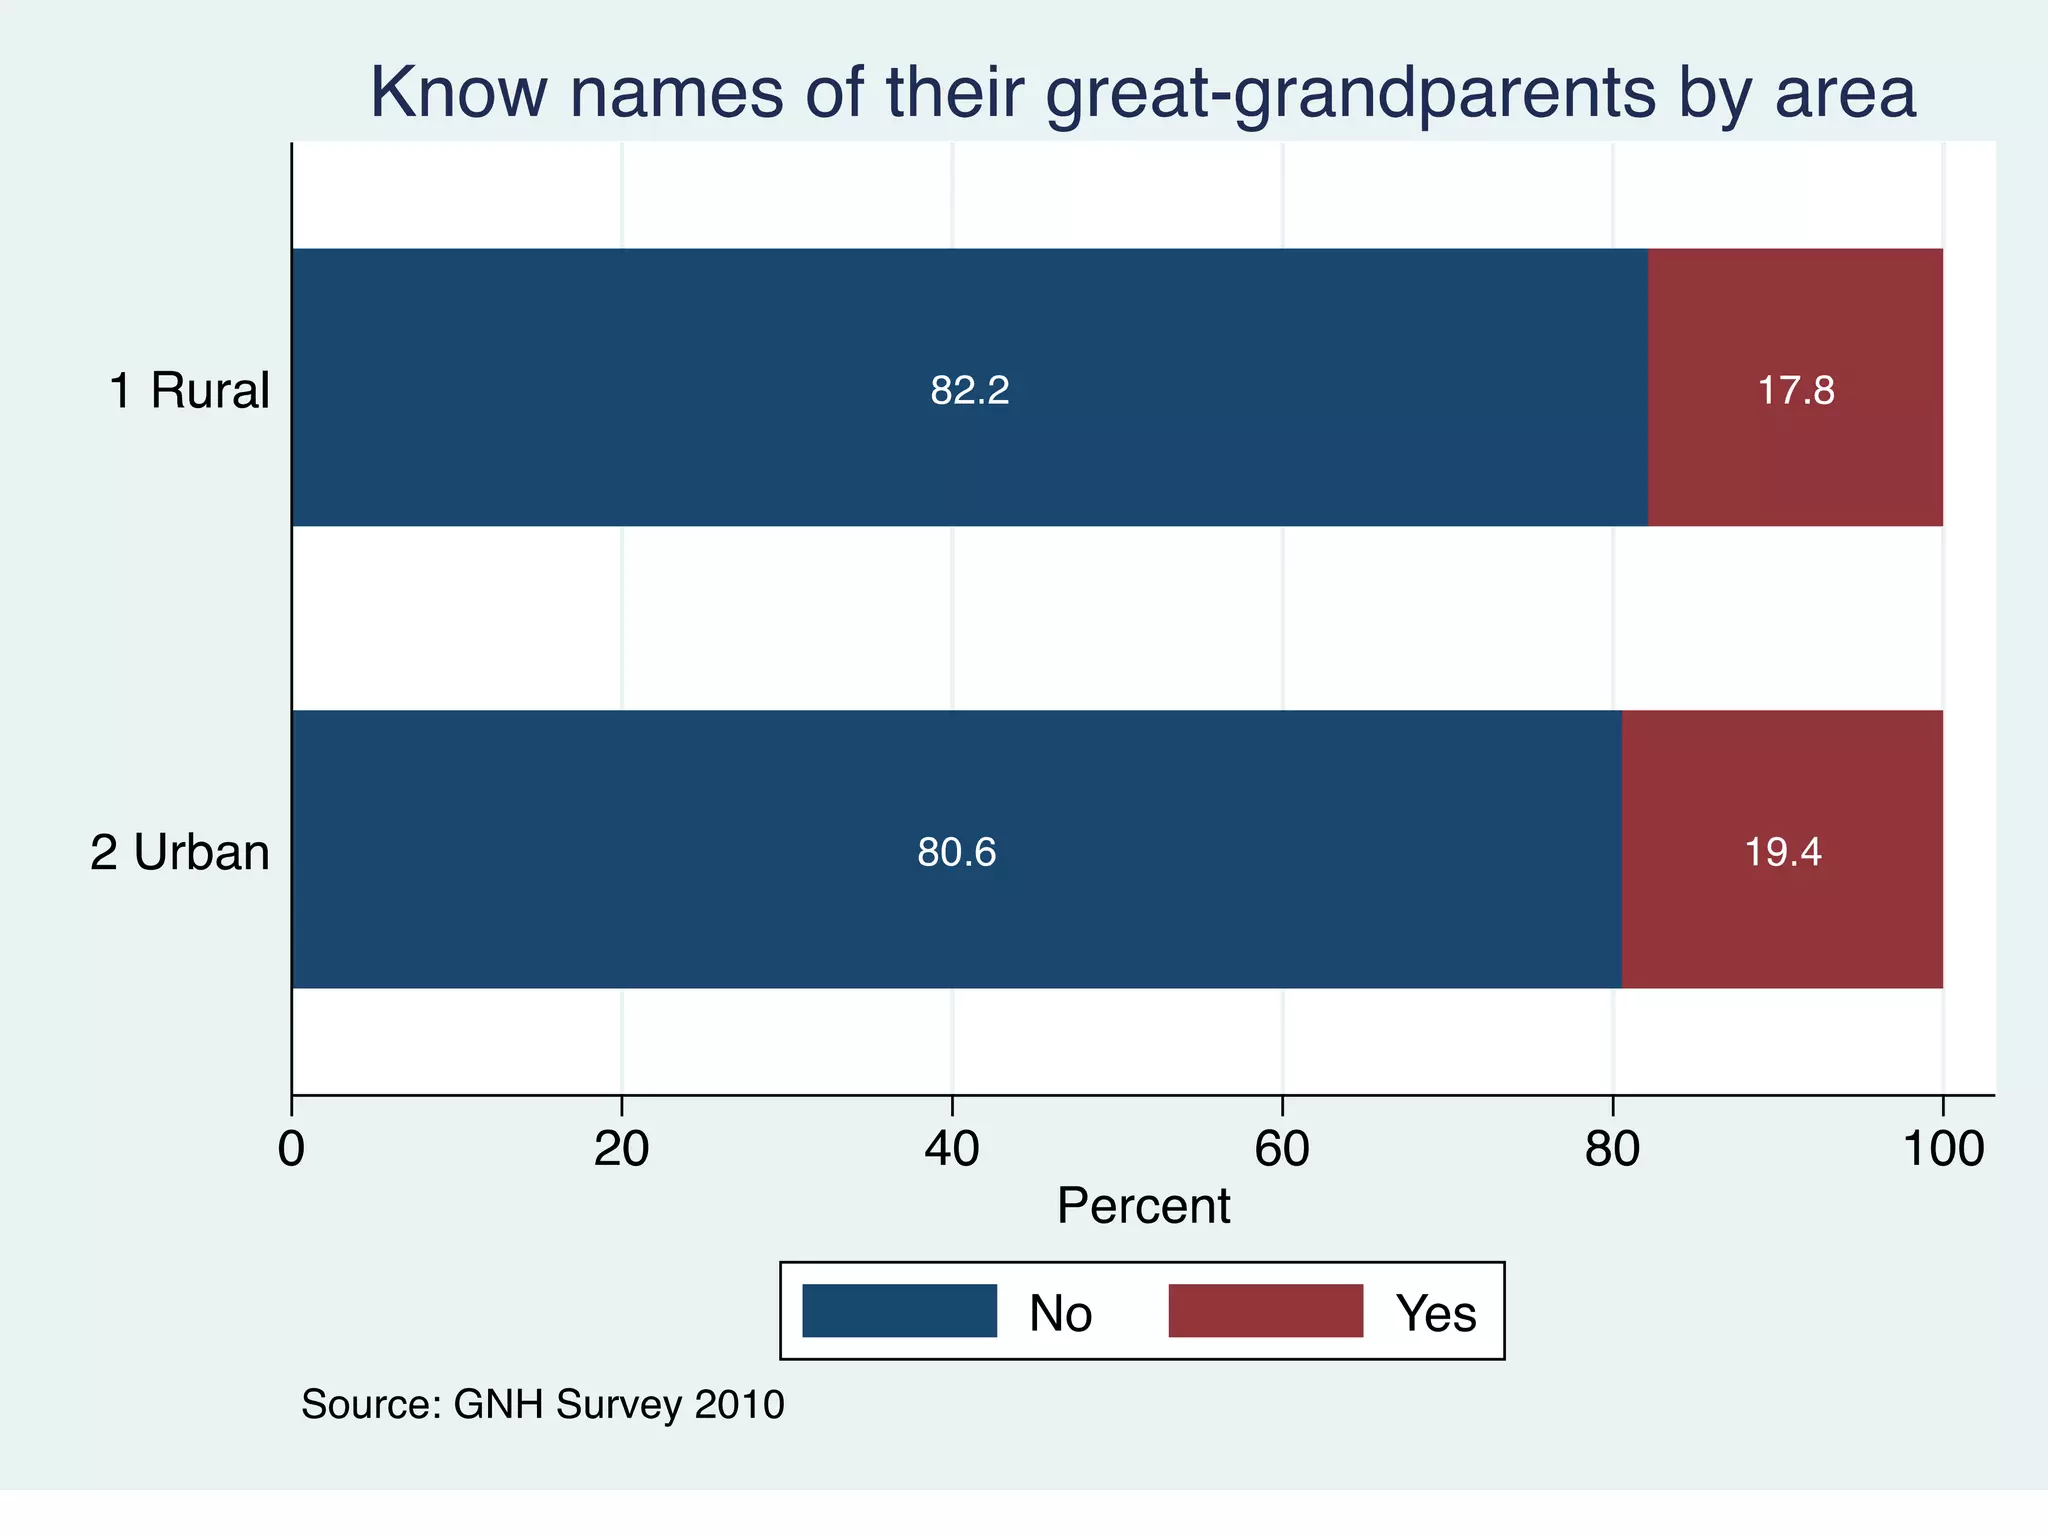
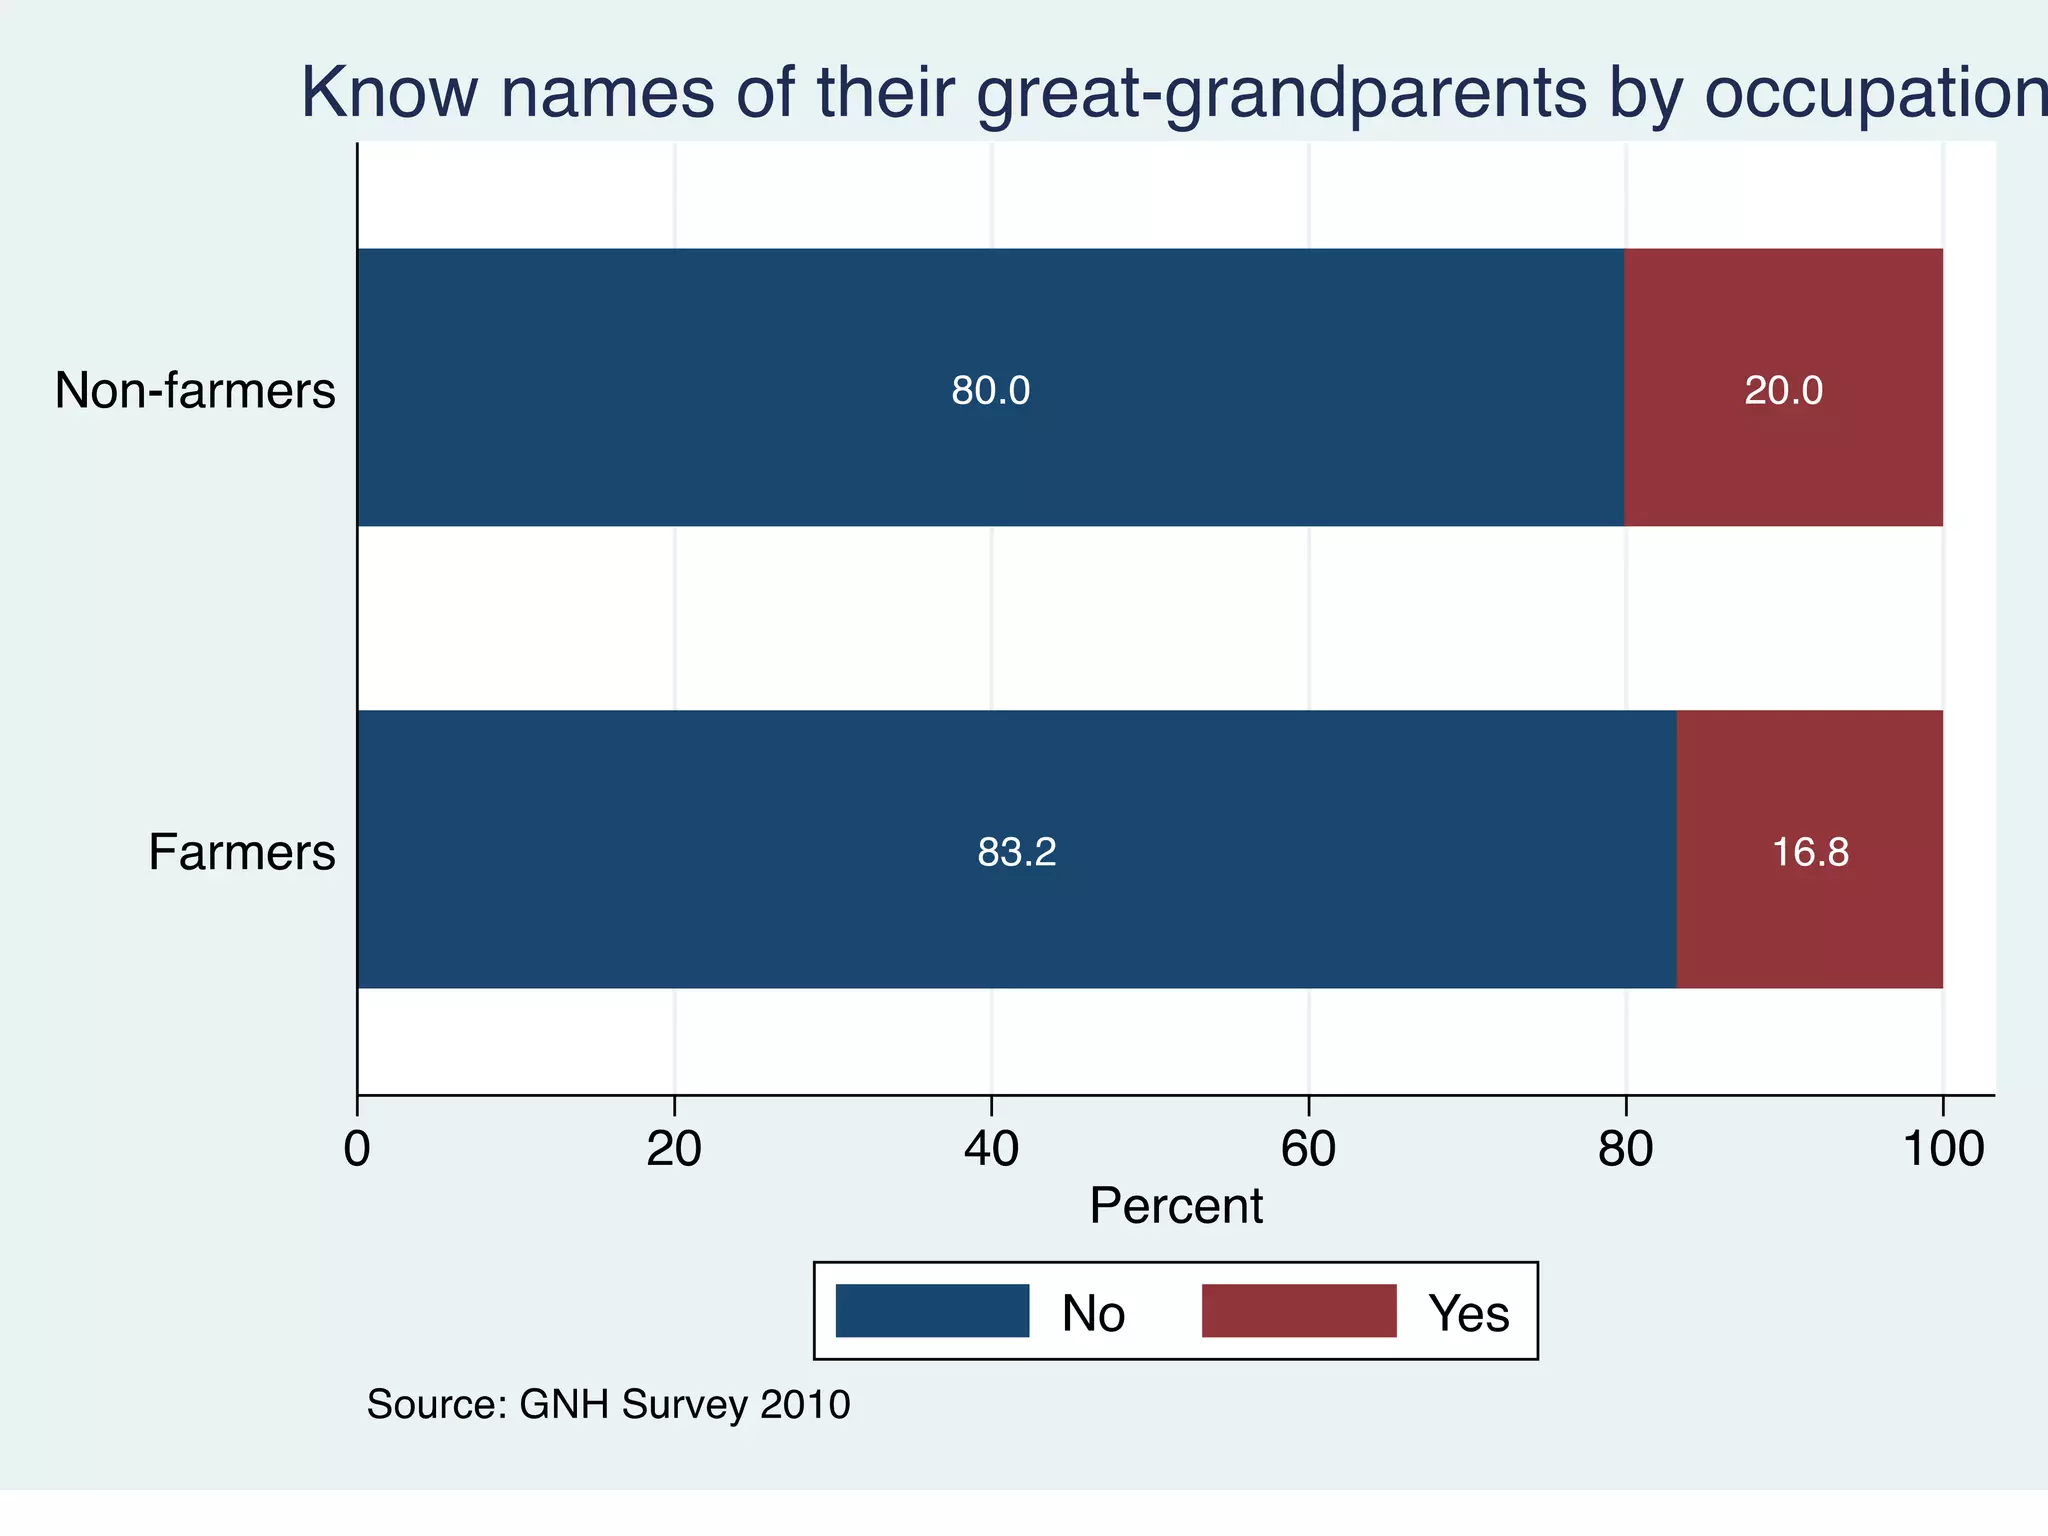
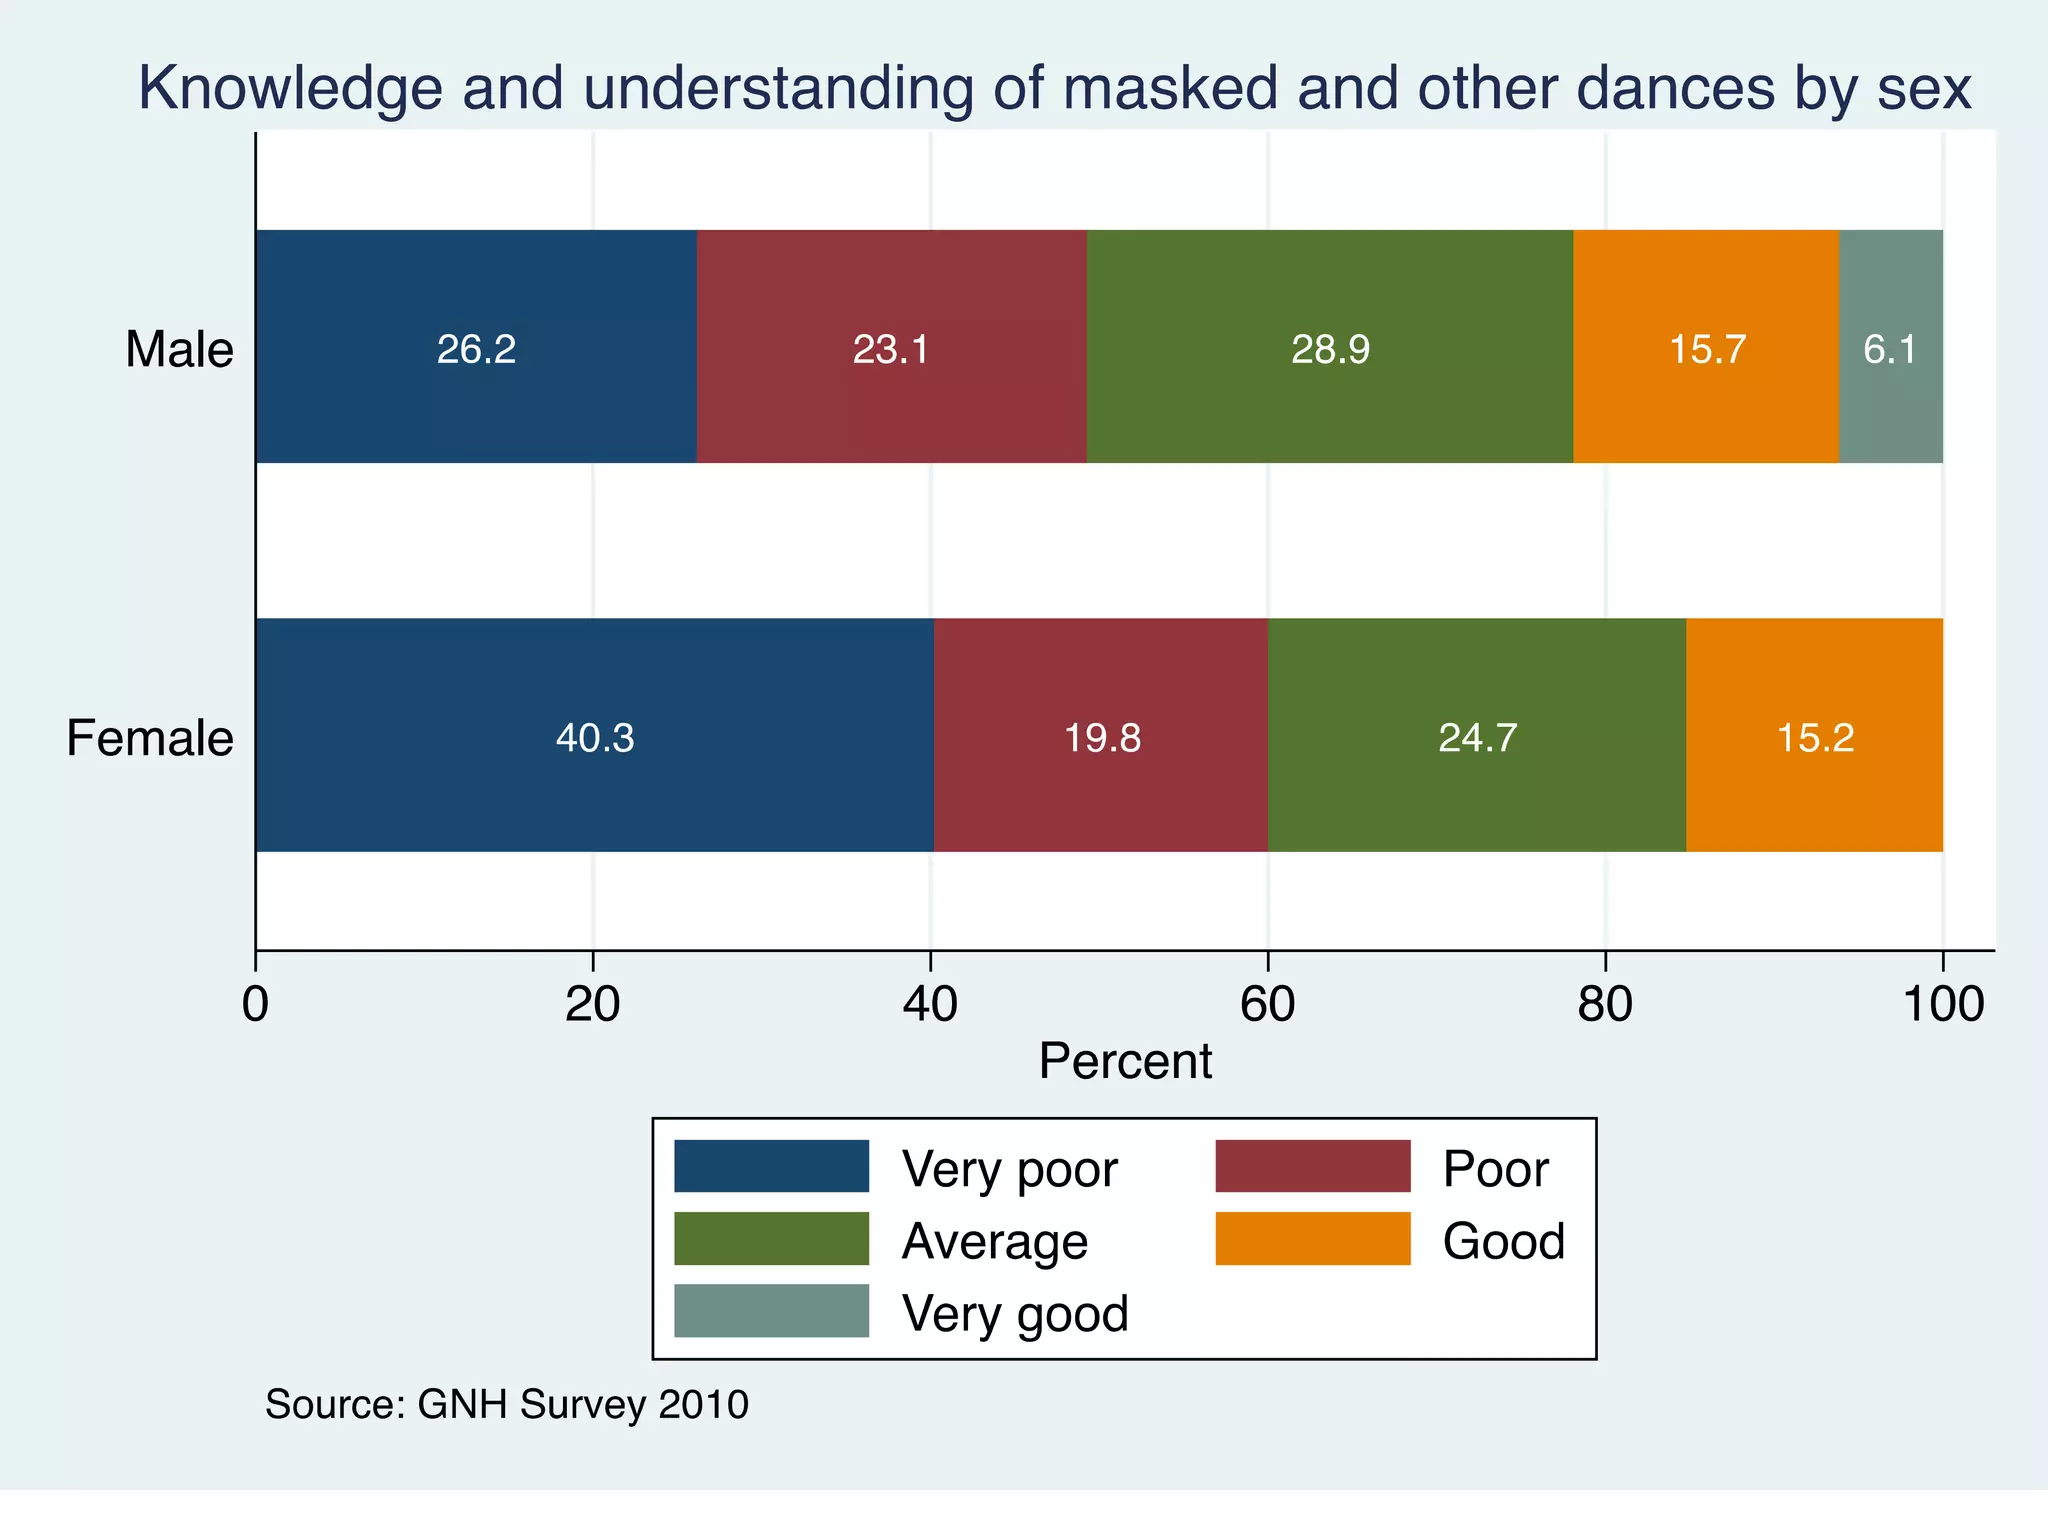
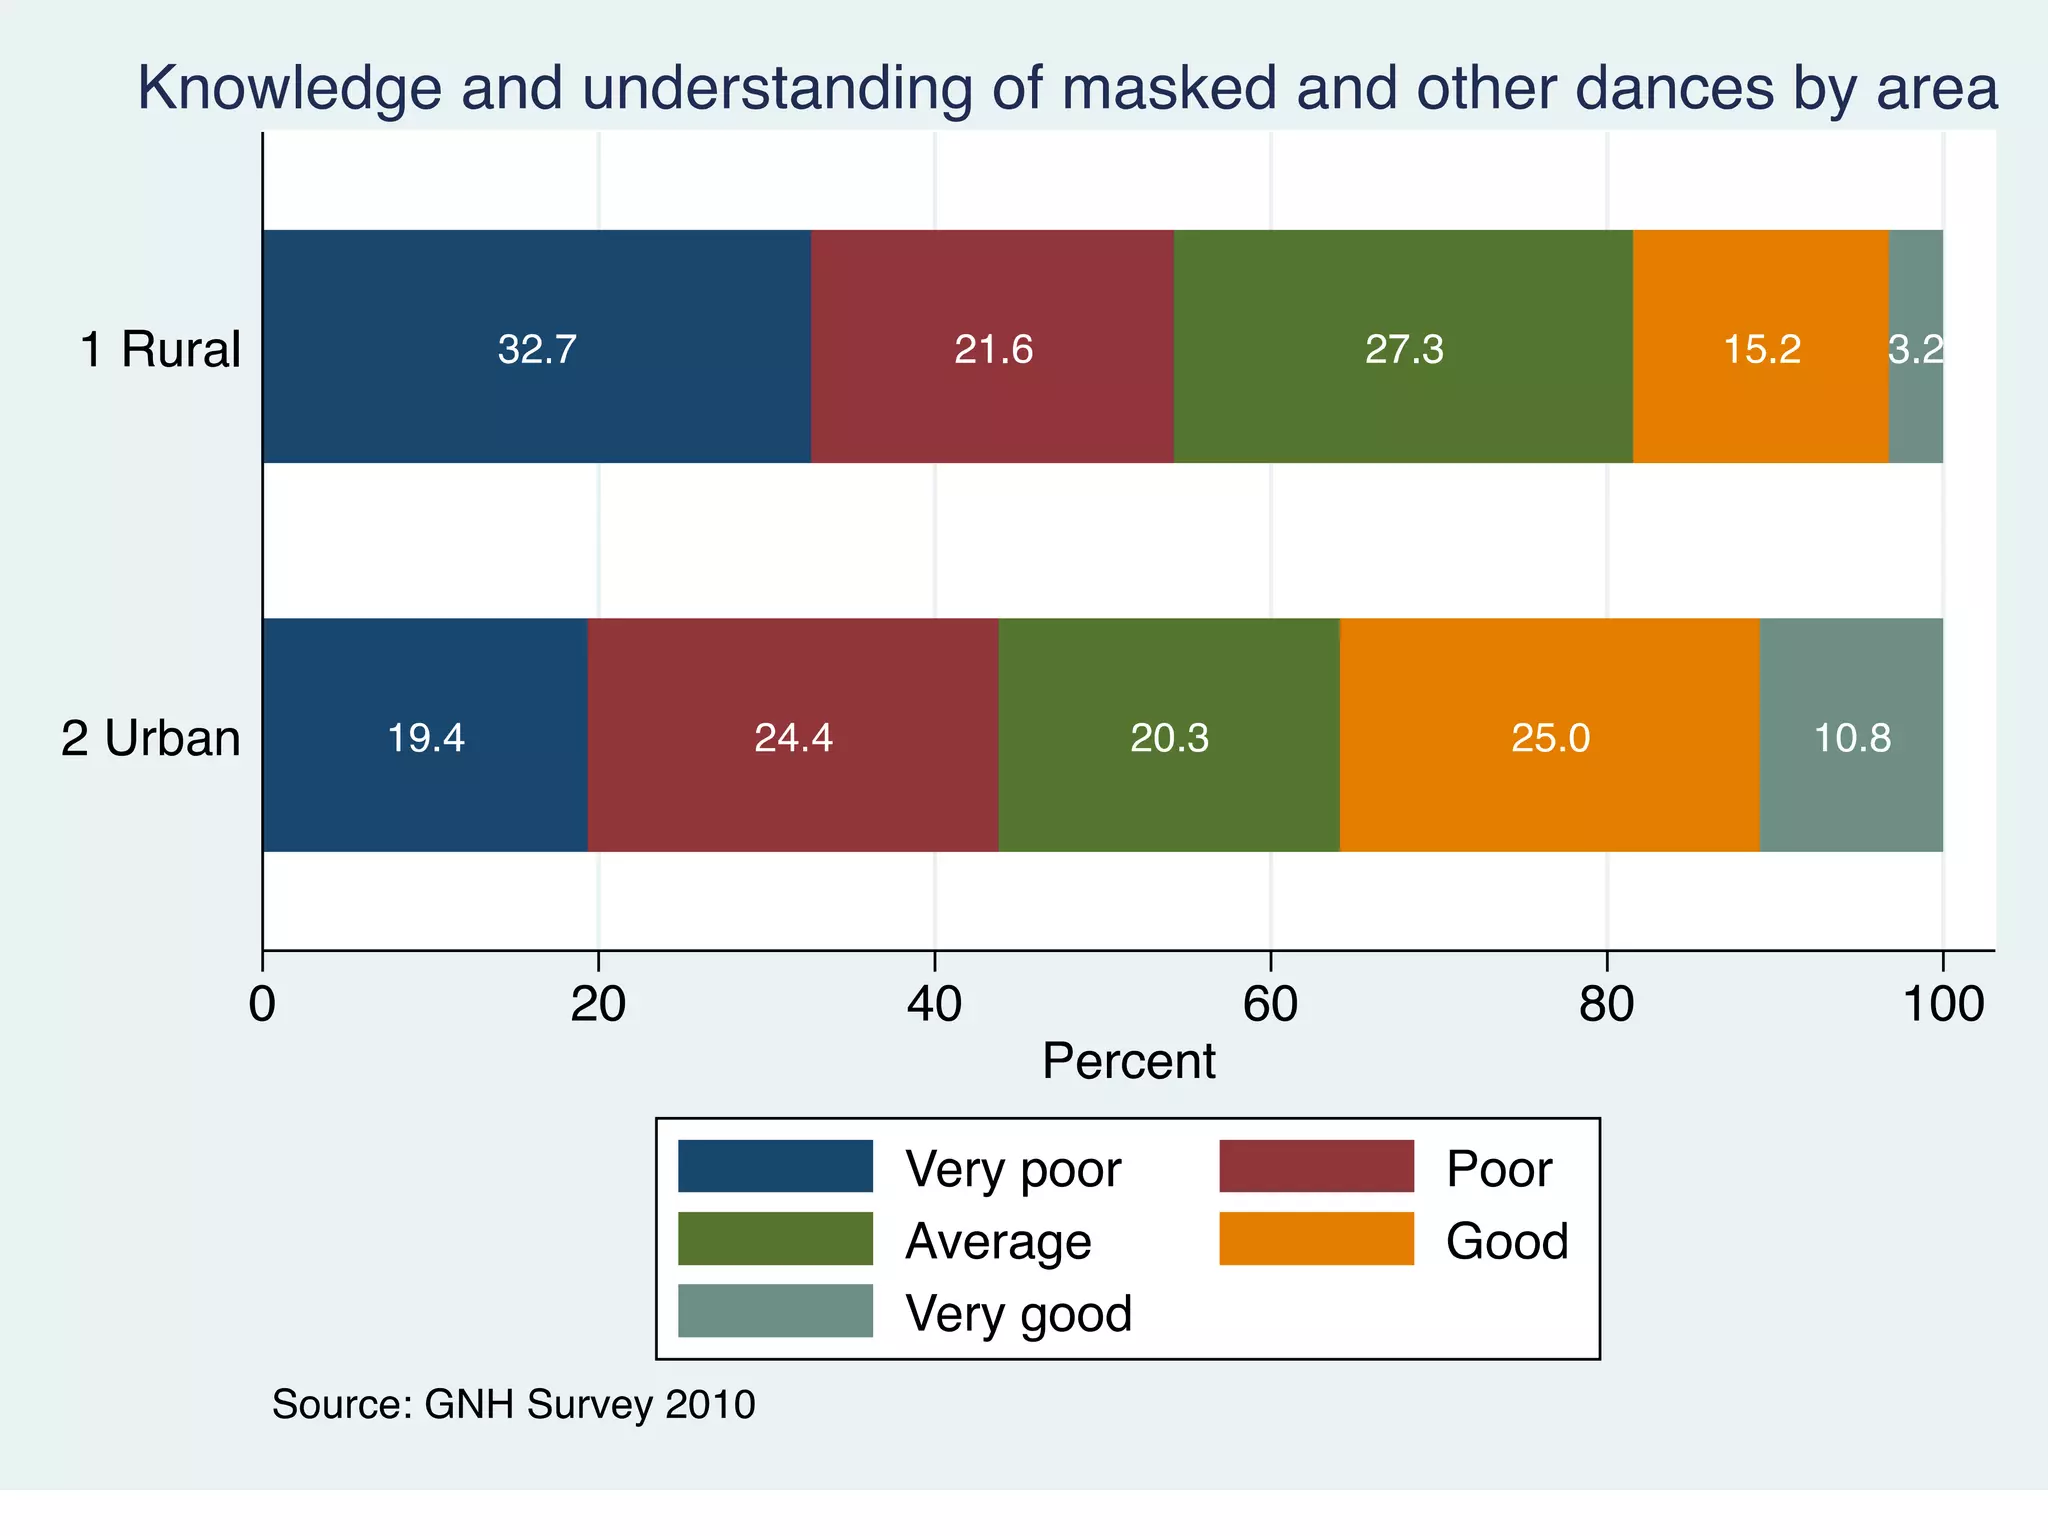
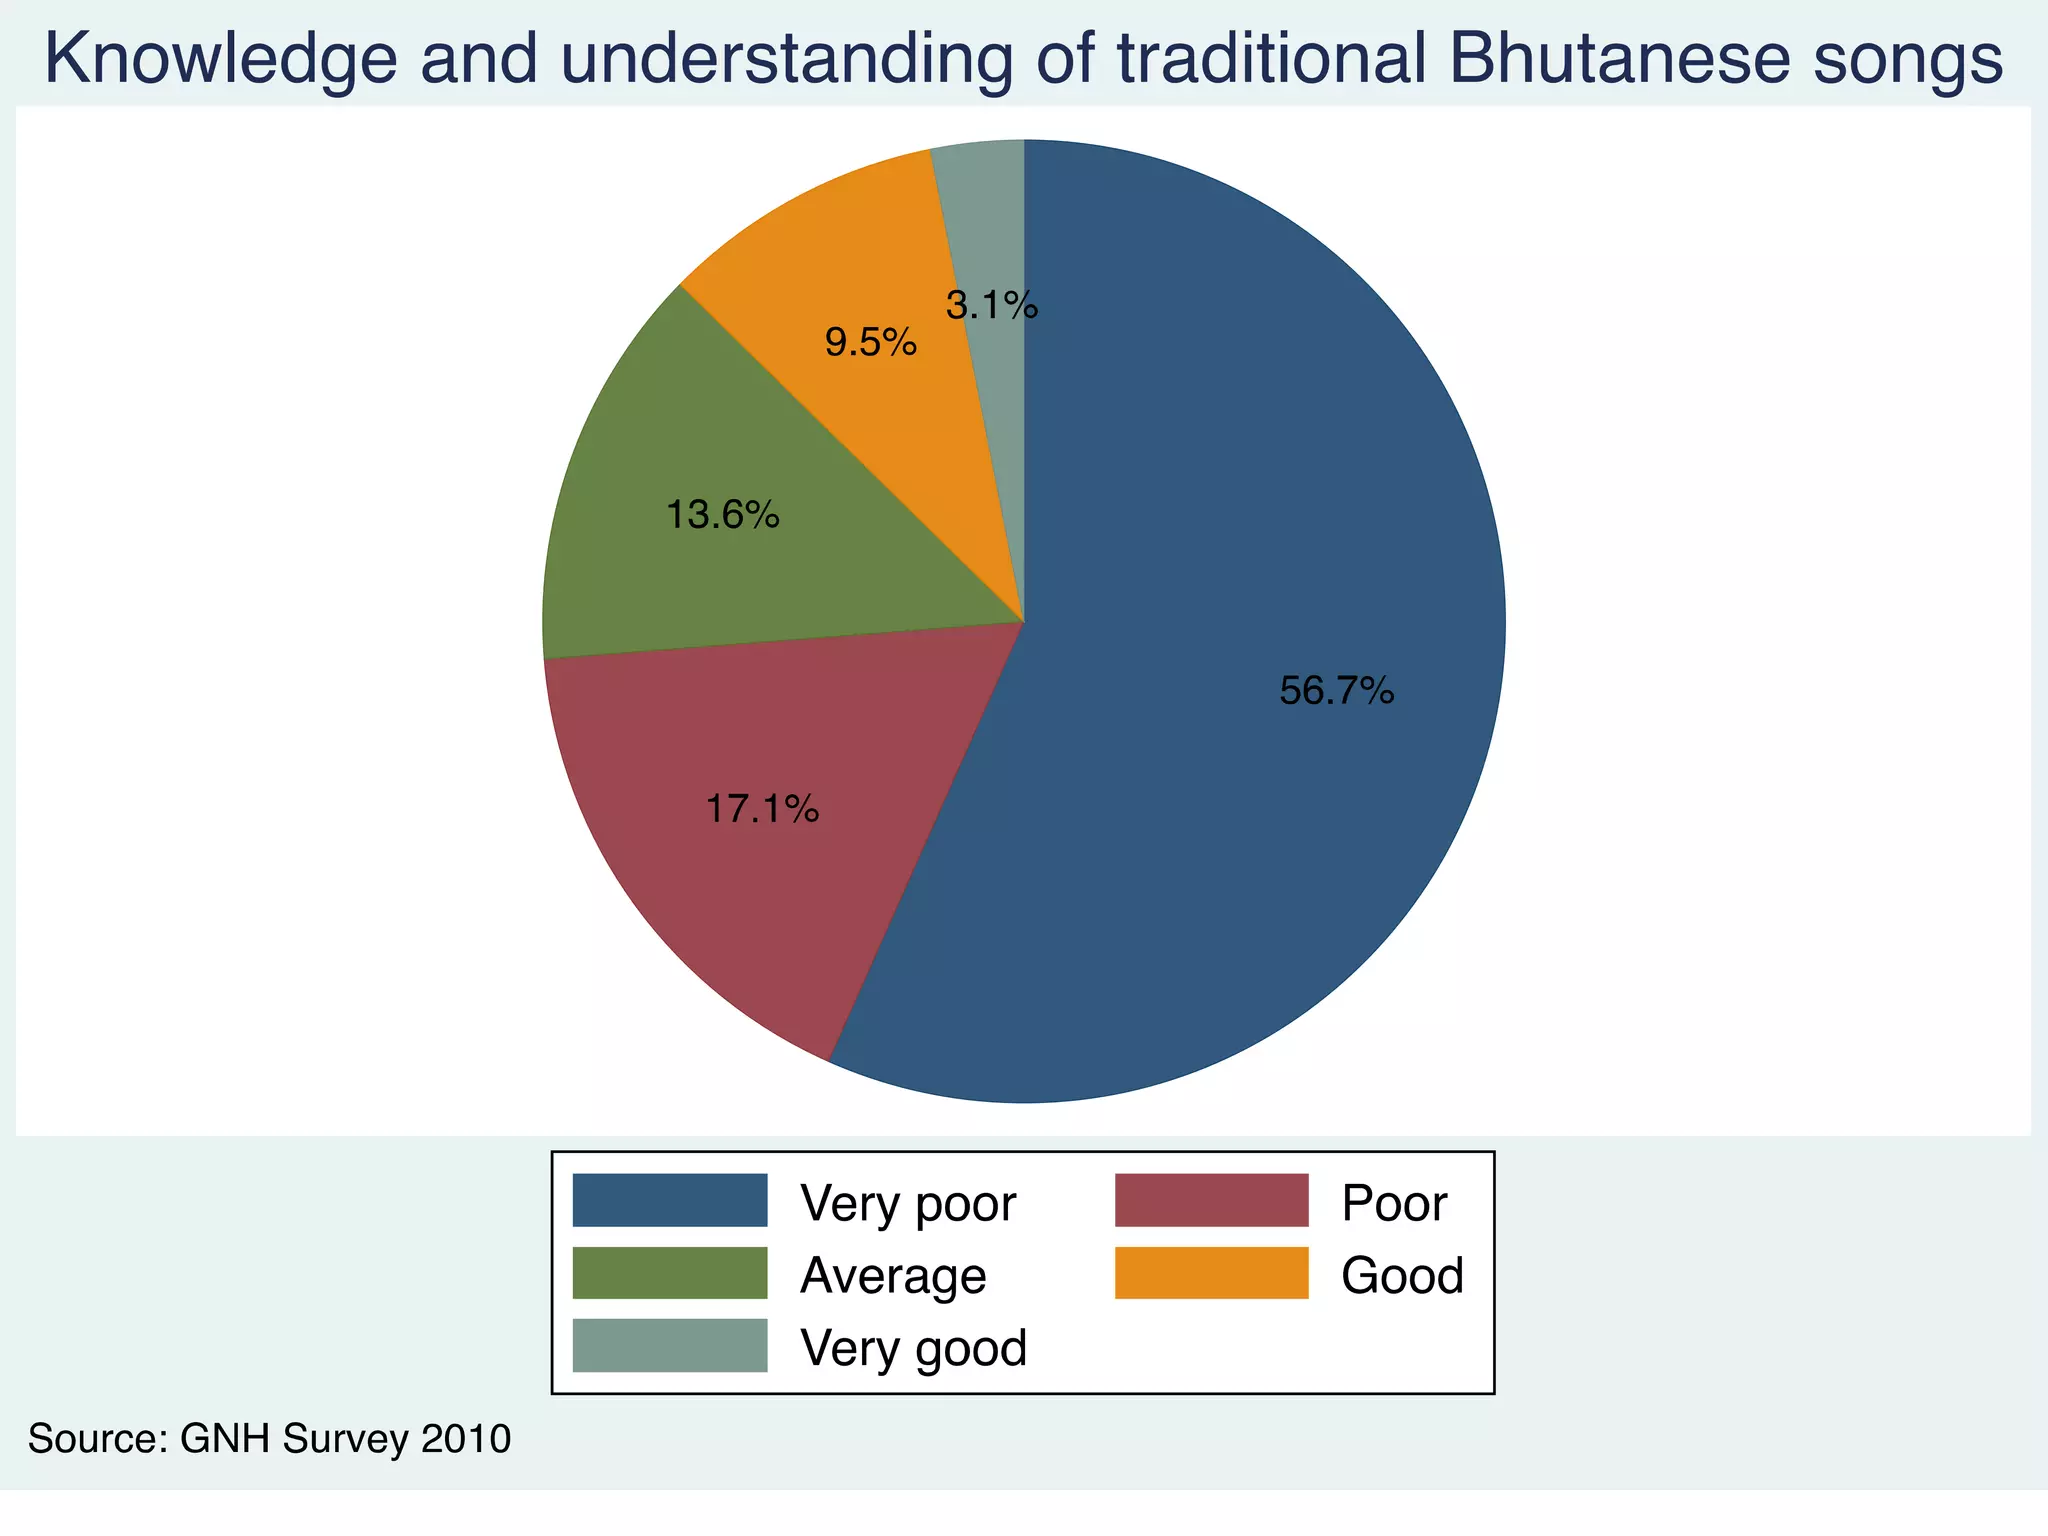
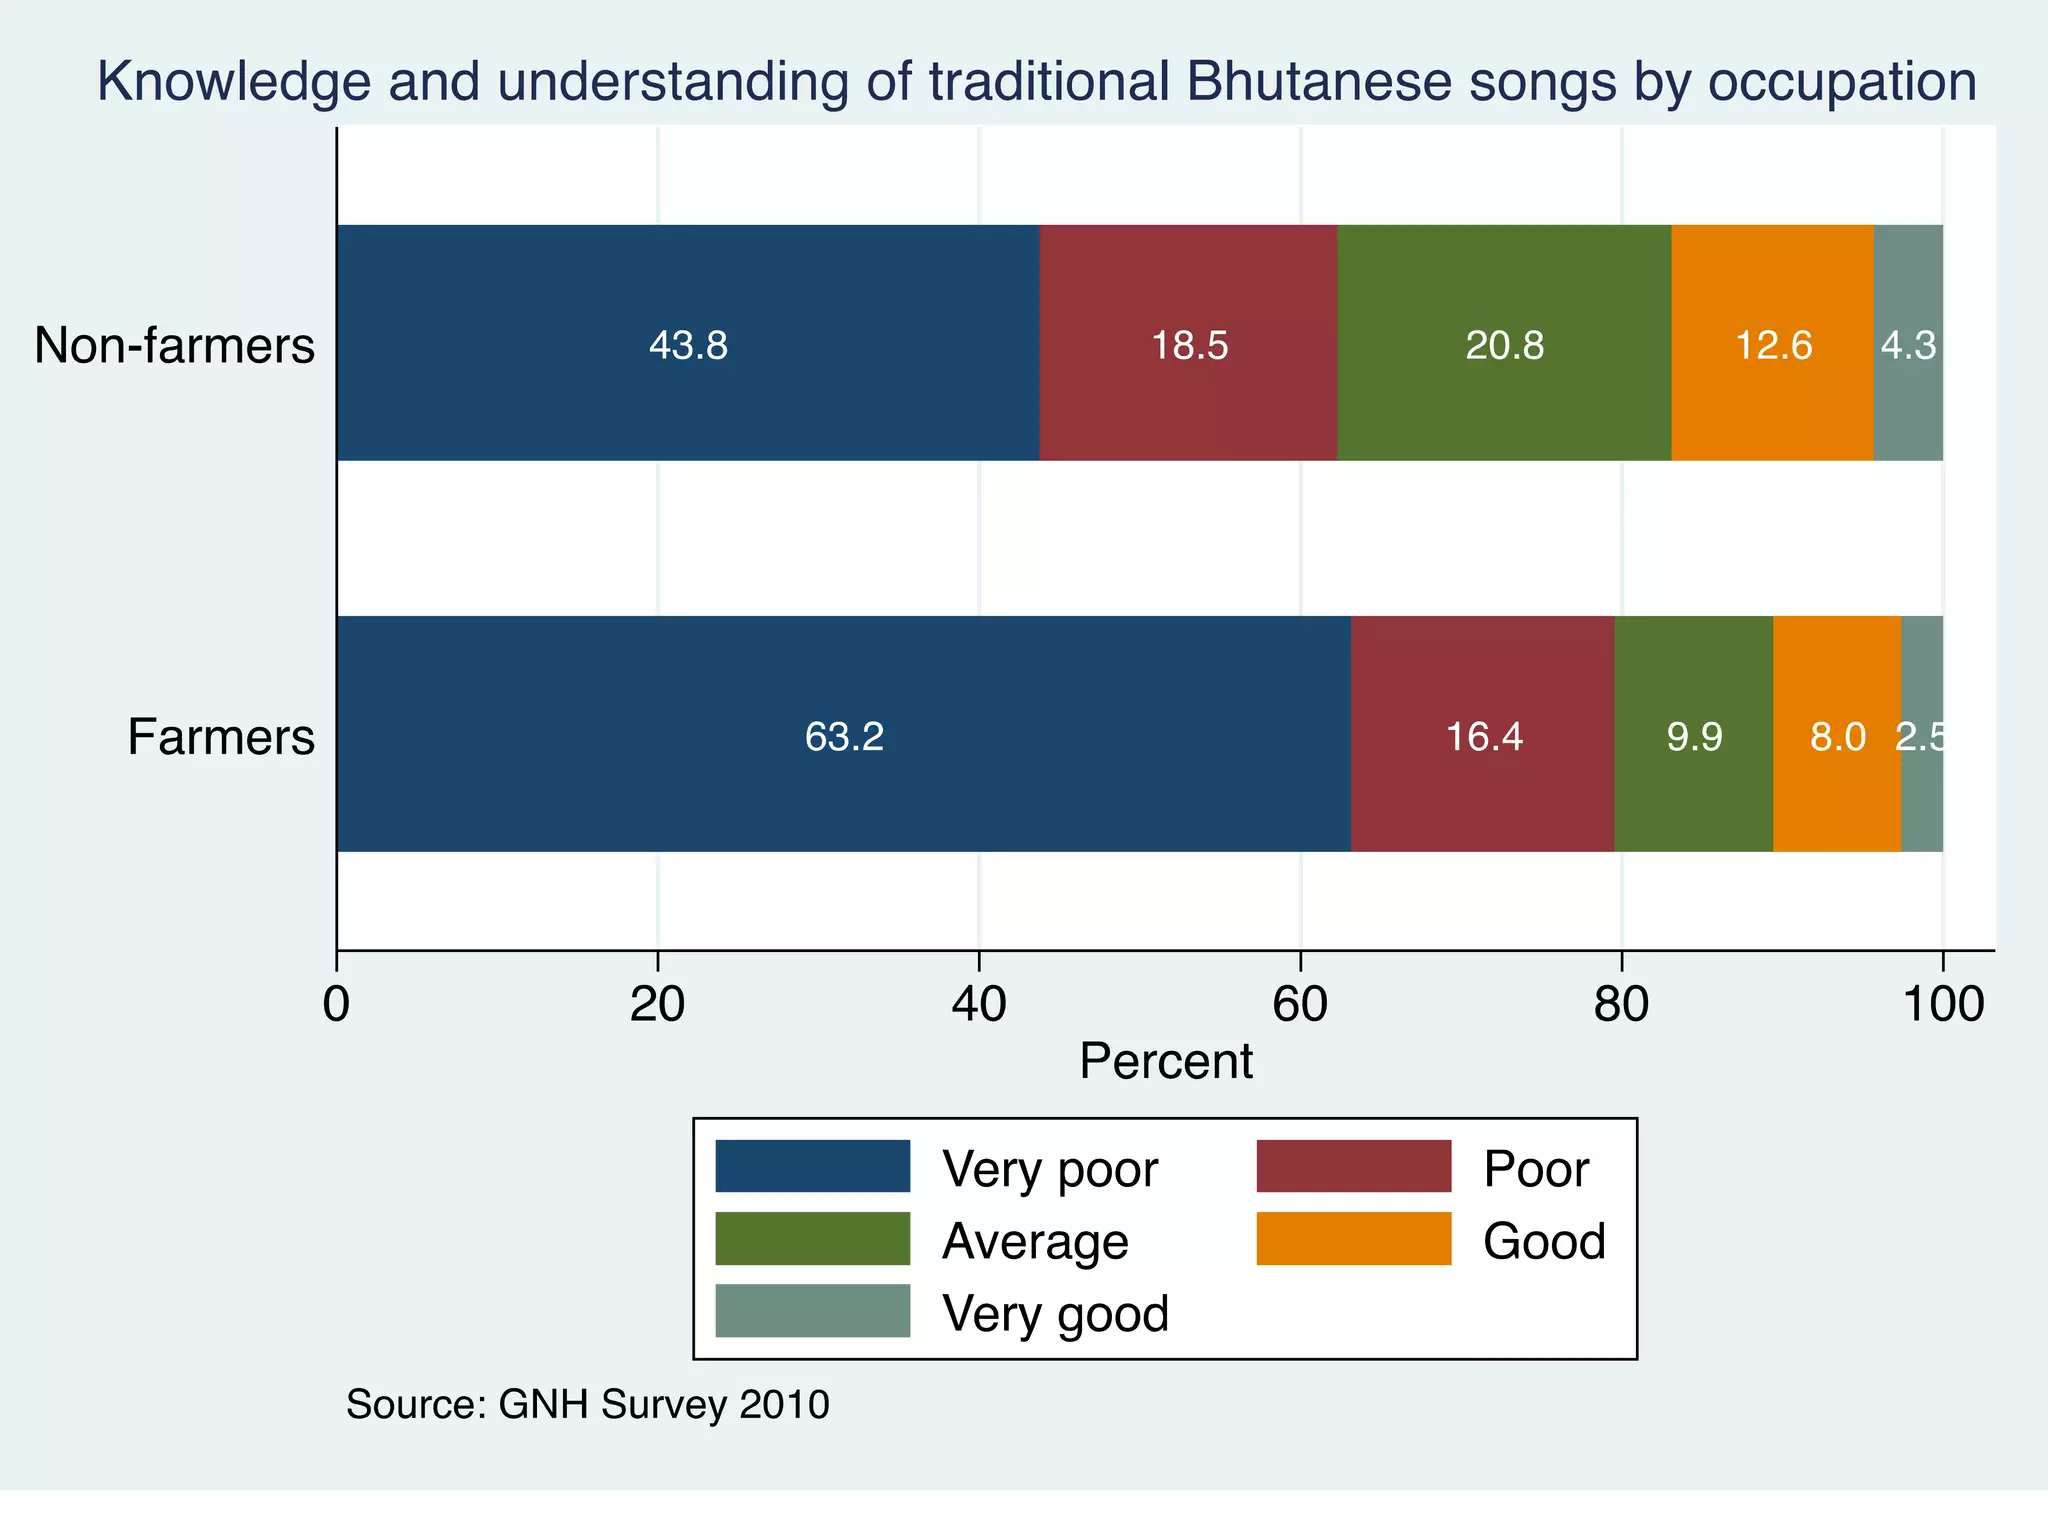
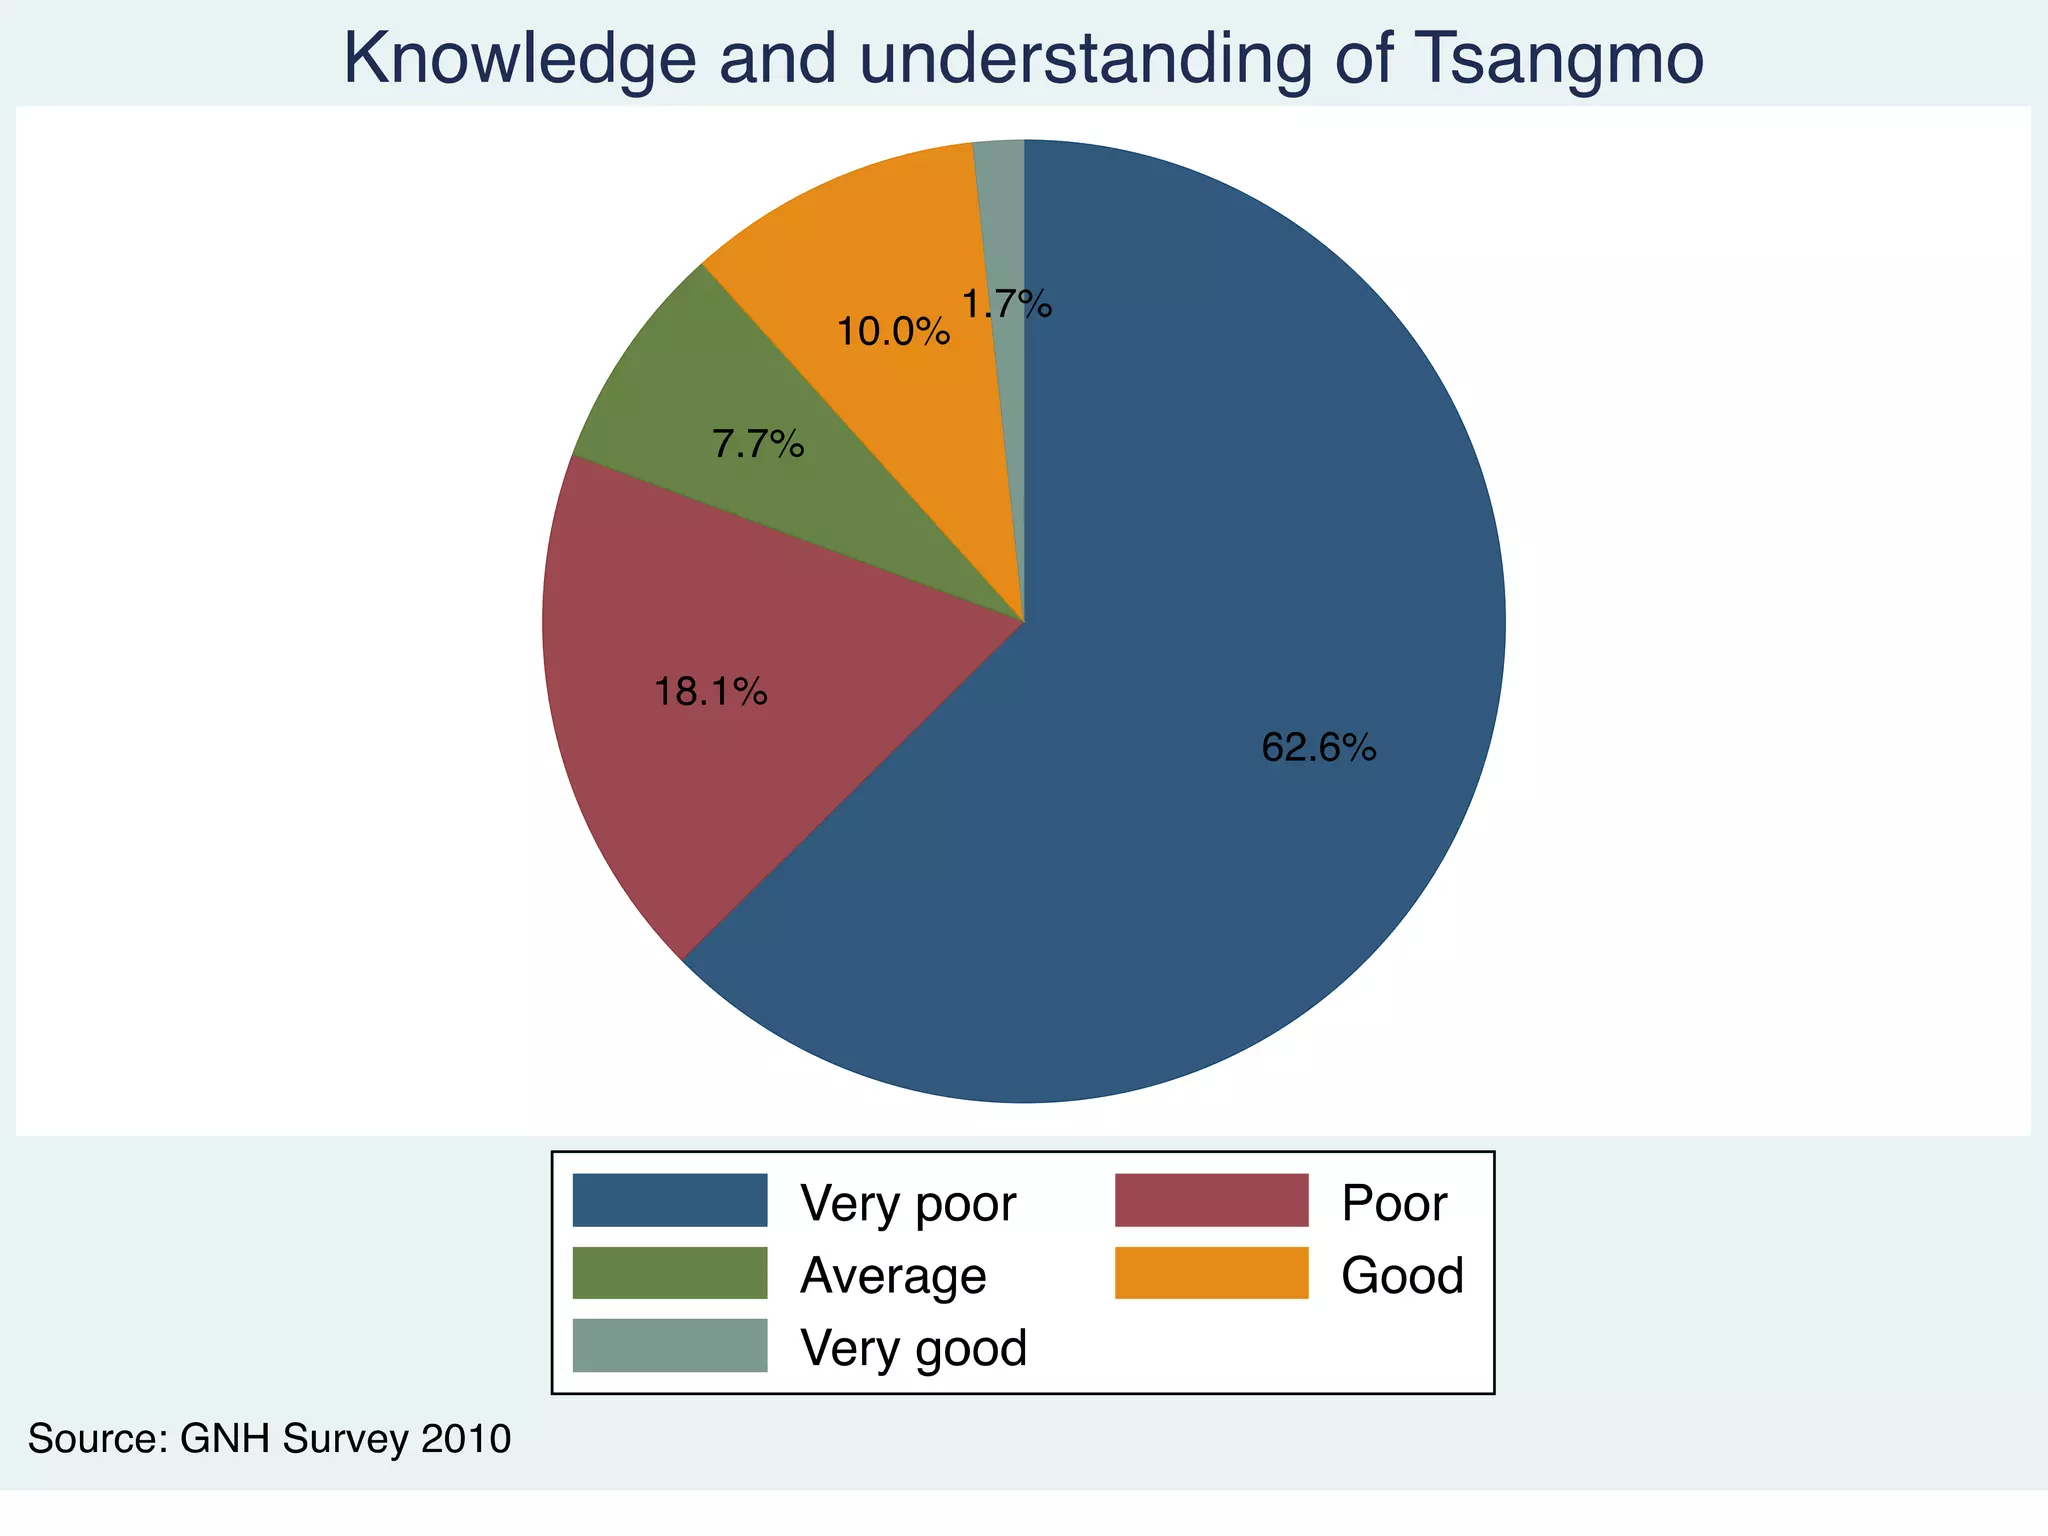
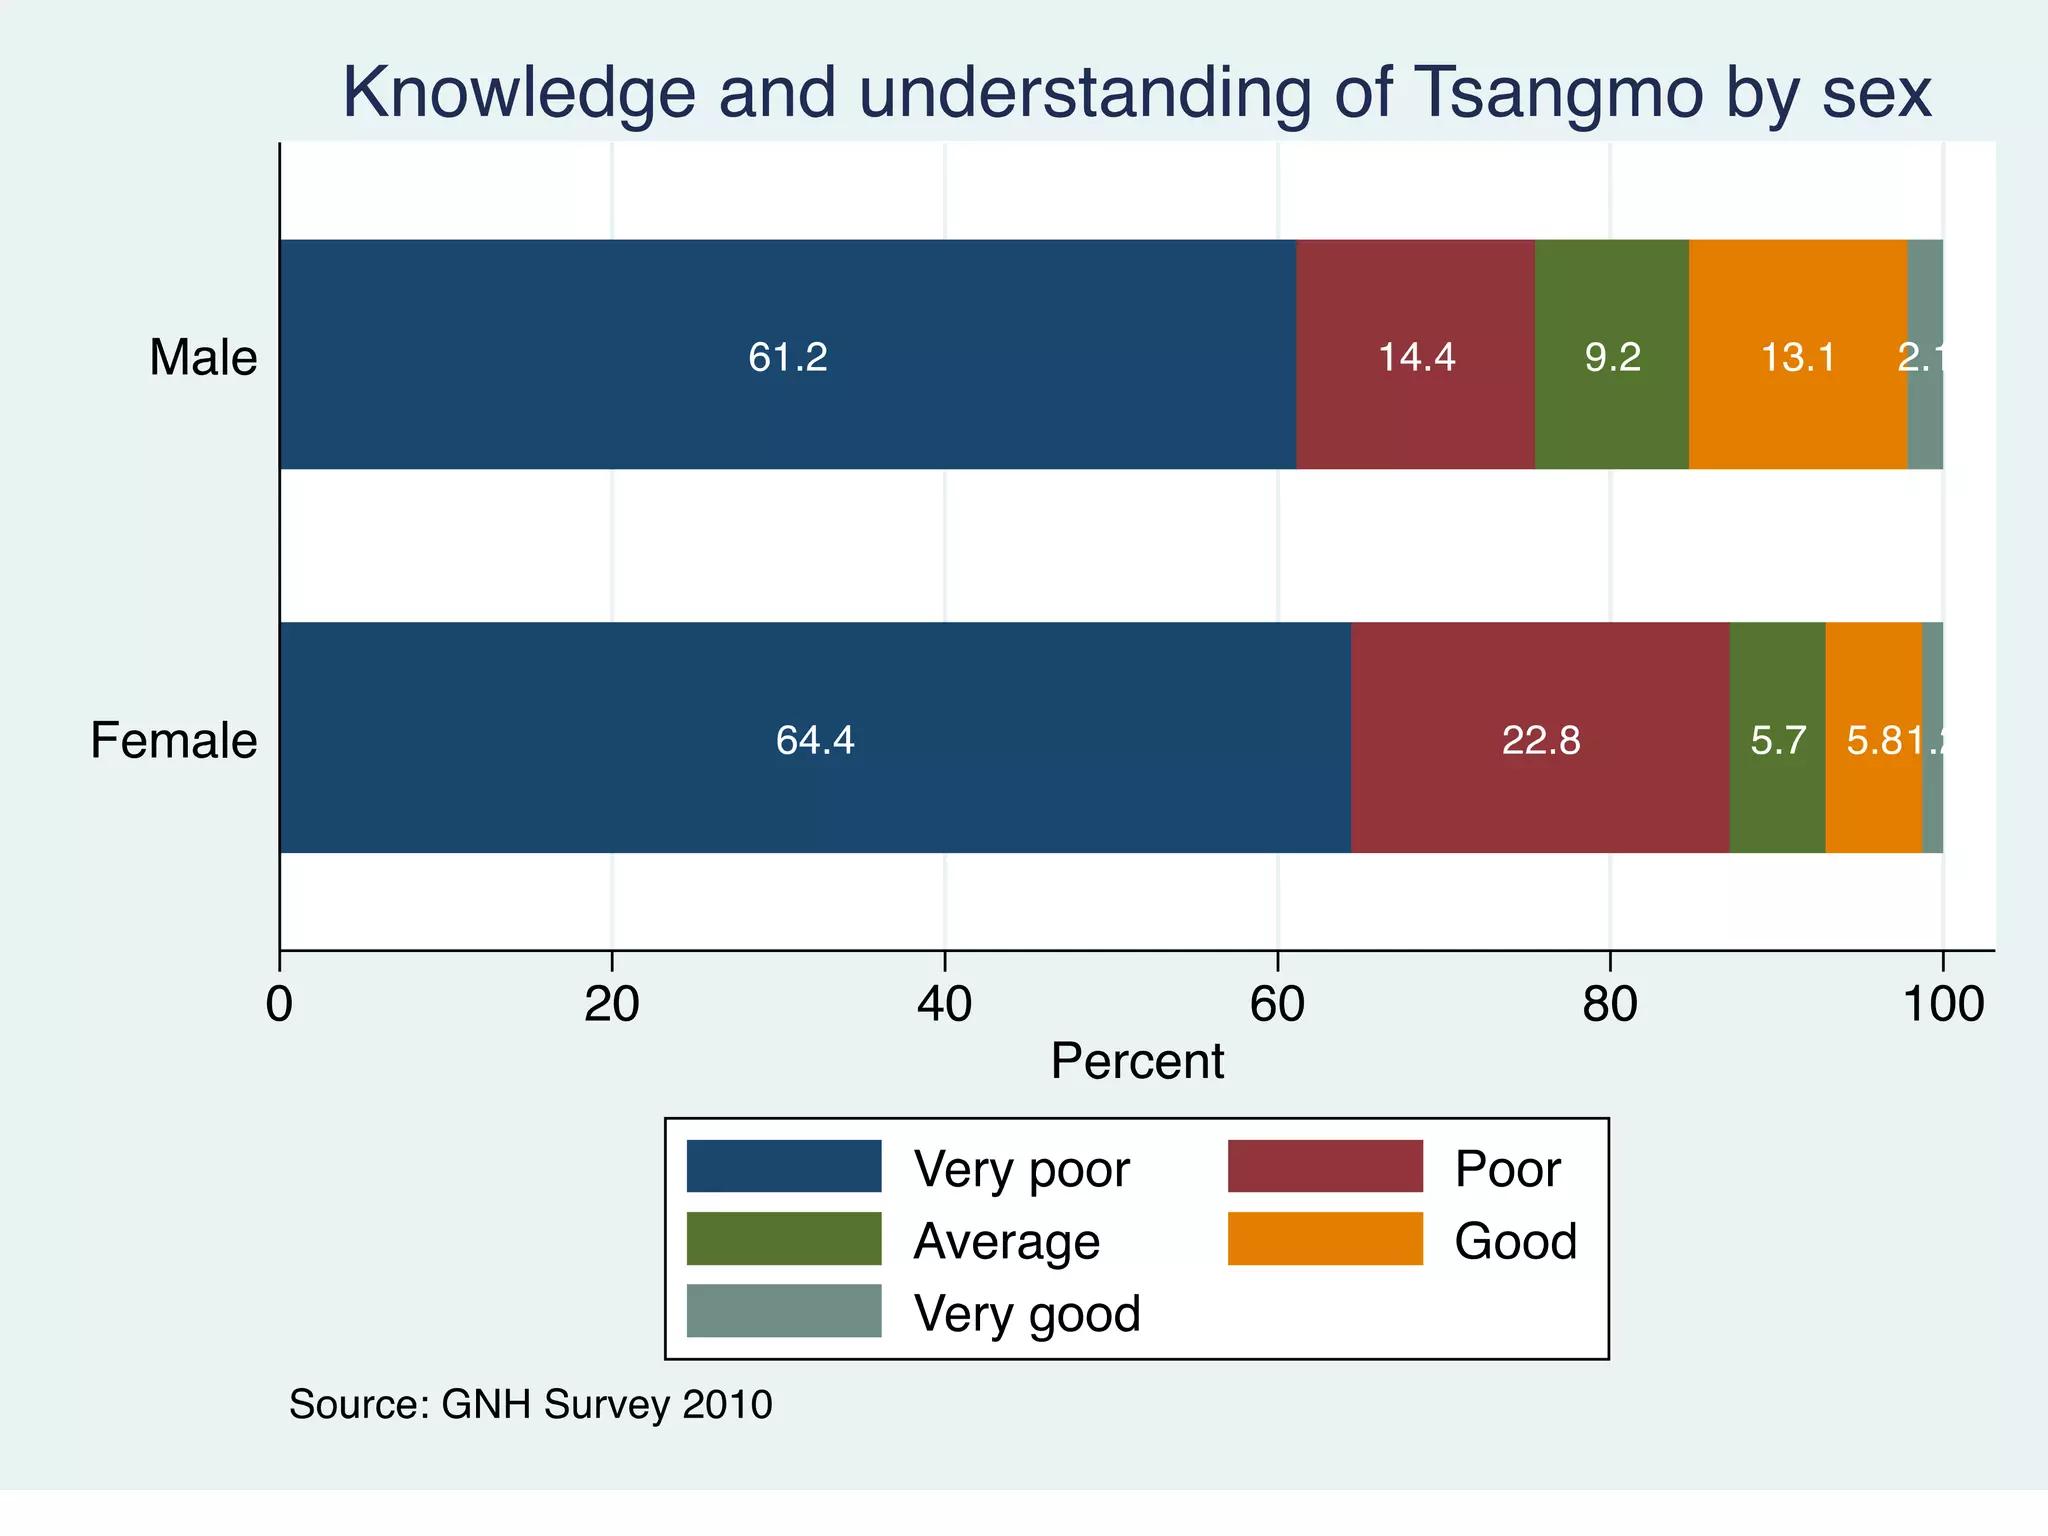
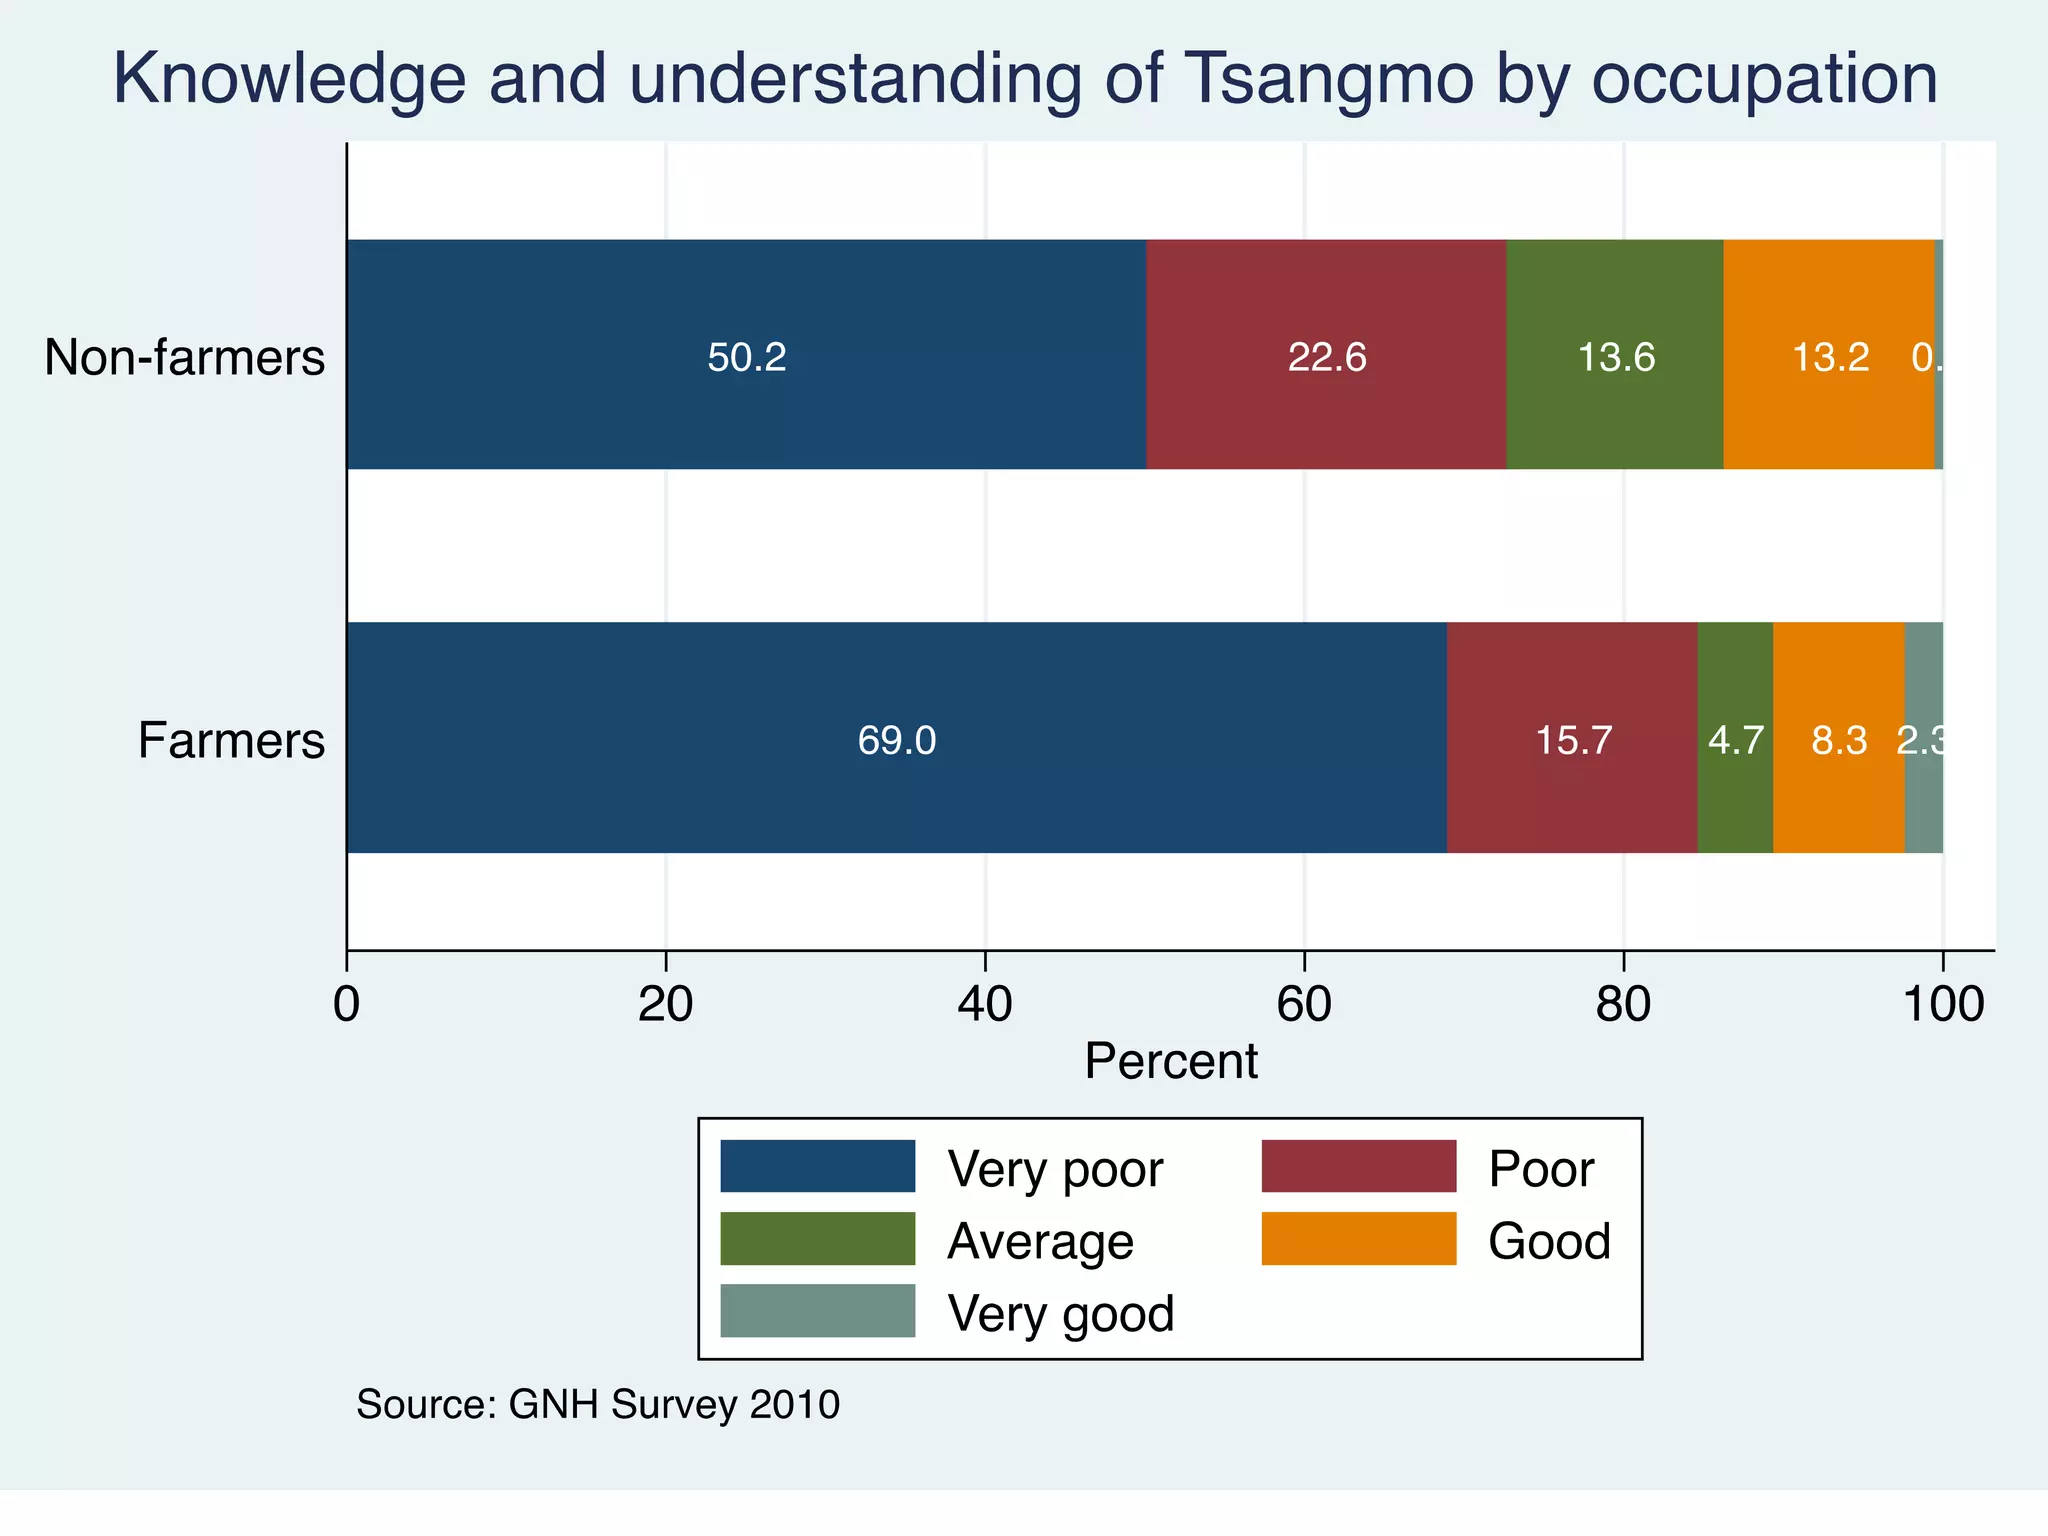
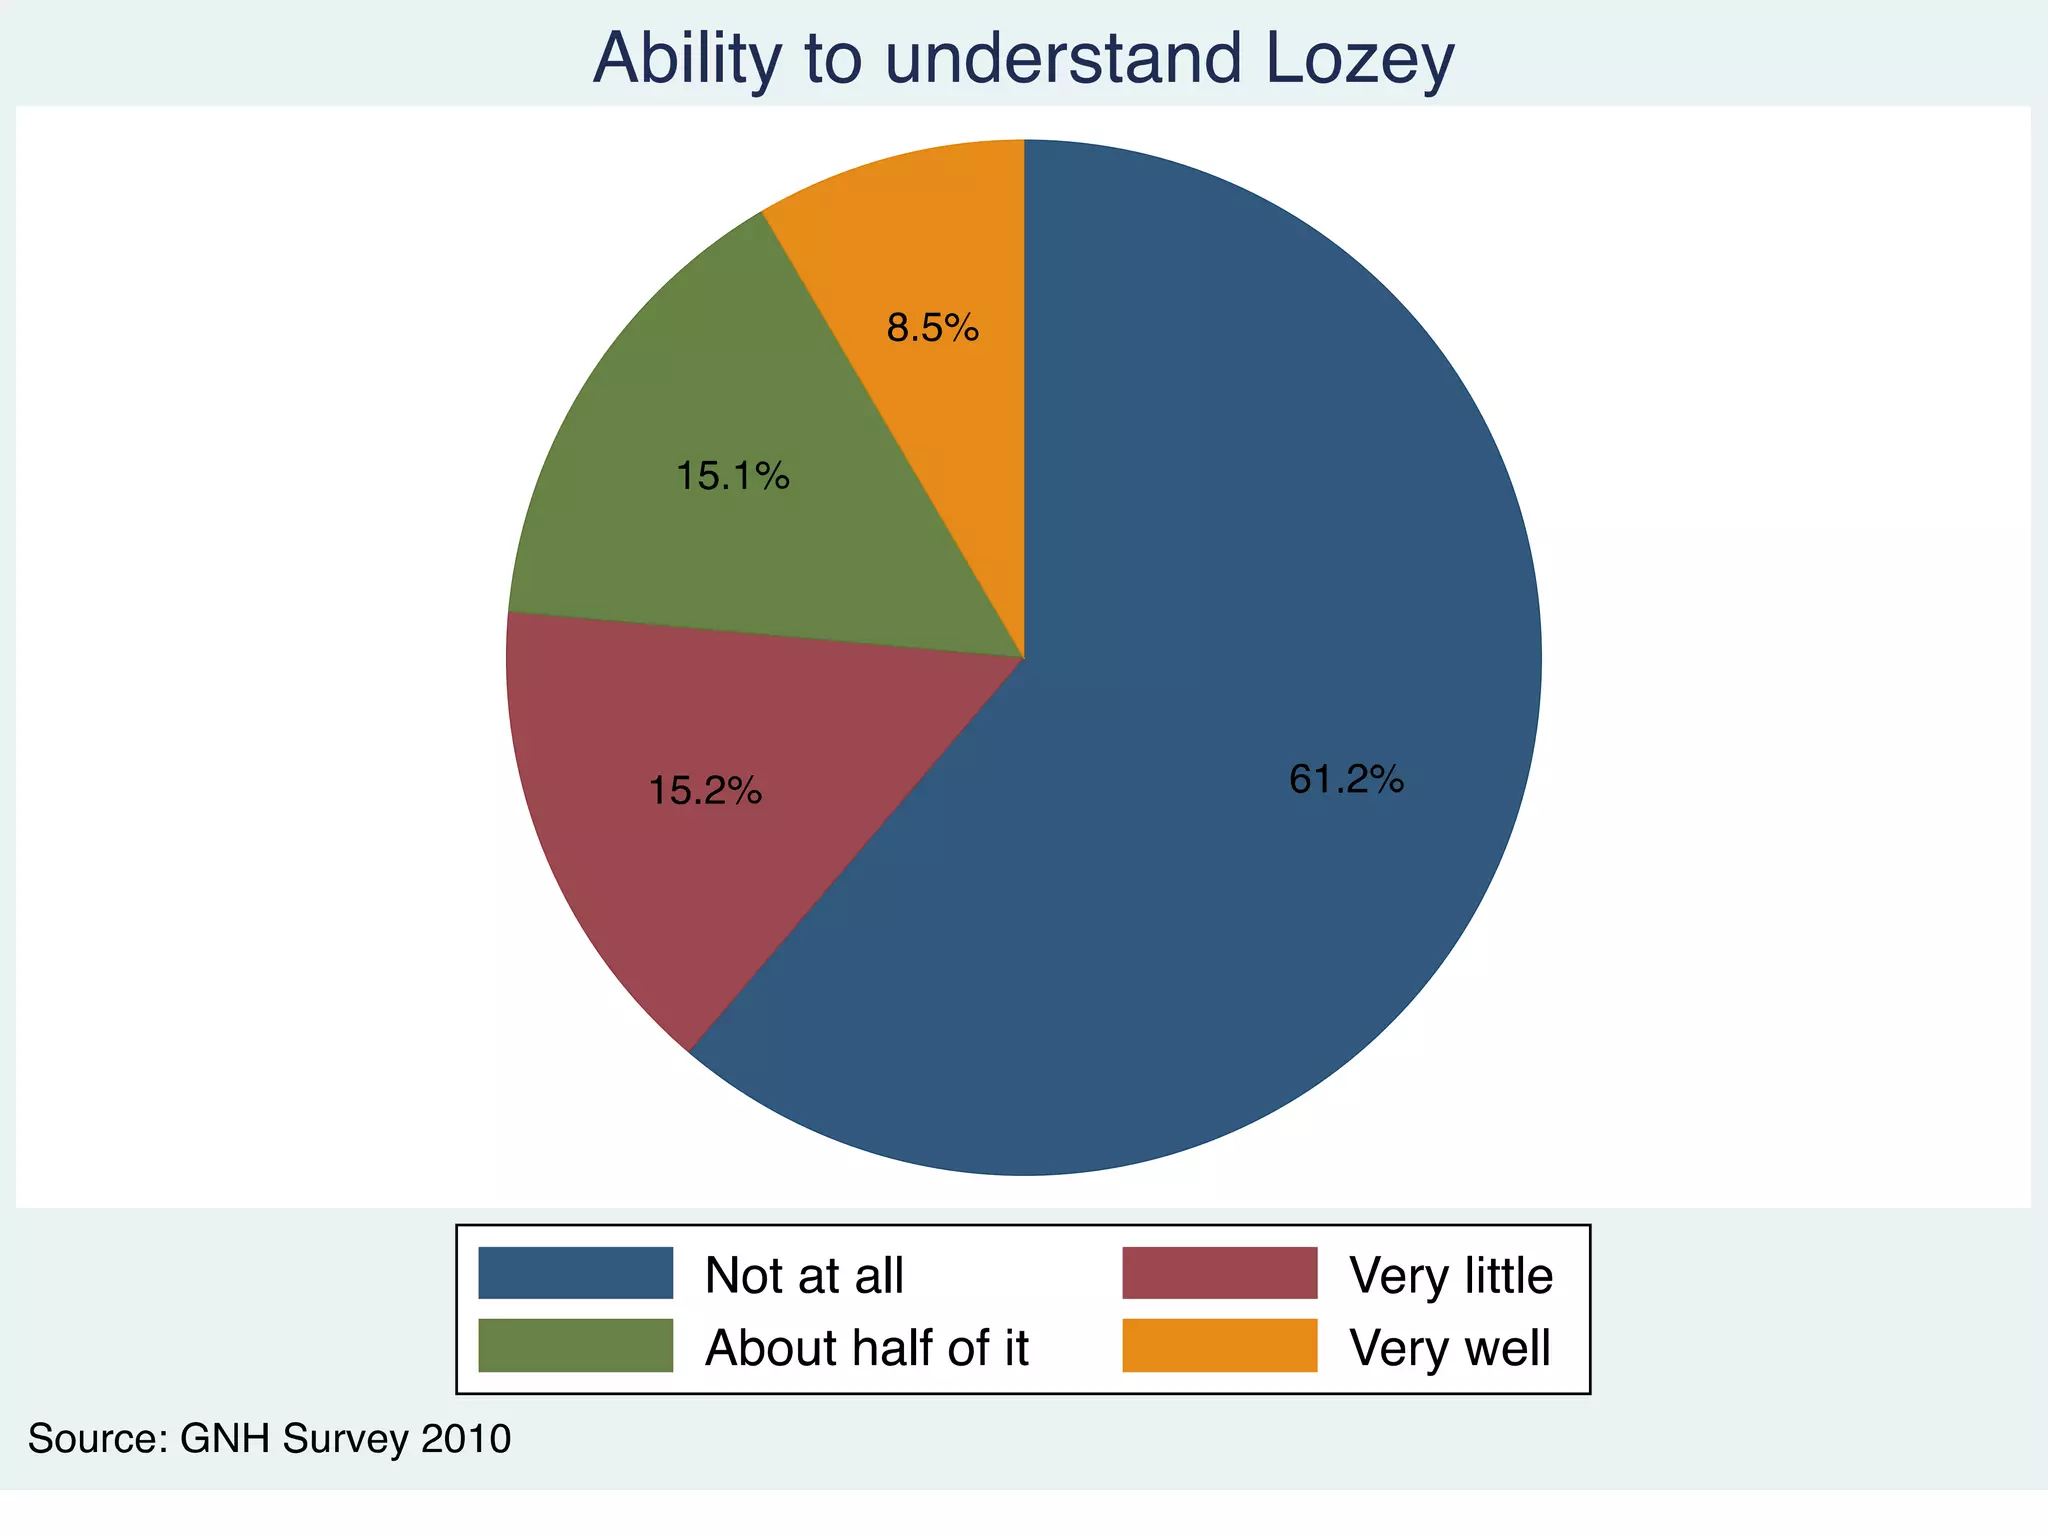
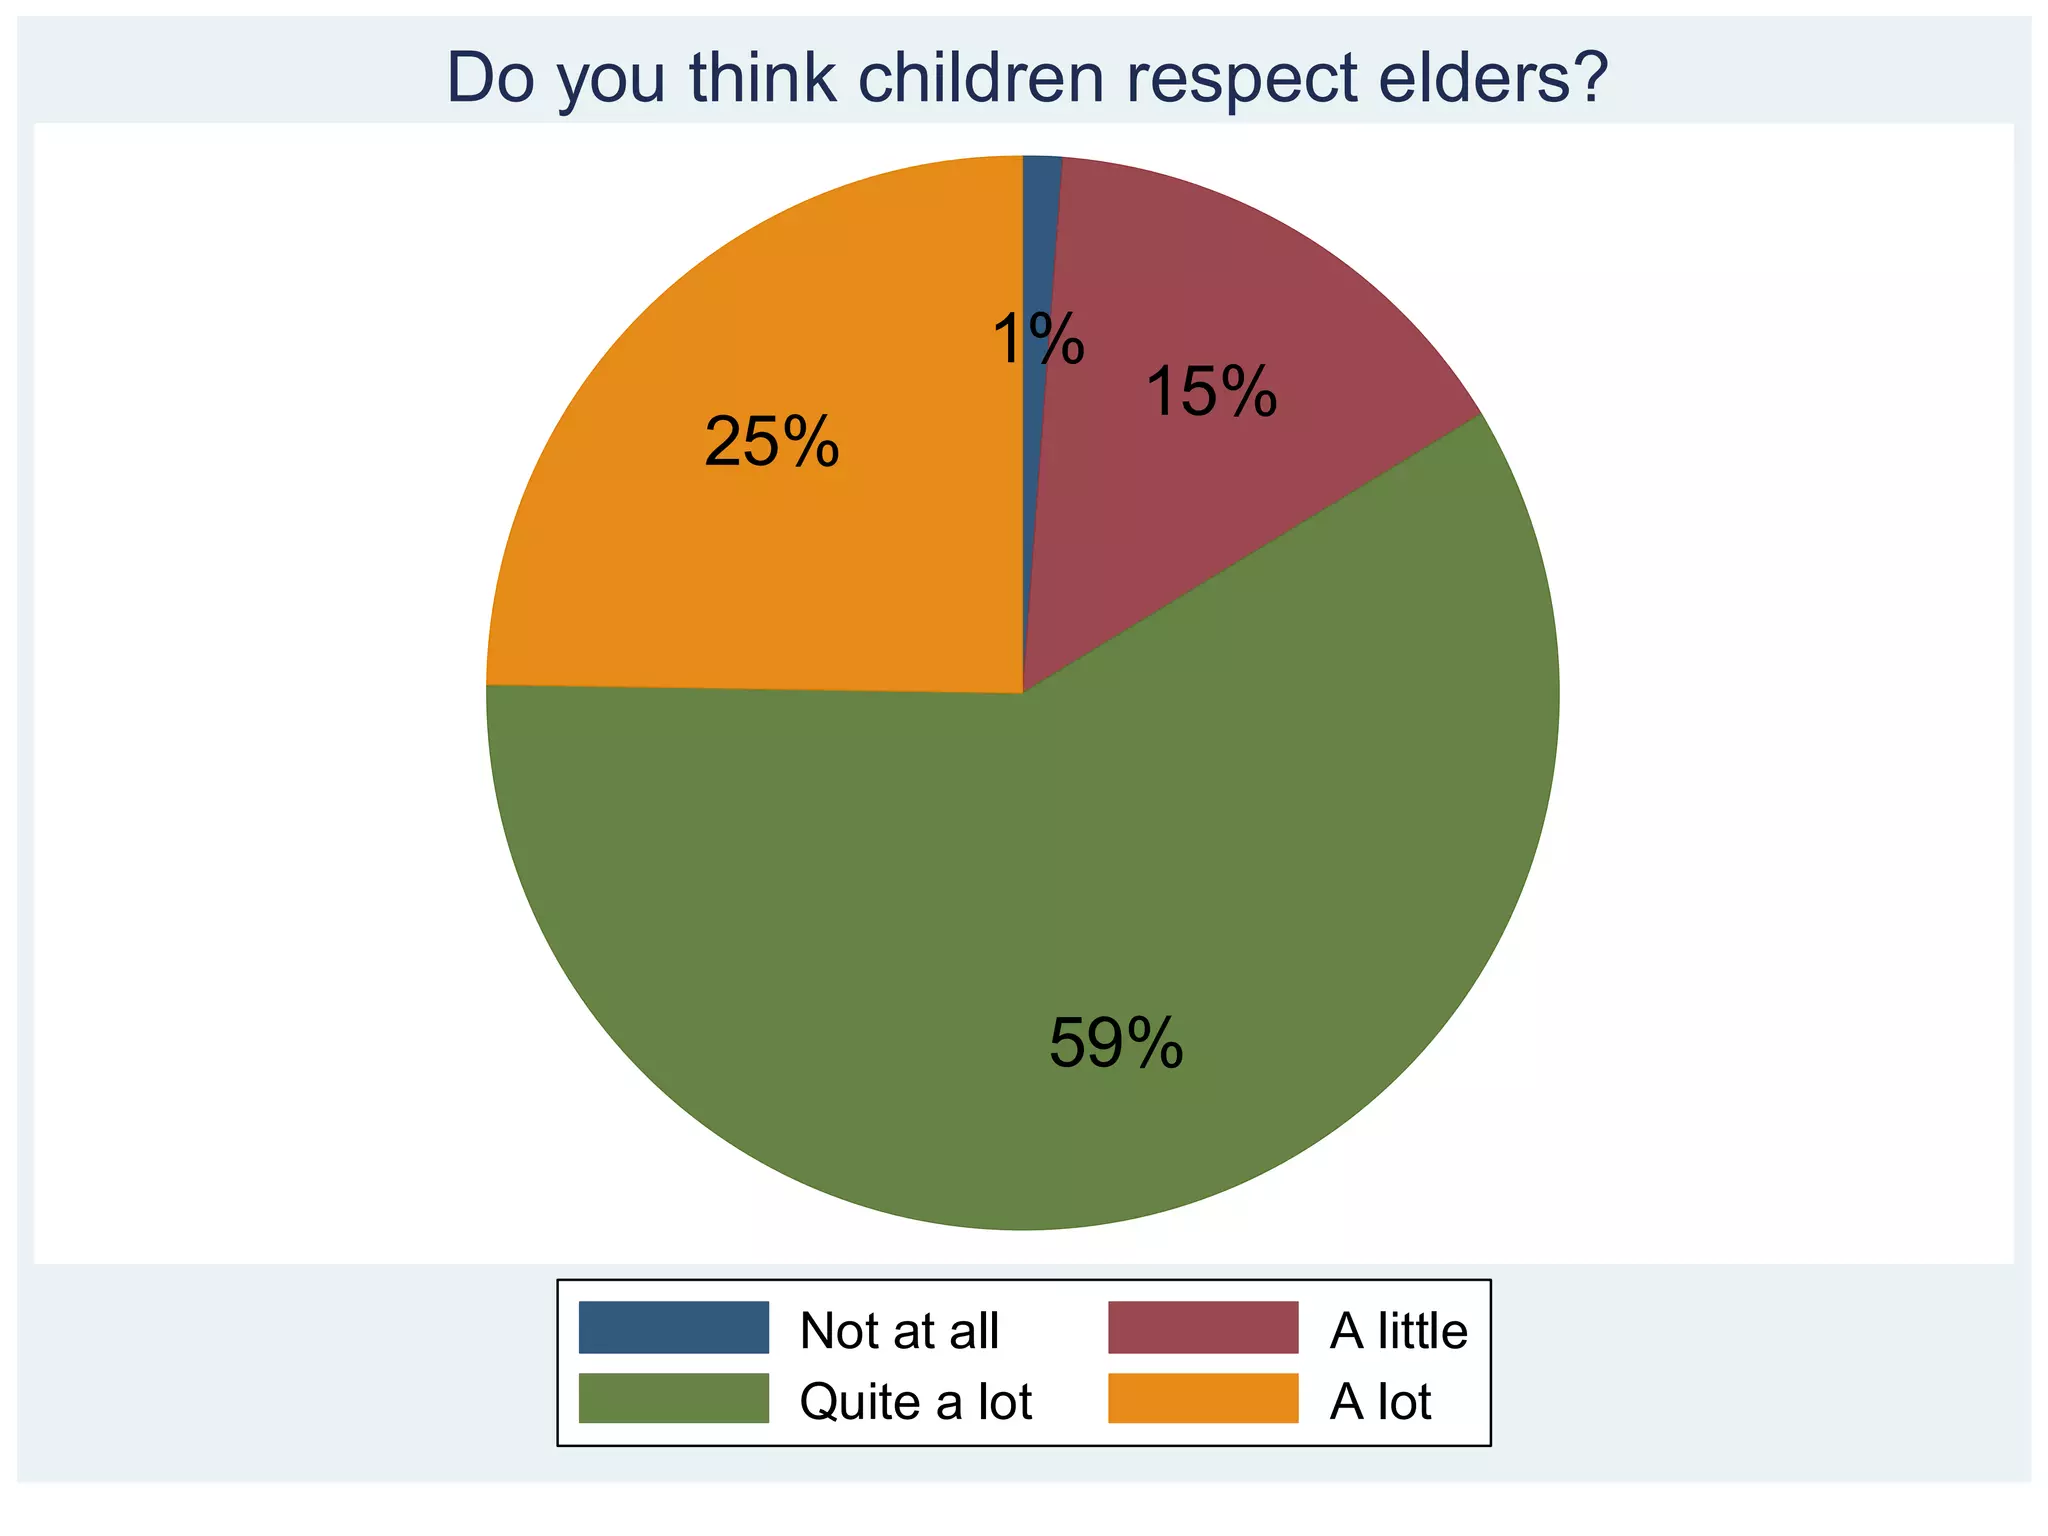
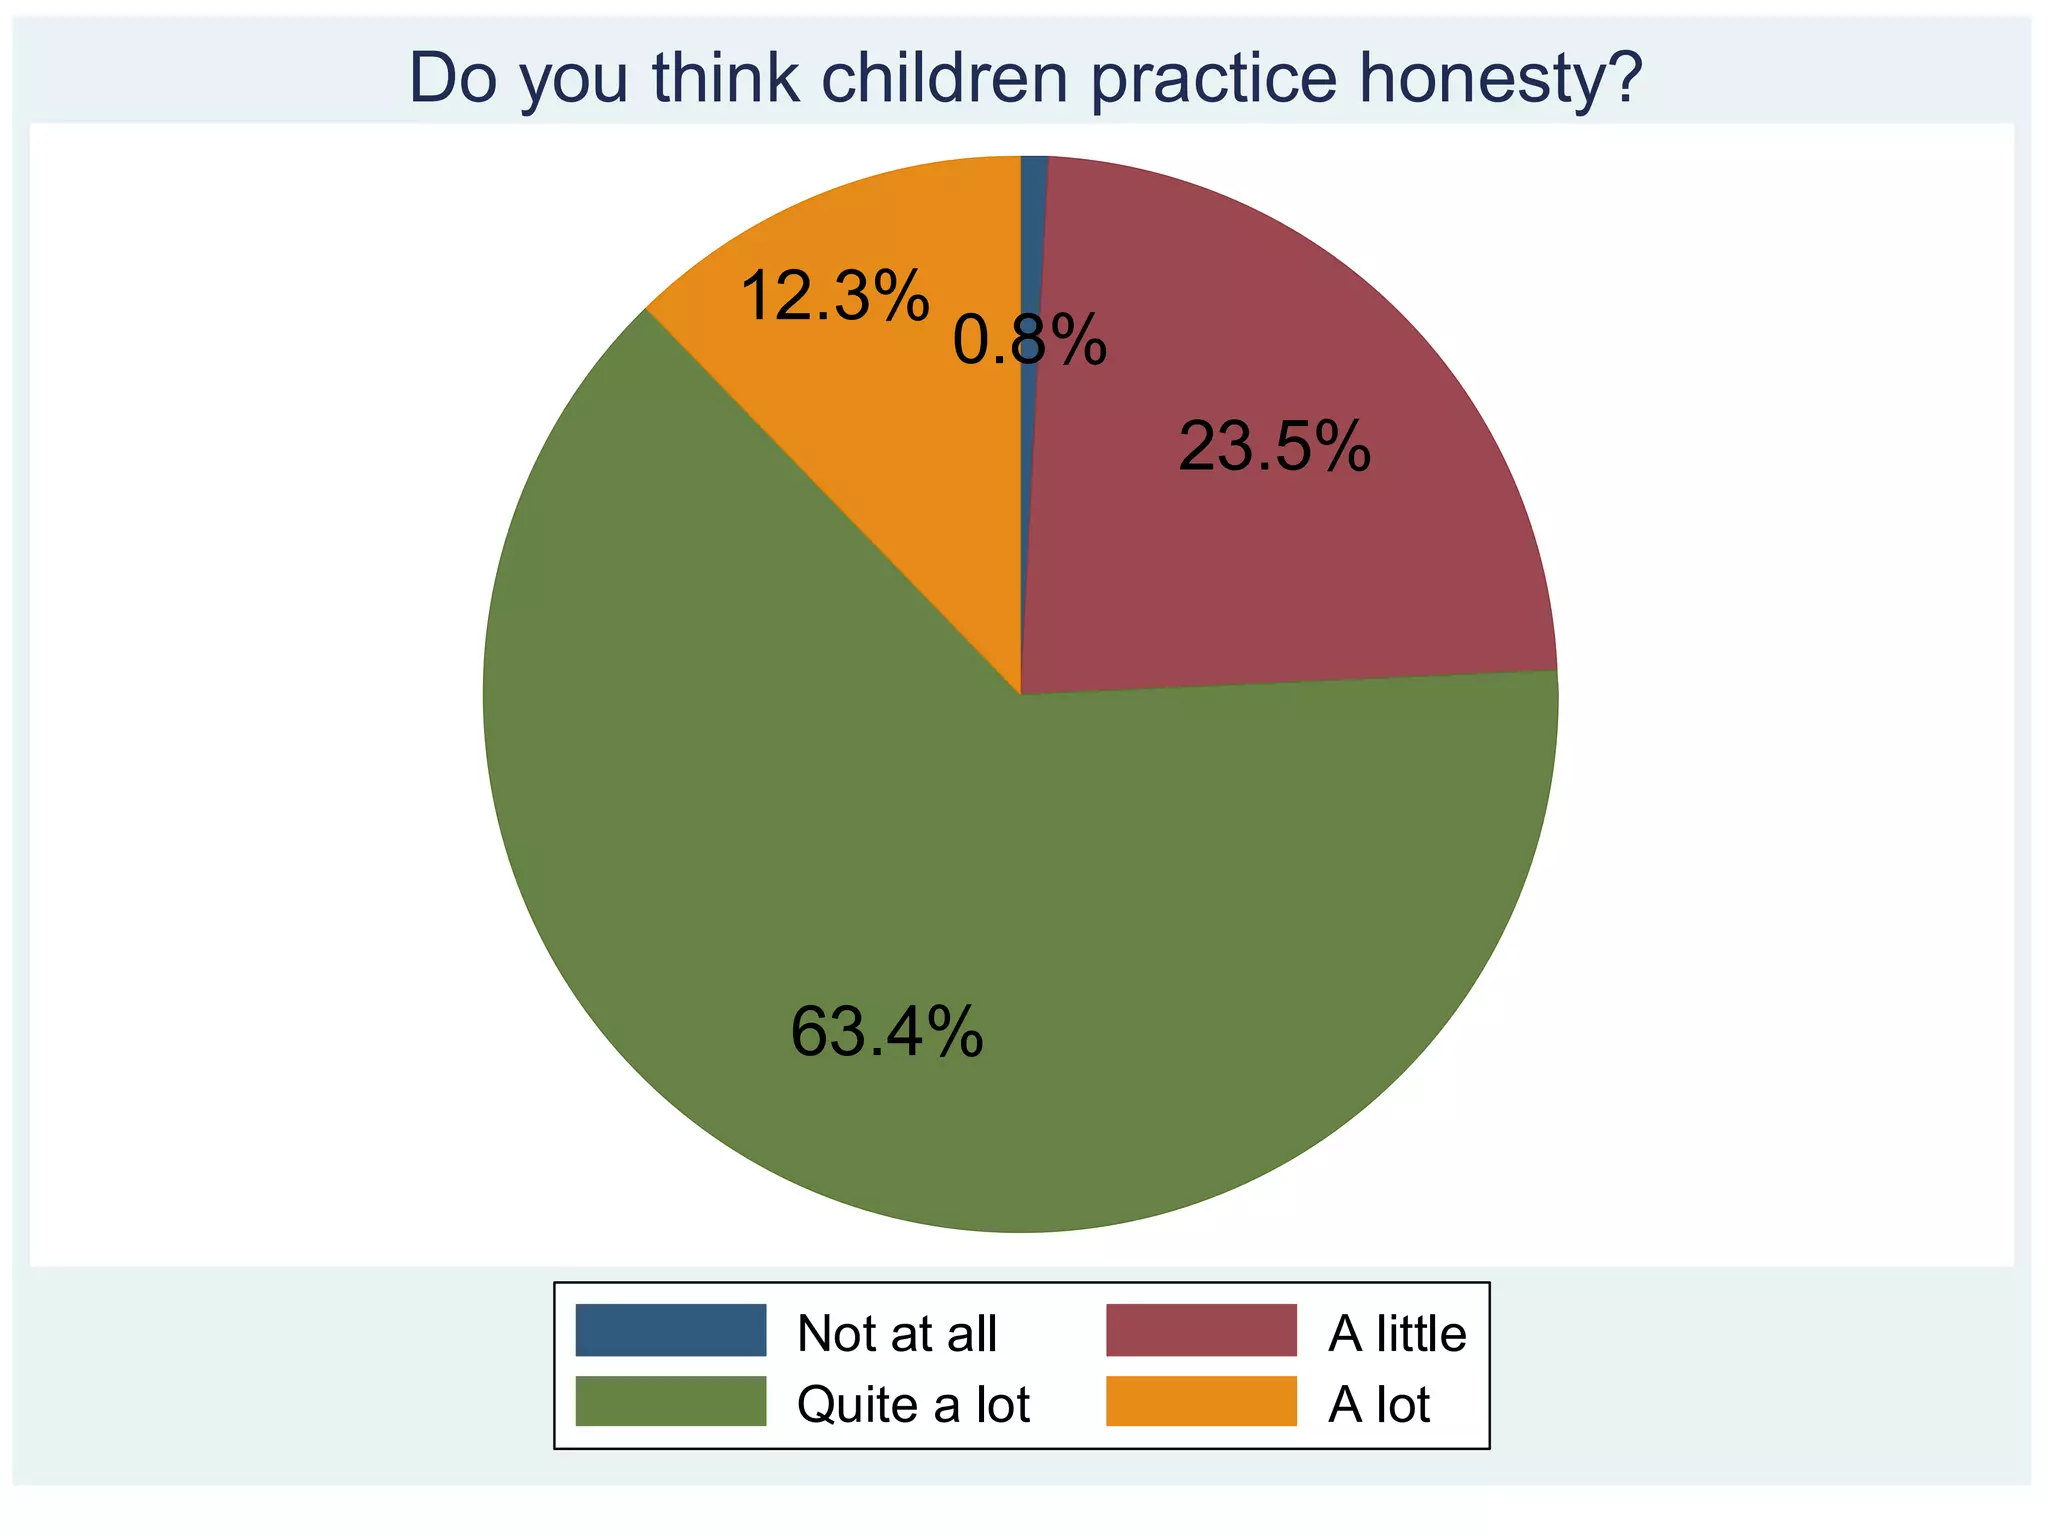
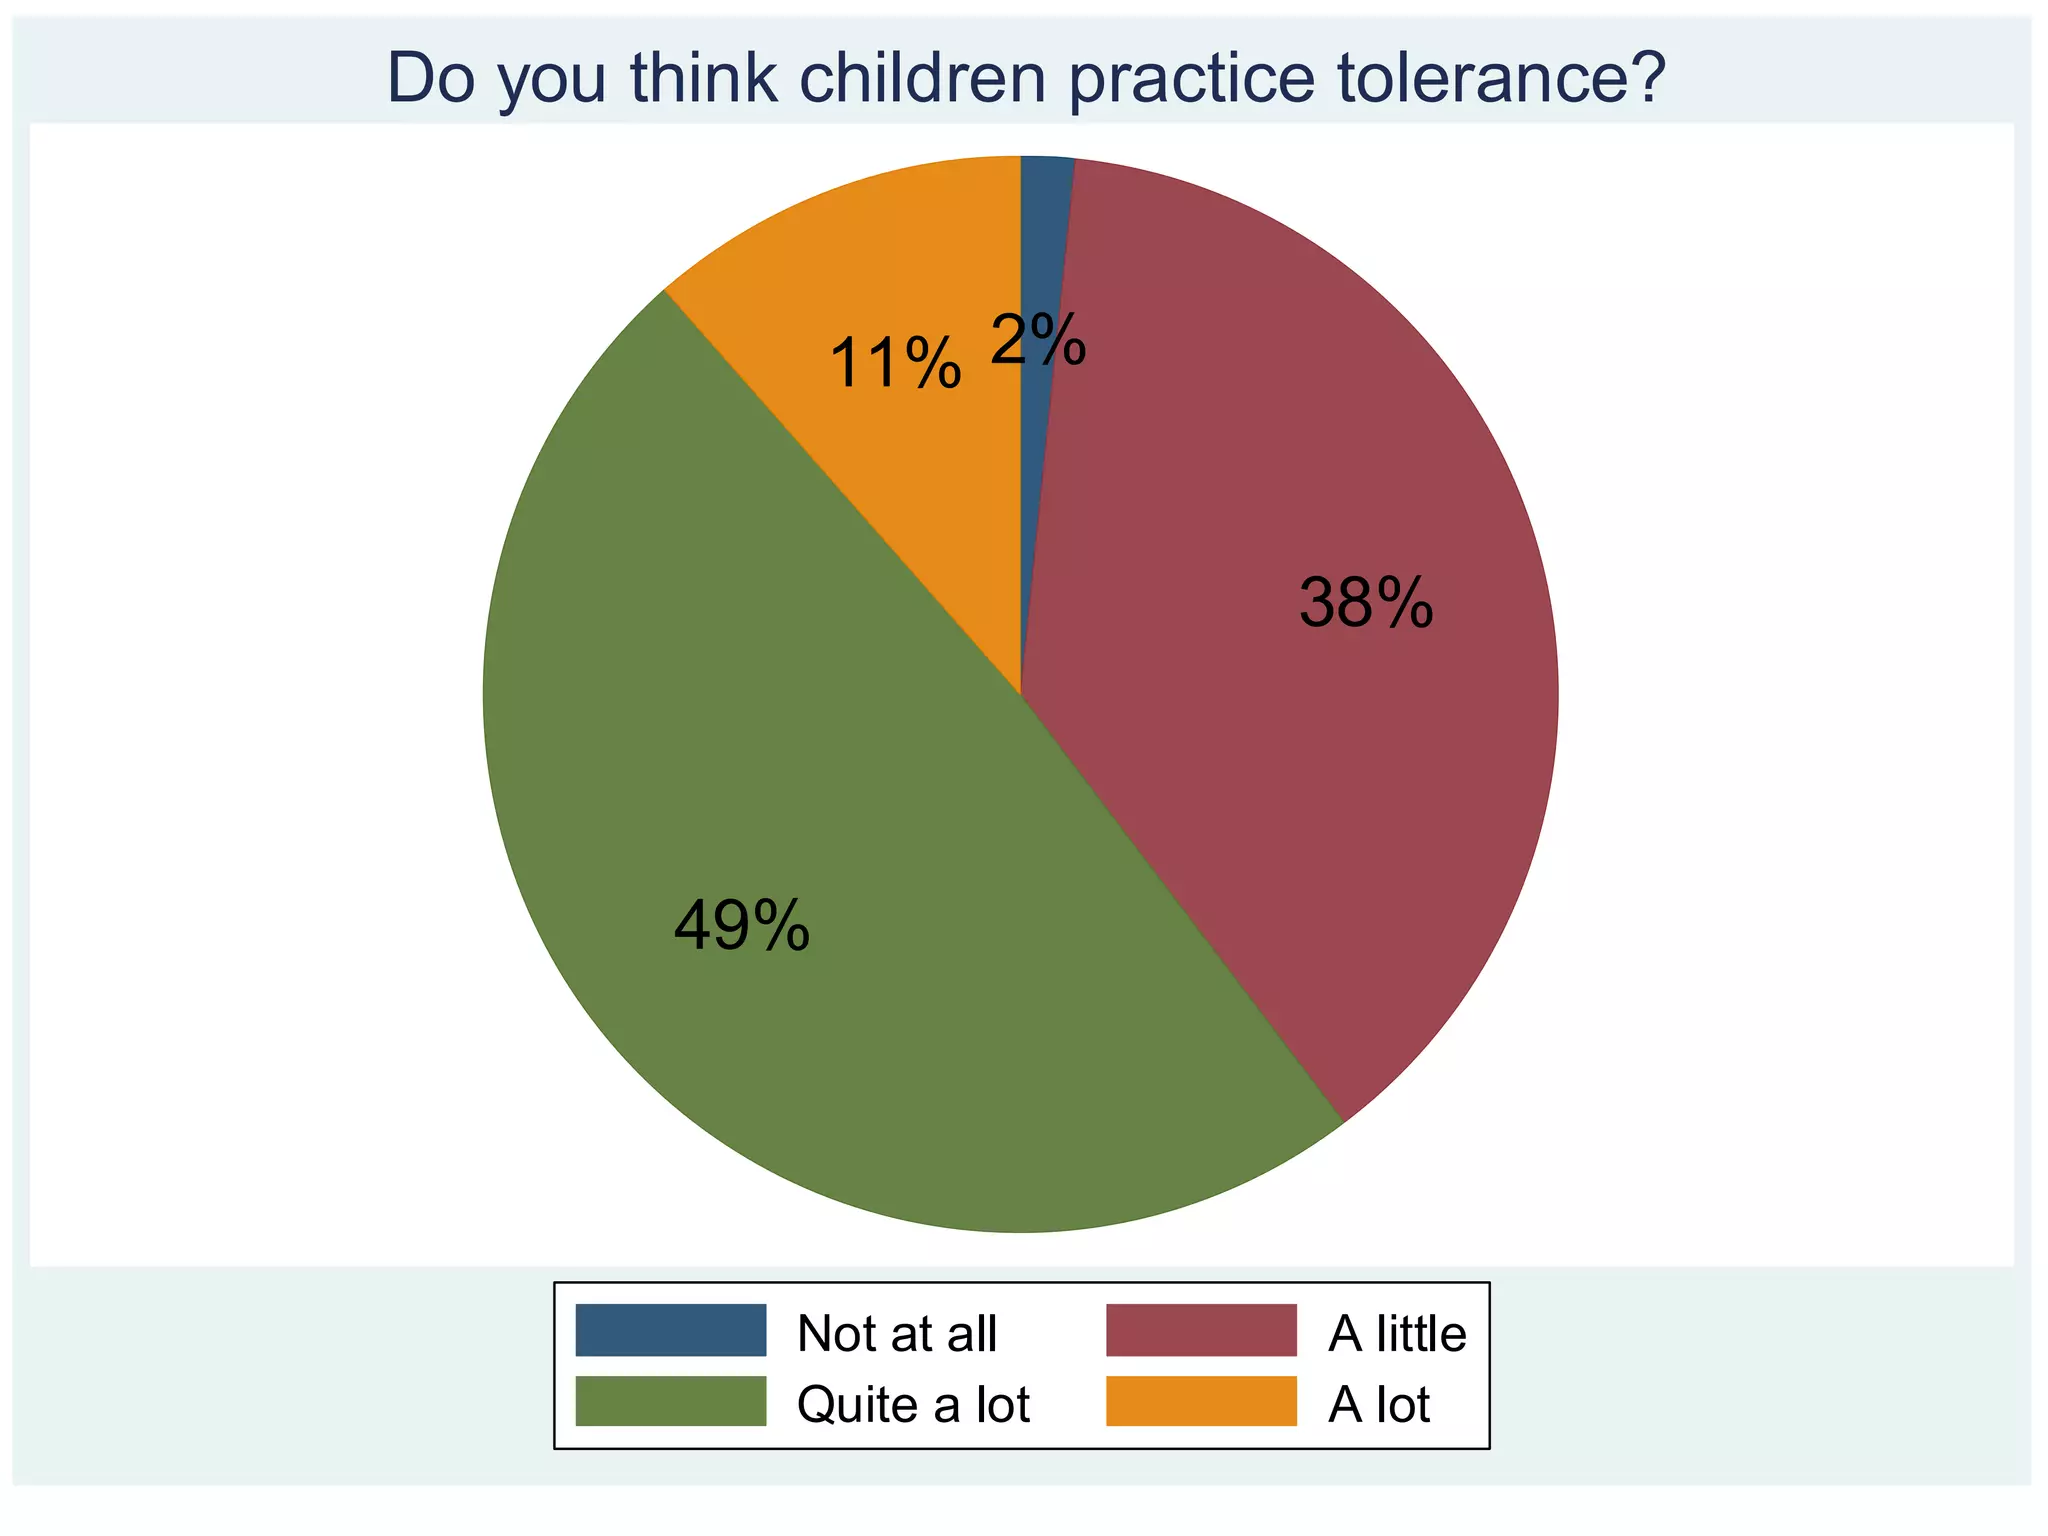
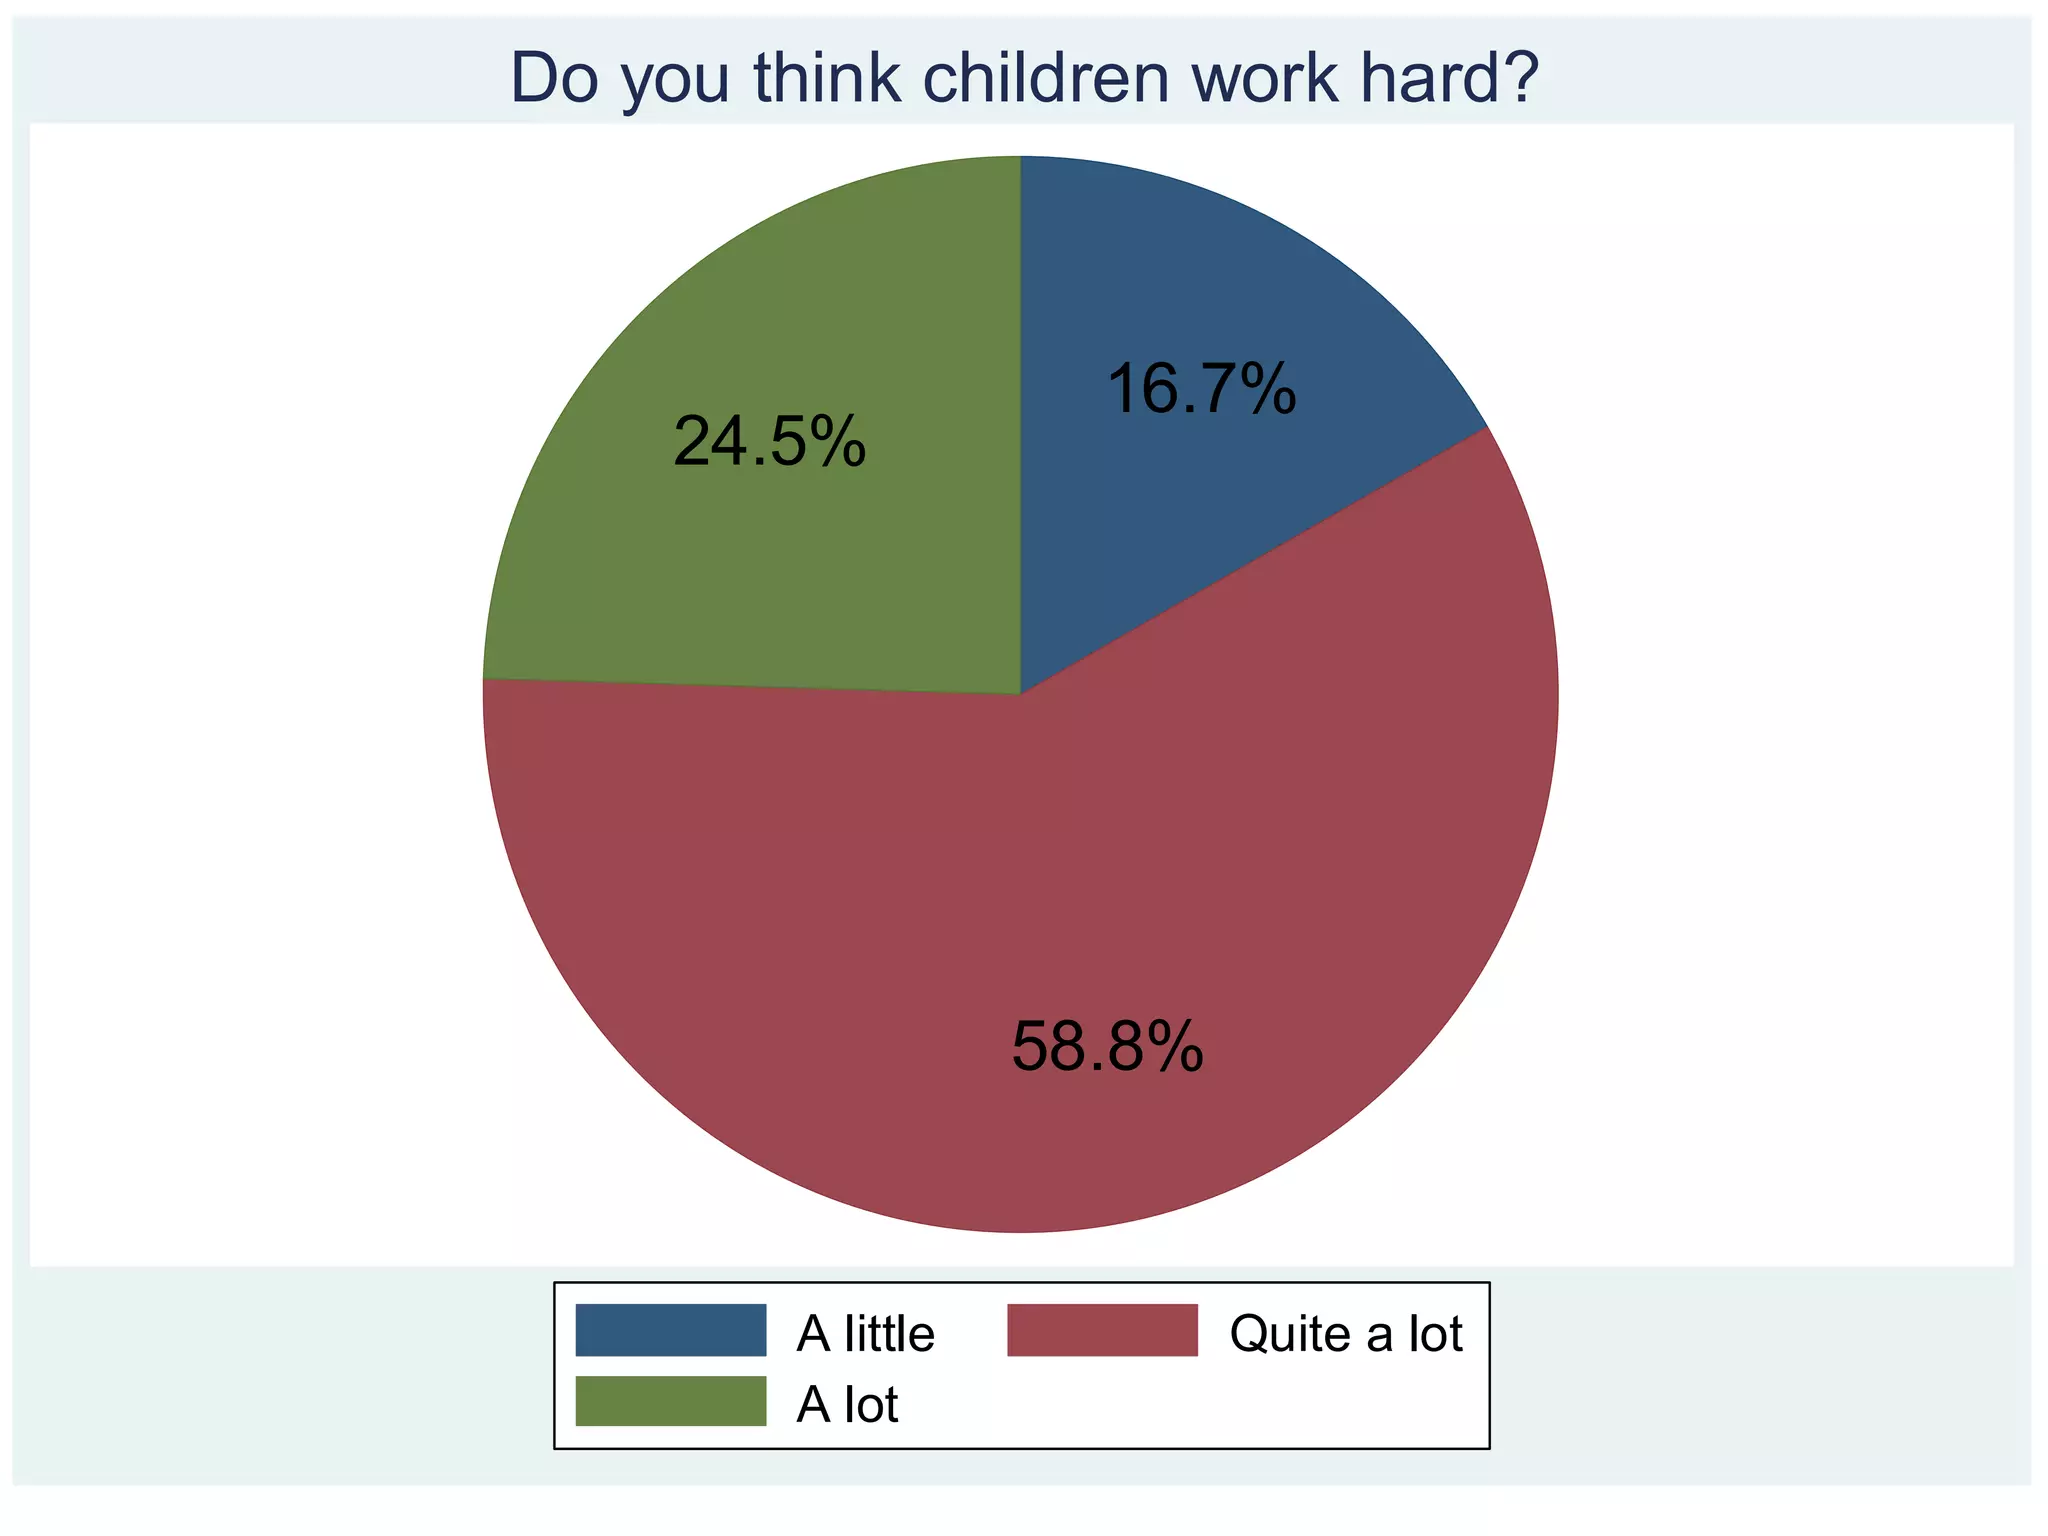
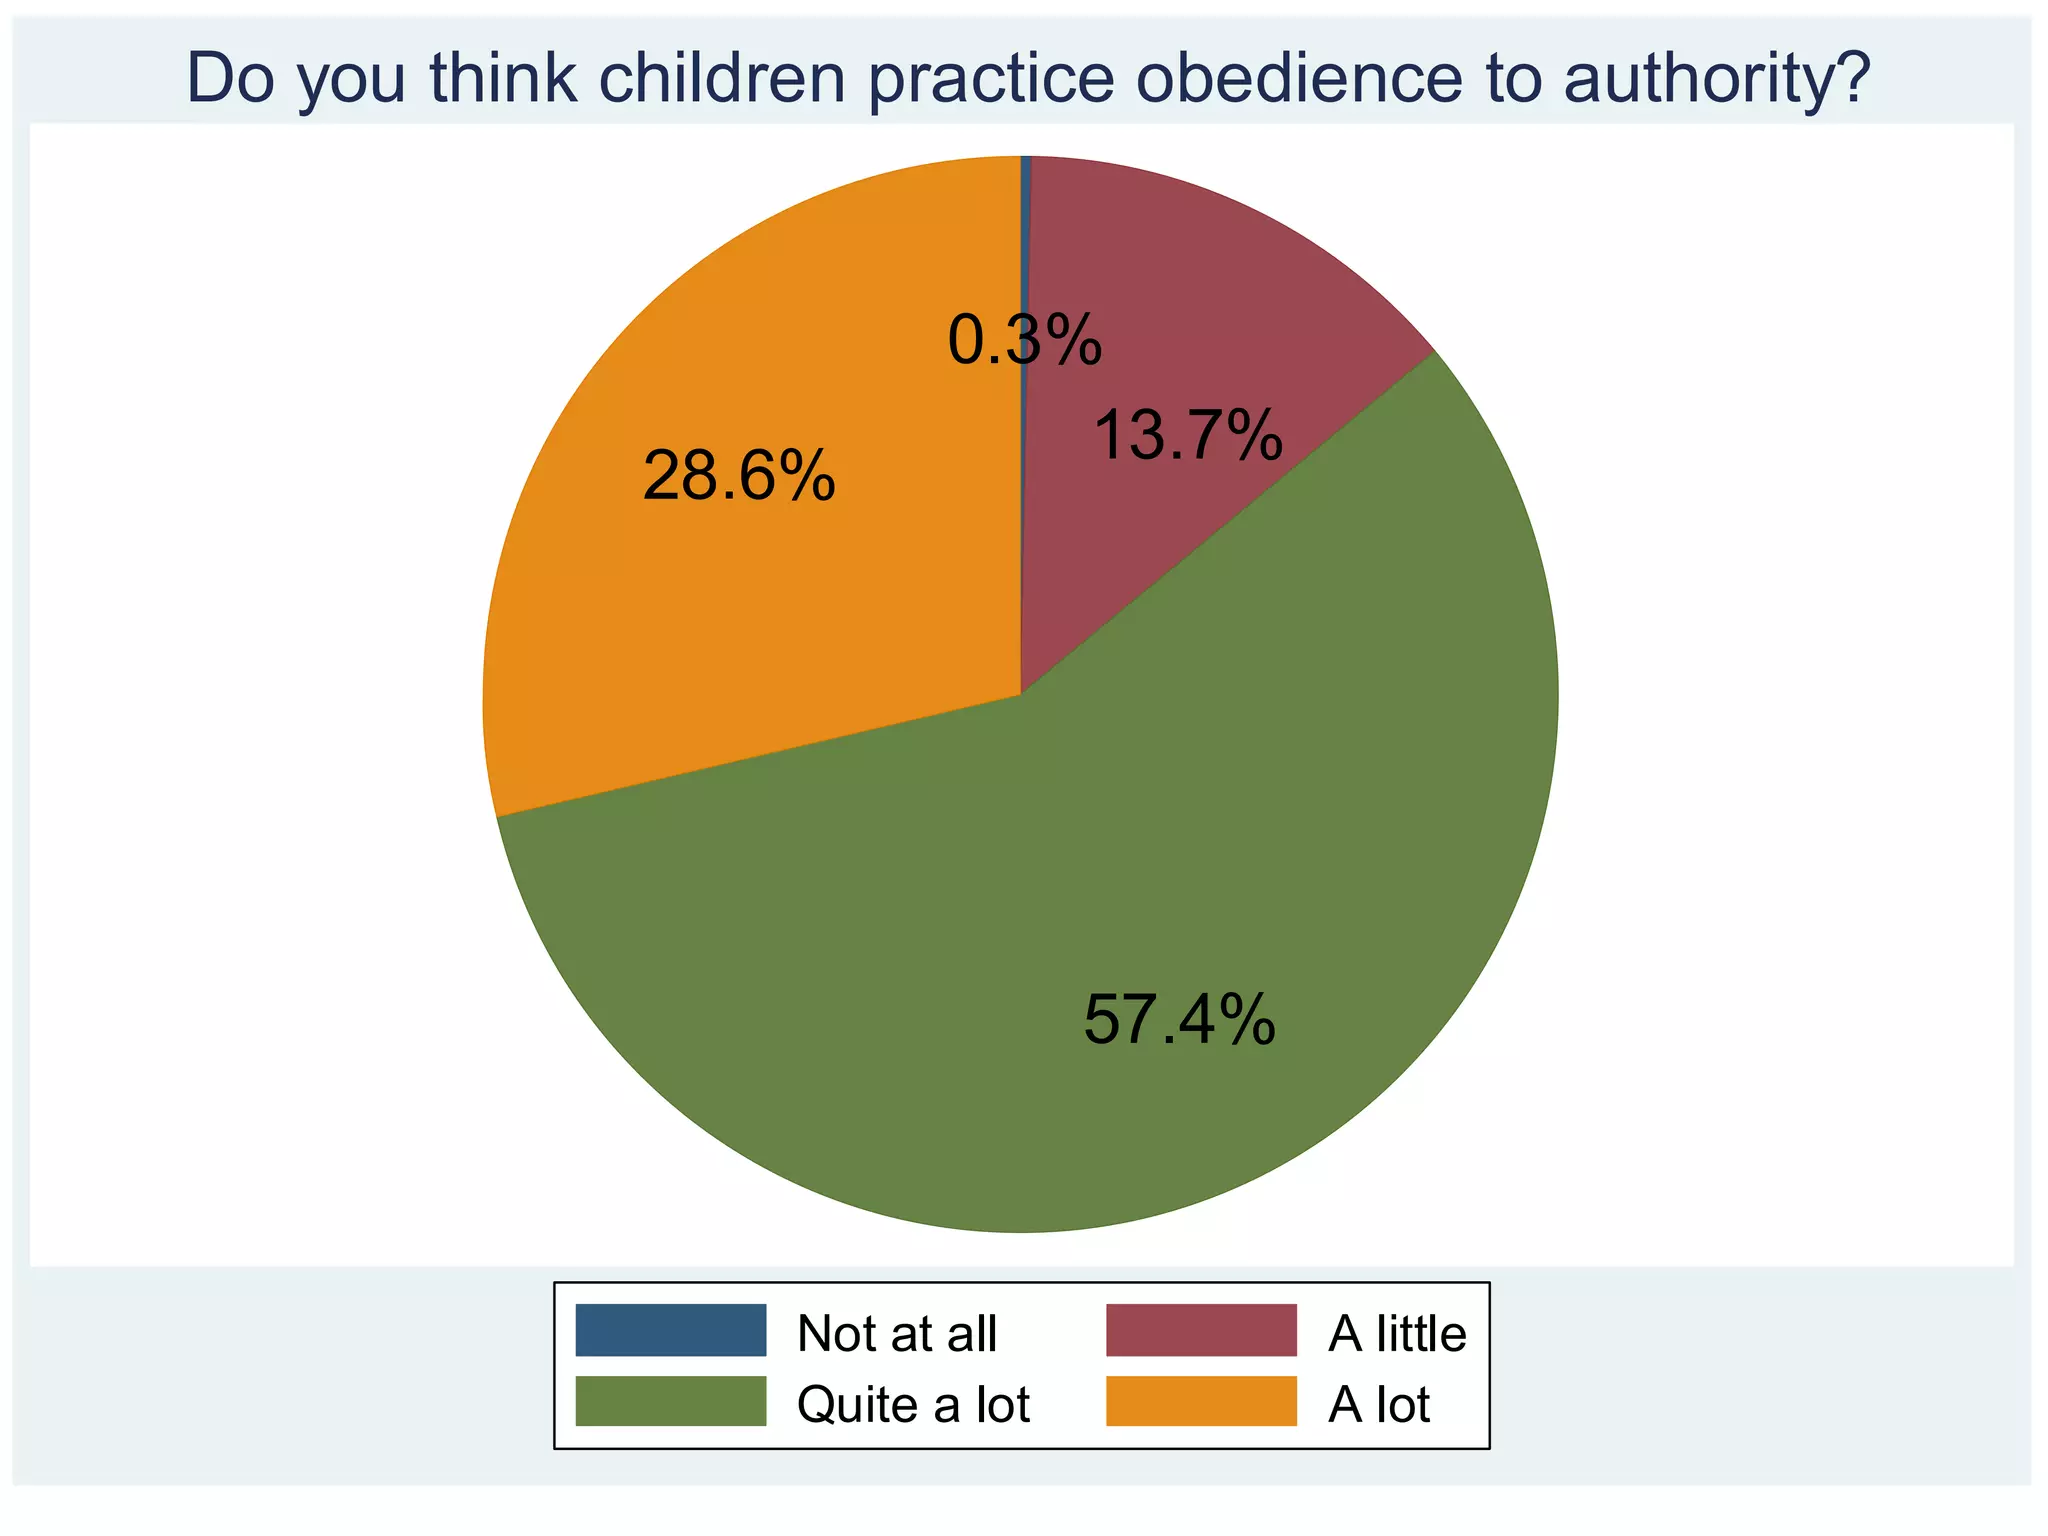
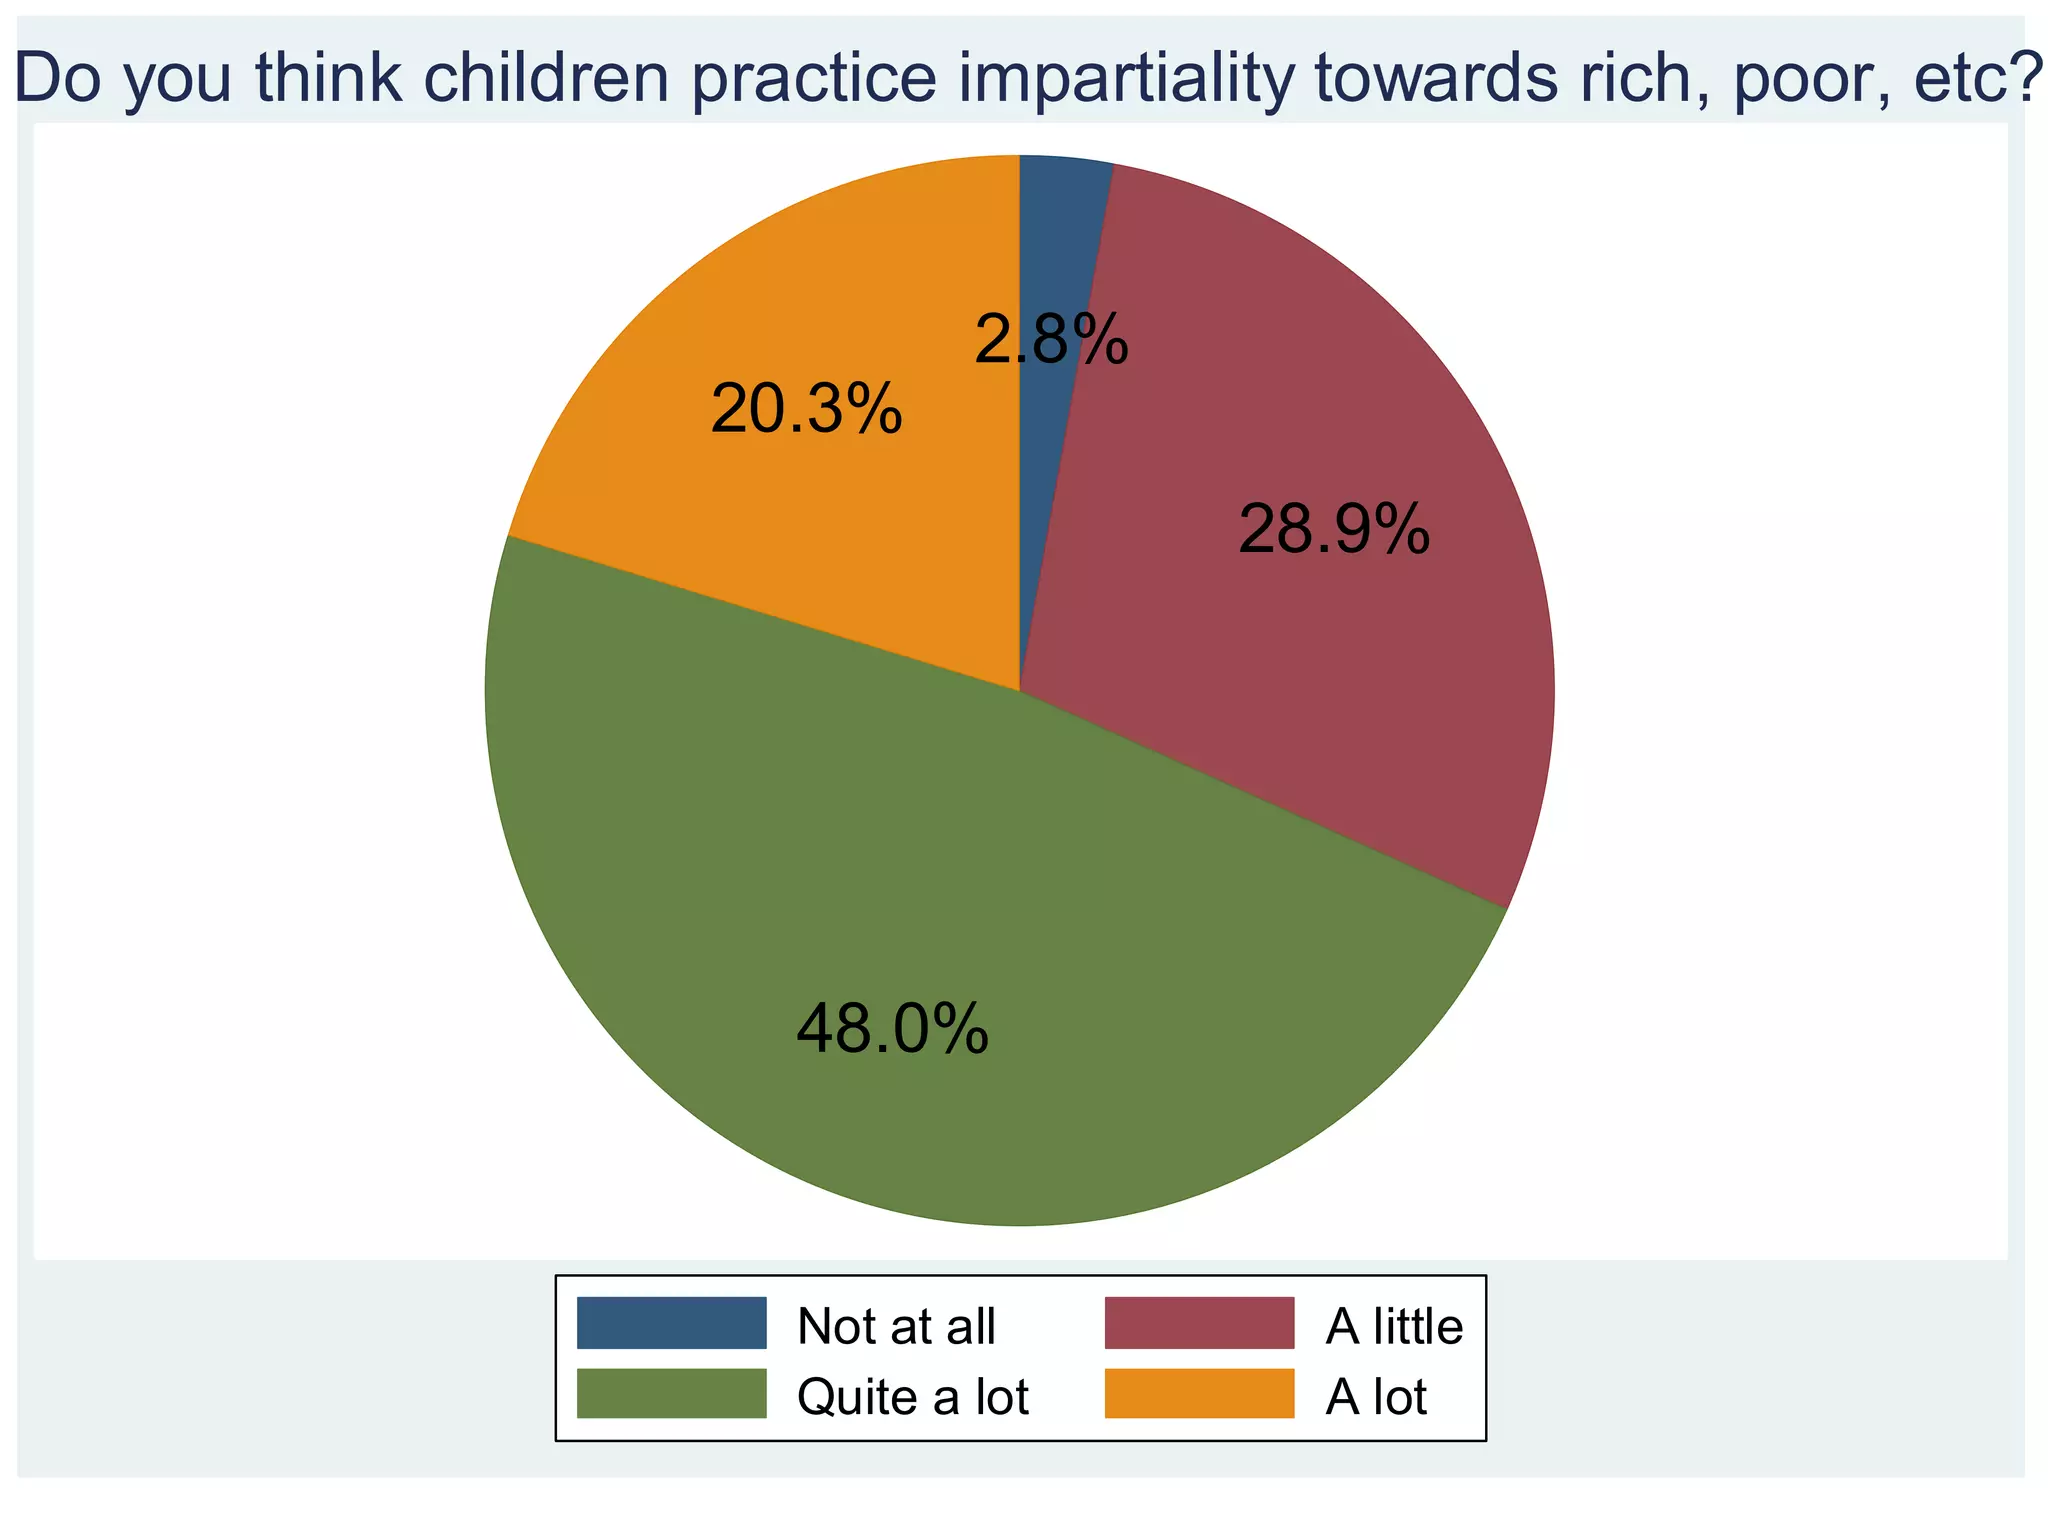
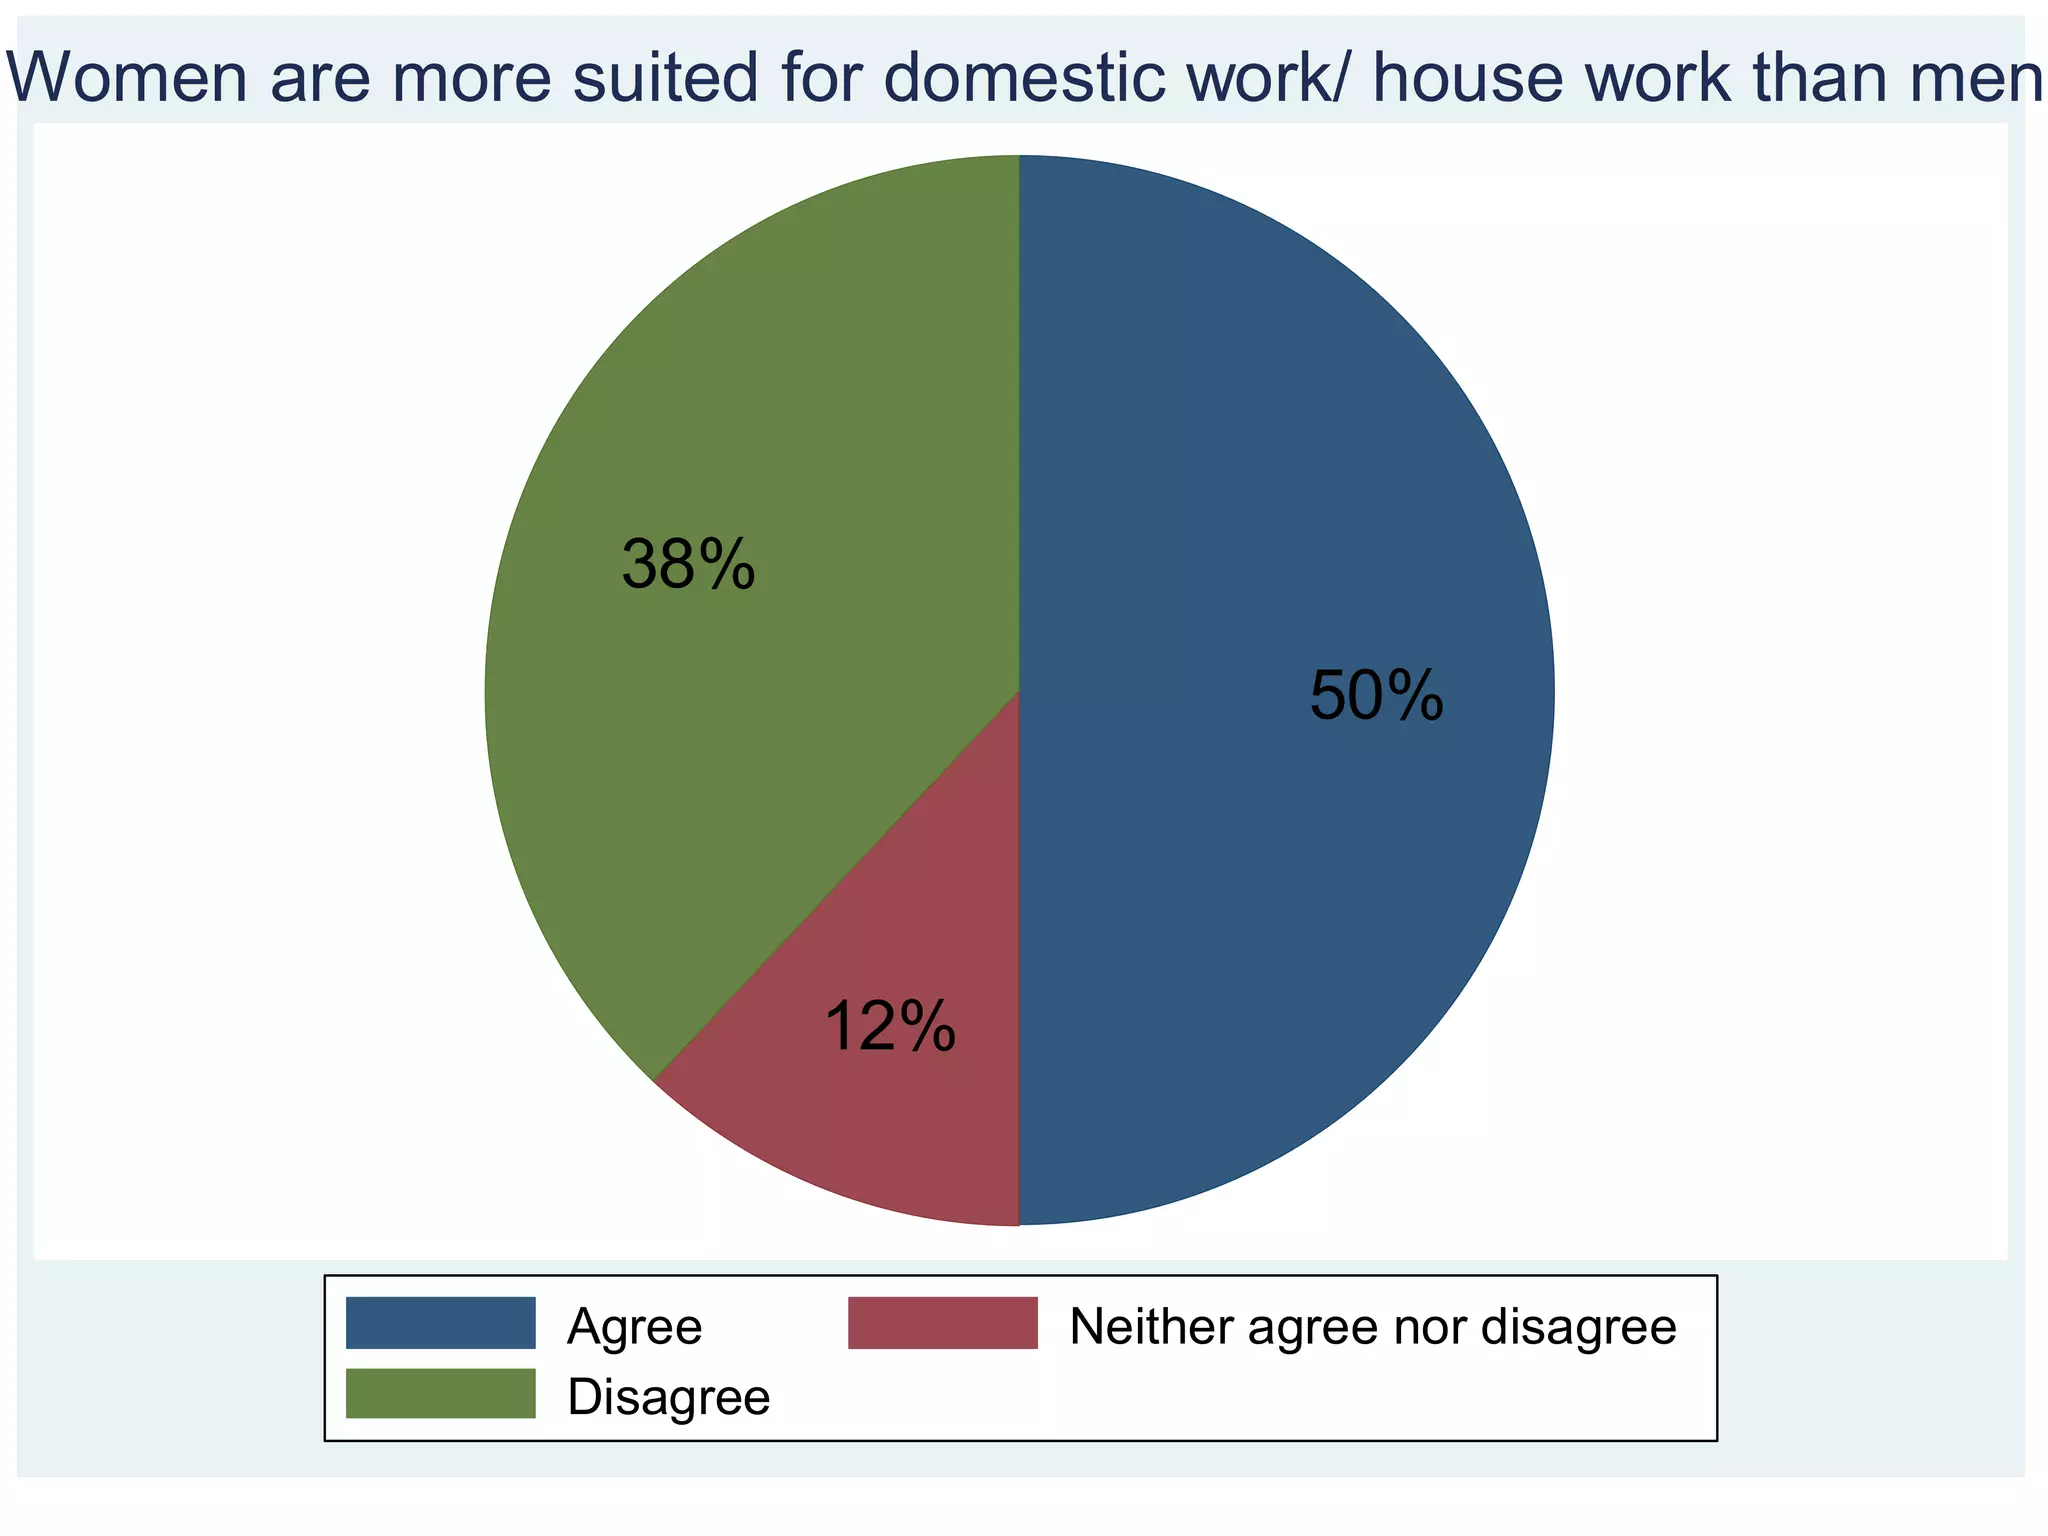
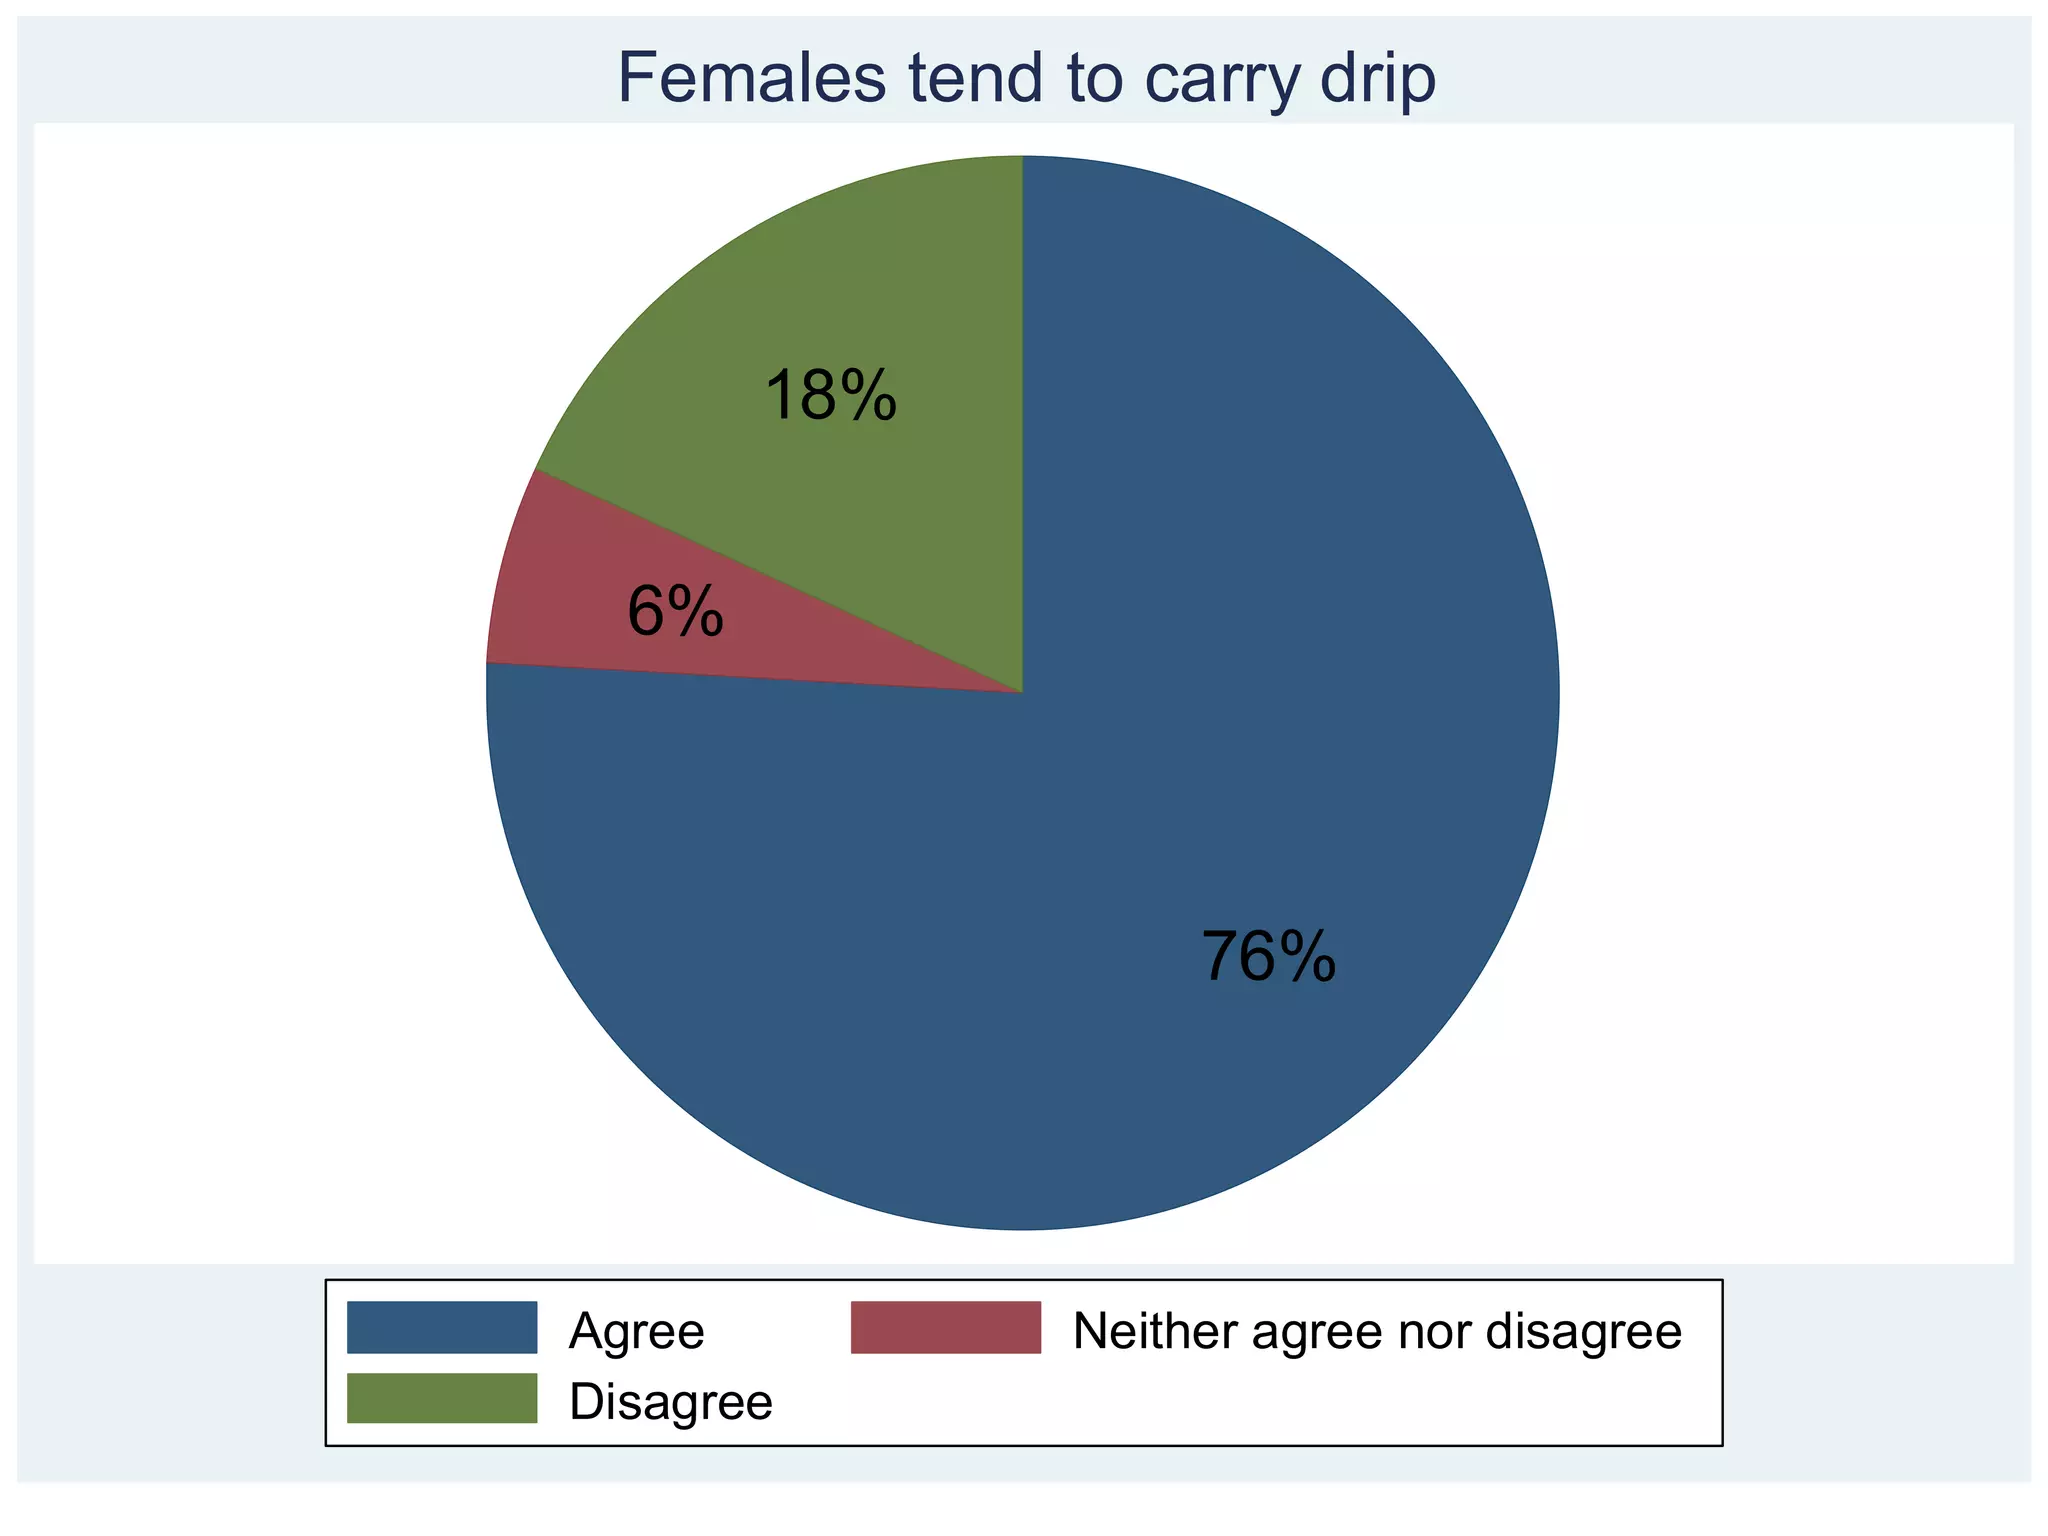
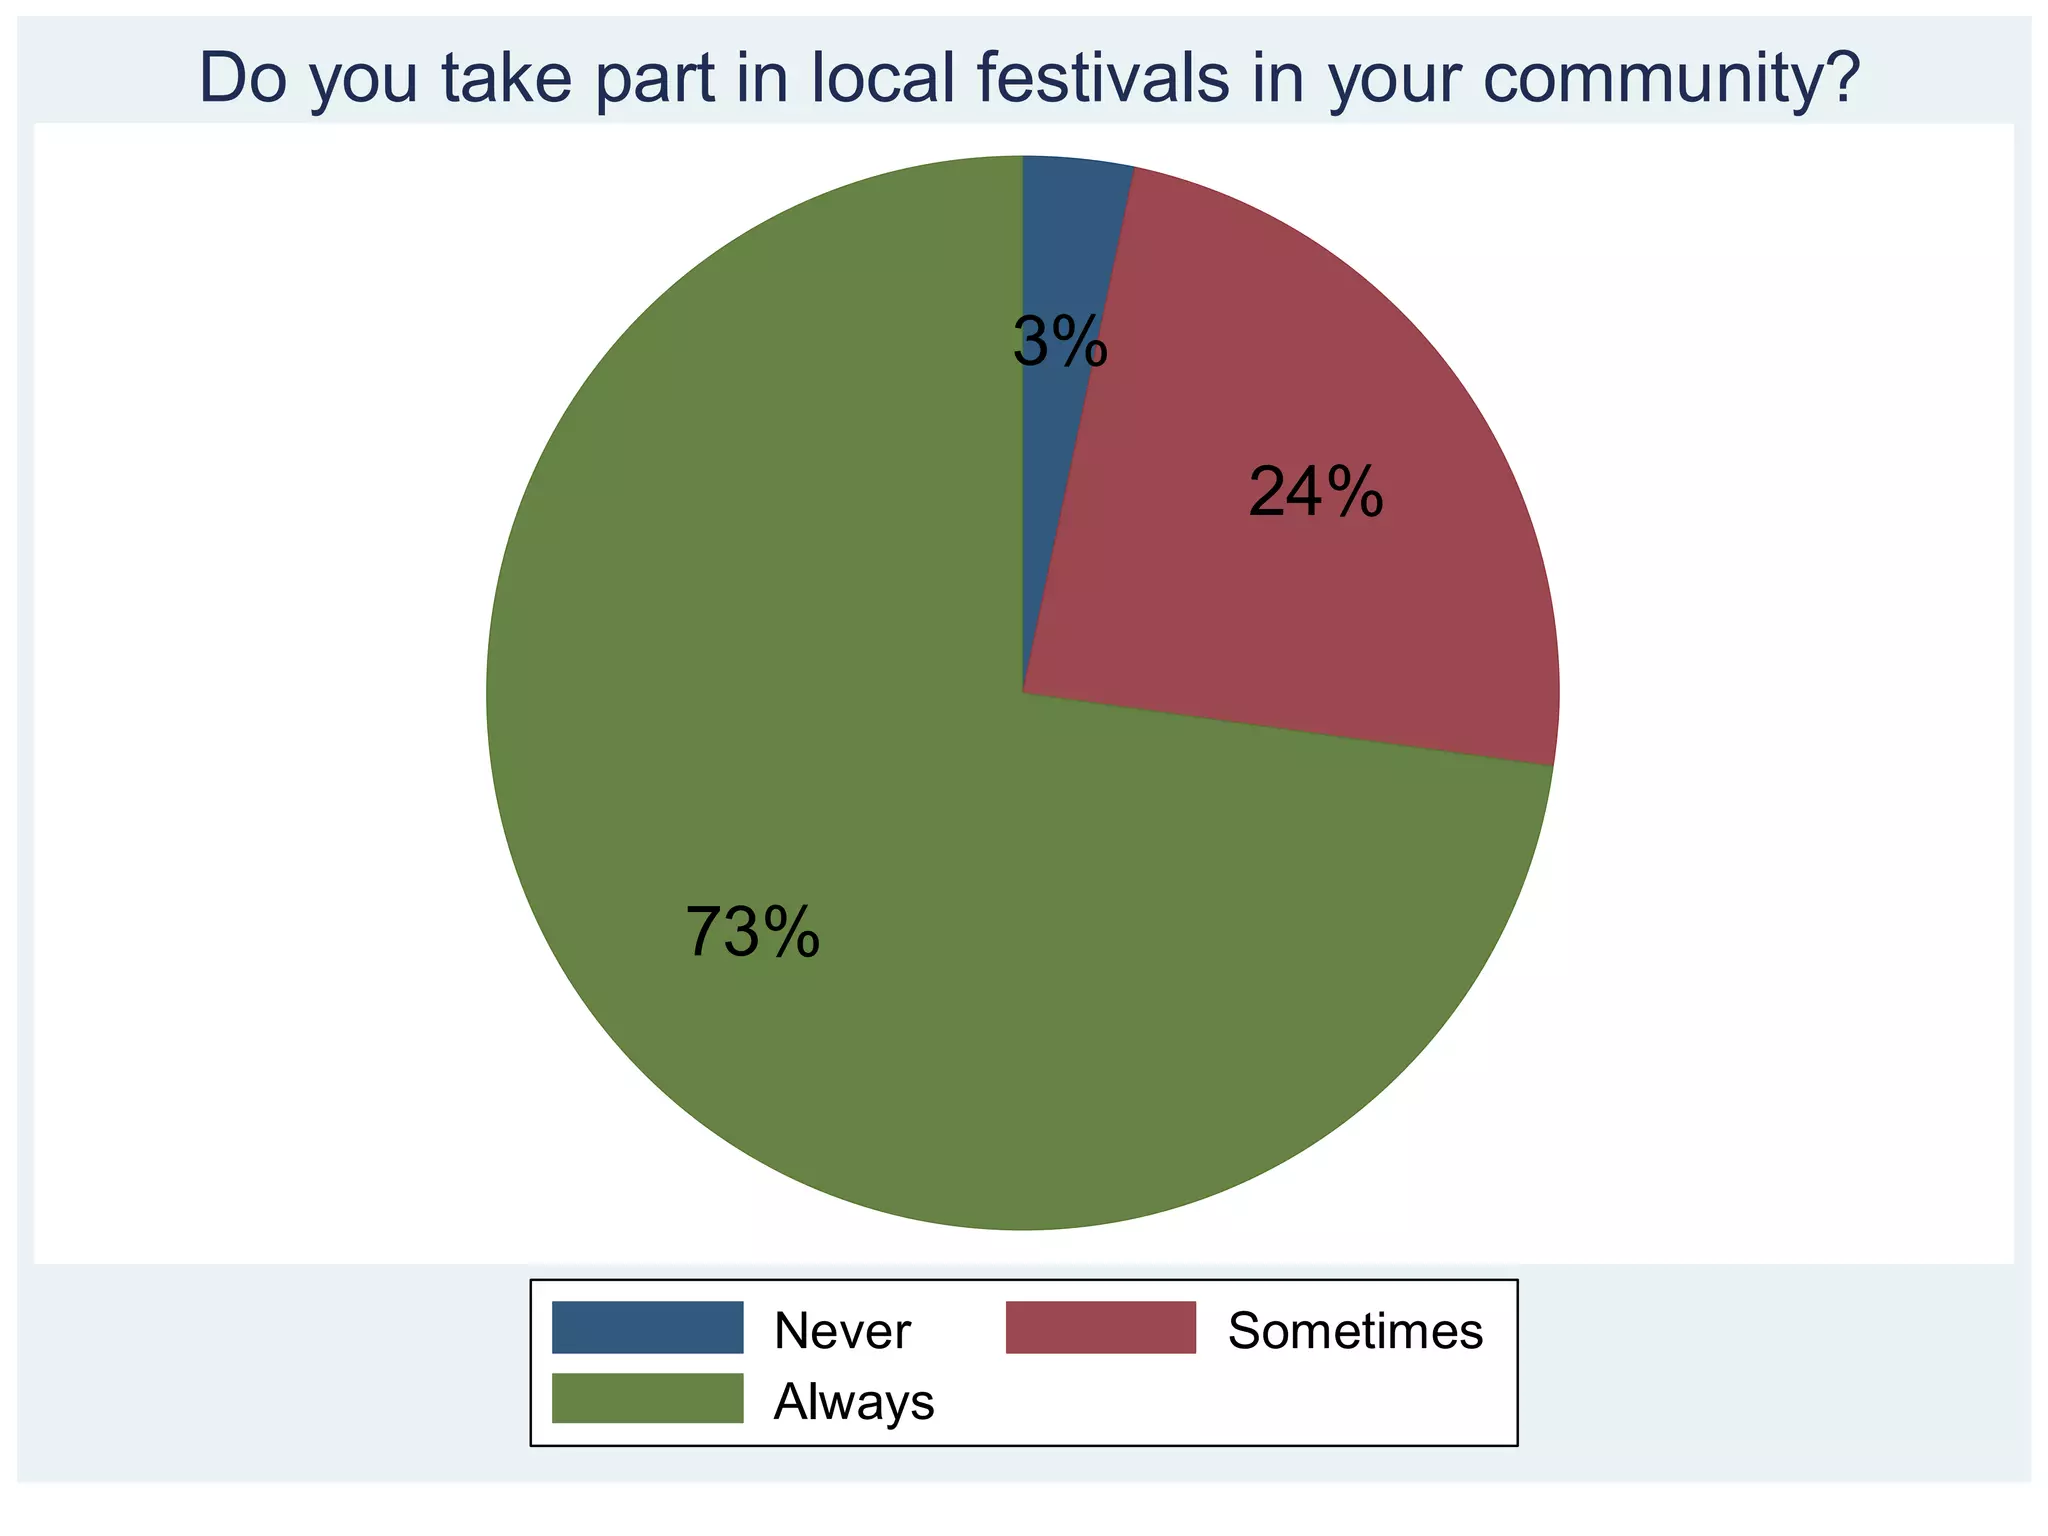
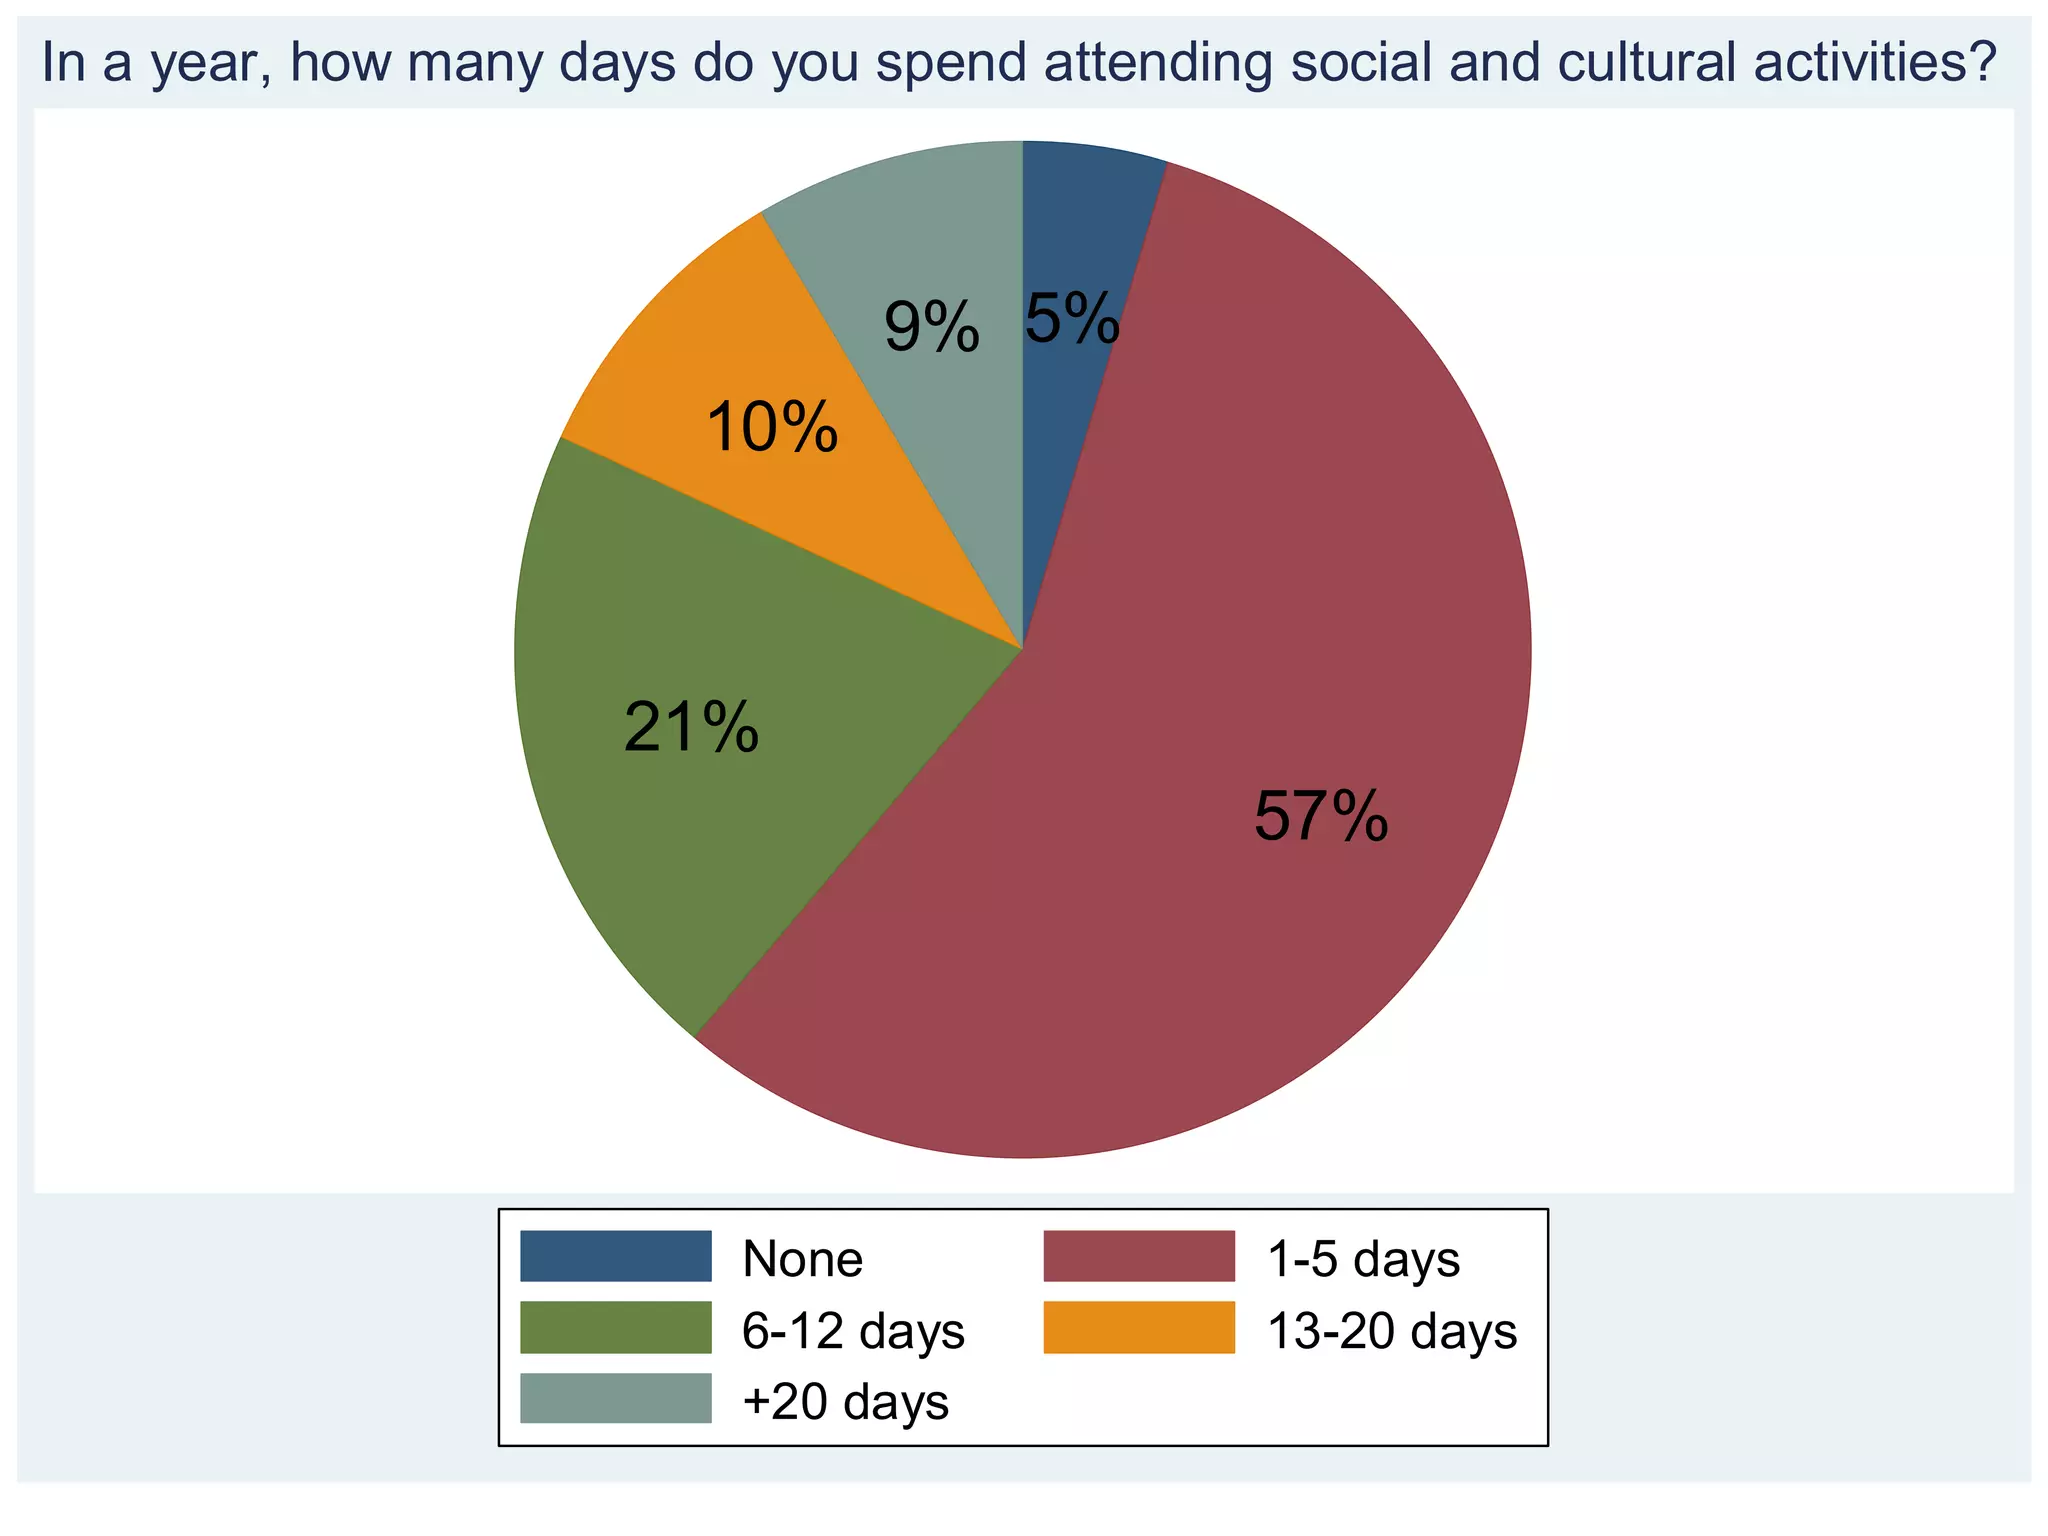
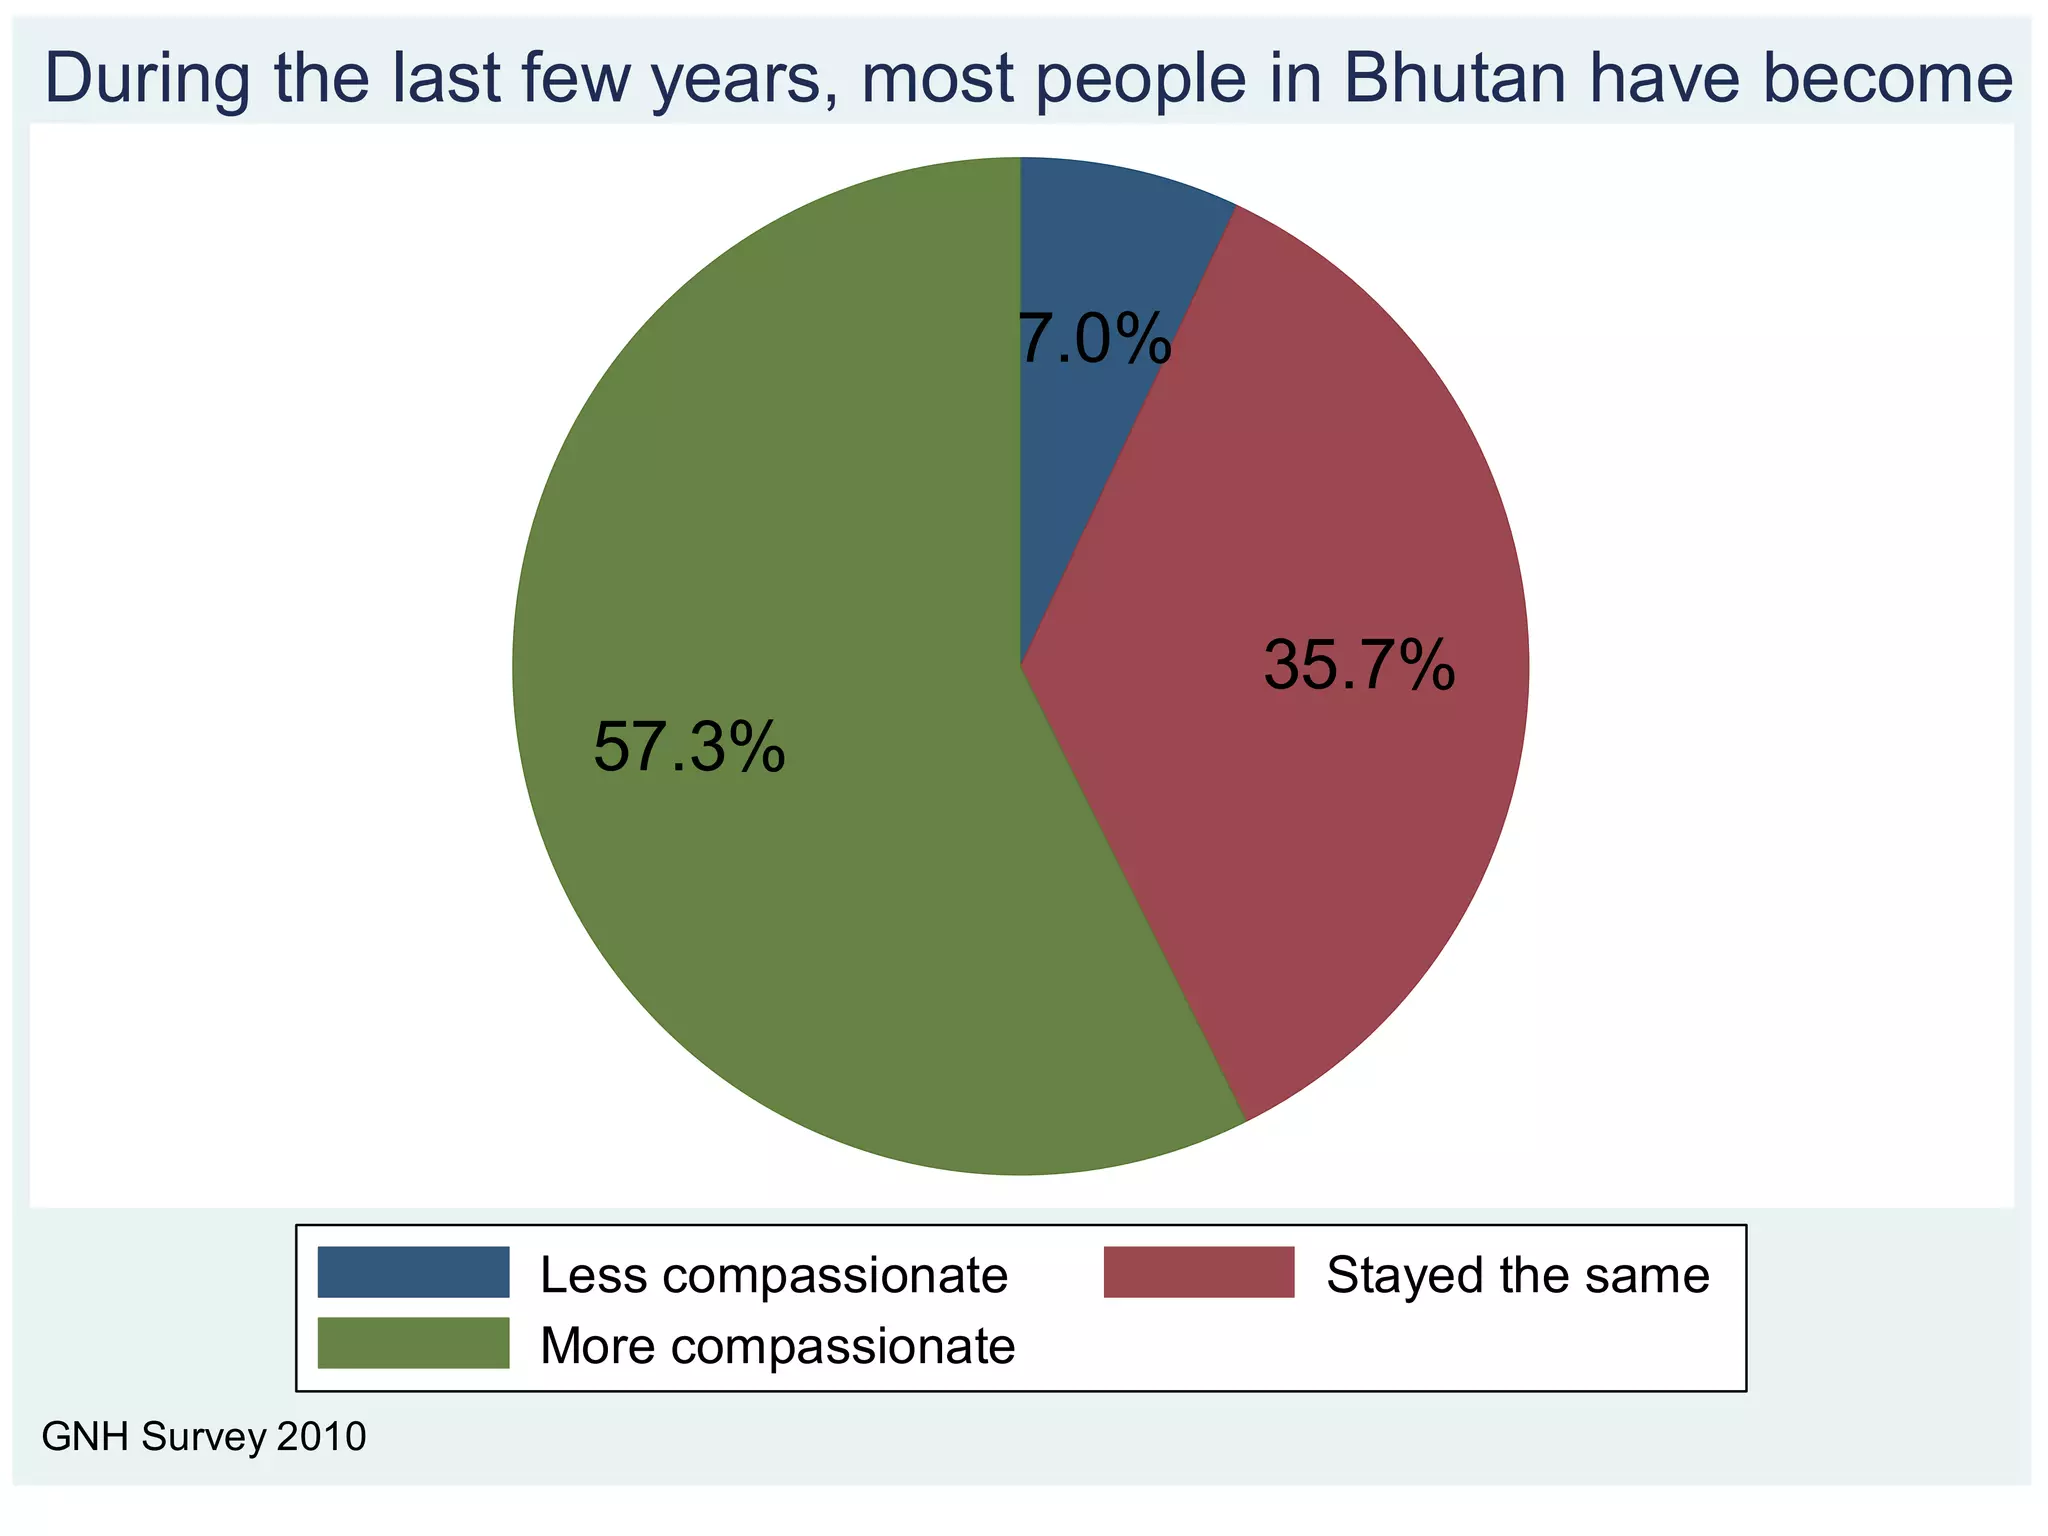
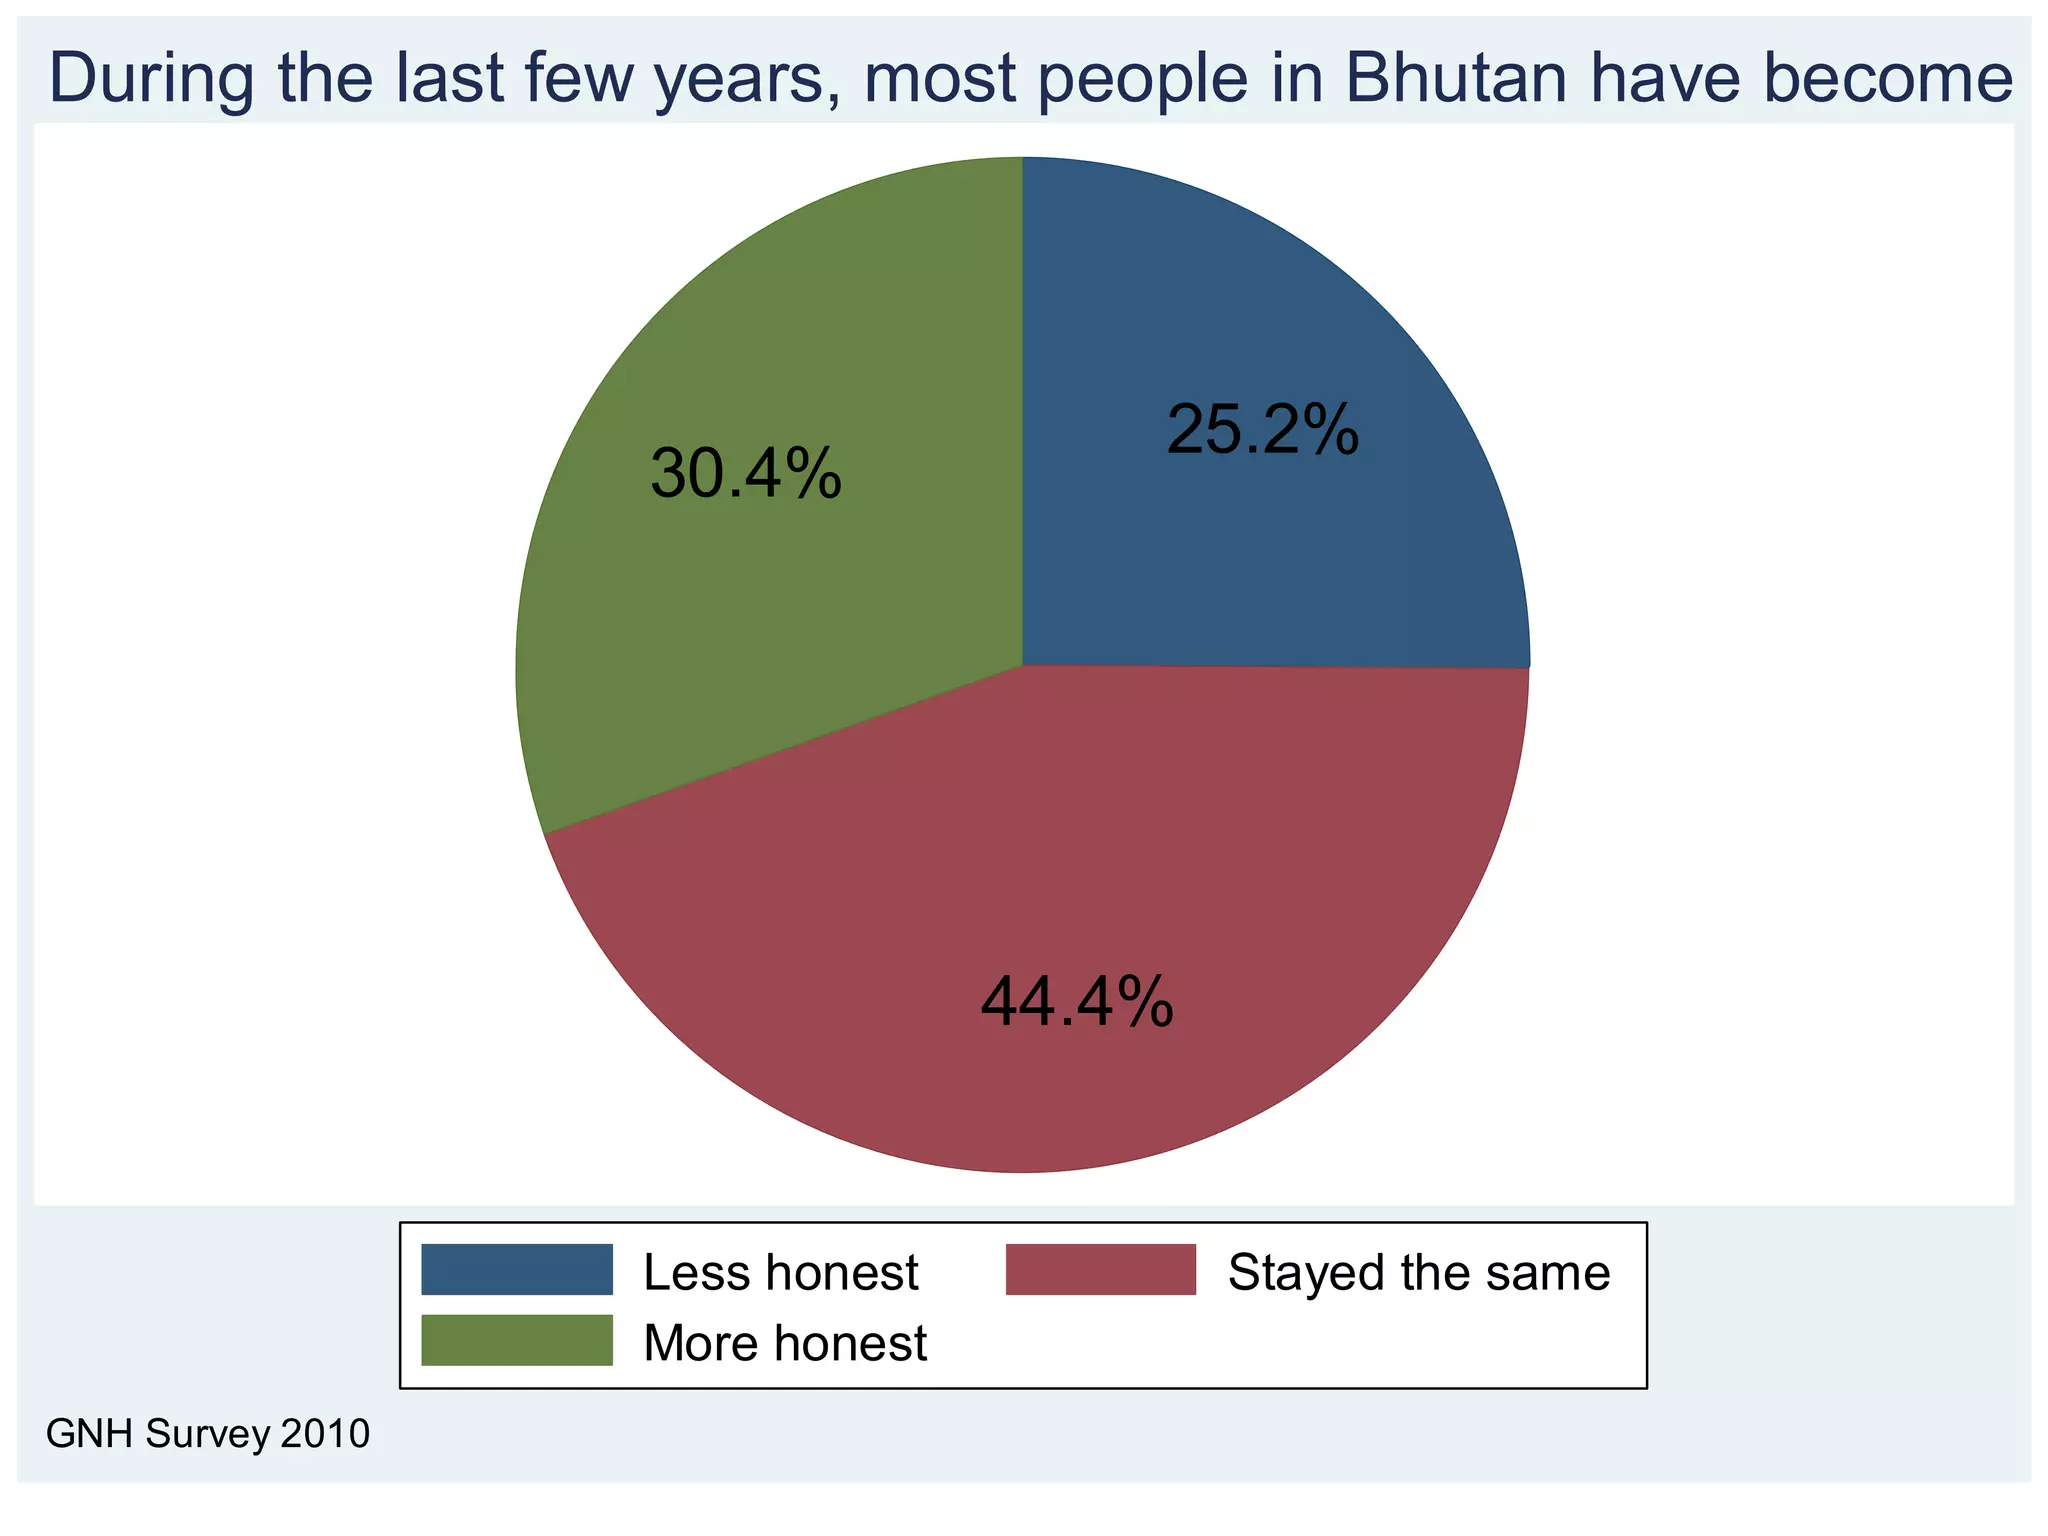
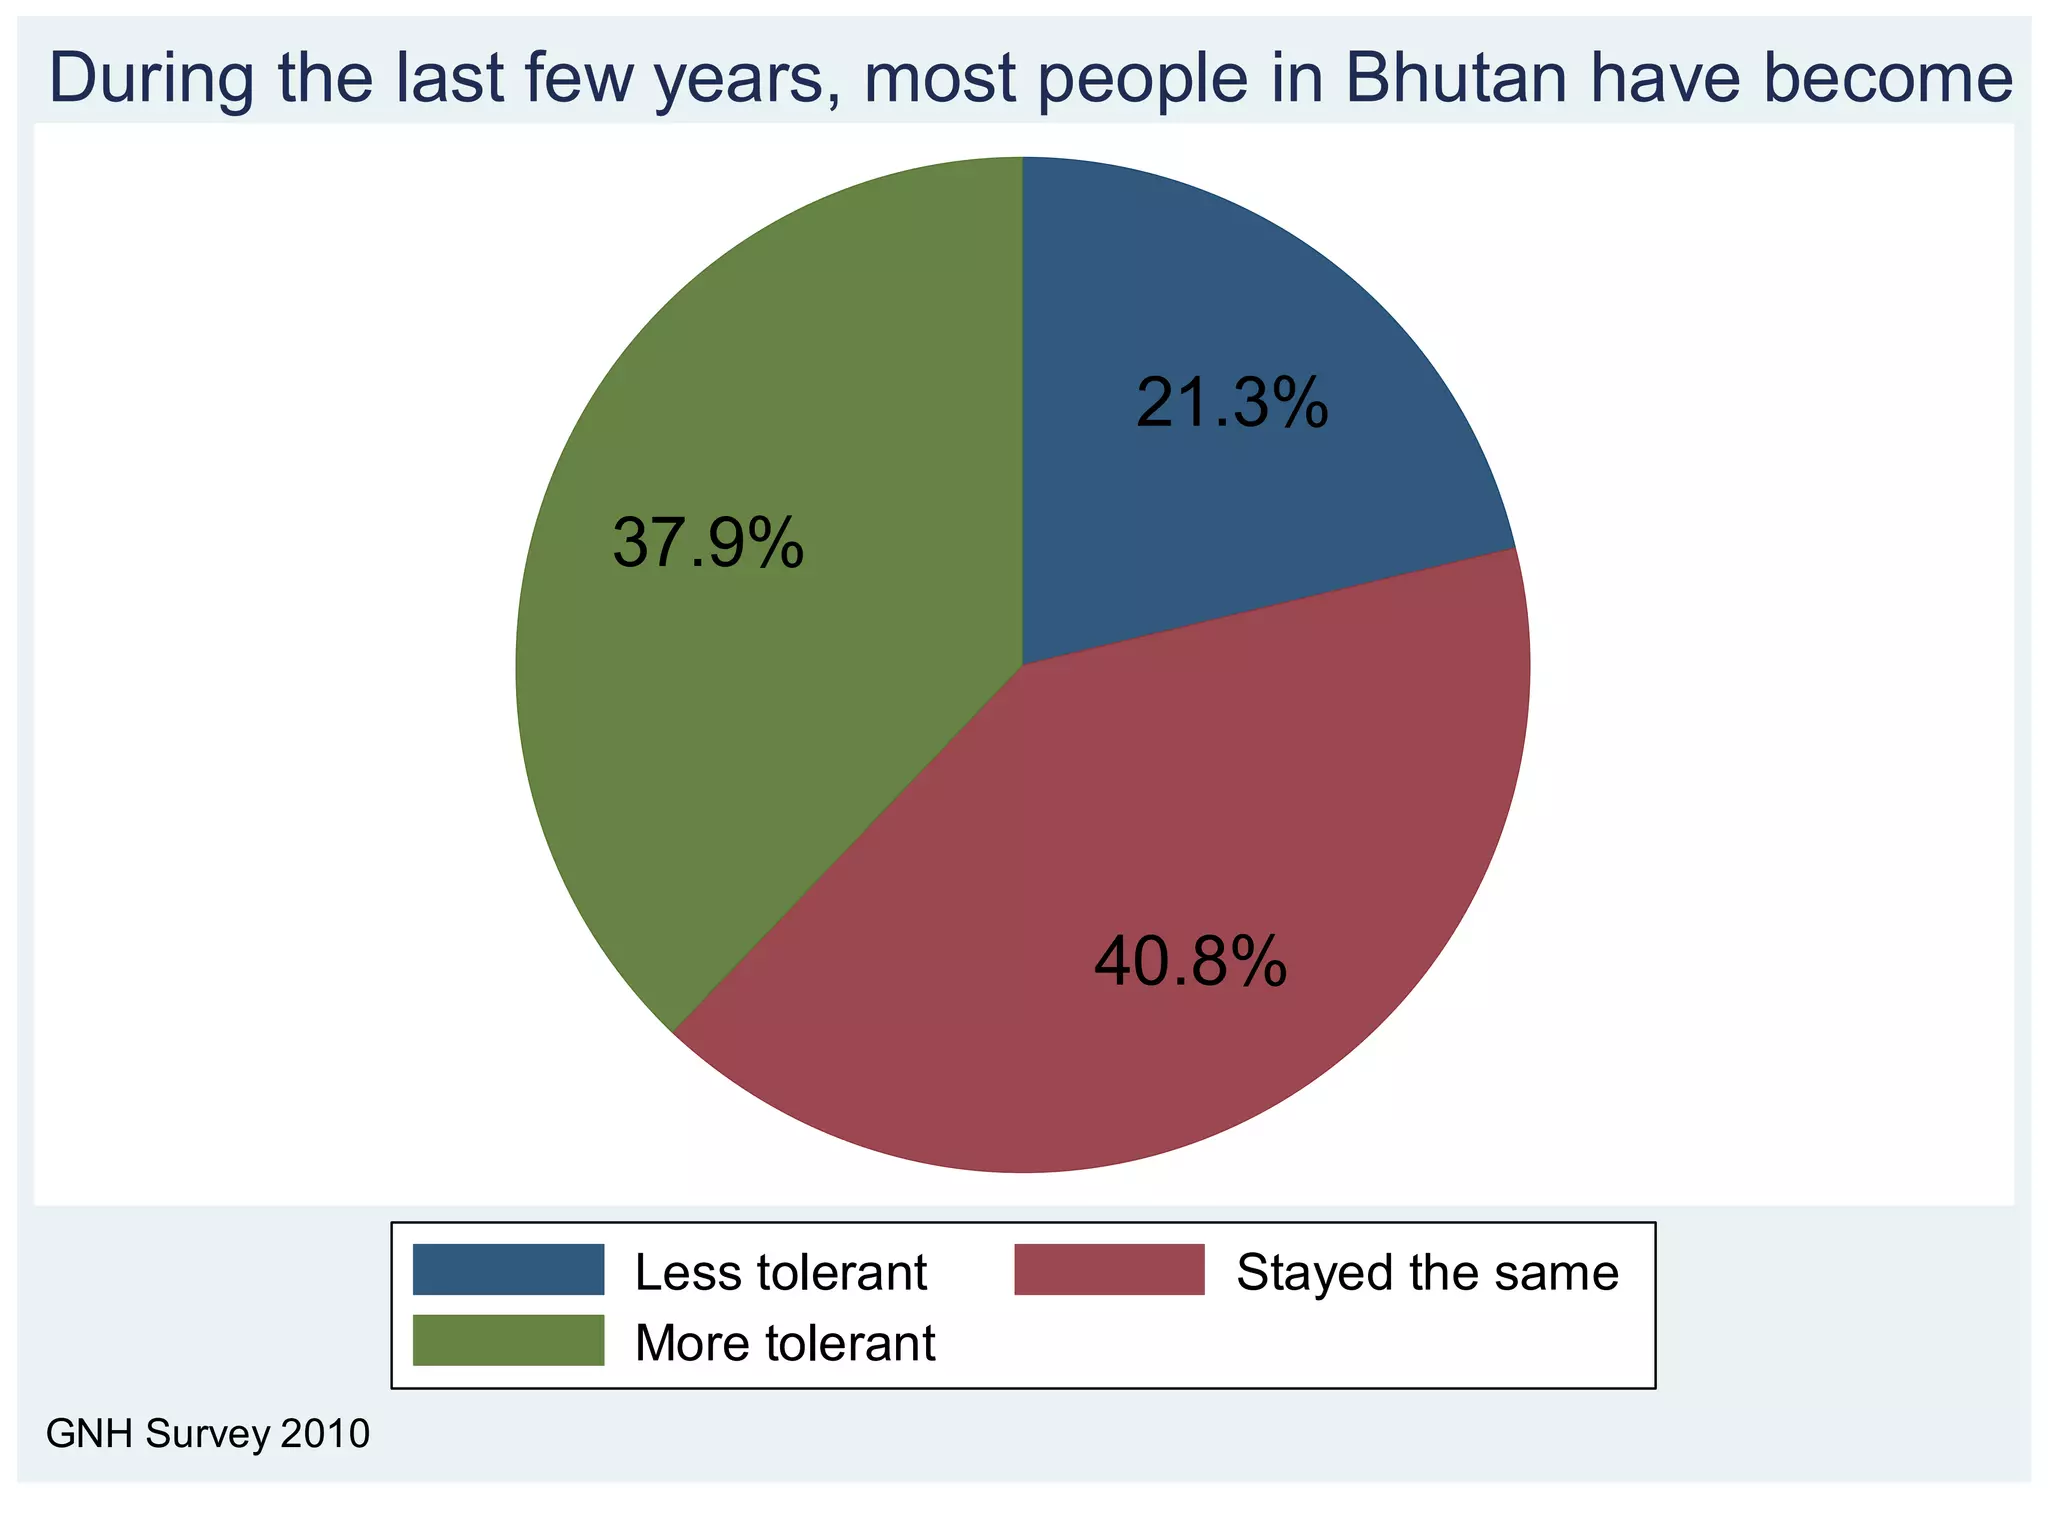
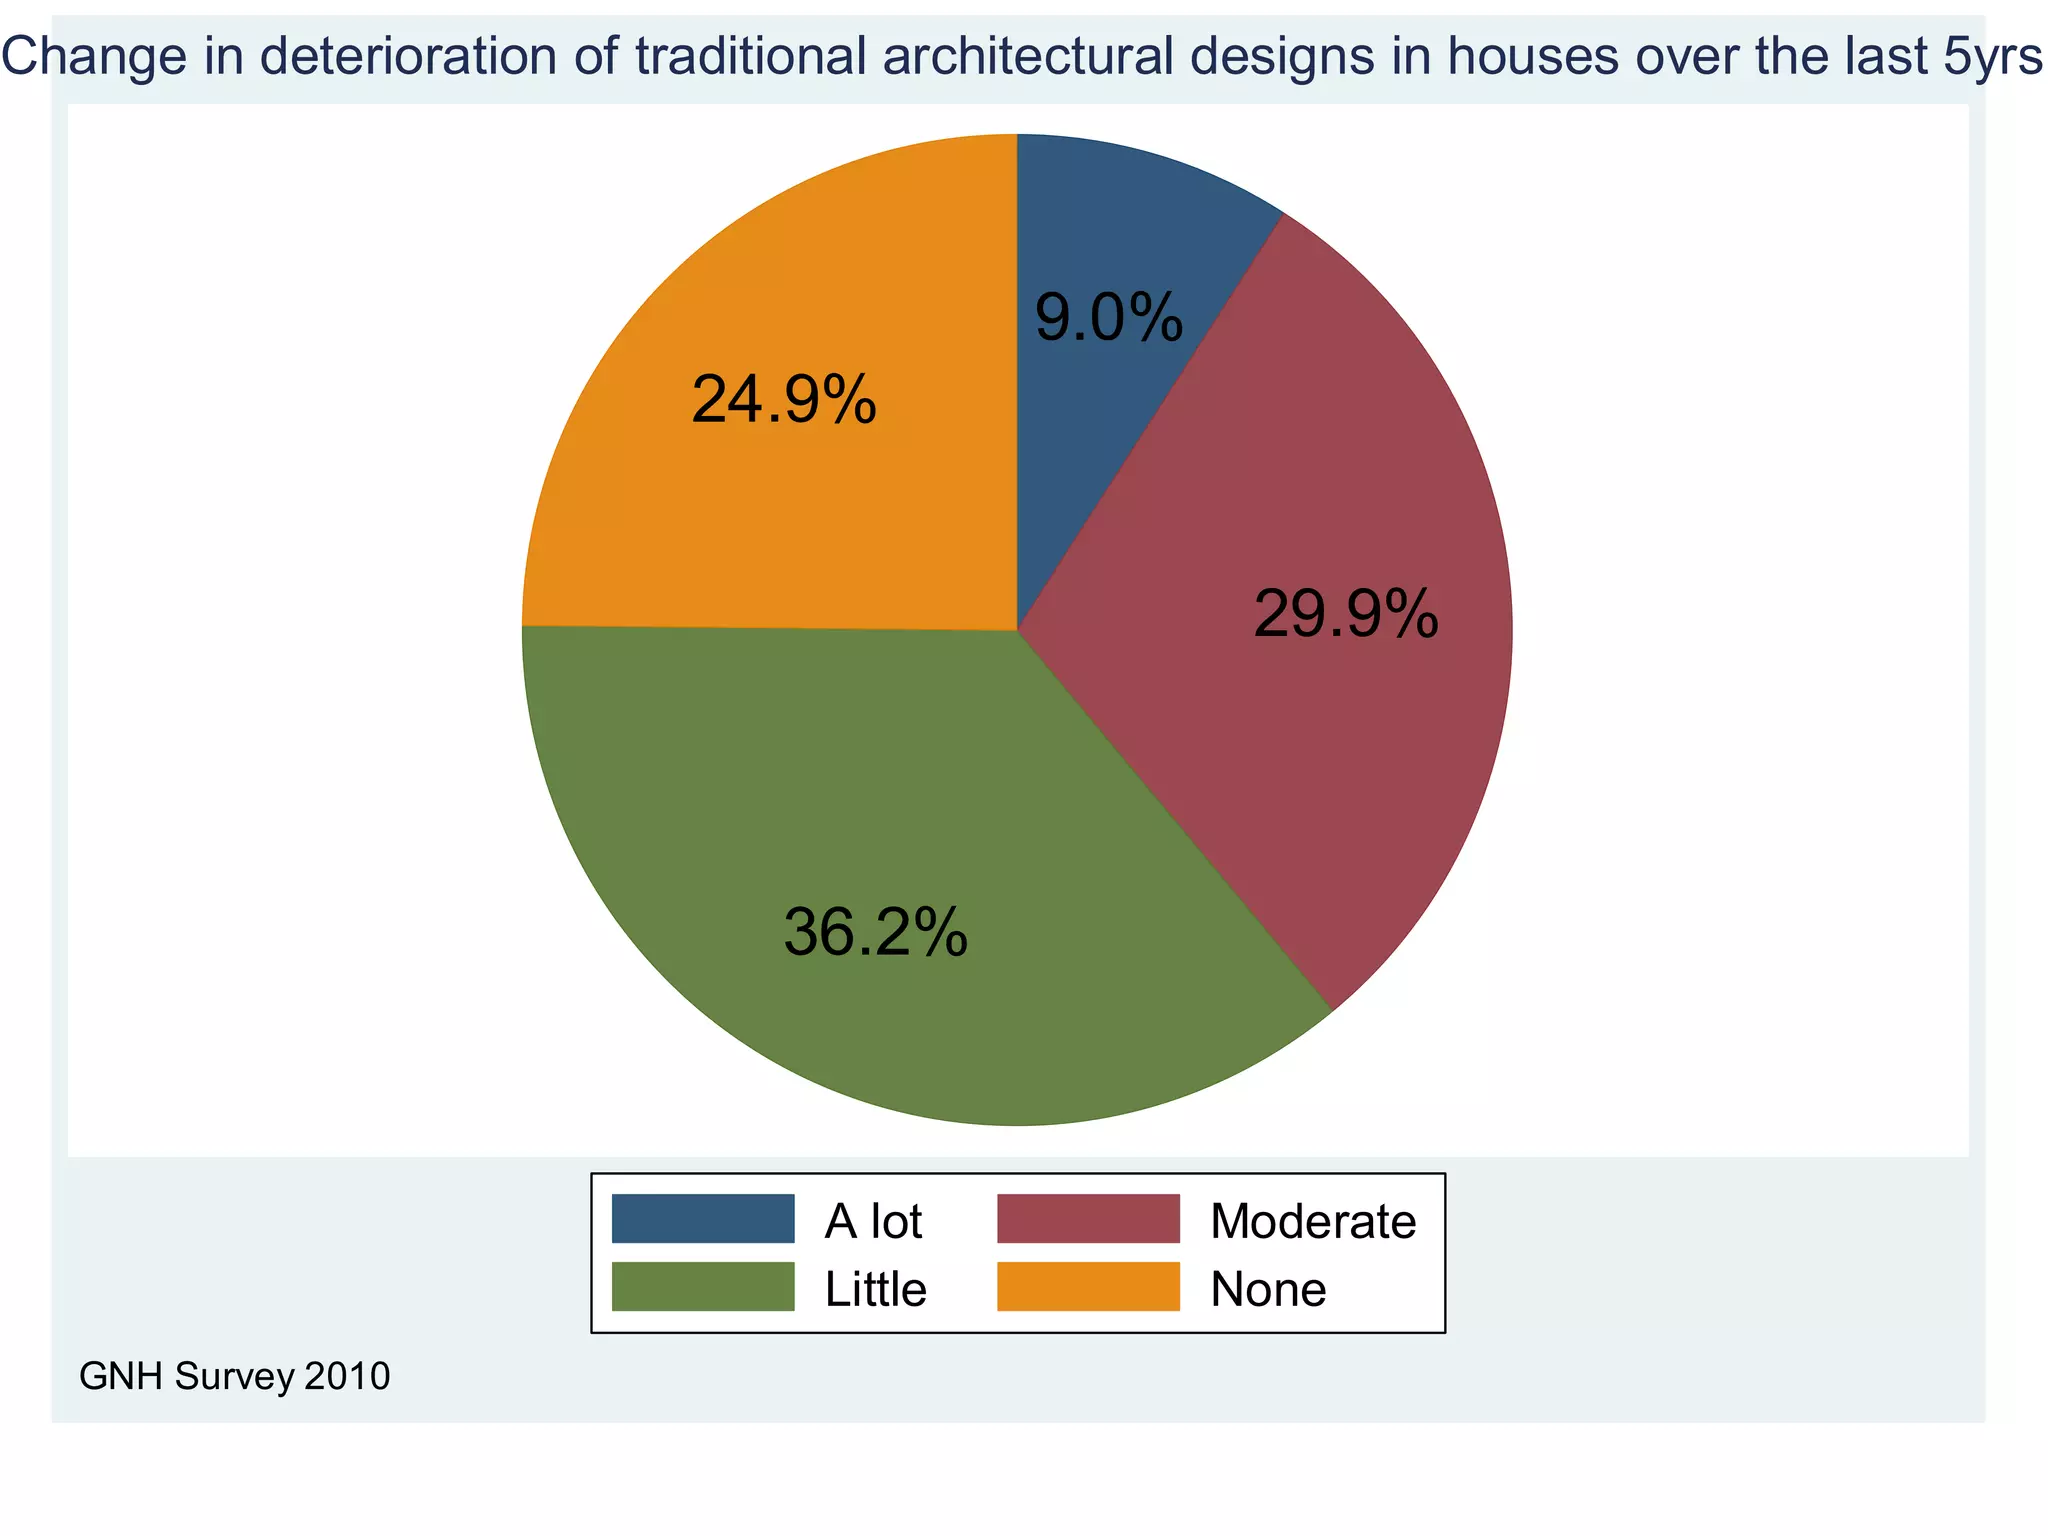
- Cultural diversity was strongly maintained, with nearly universal importance placed on traditions and high levels of respect reported between children and elders.
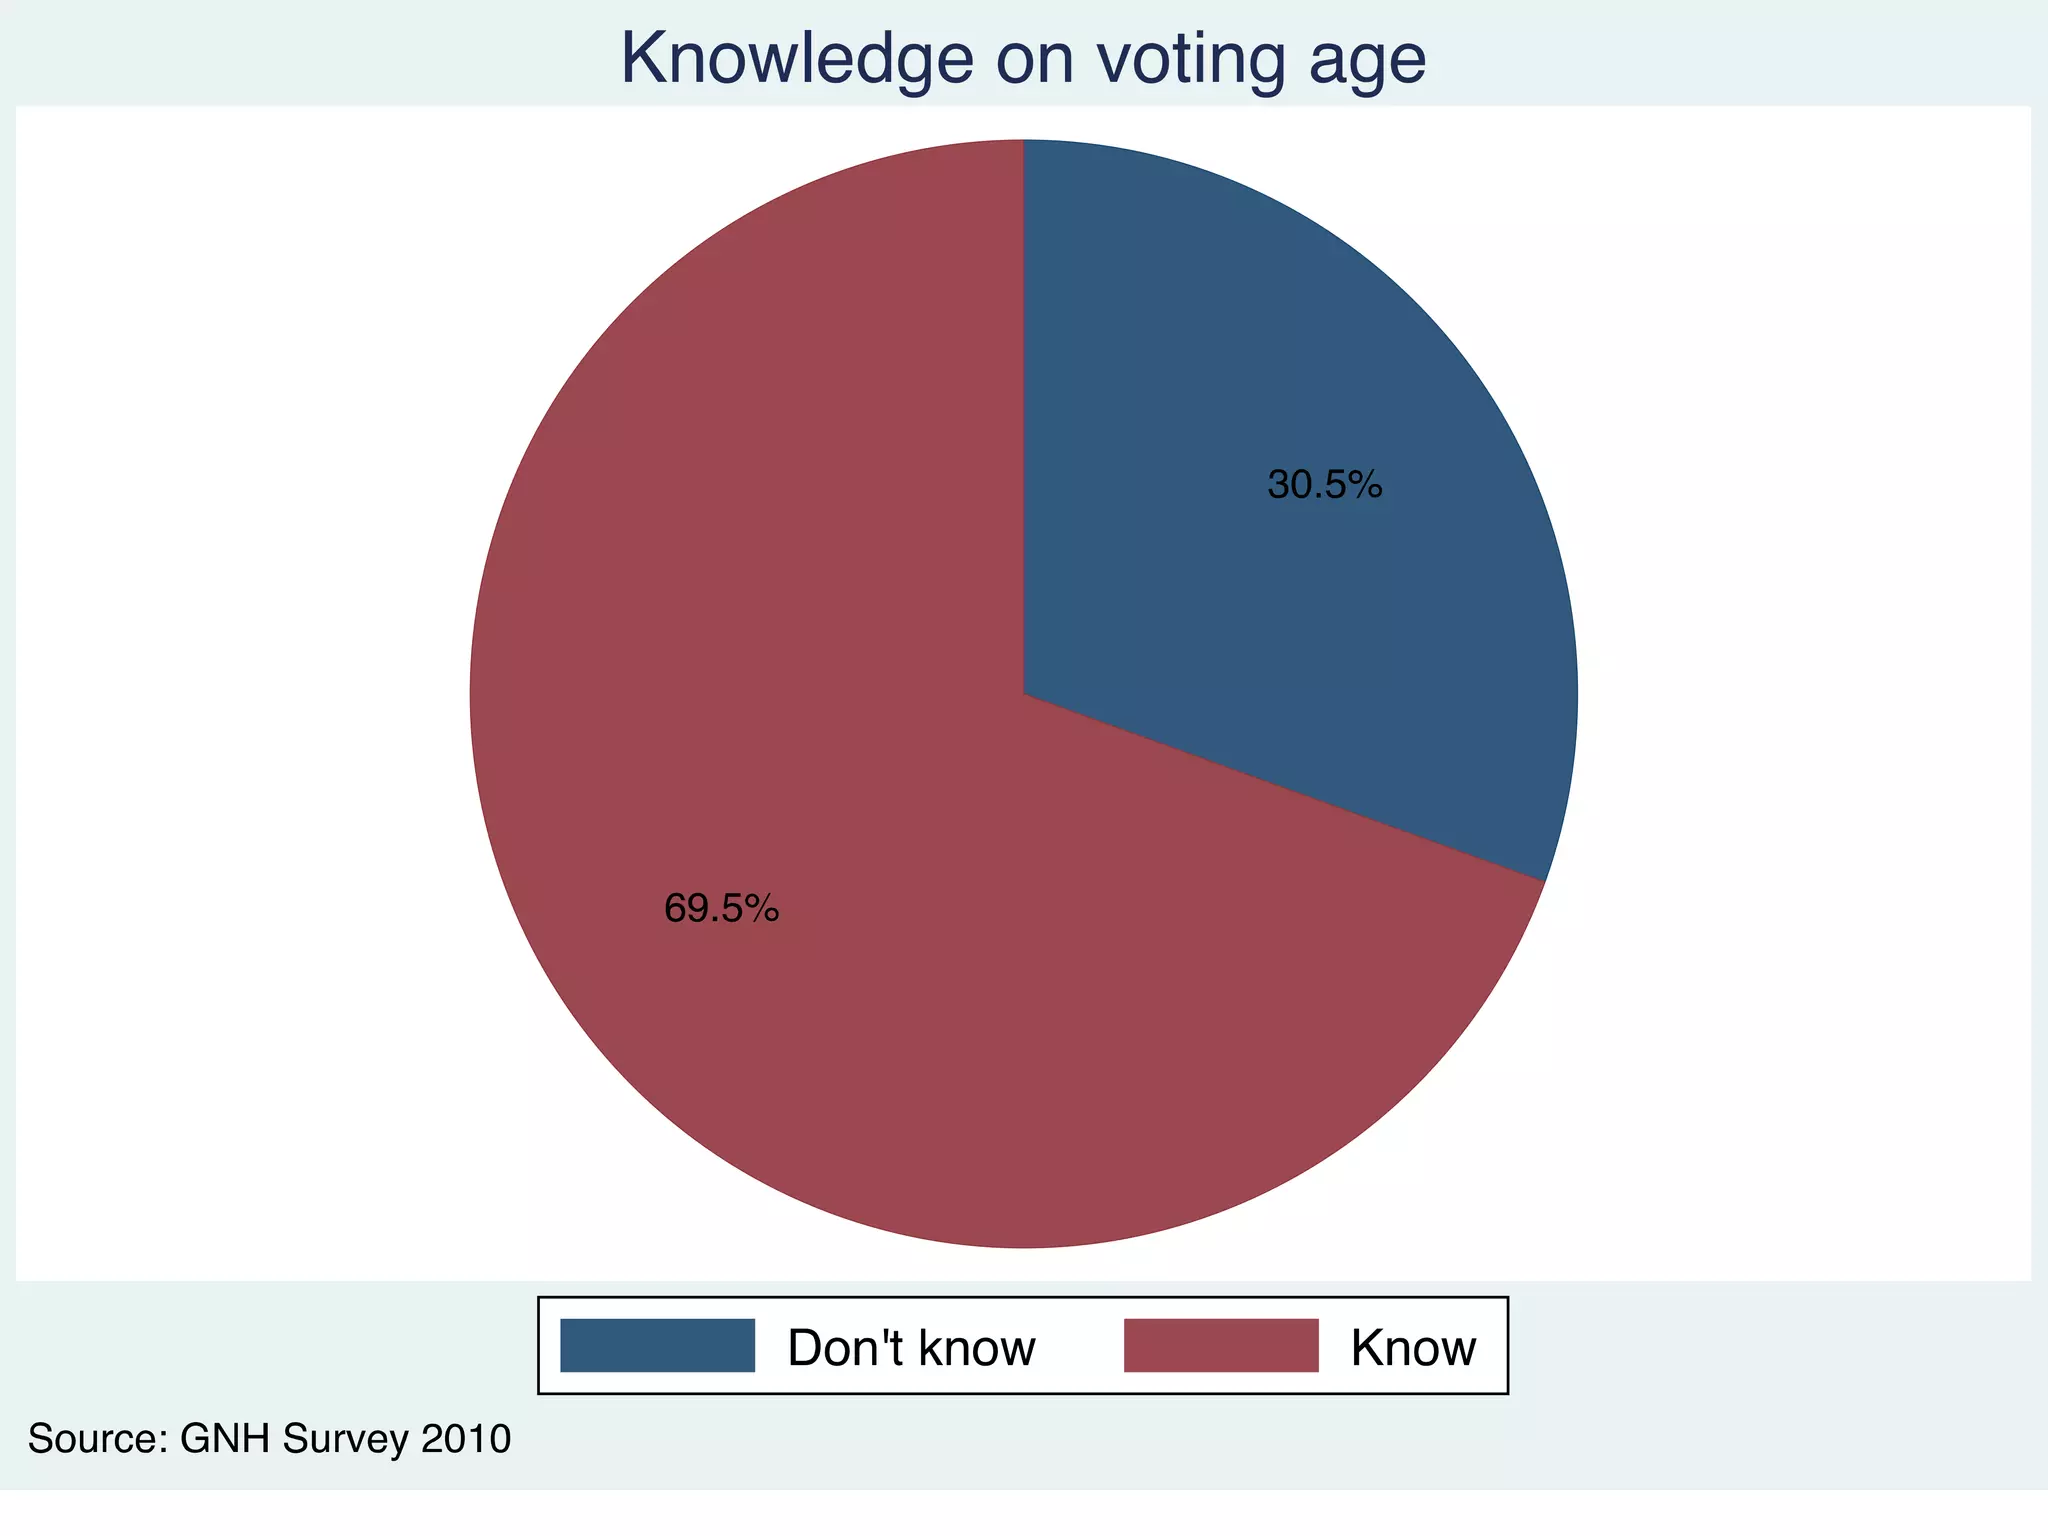
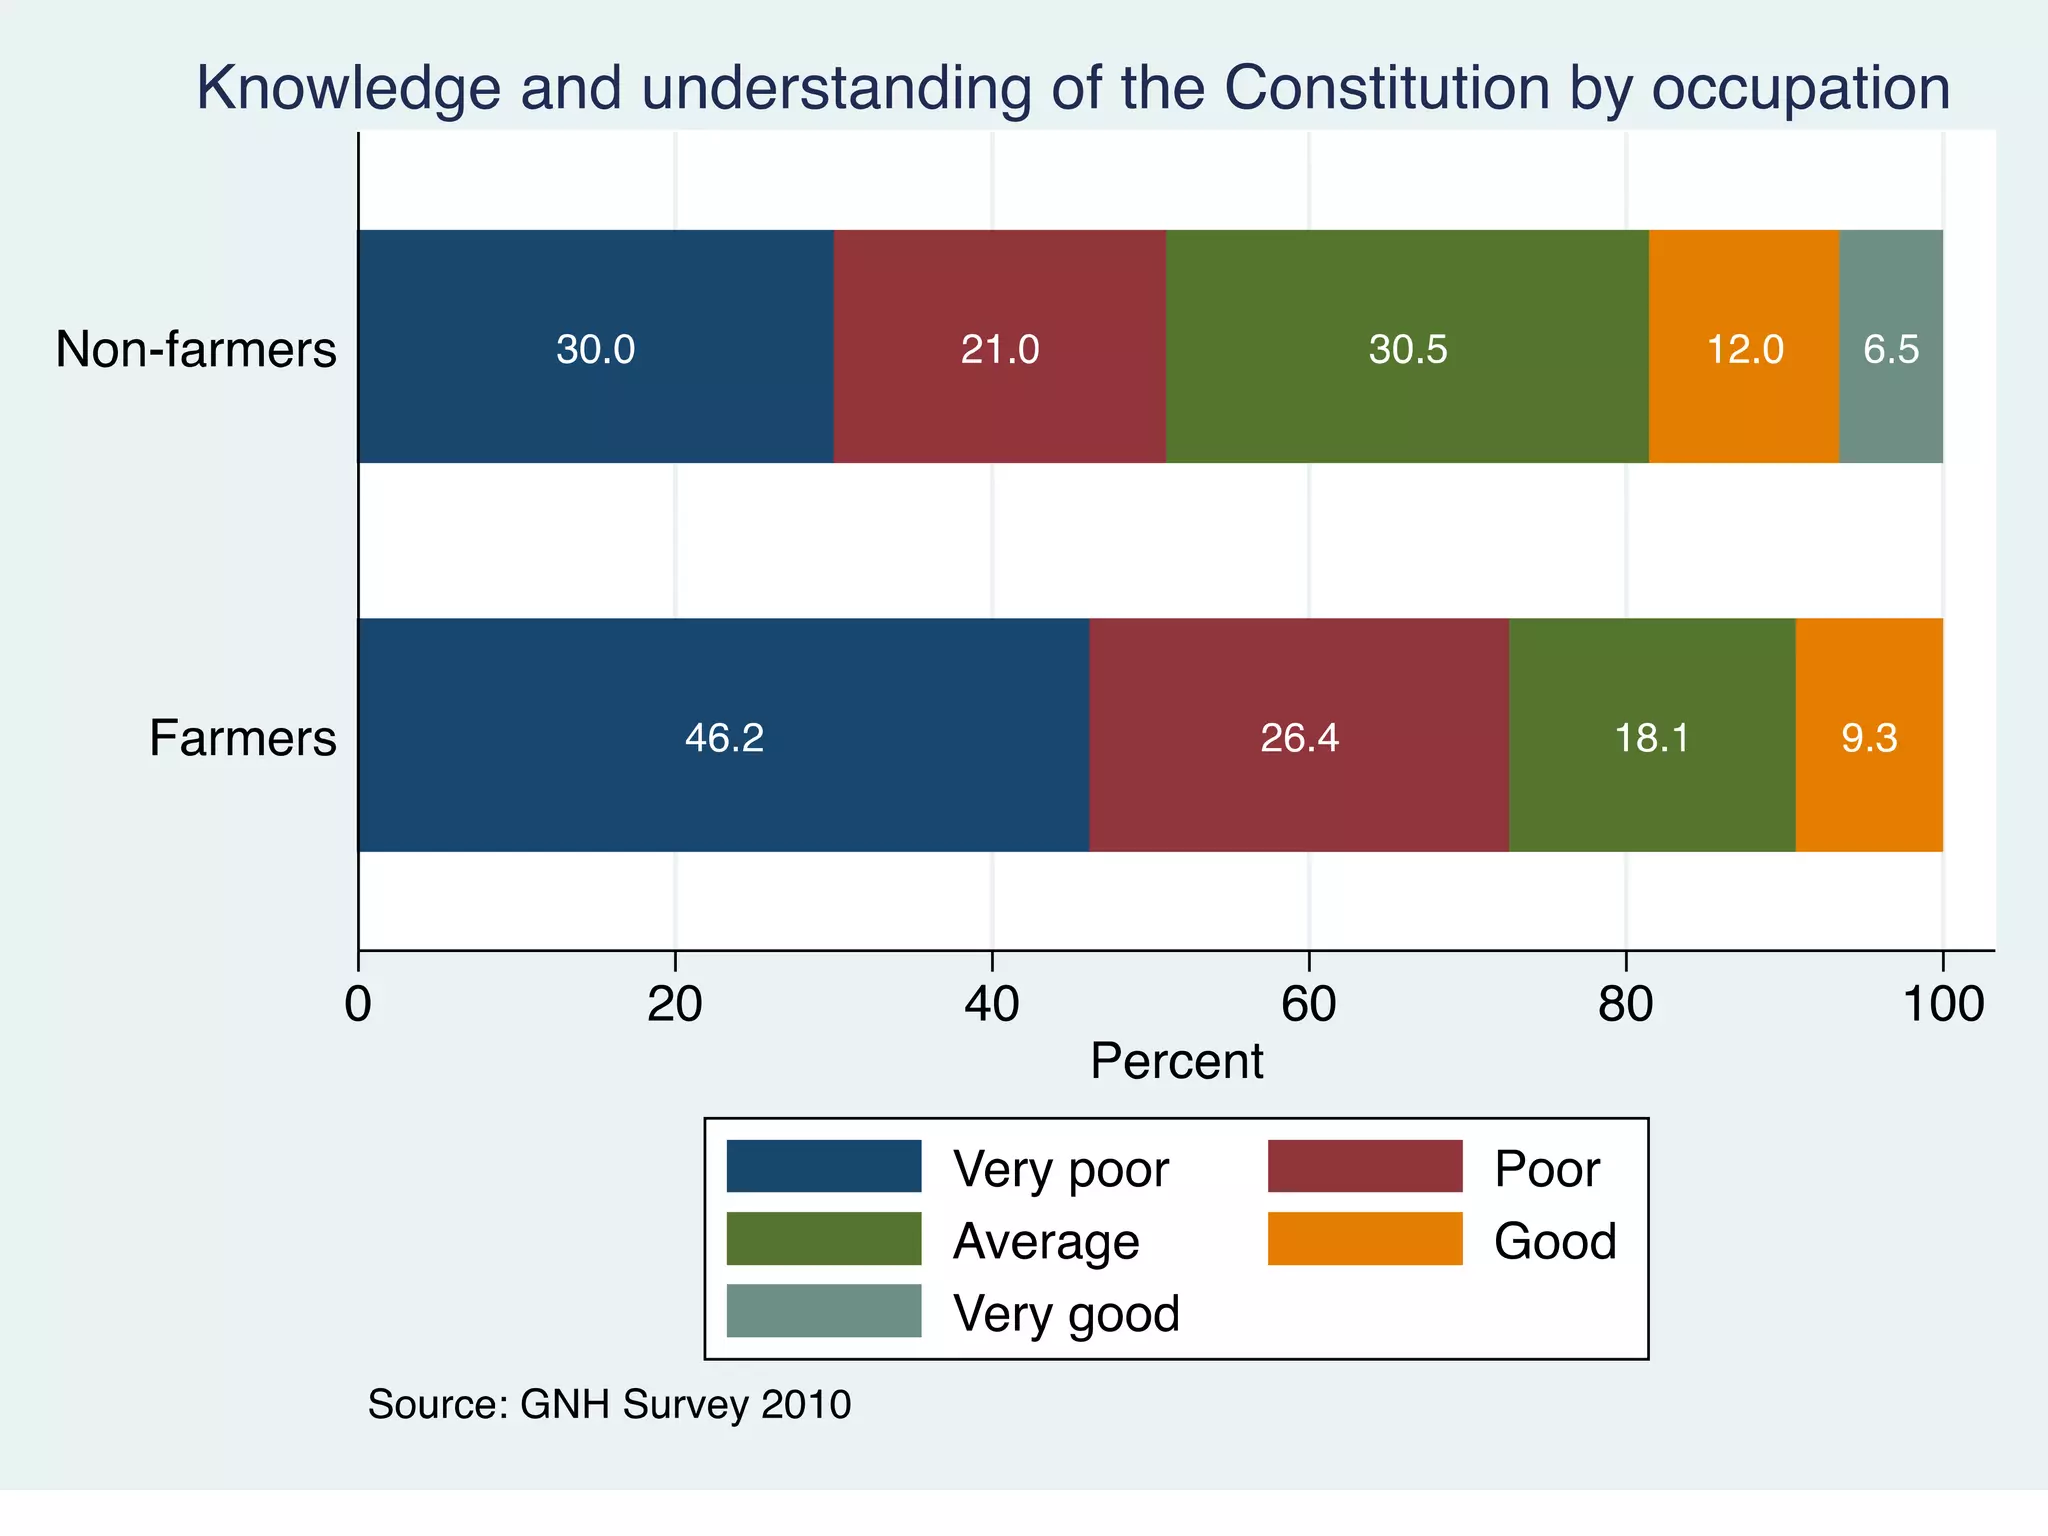
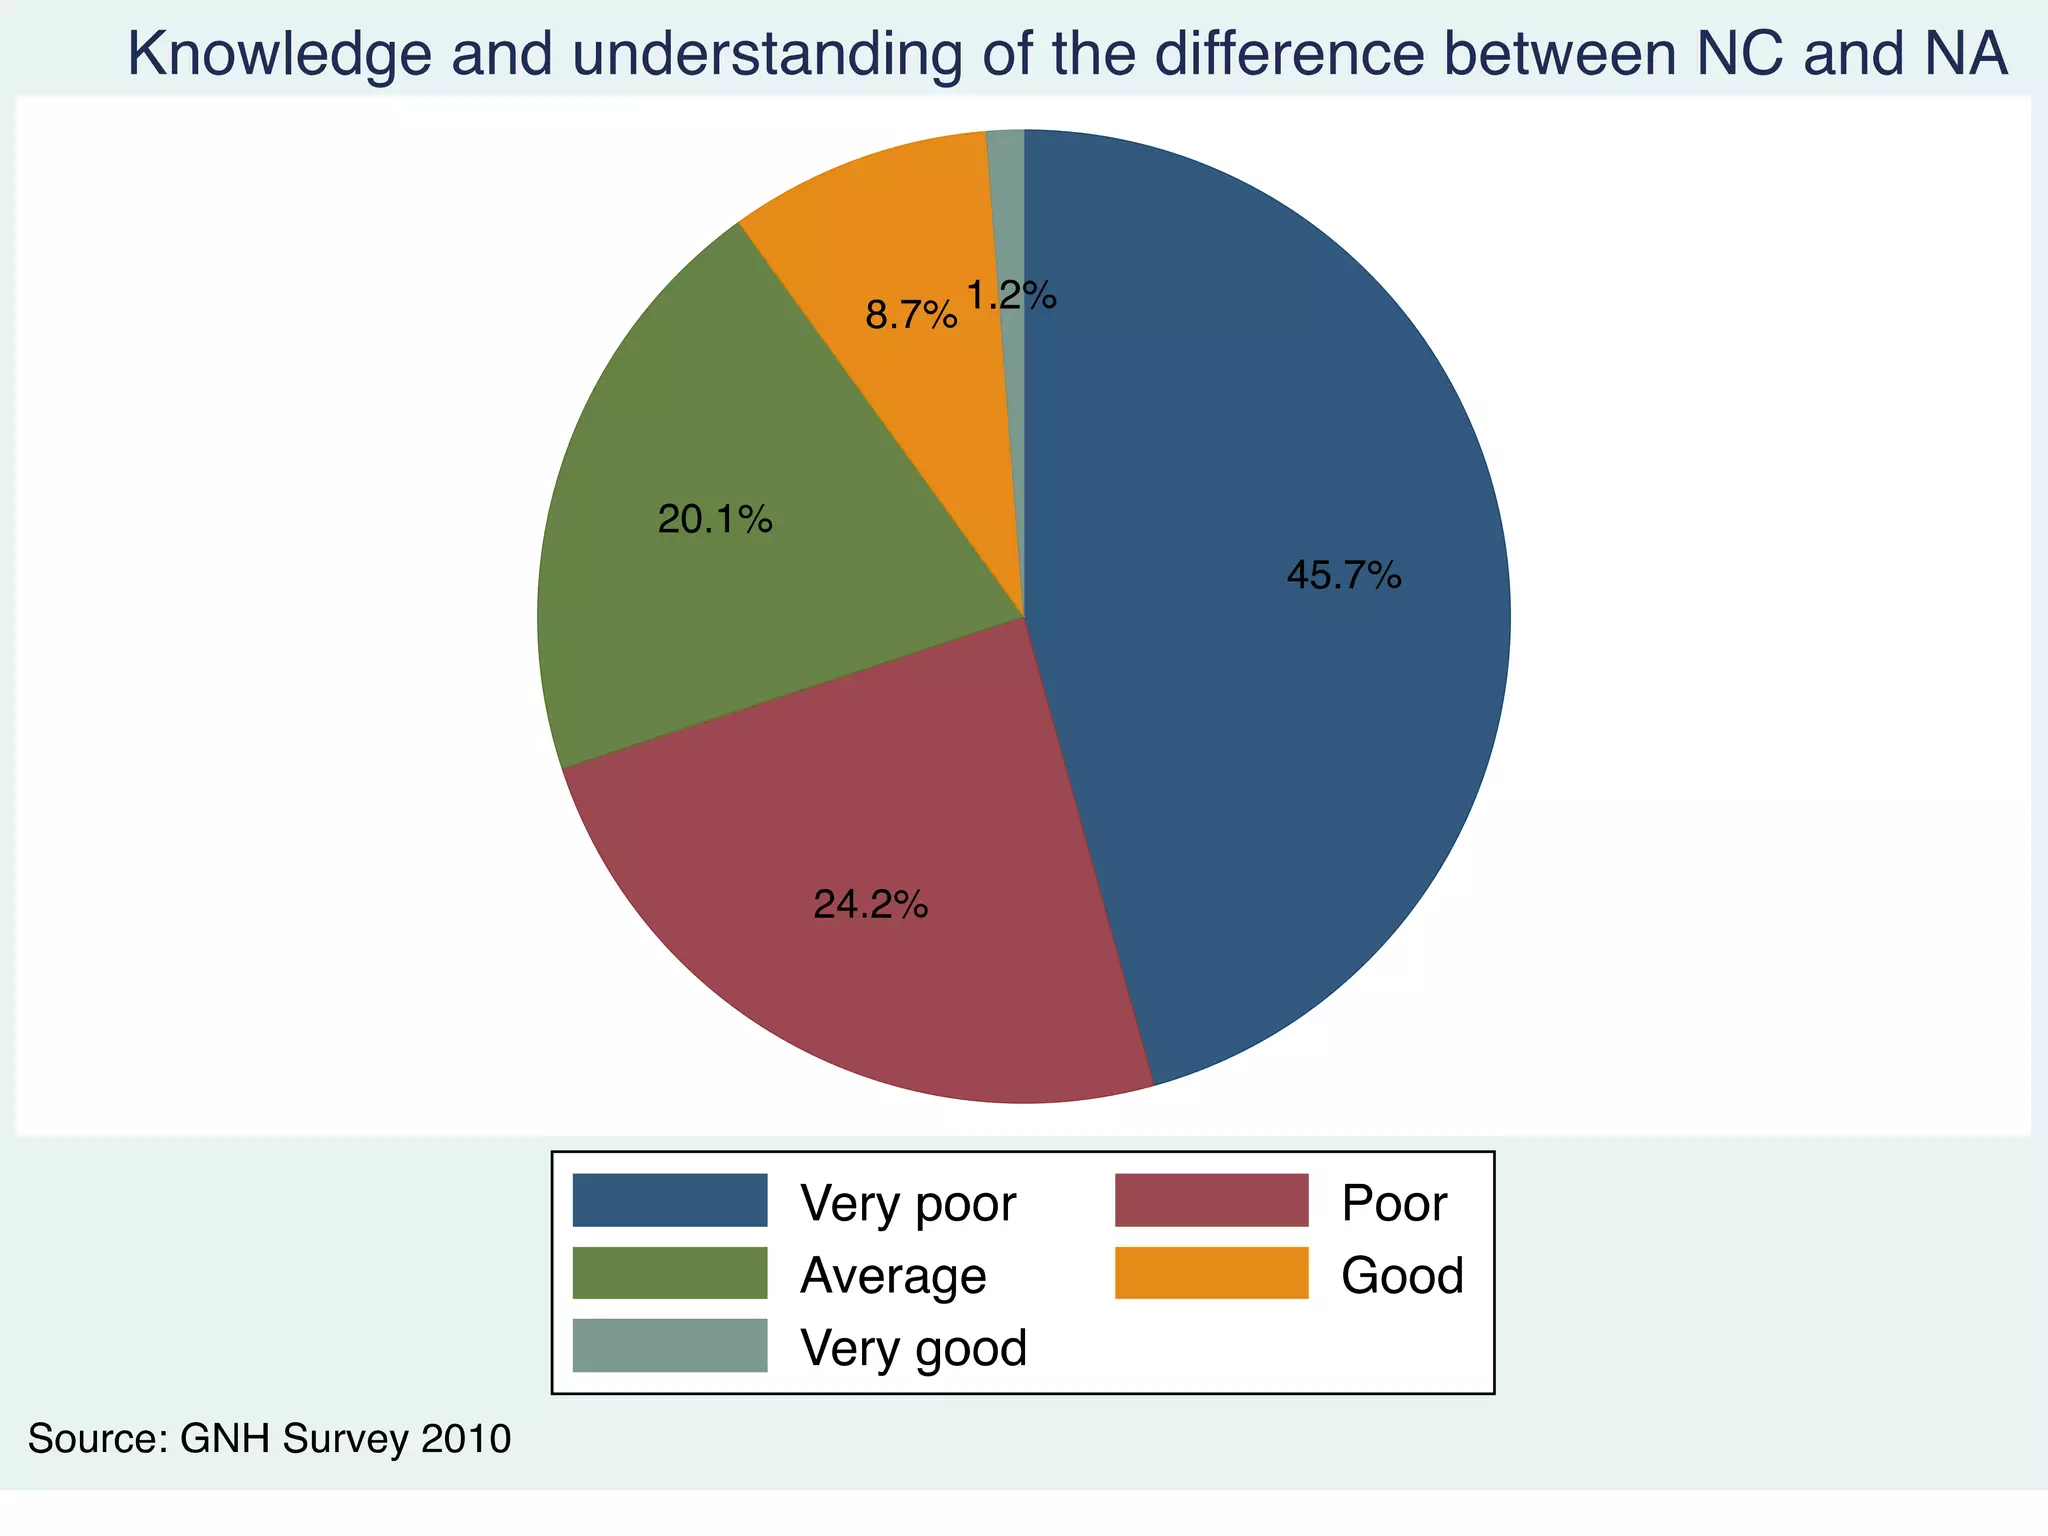
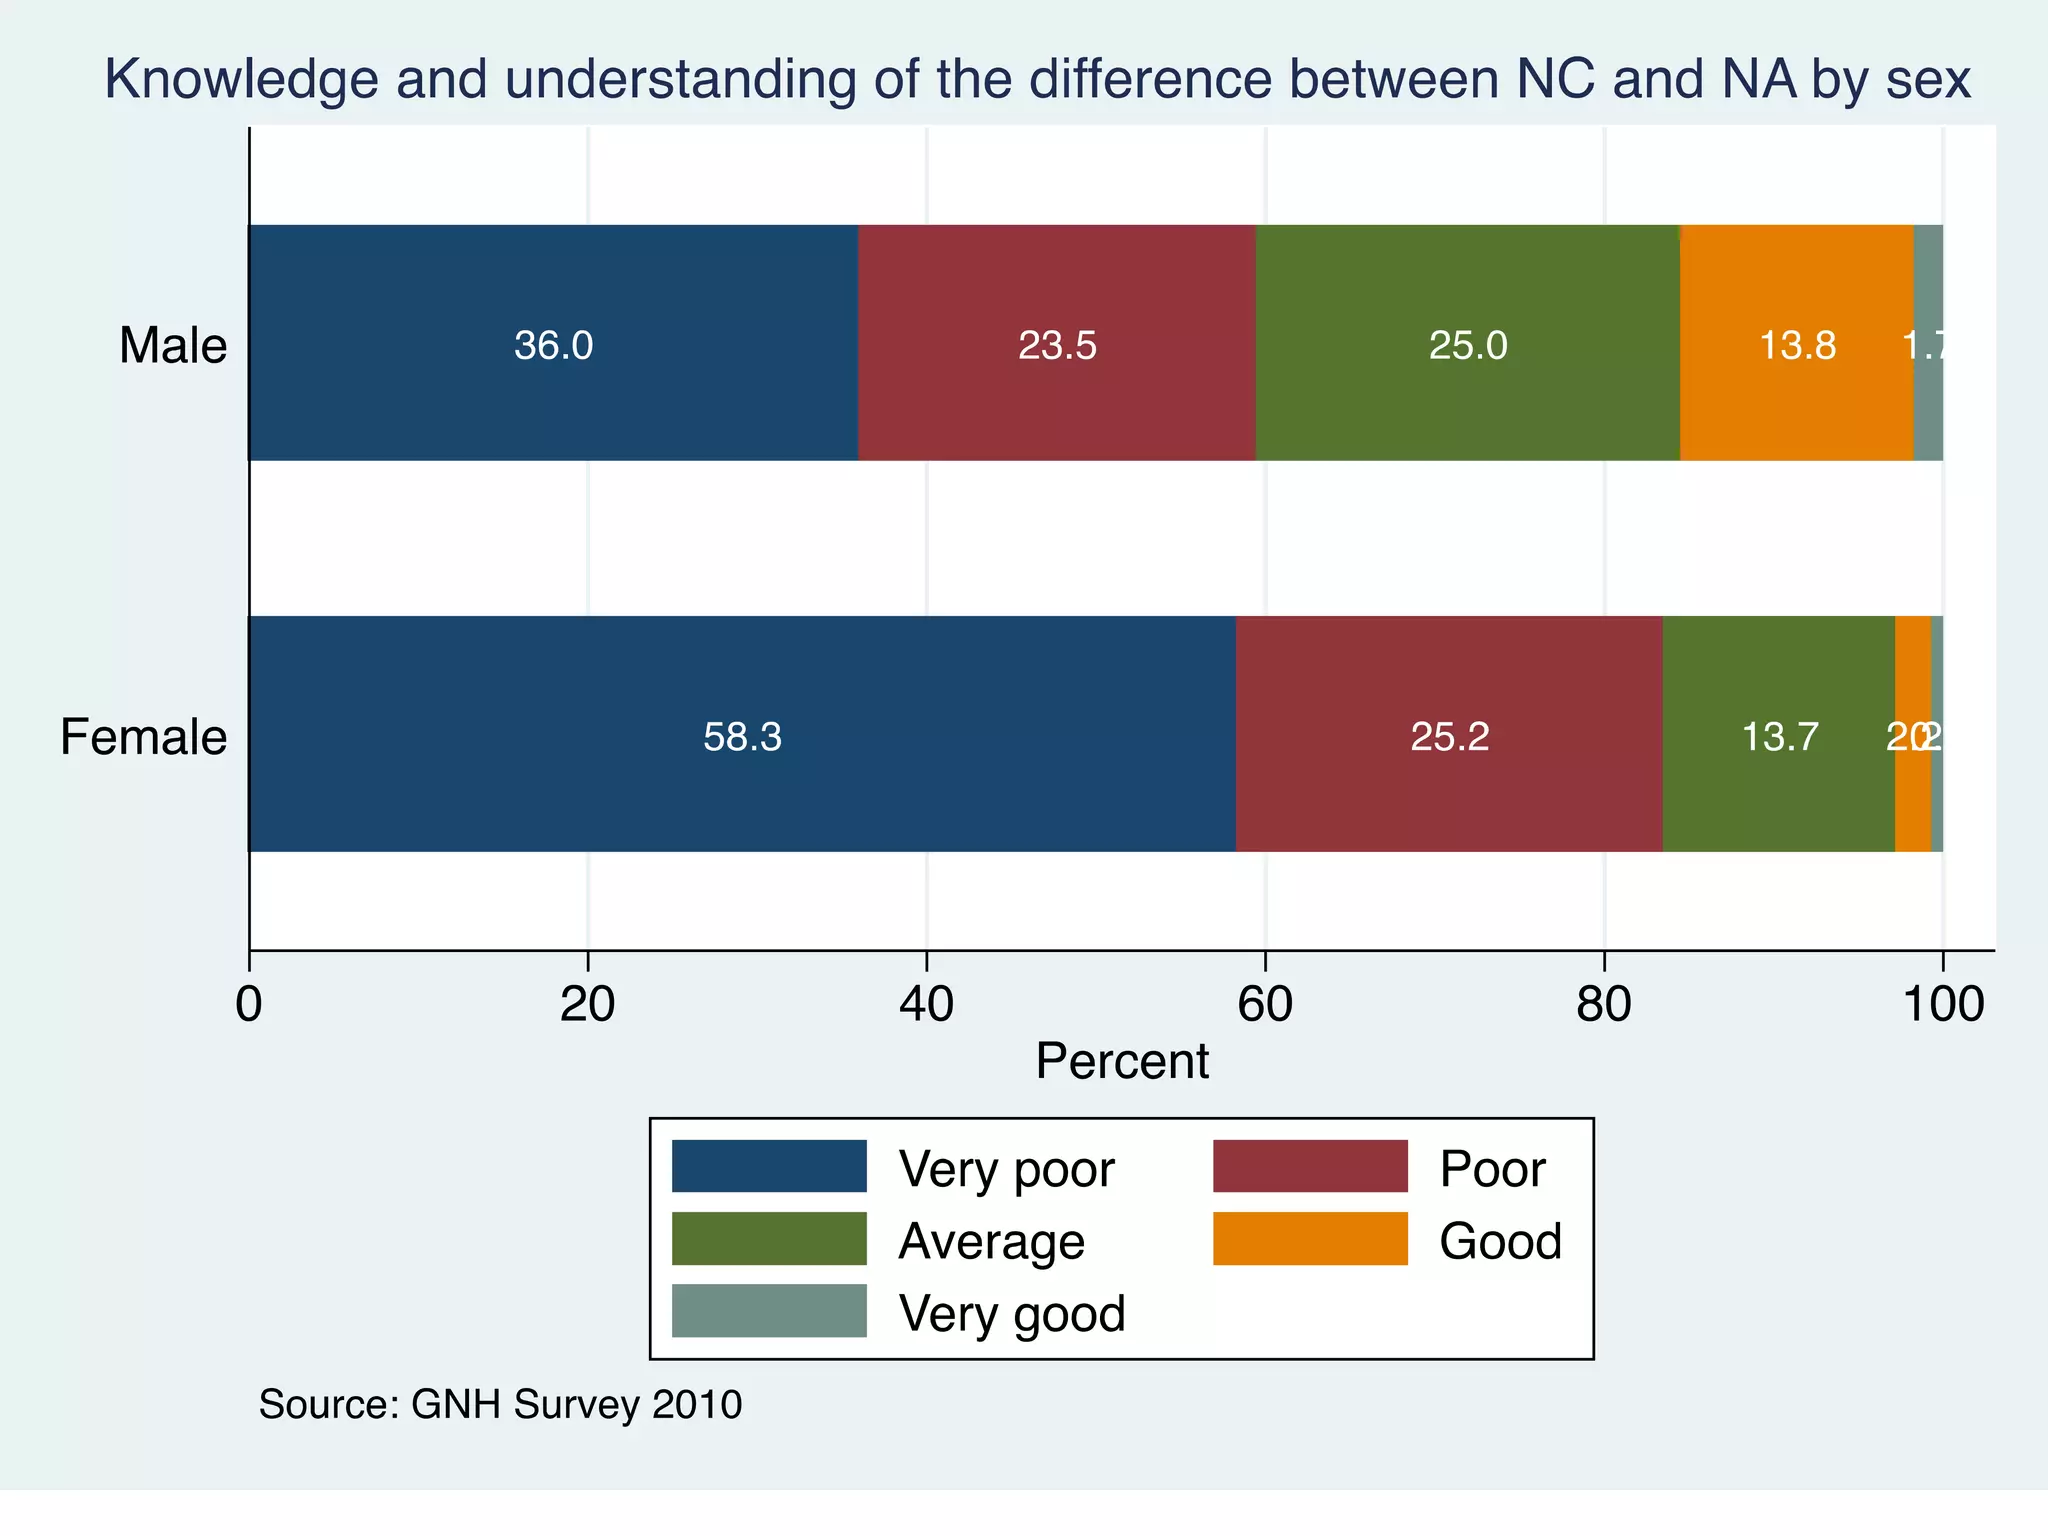
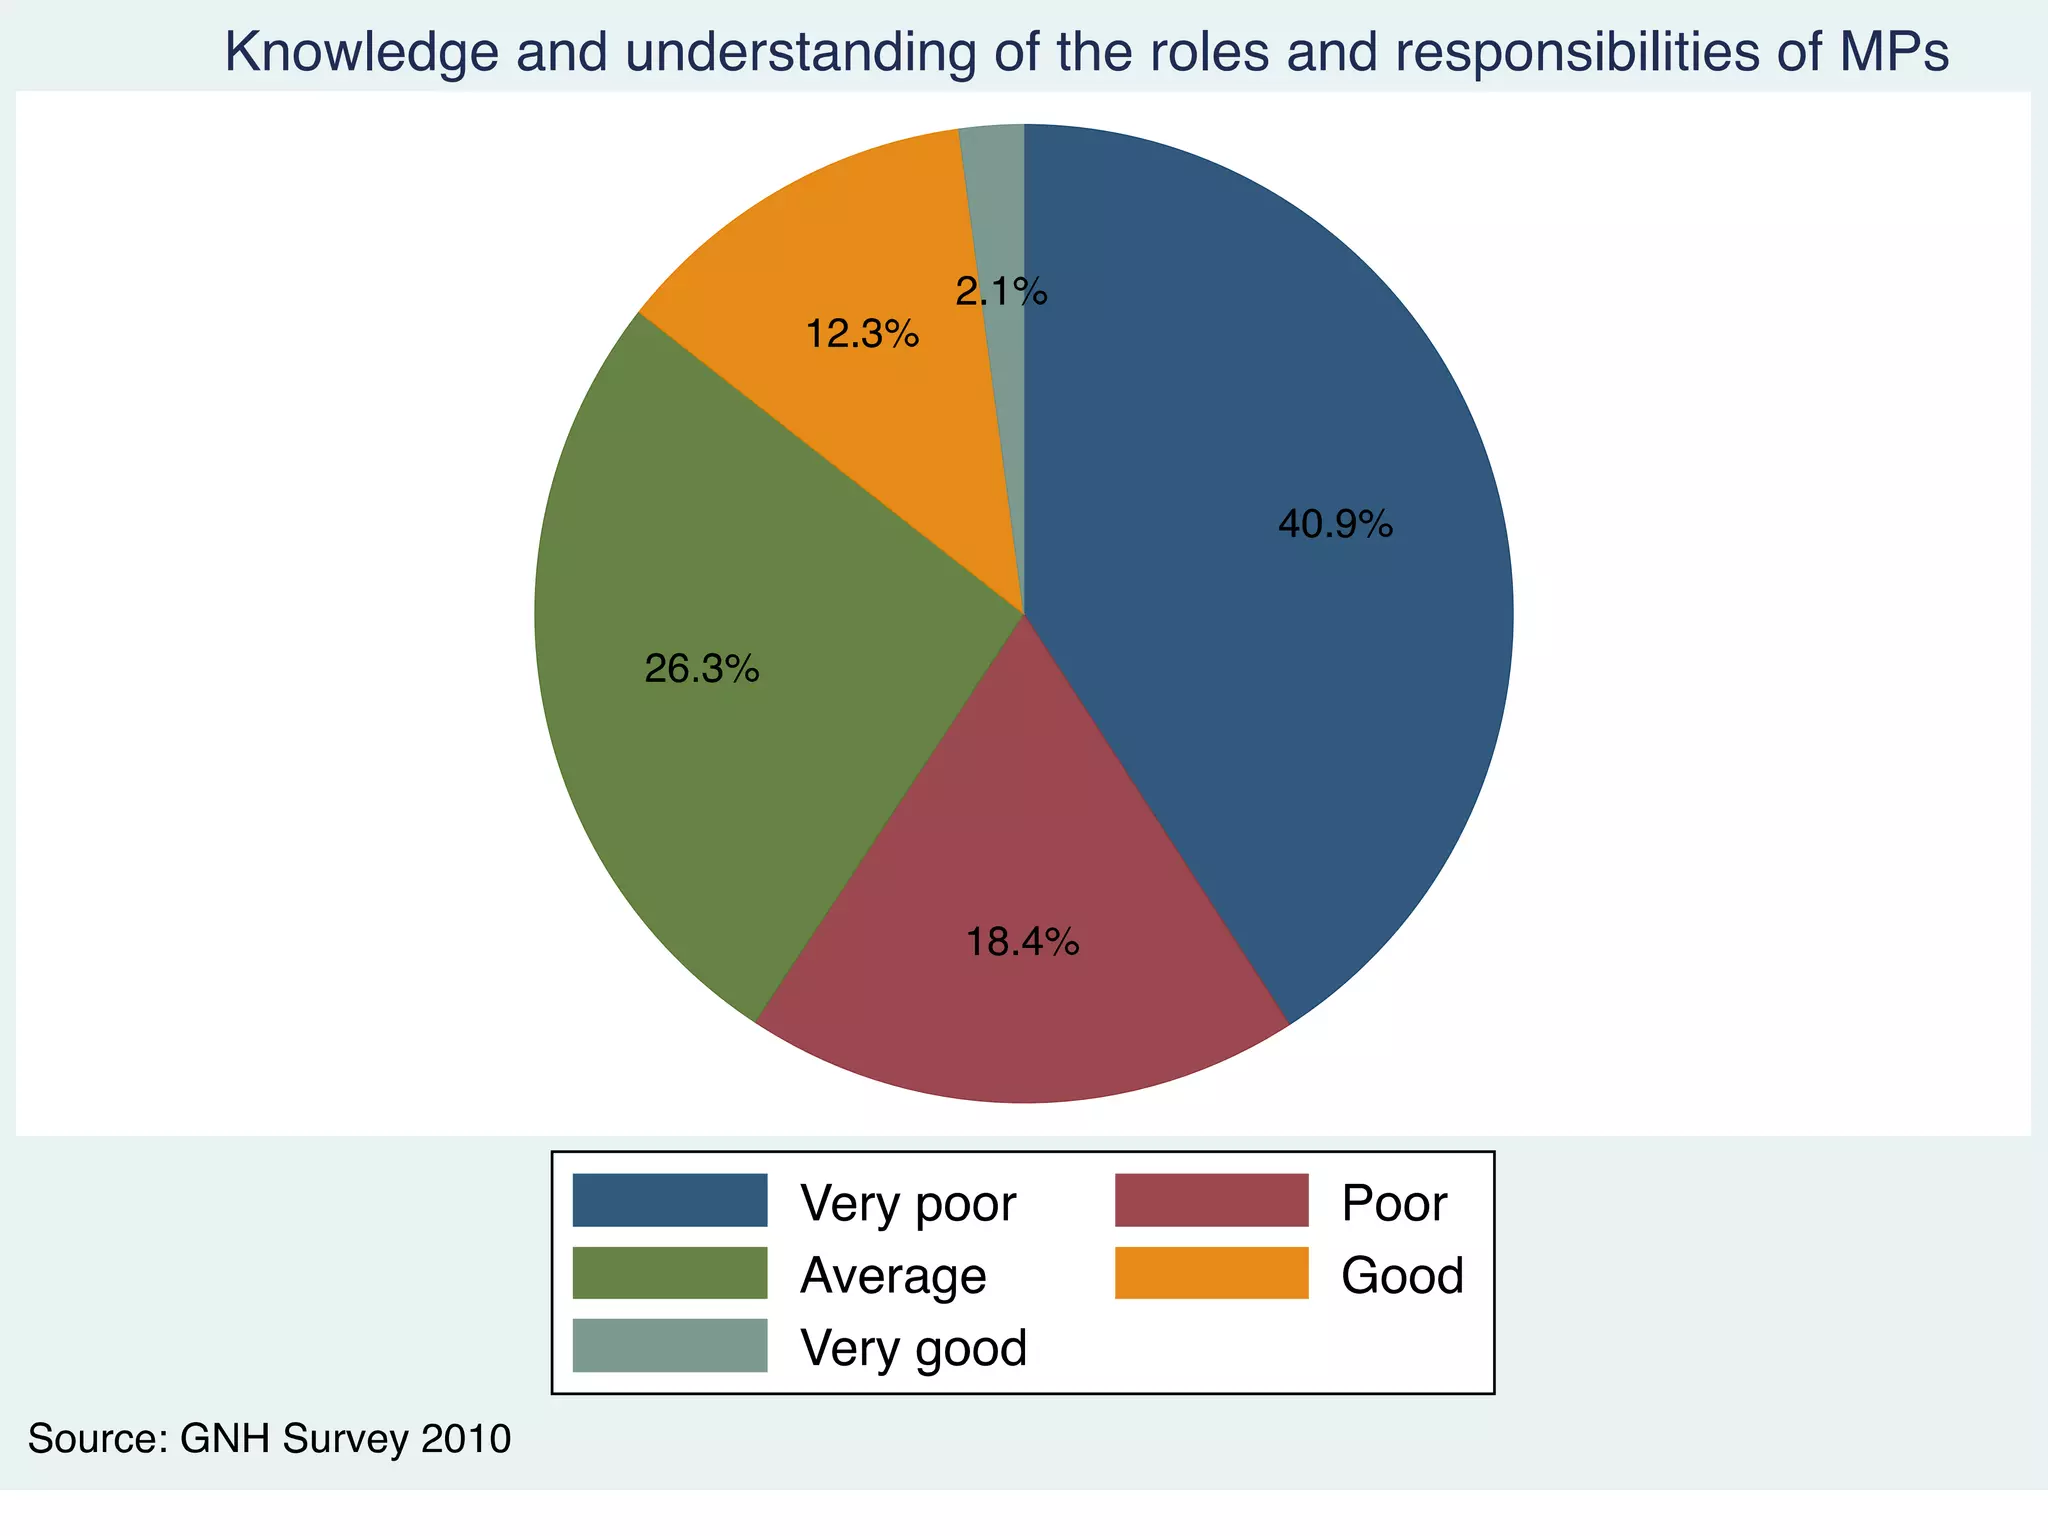
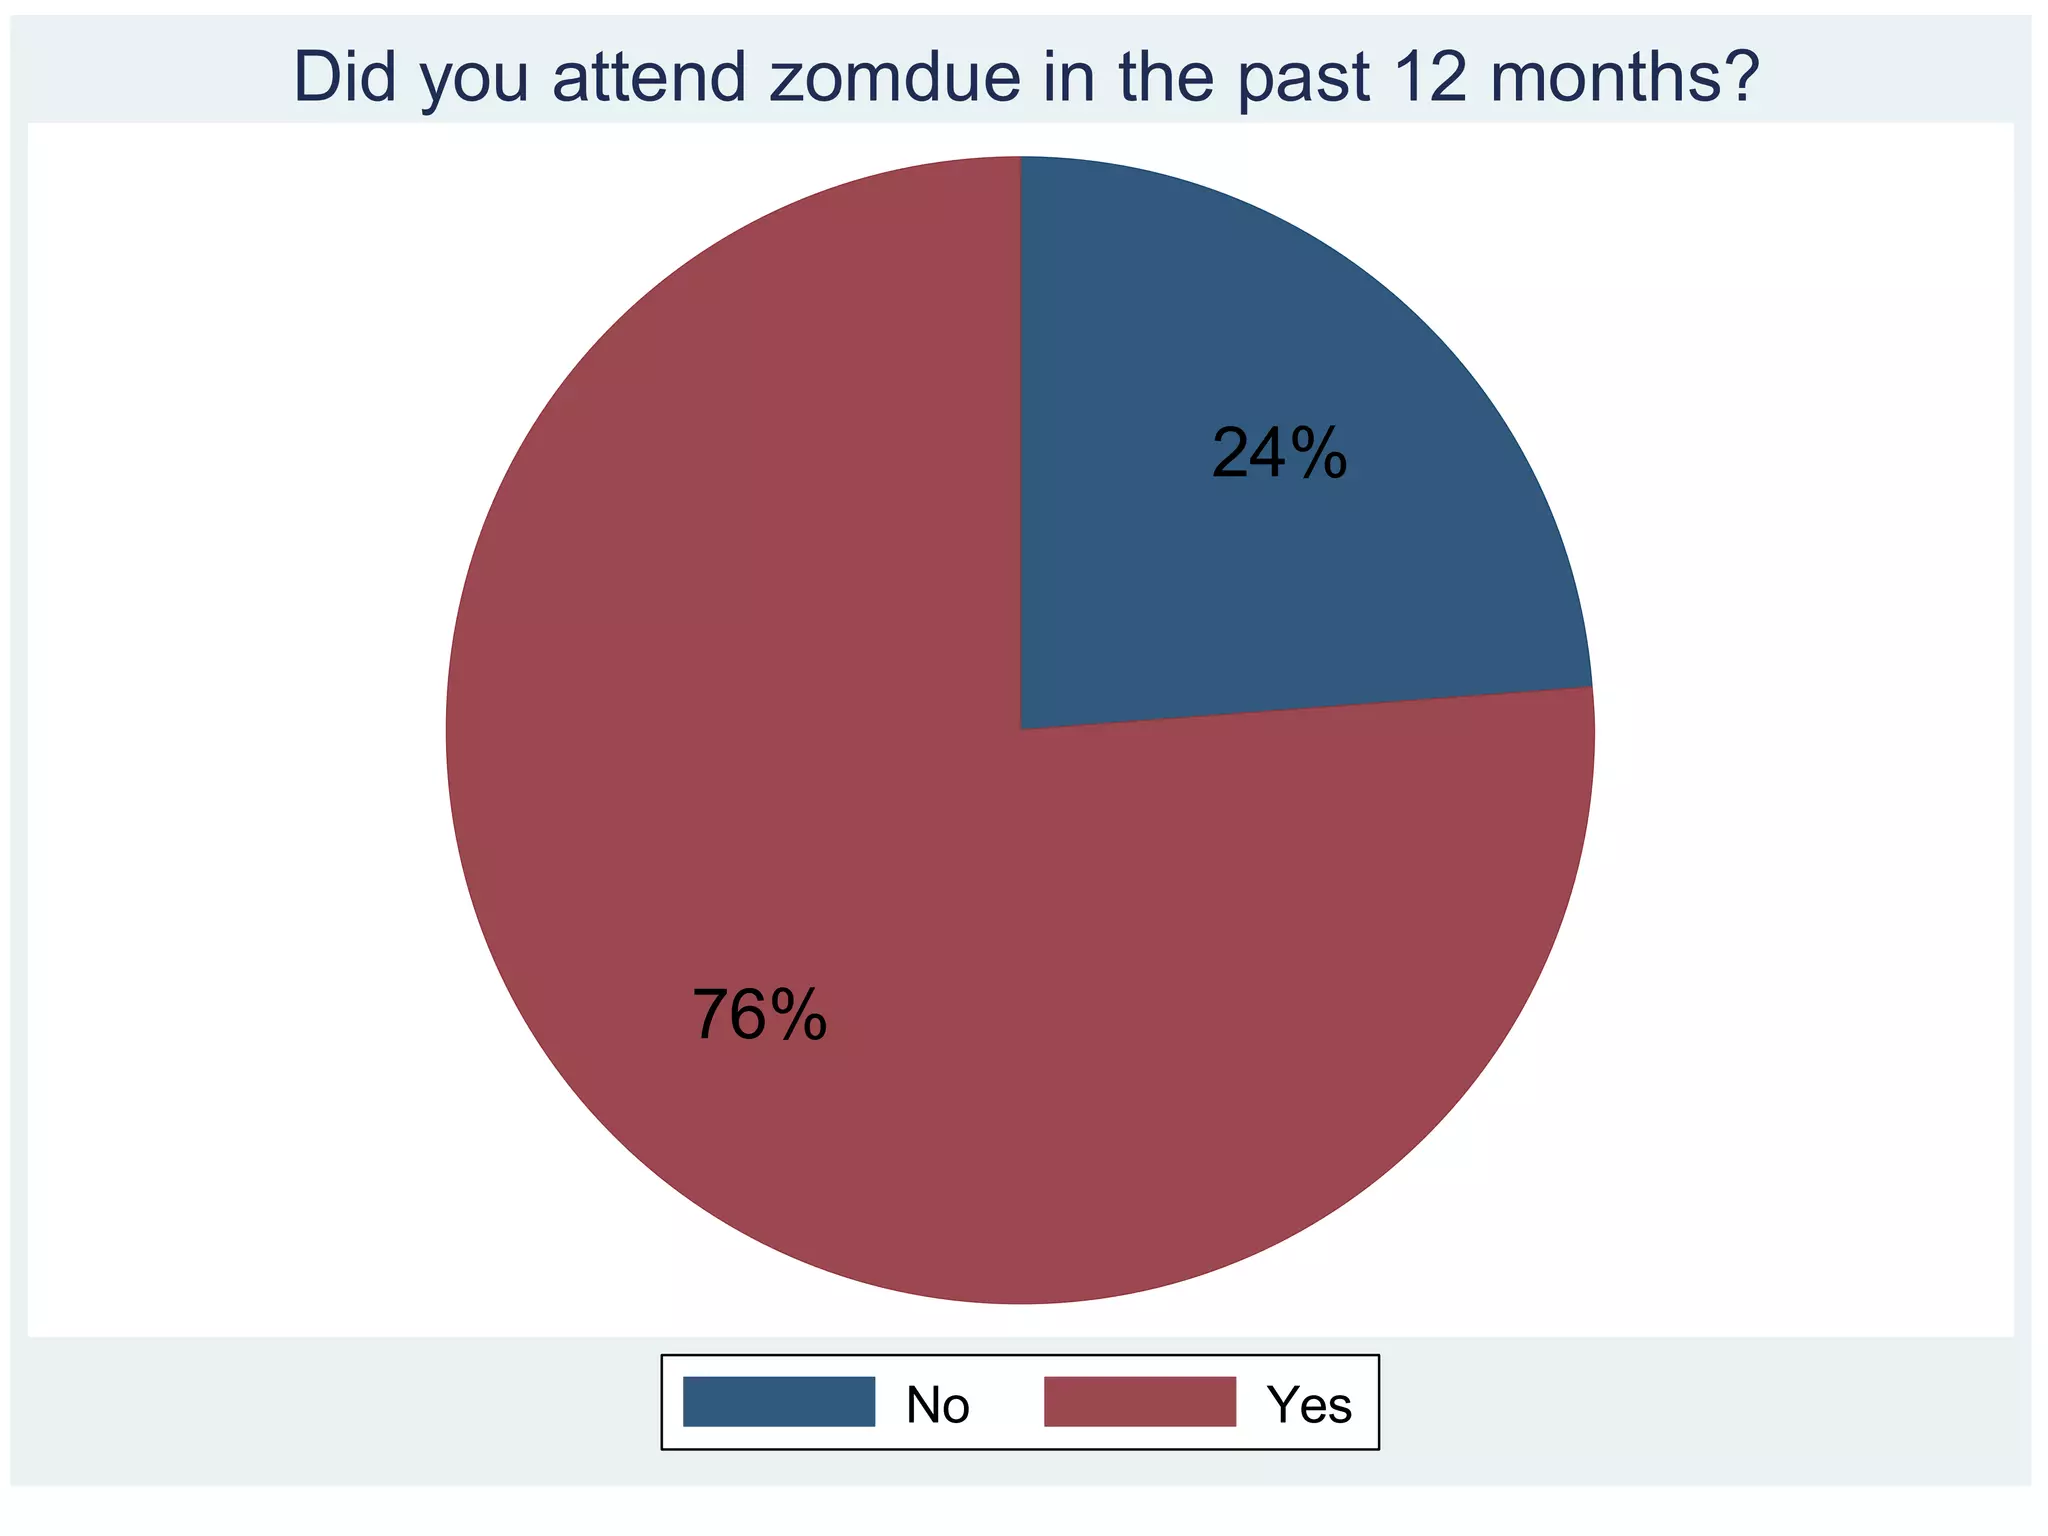
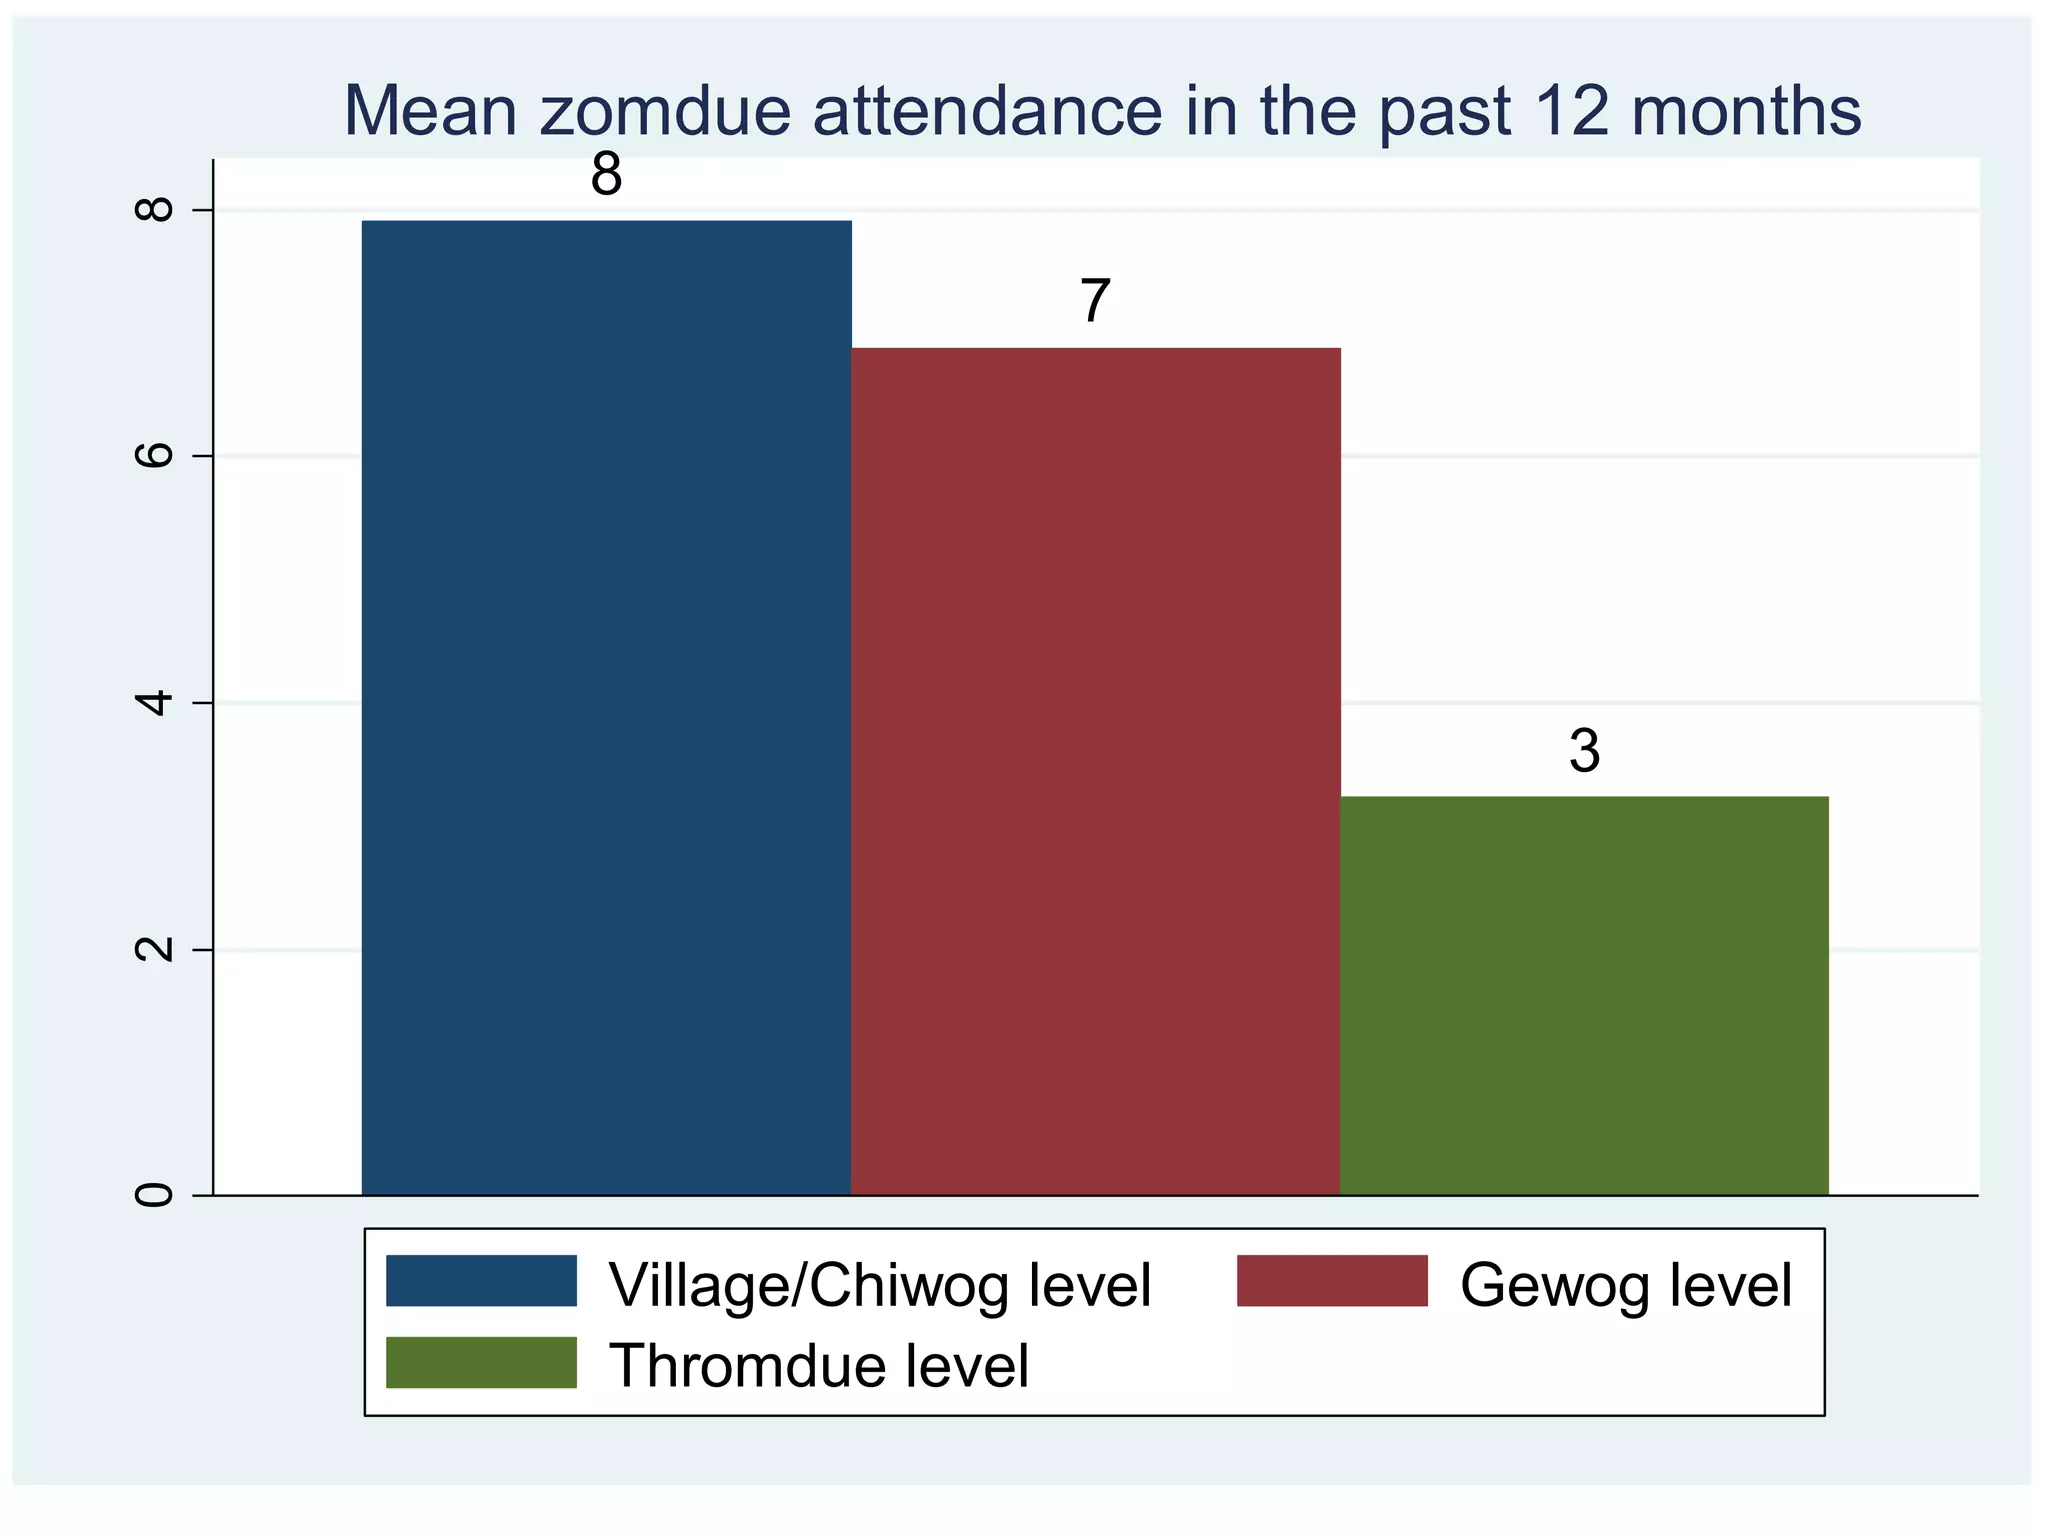
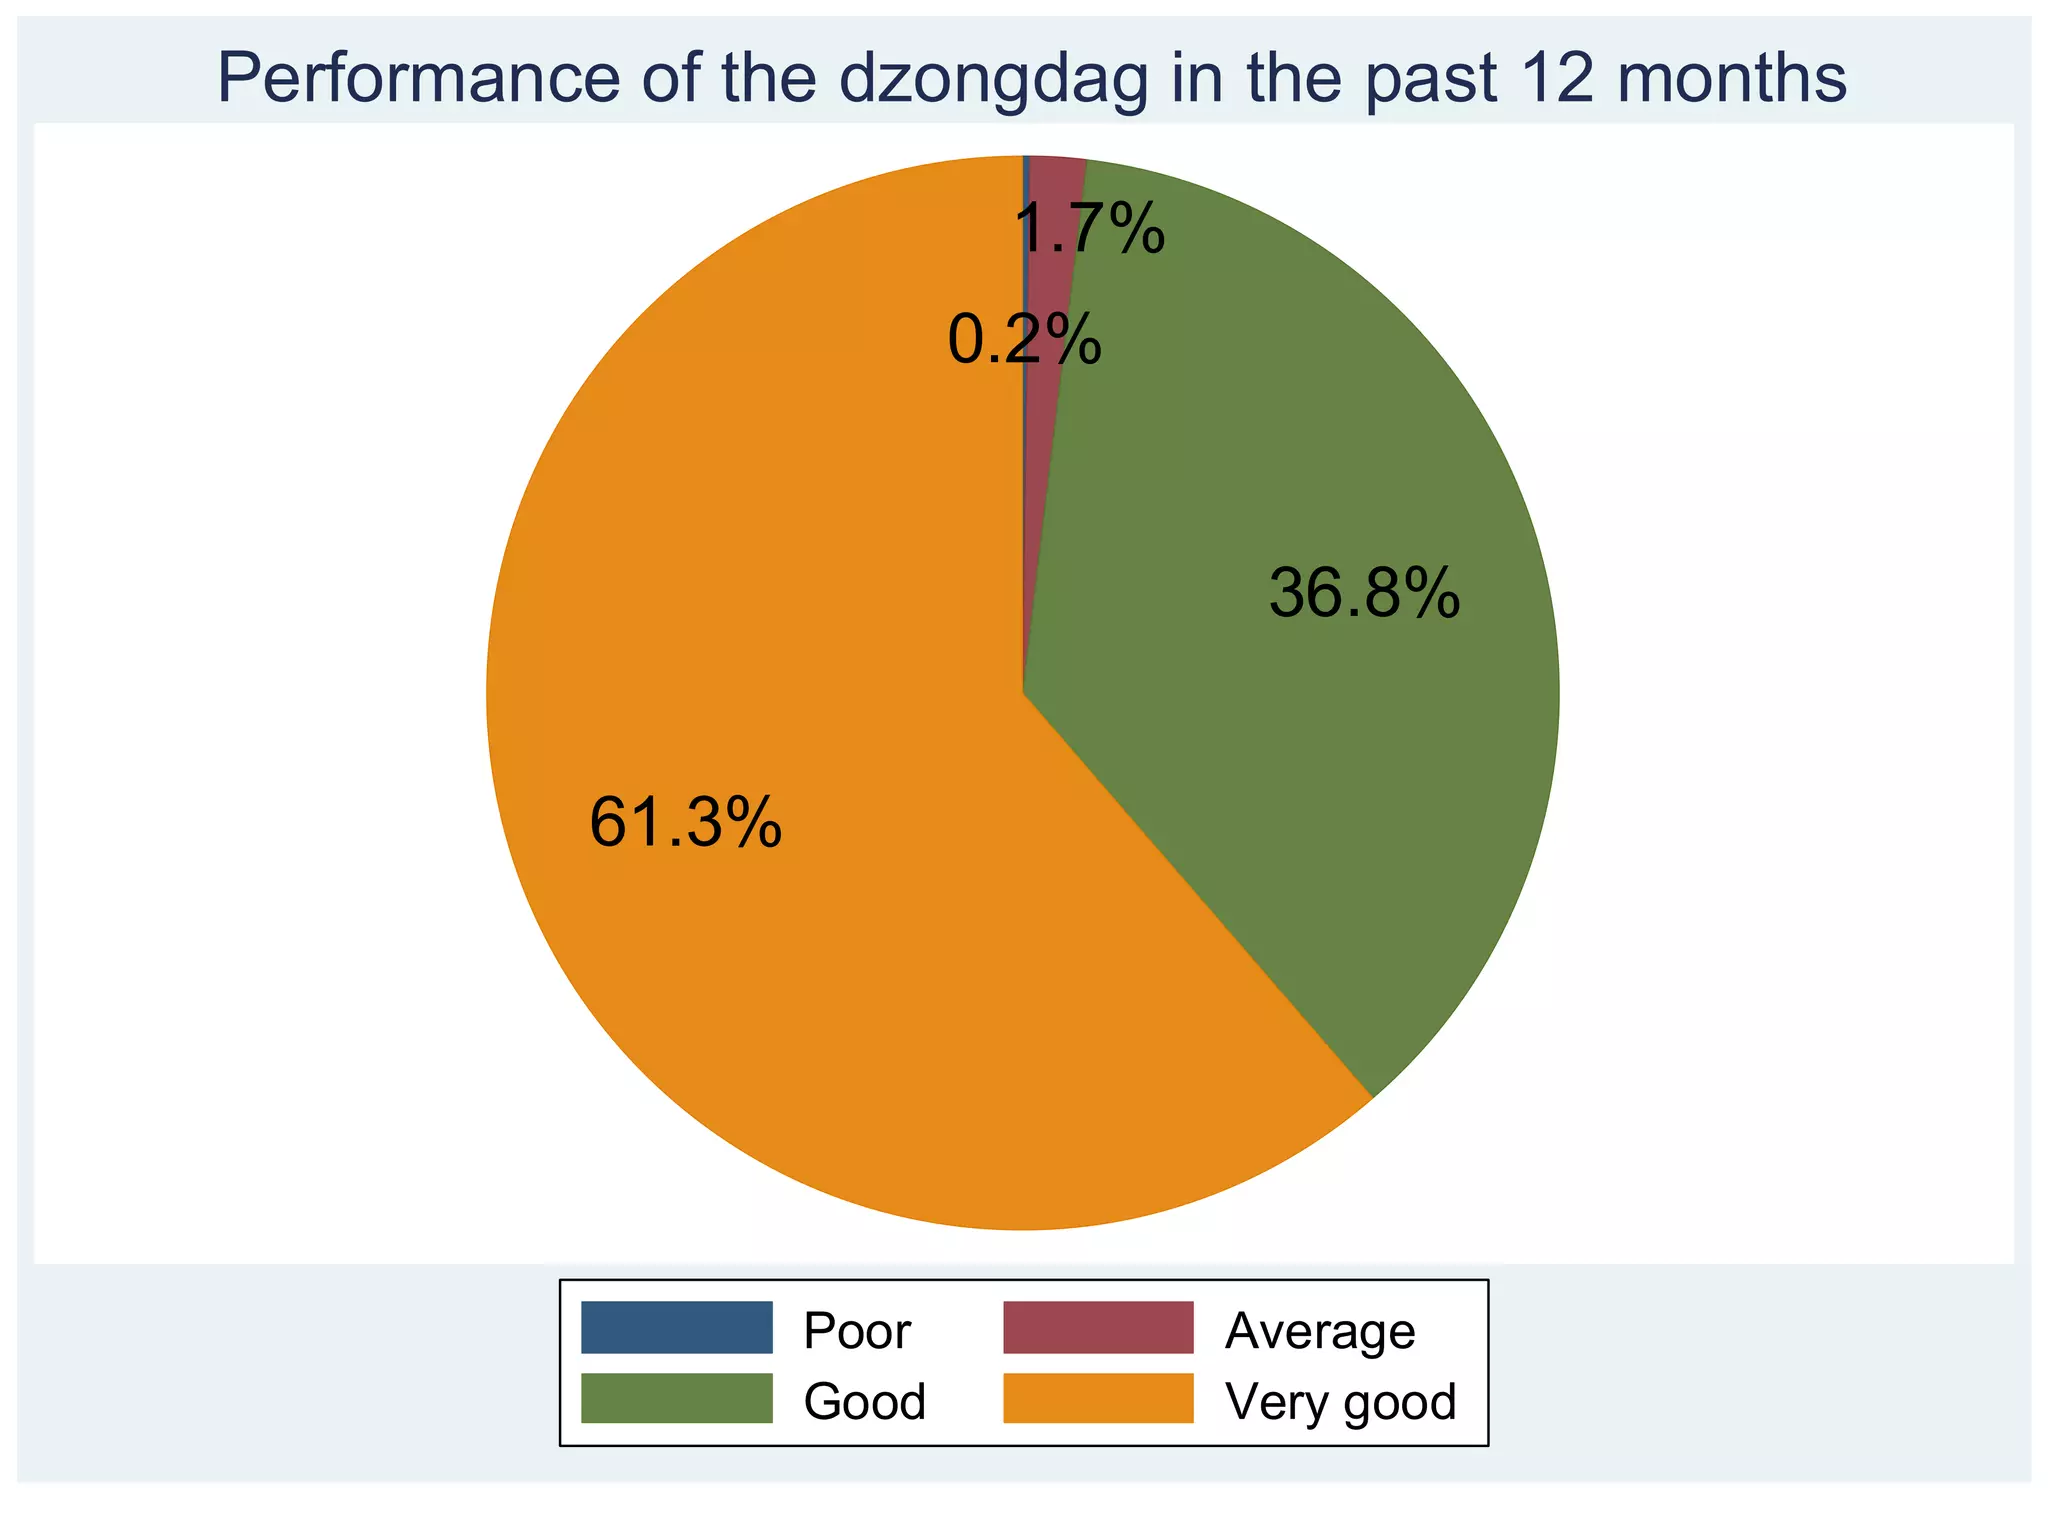
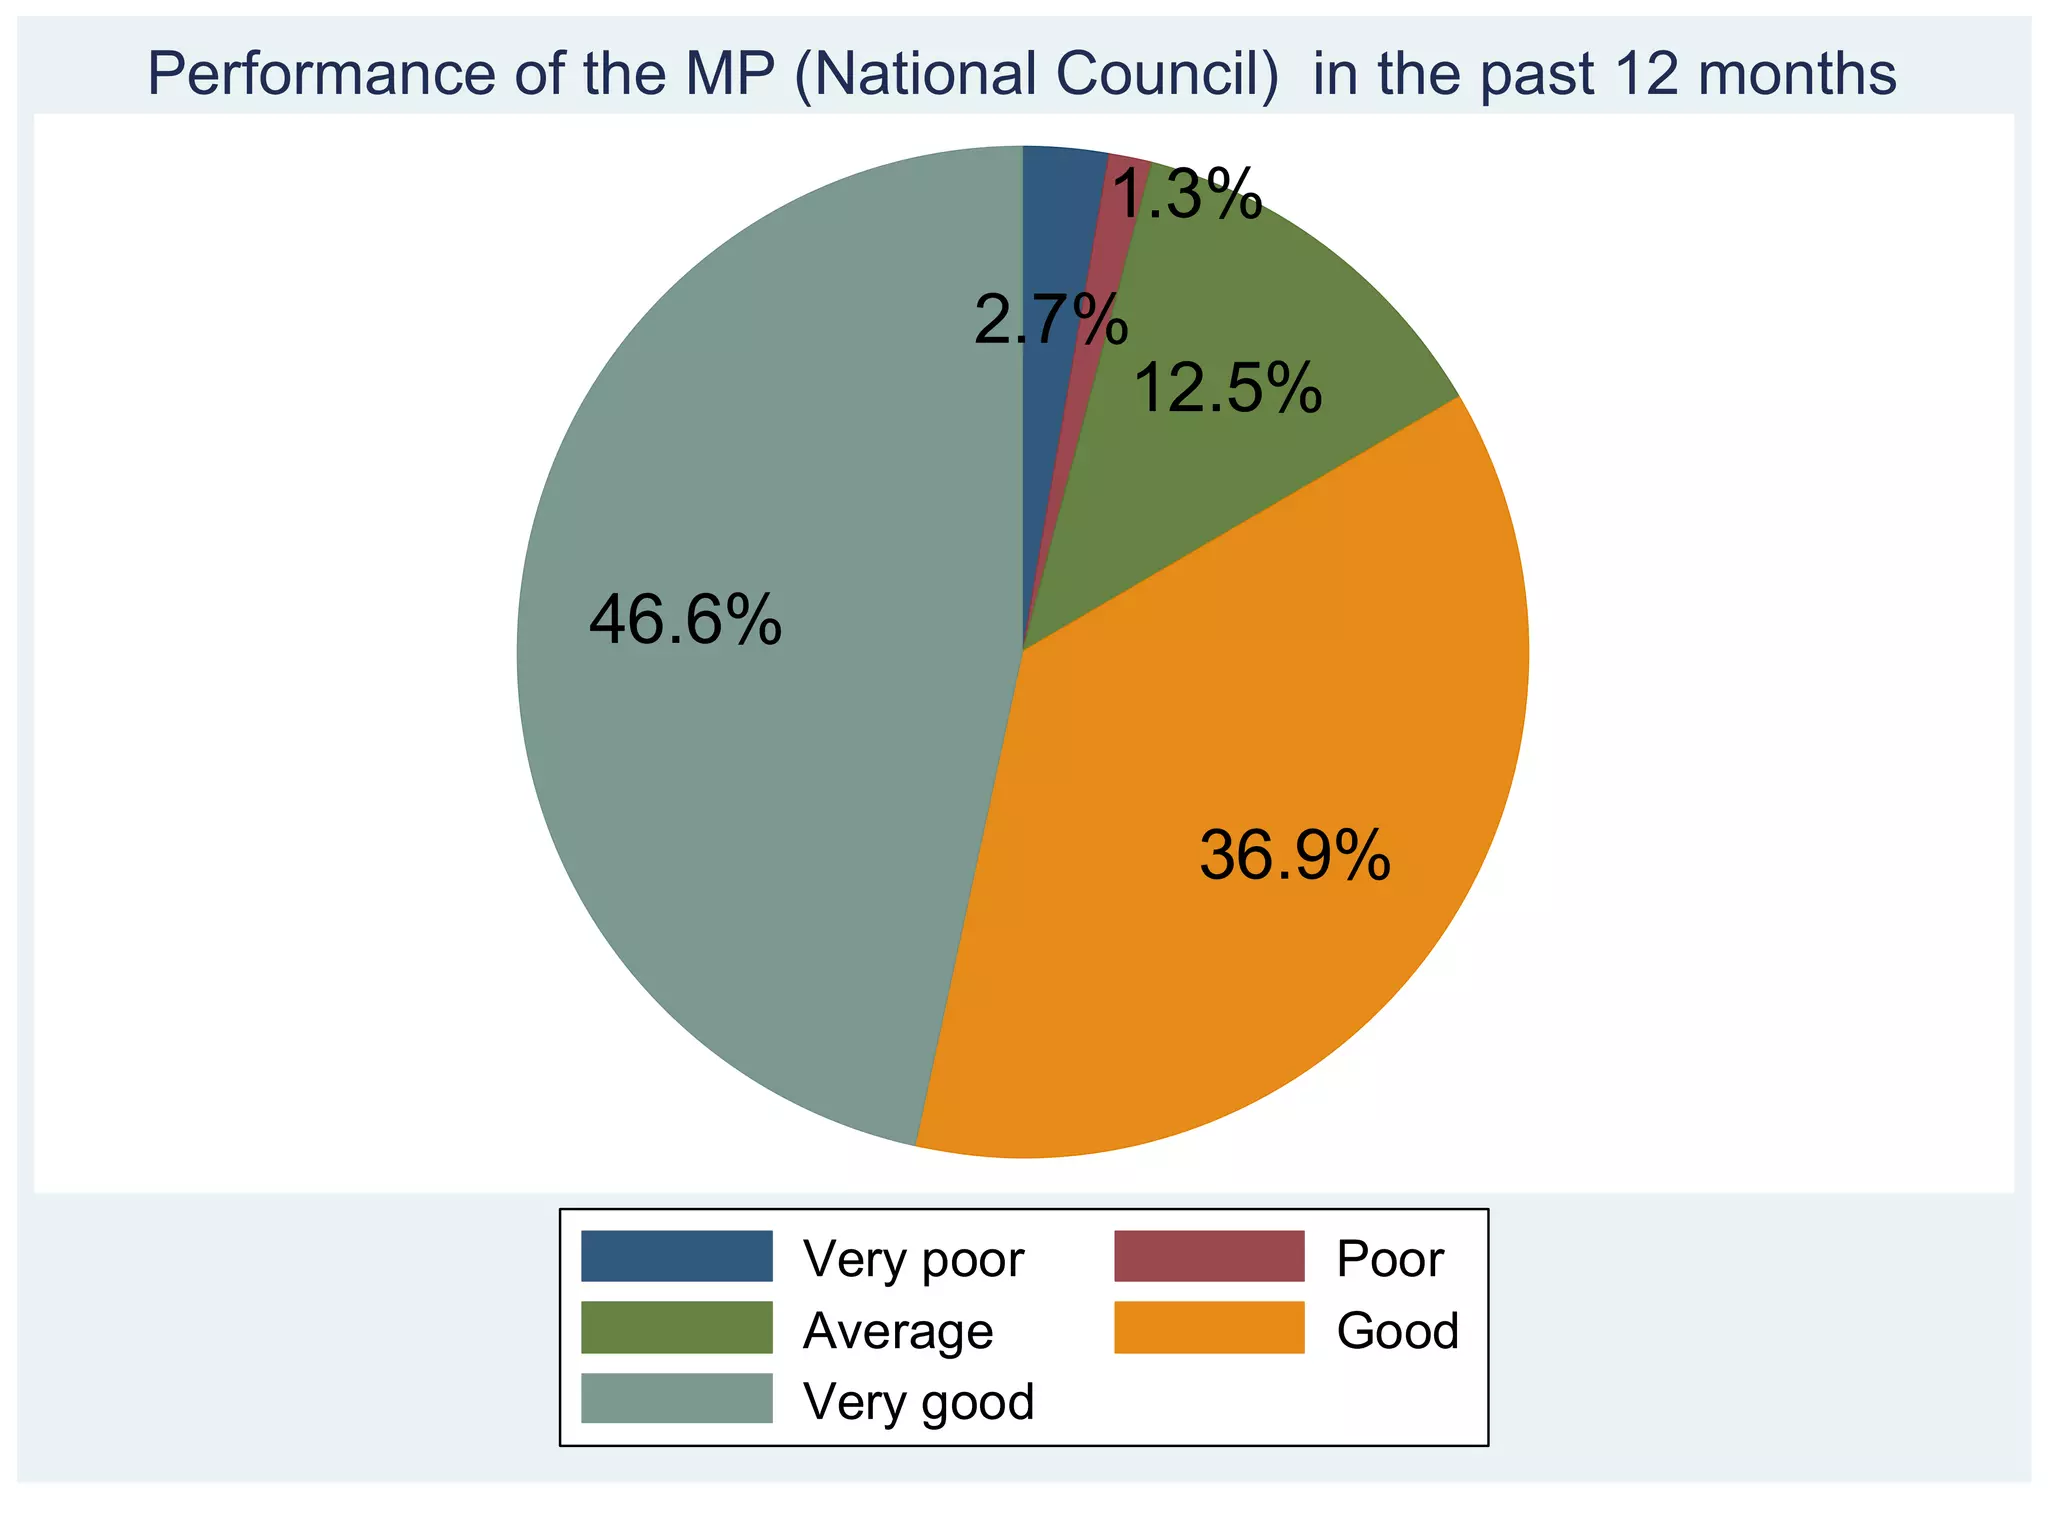
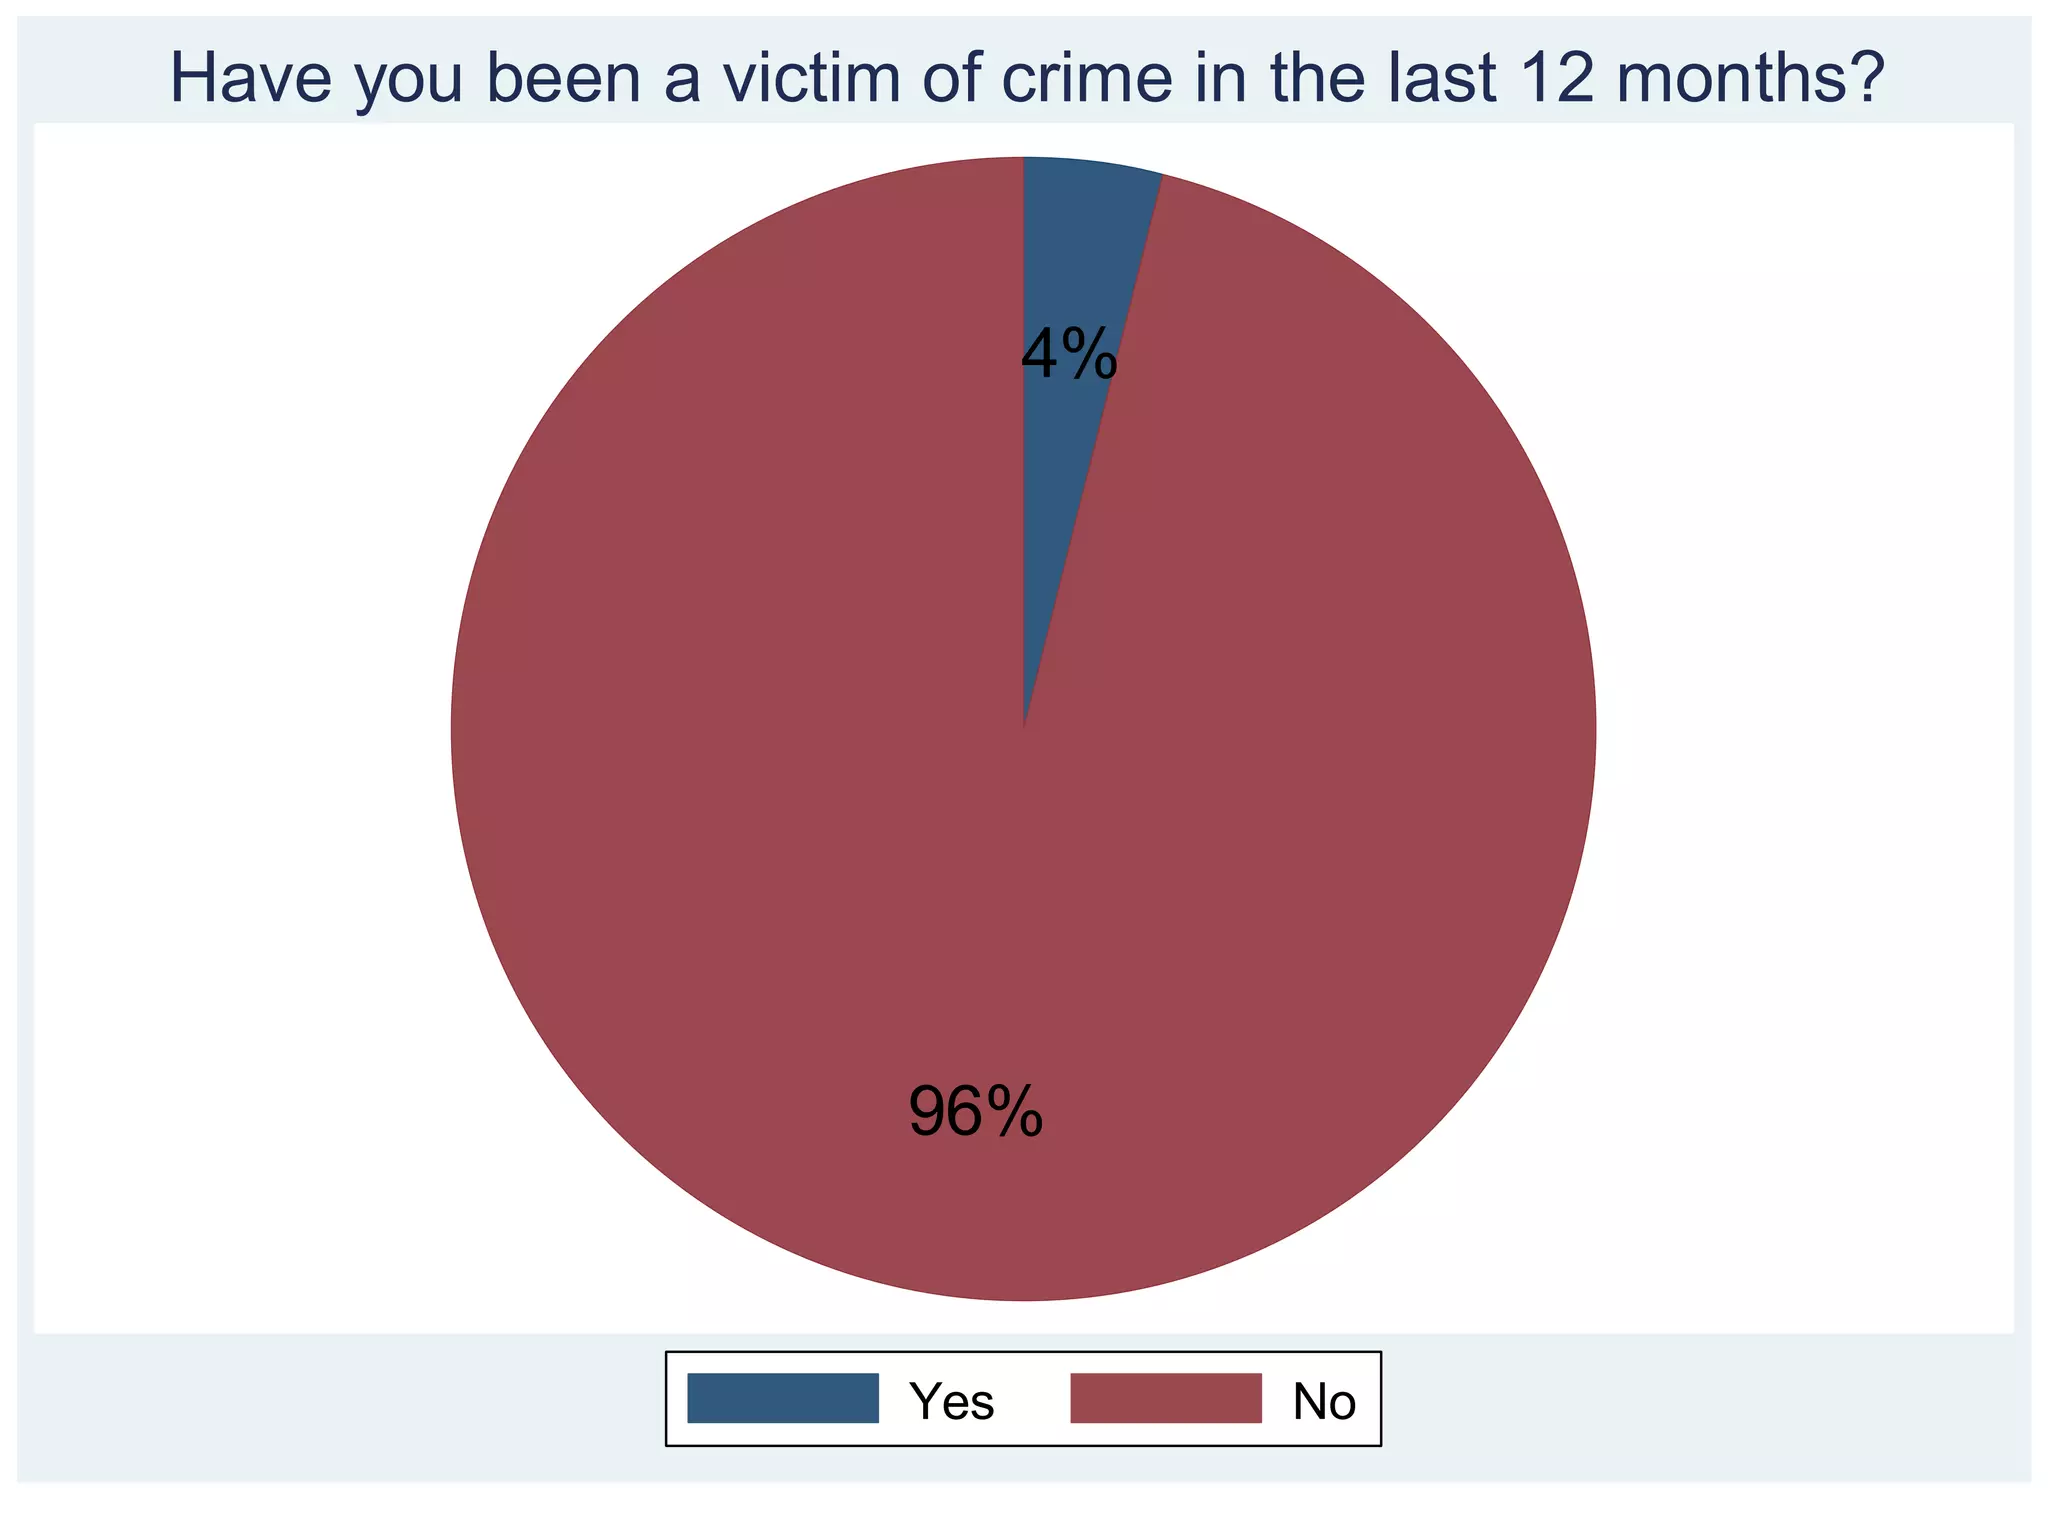
- Governance was seen as generally free and fair, with high voter turnout and performance ratings for elected officials.
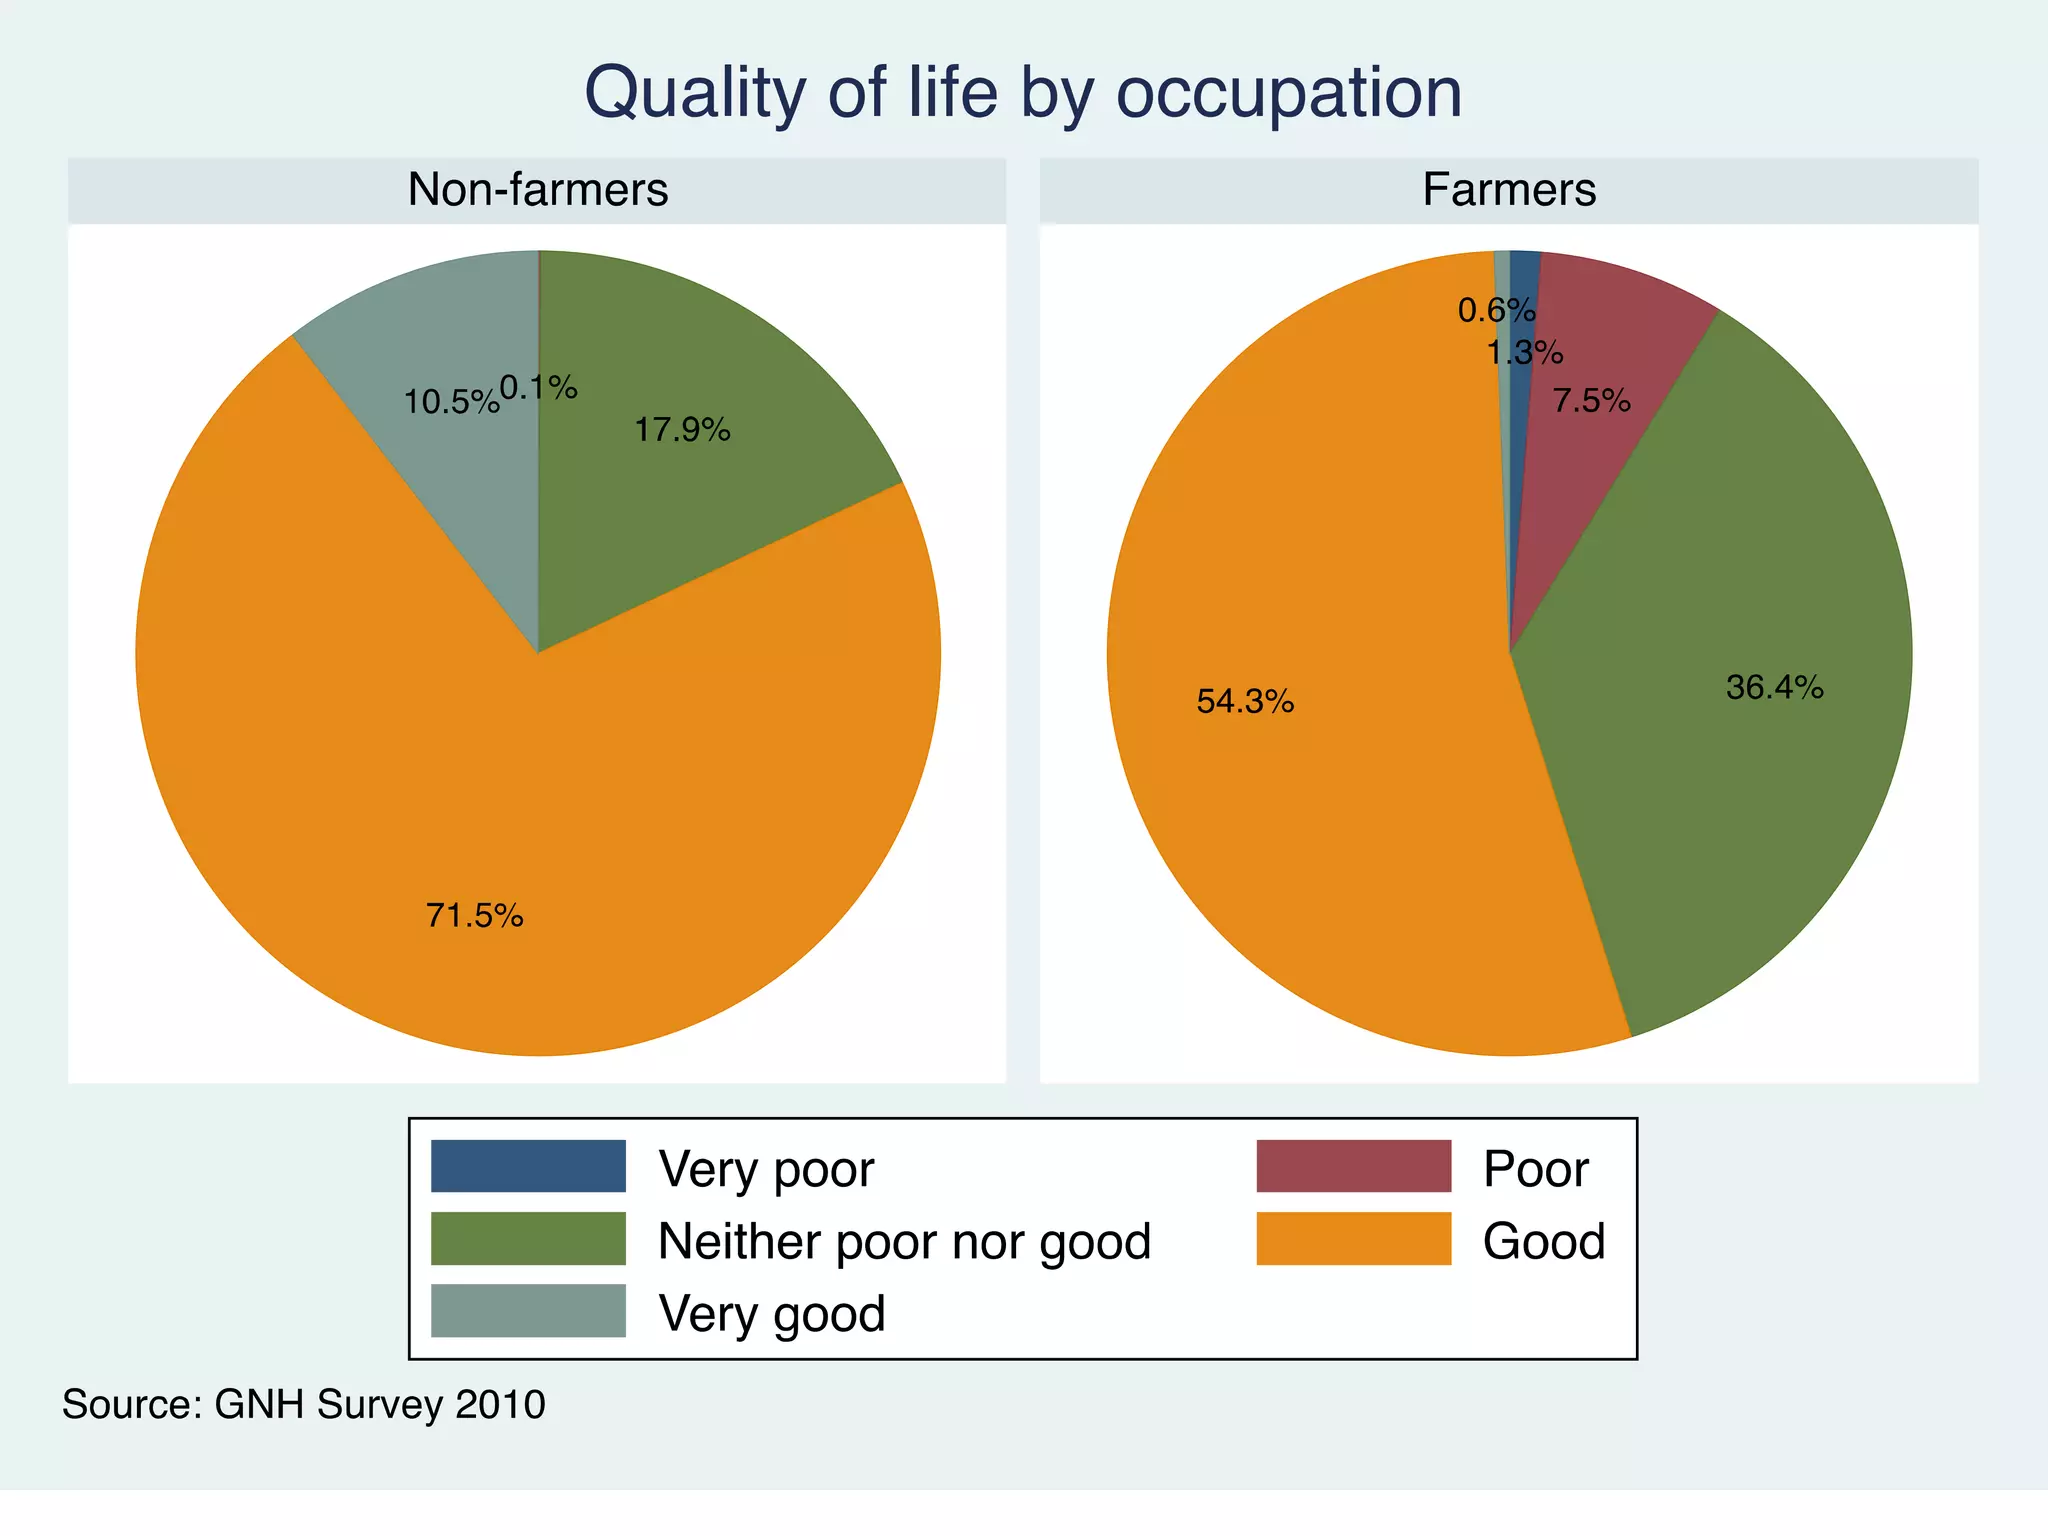
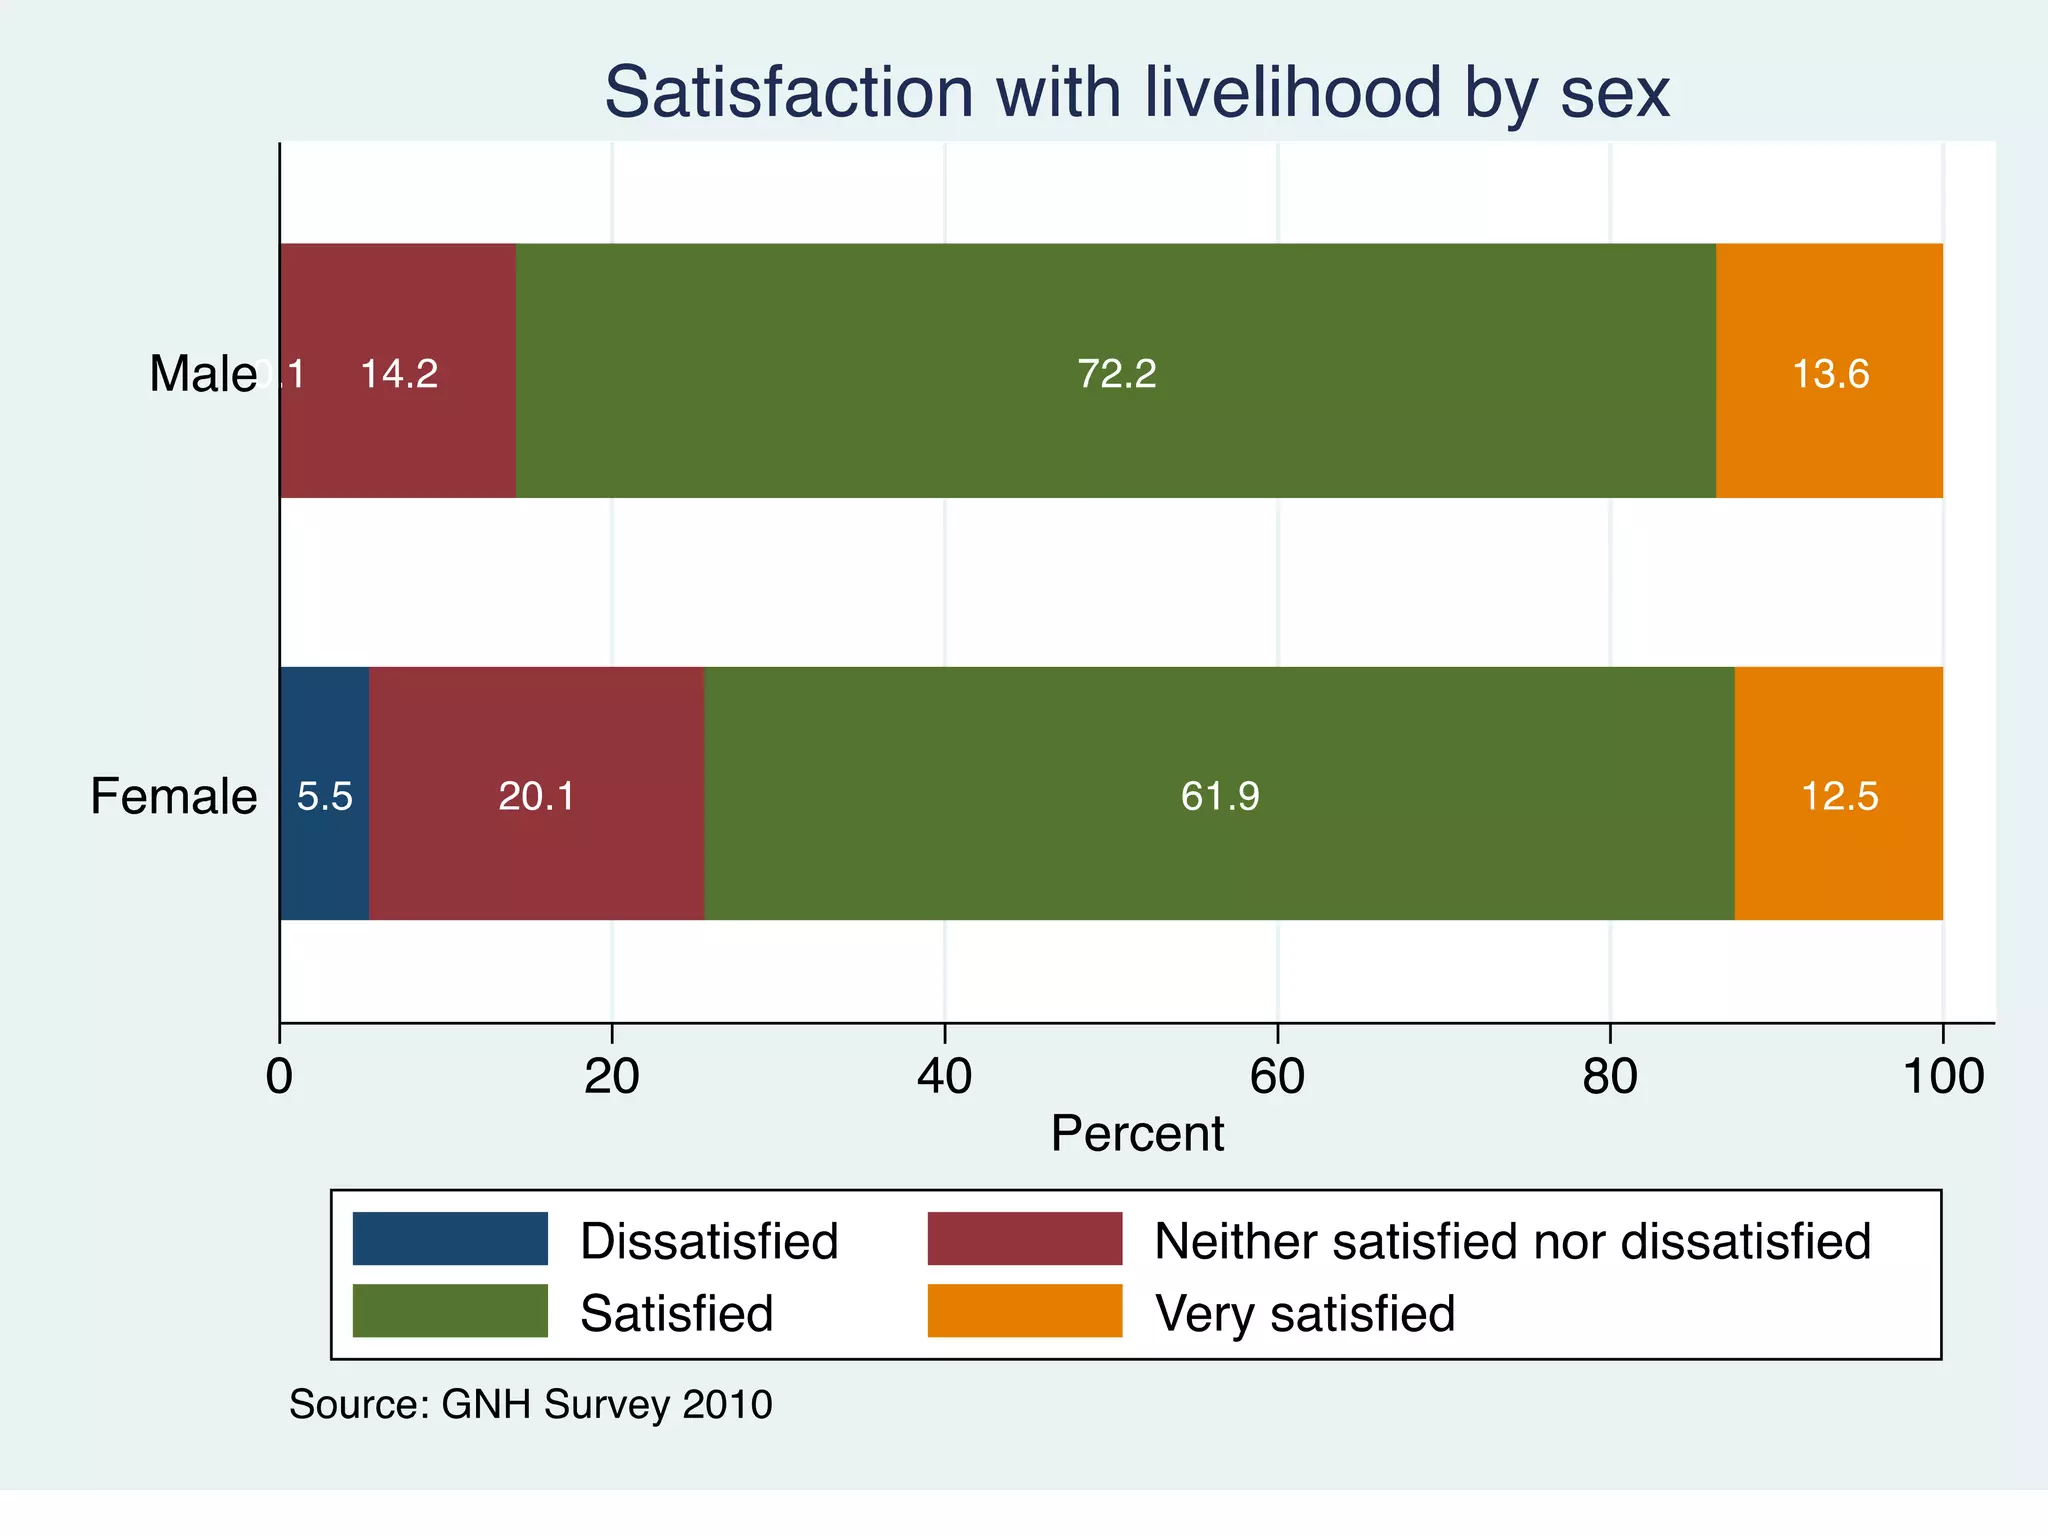
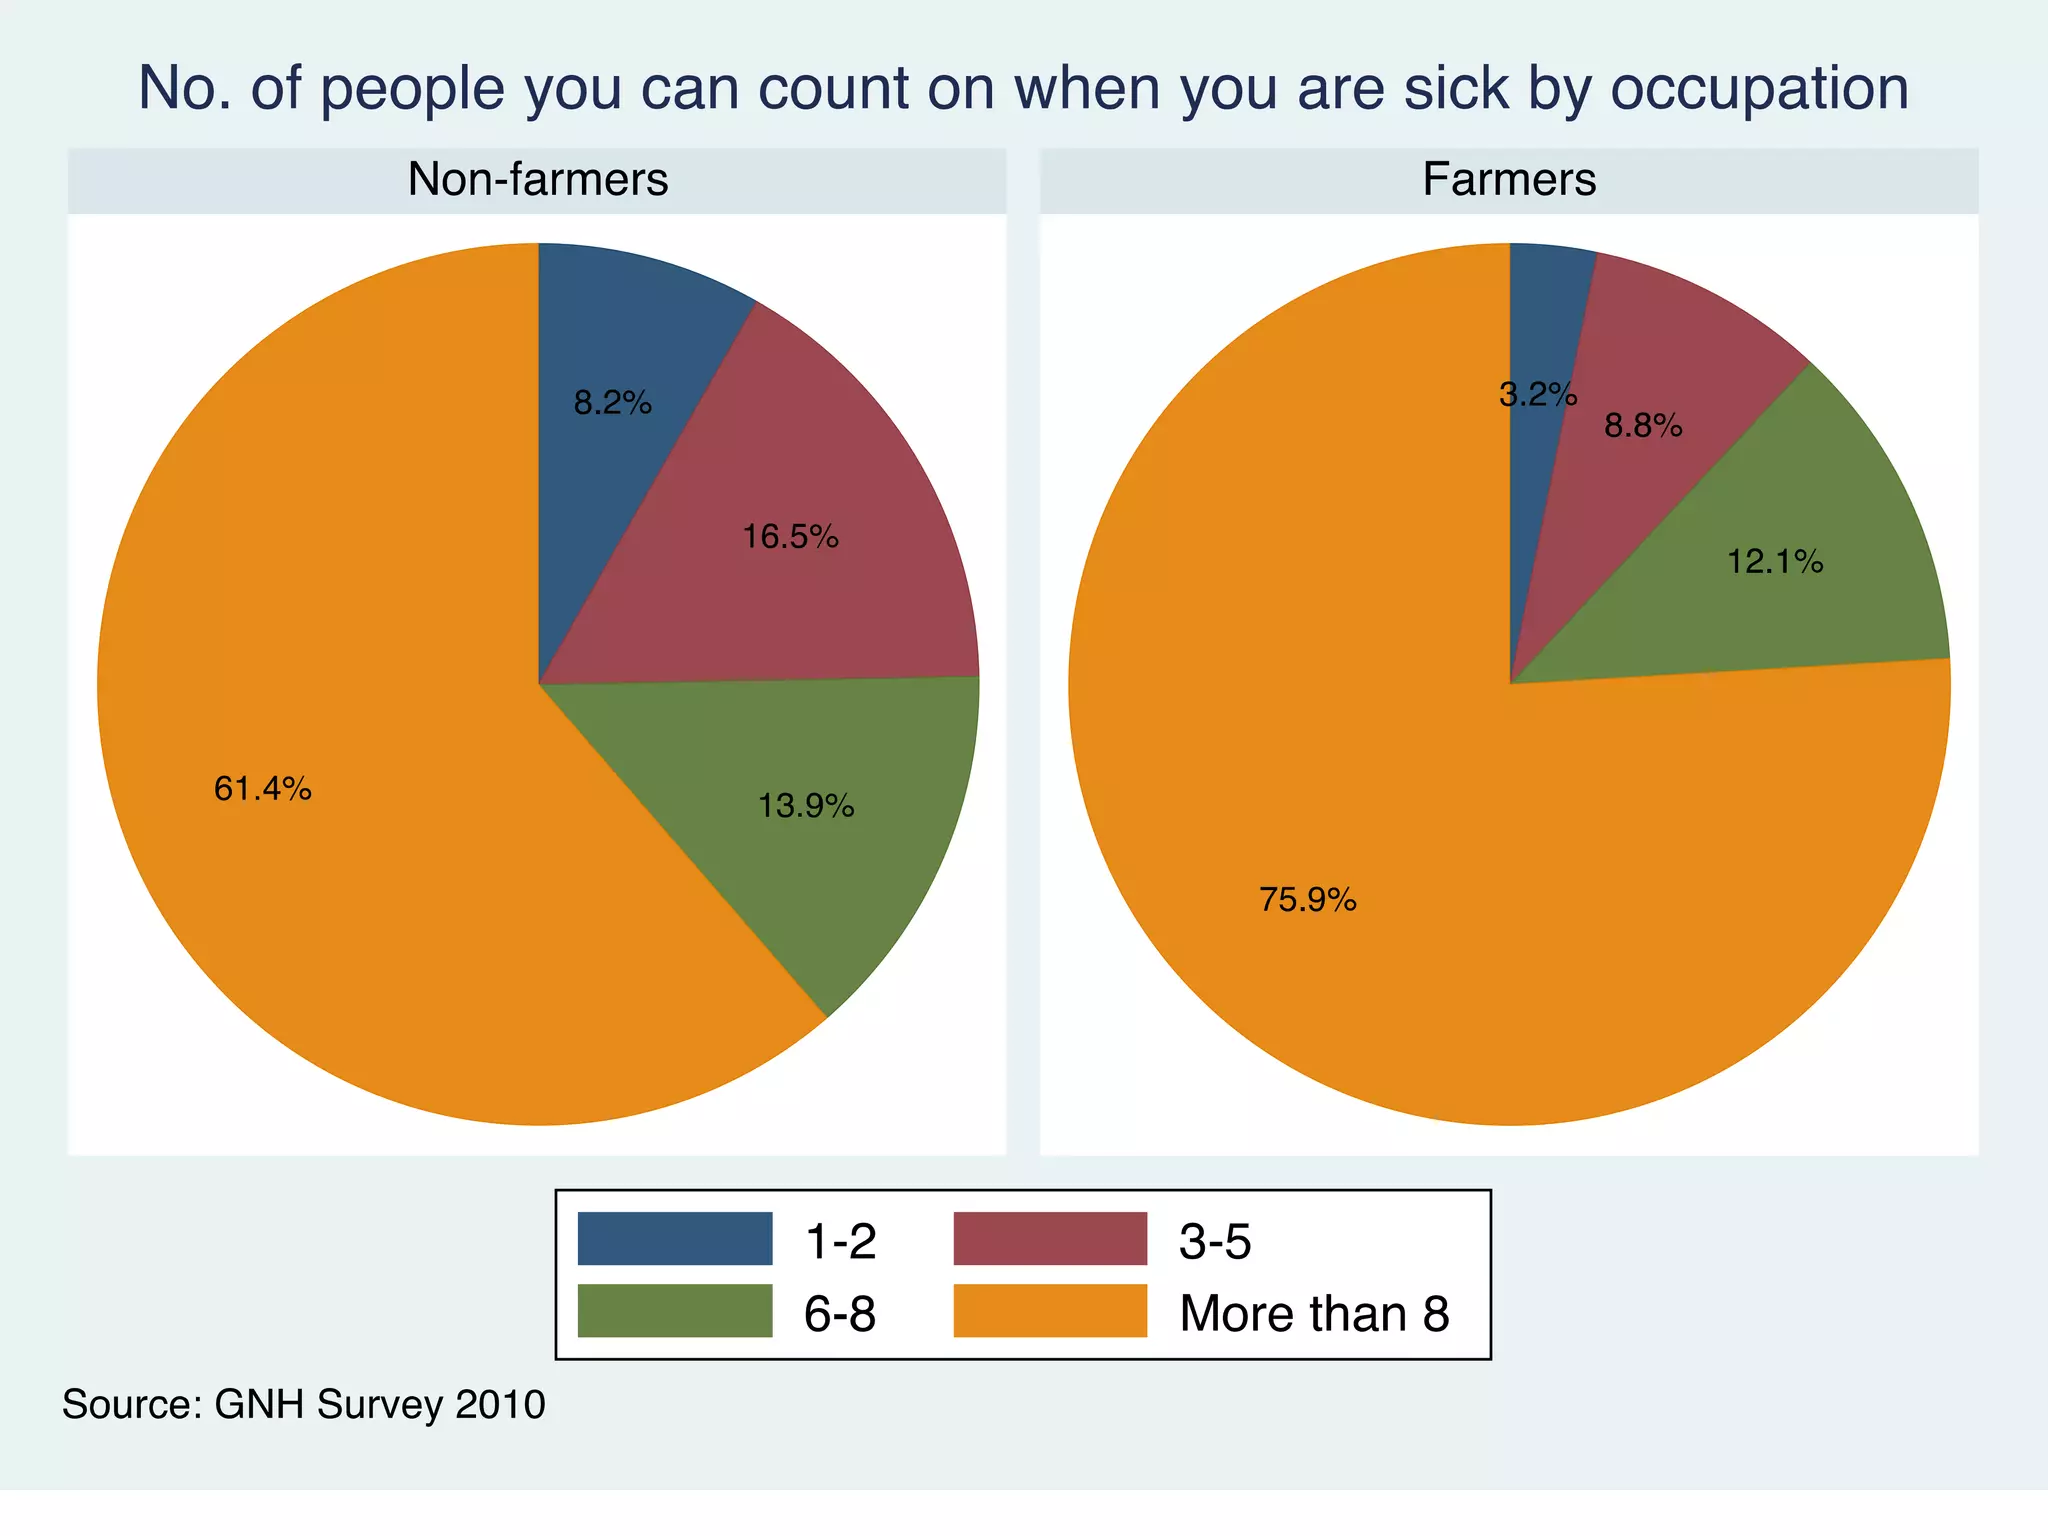
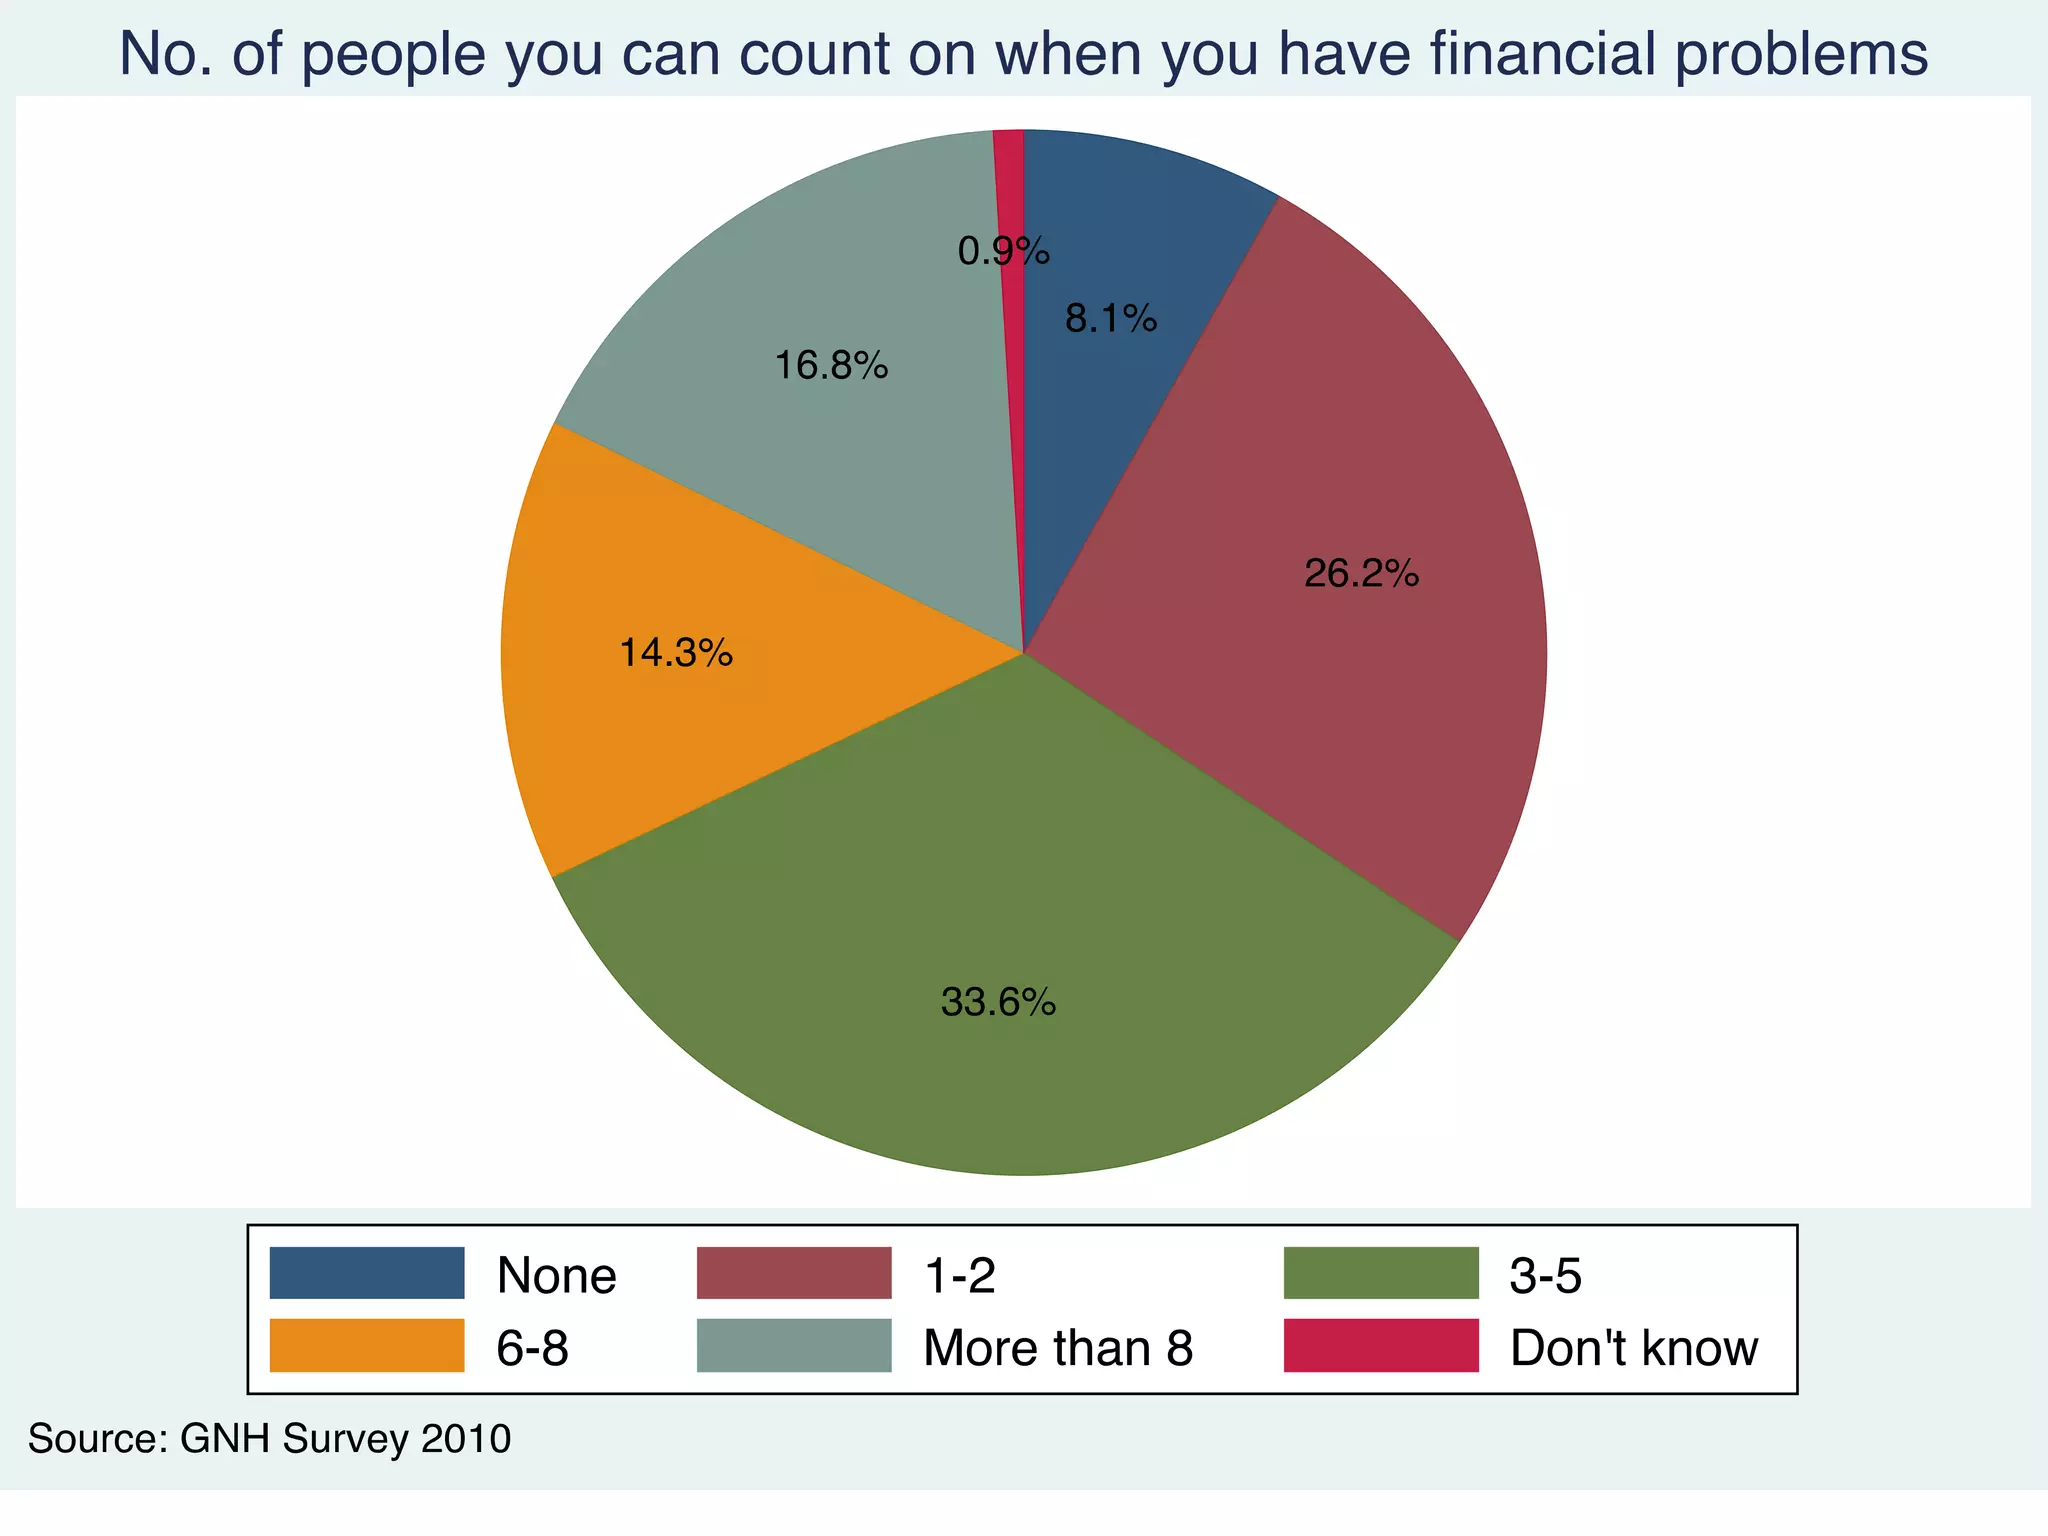
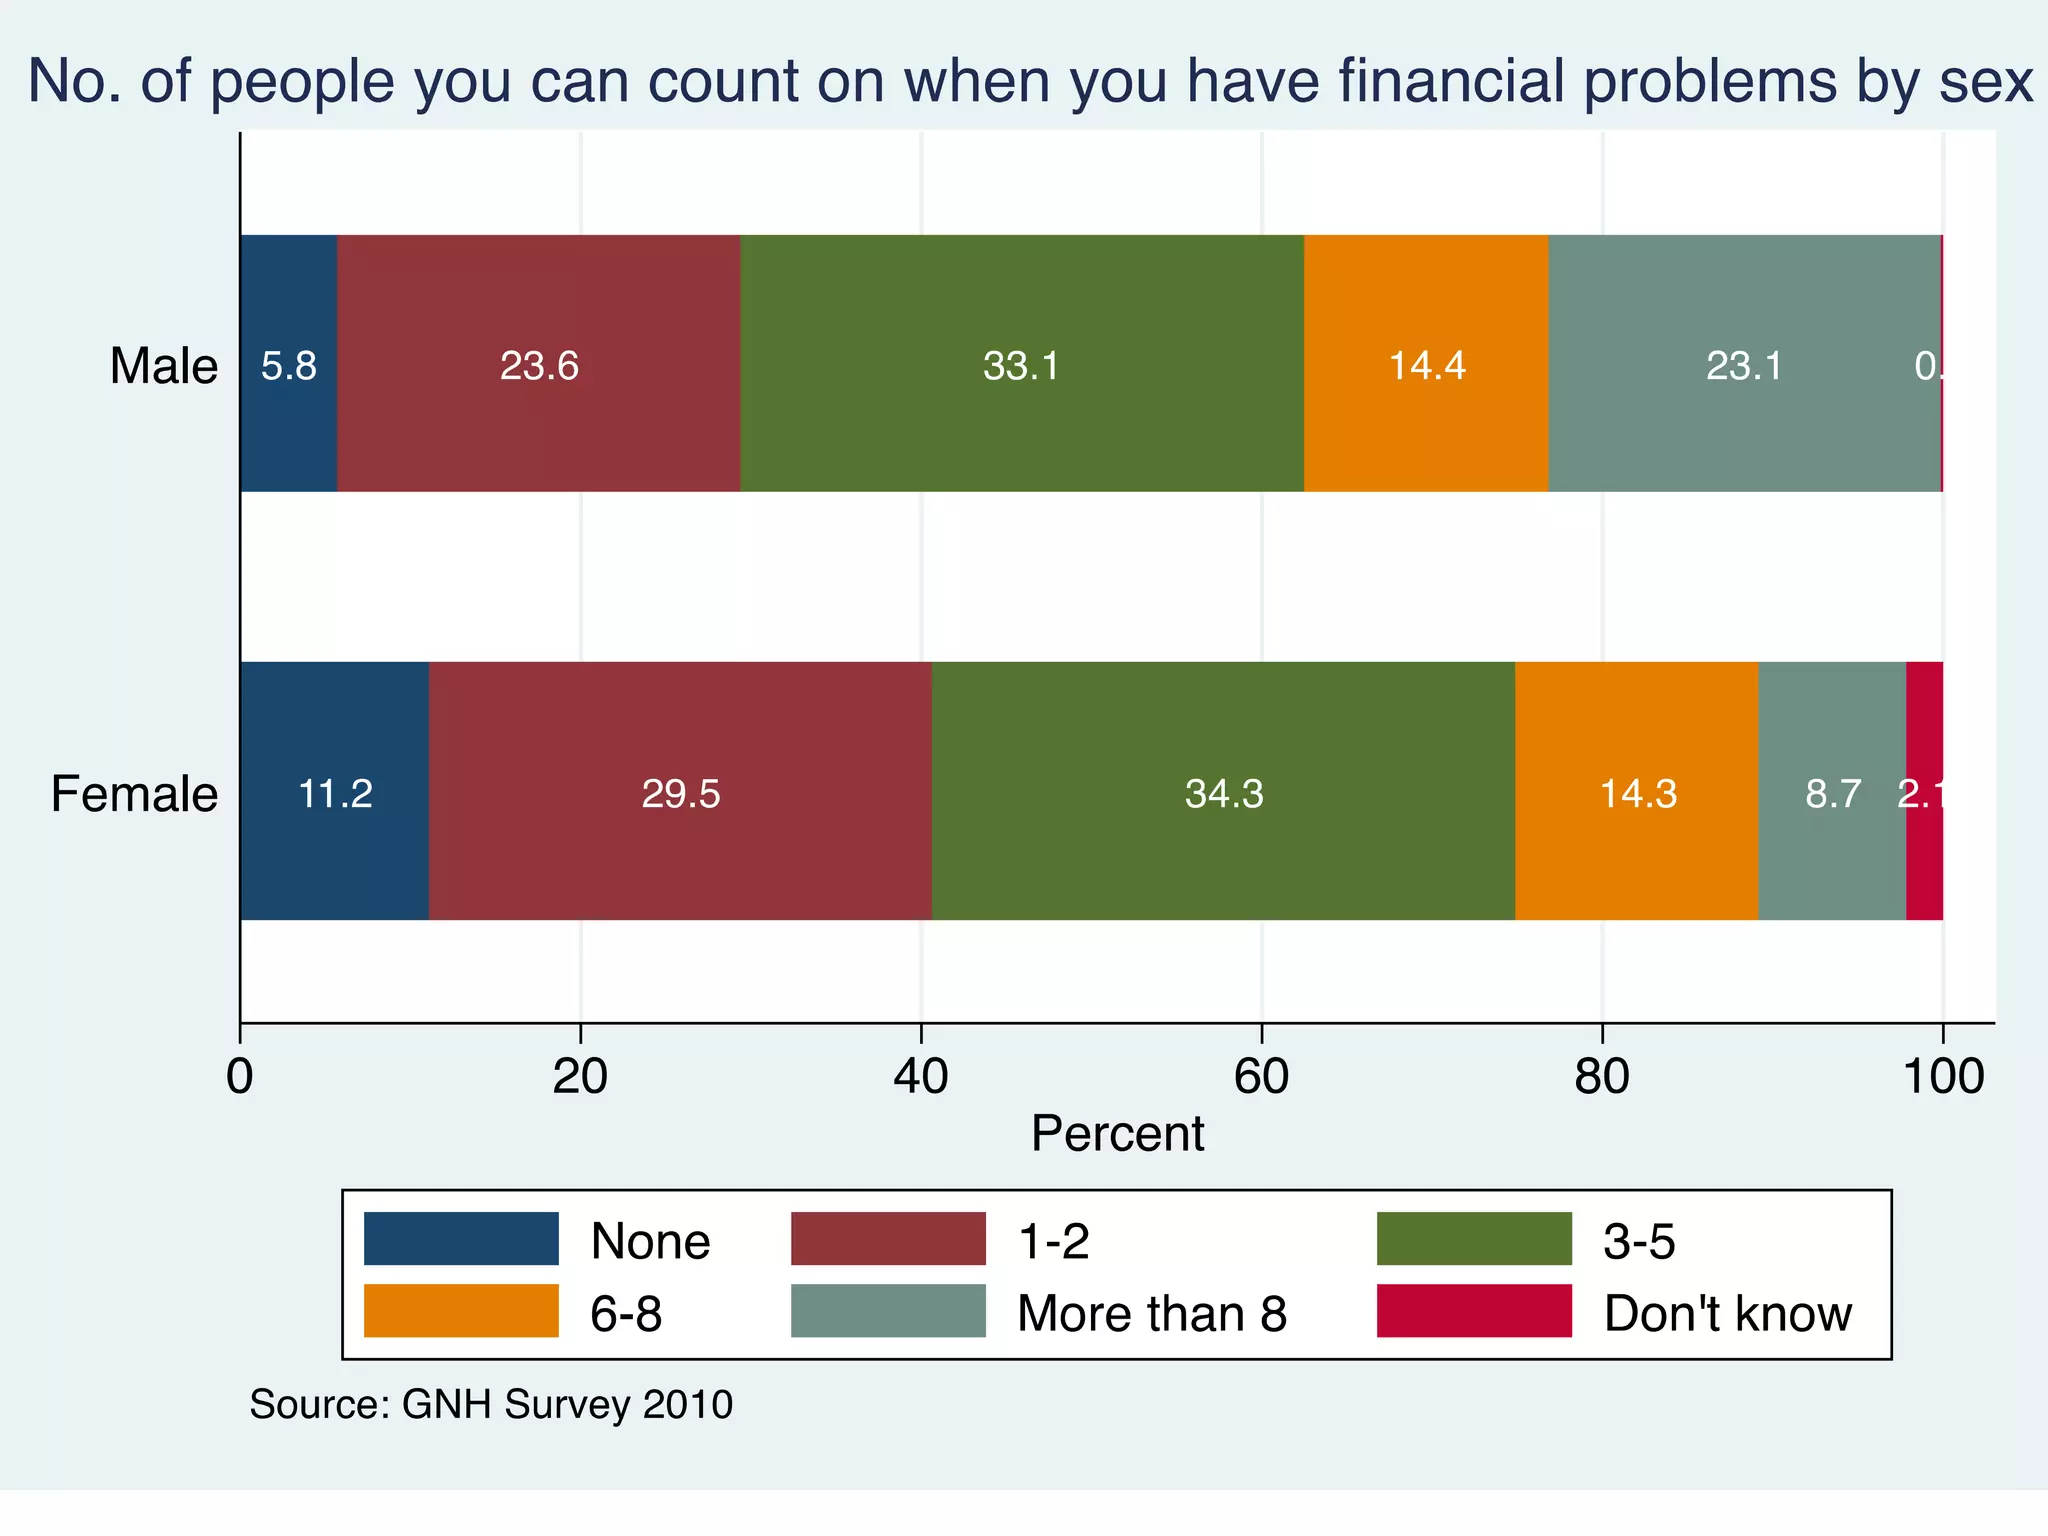
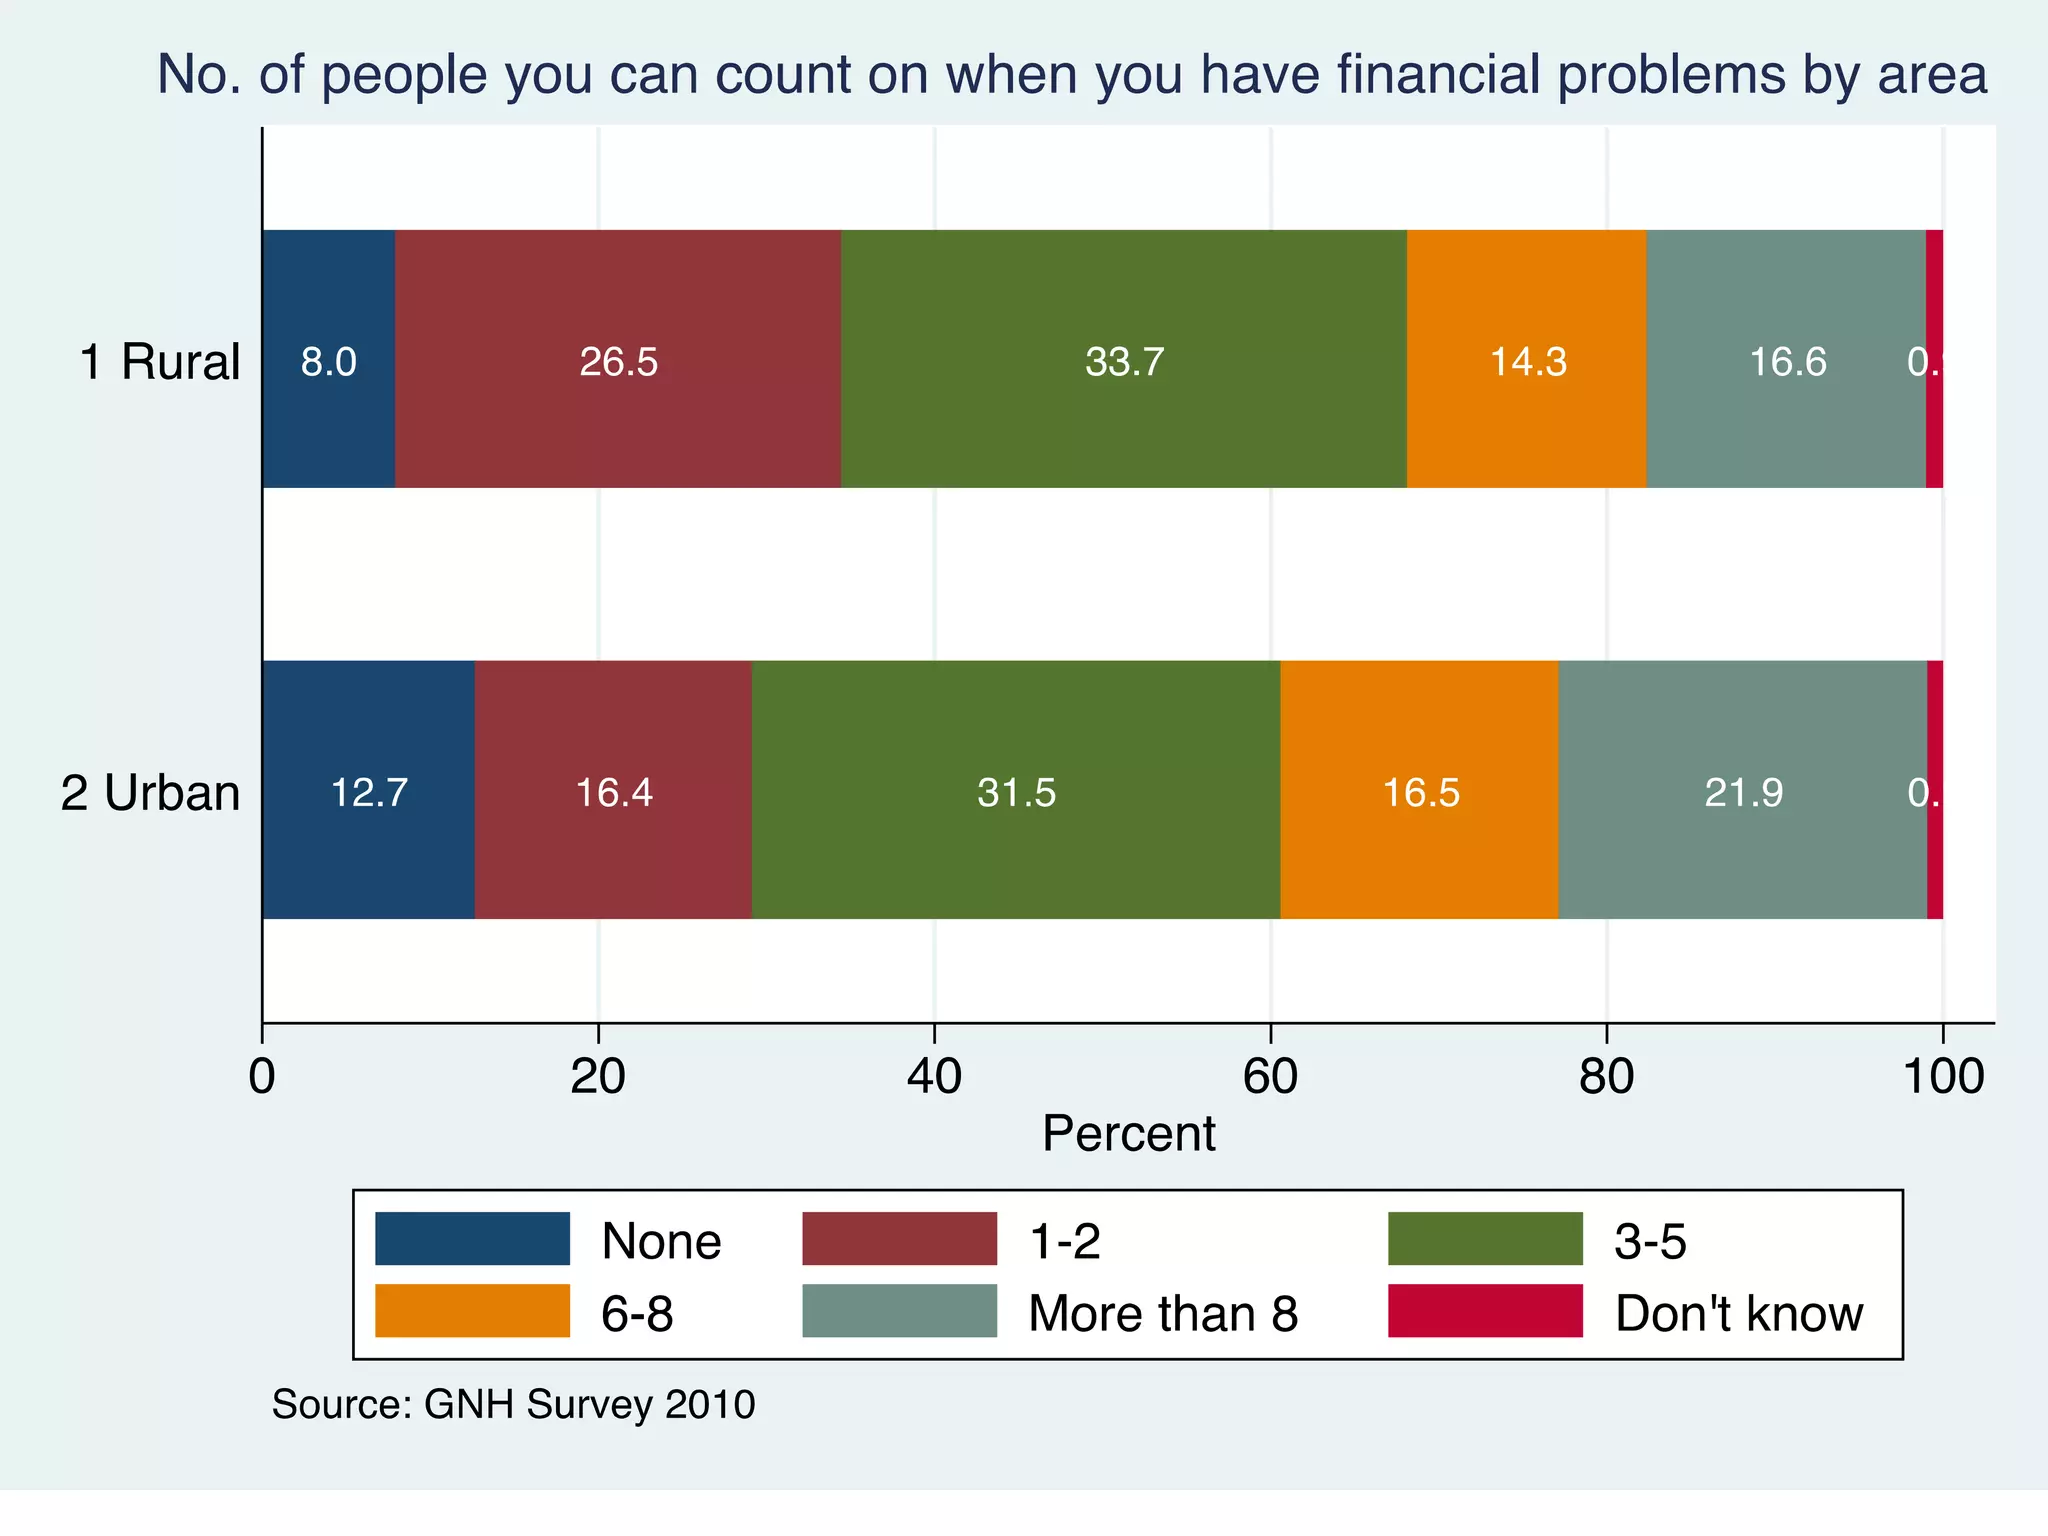
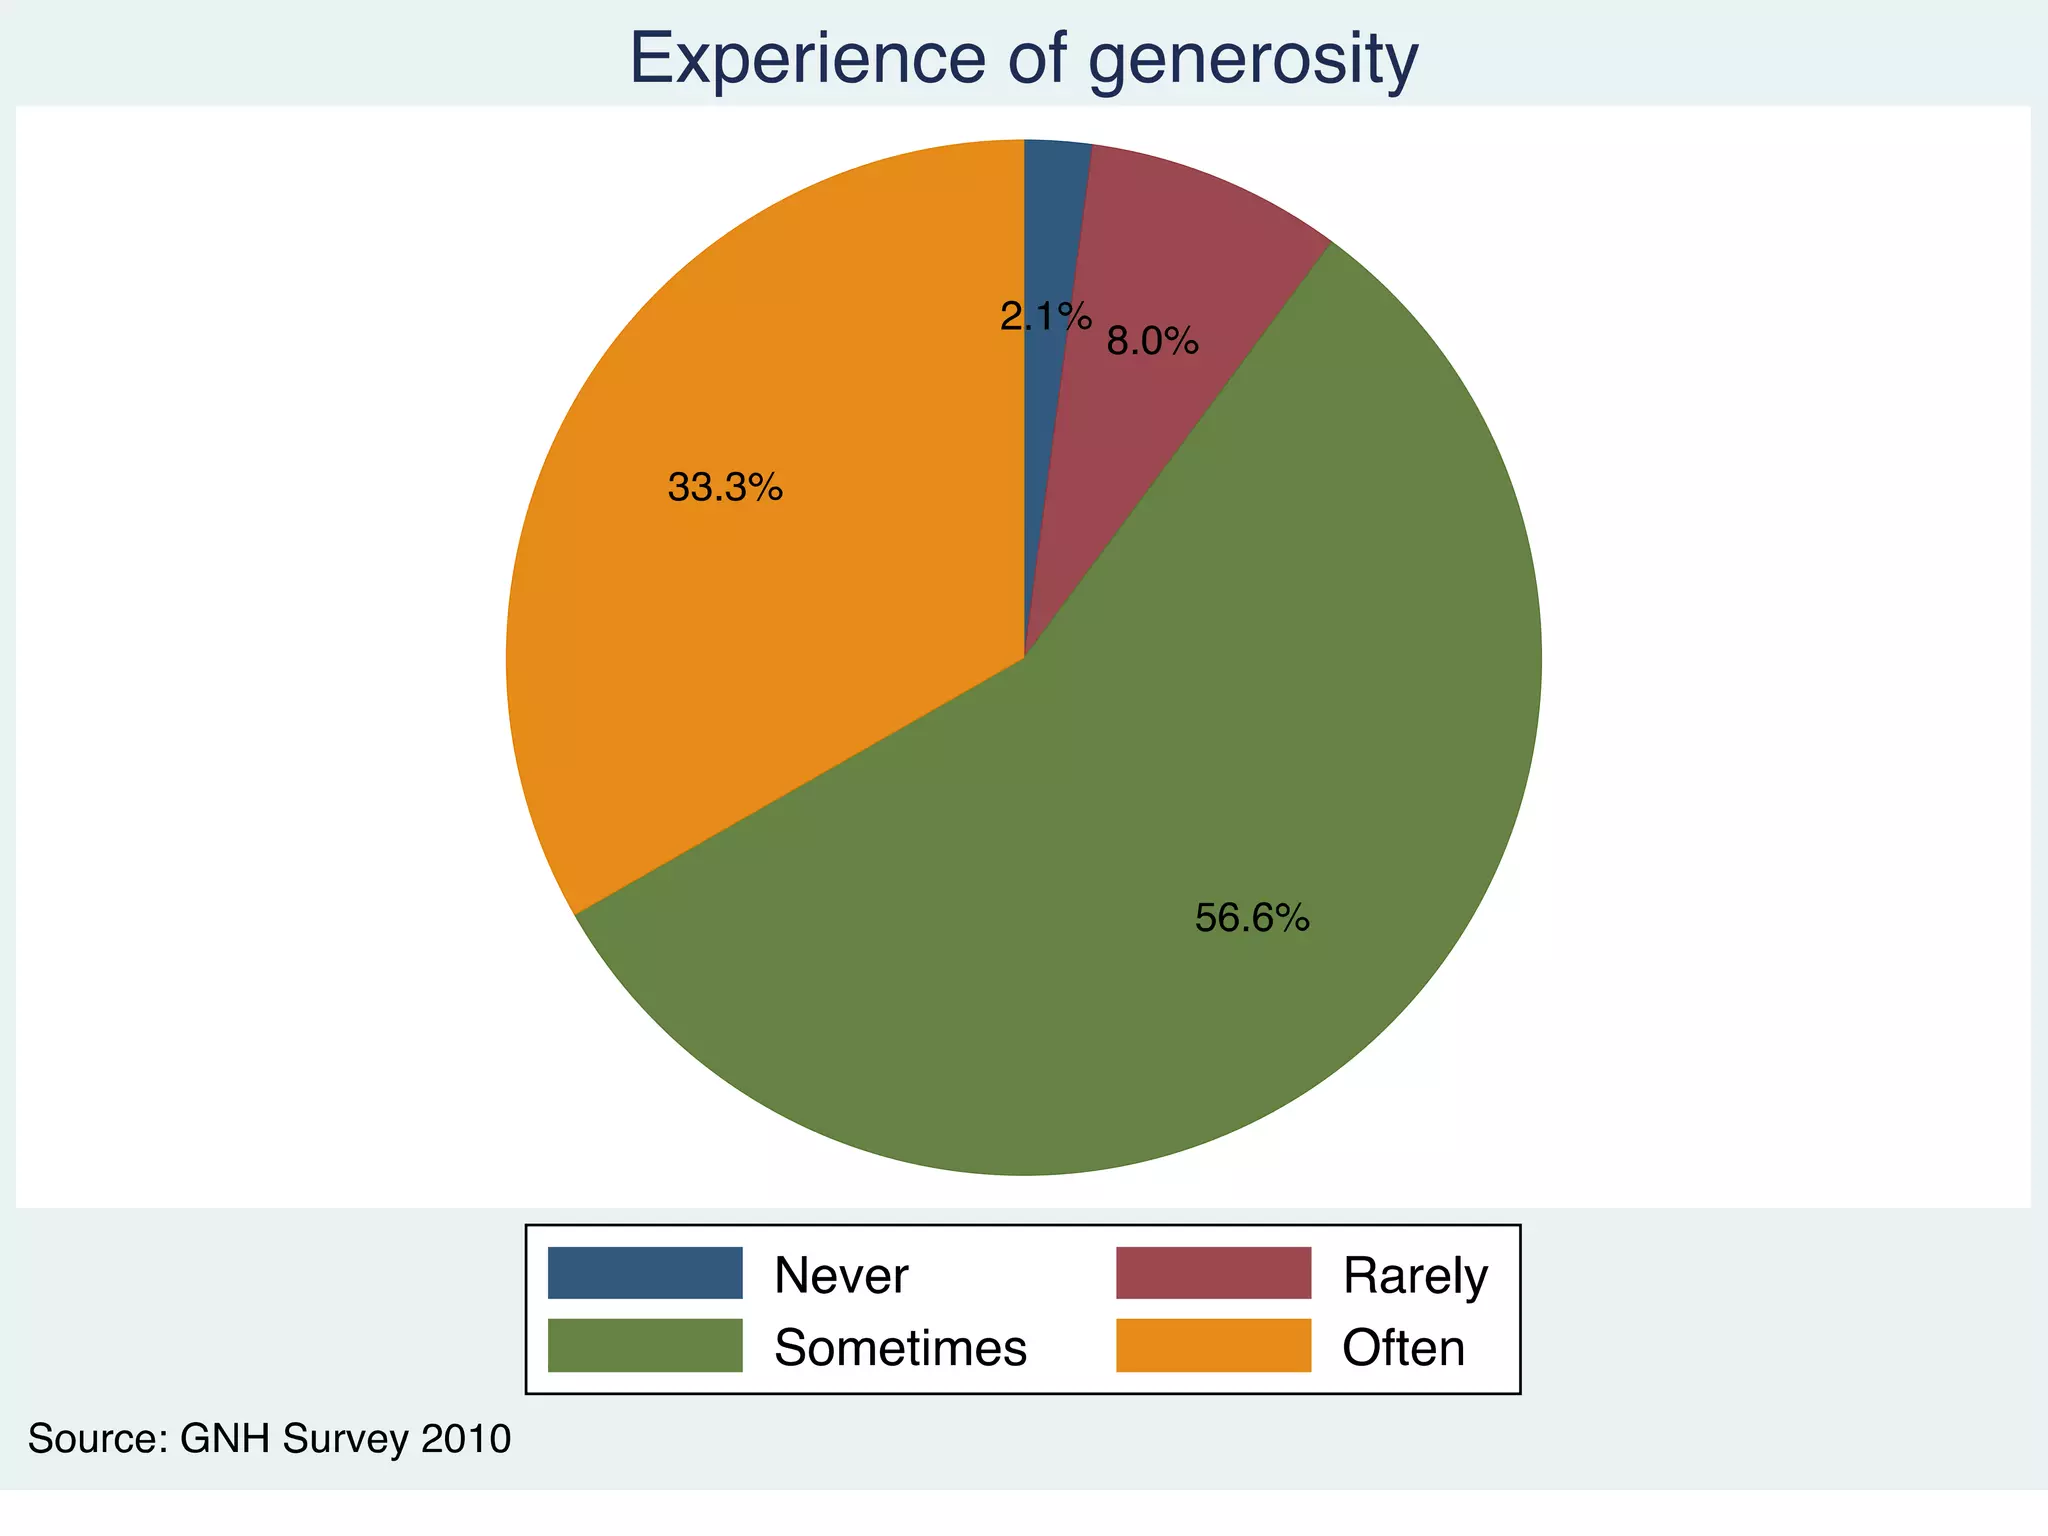
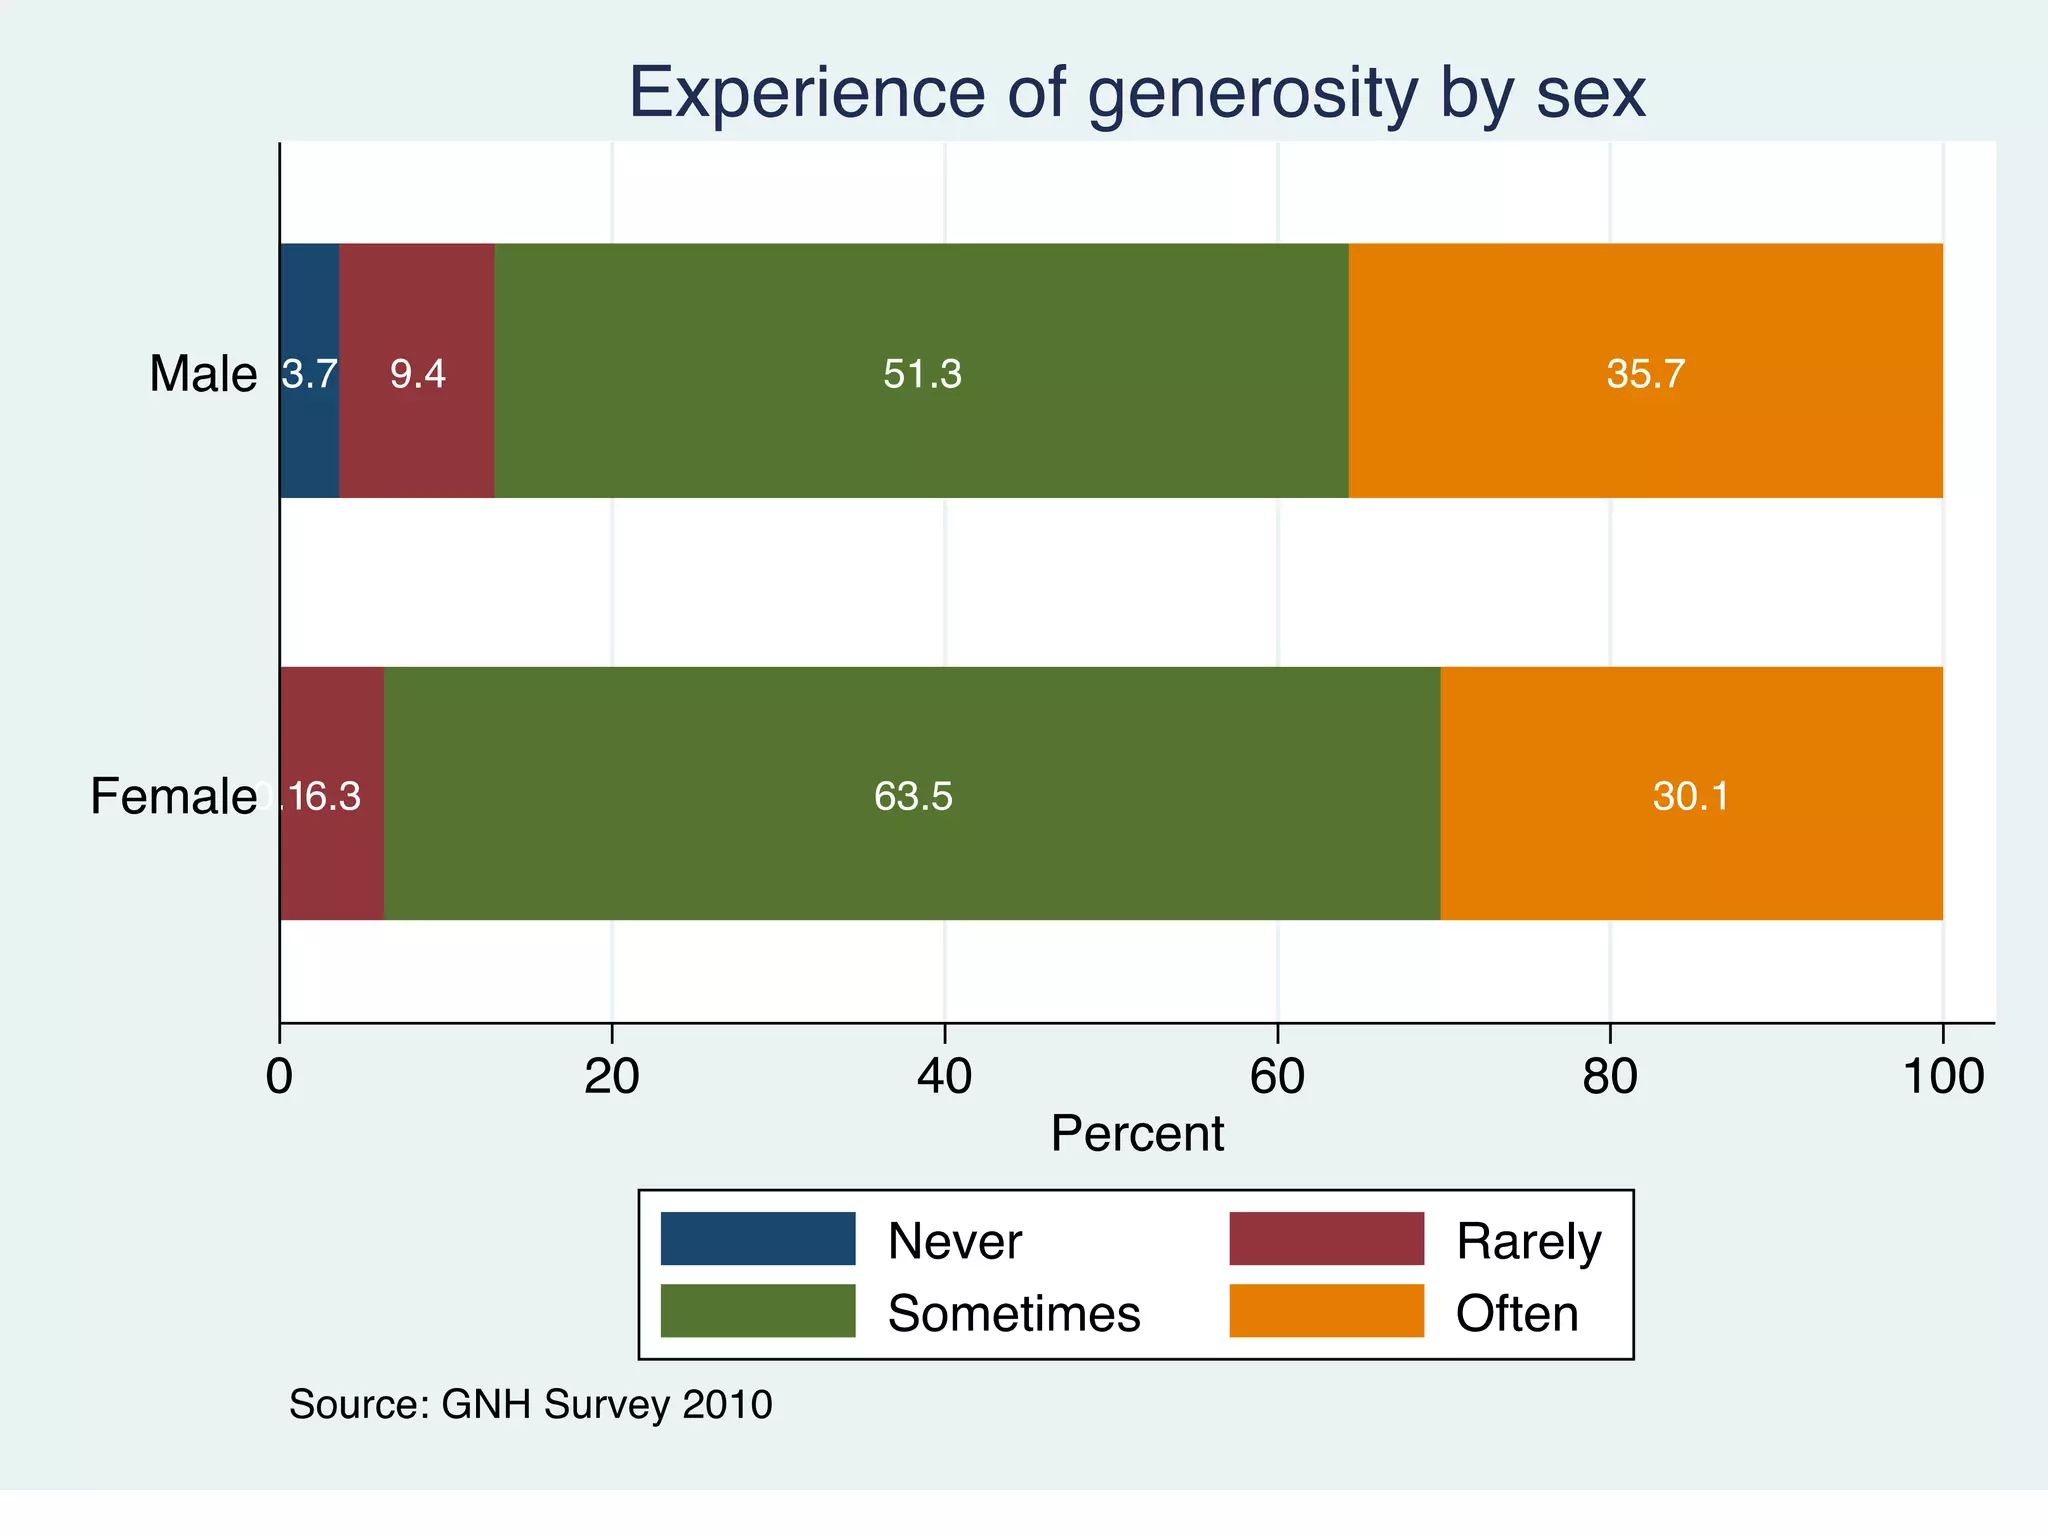
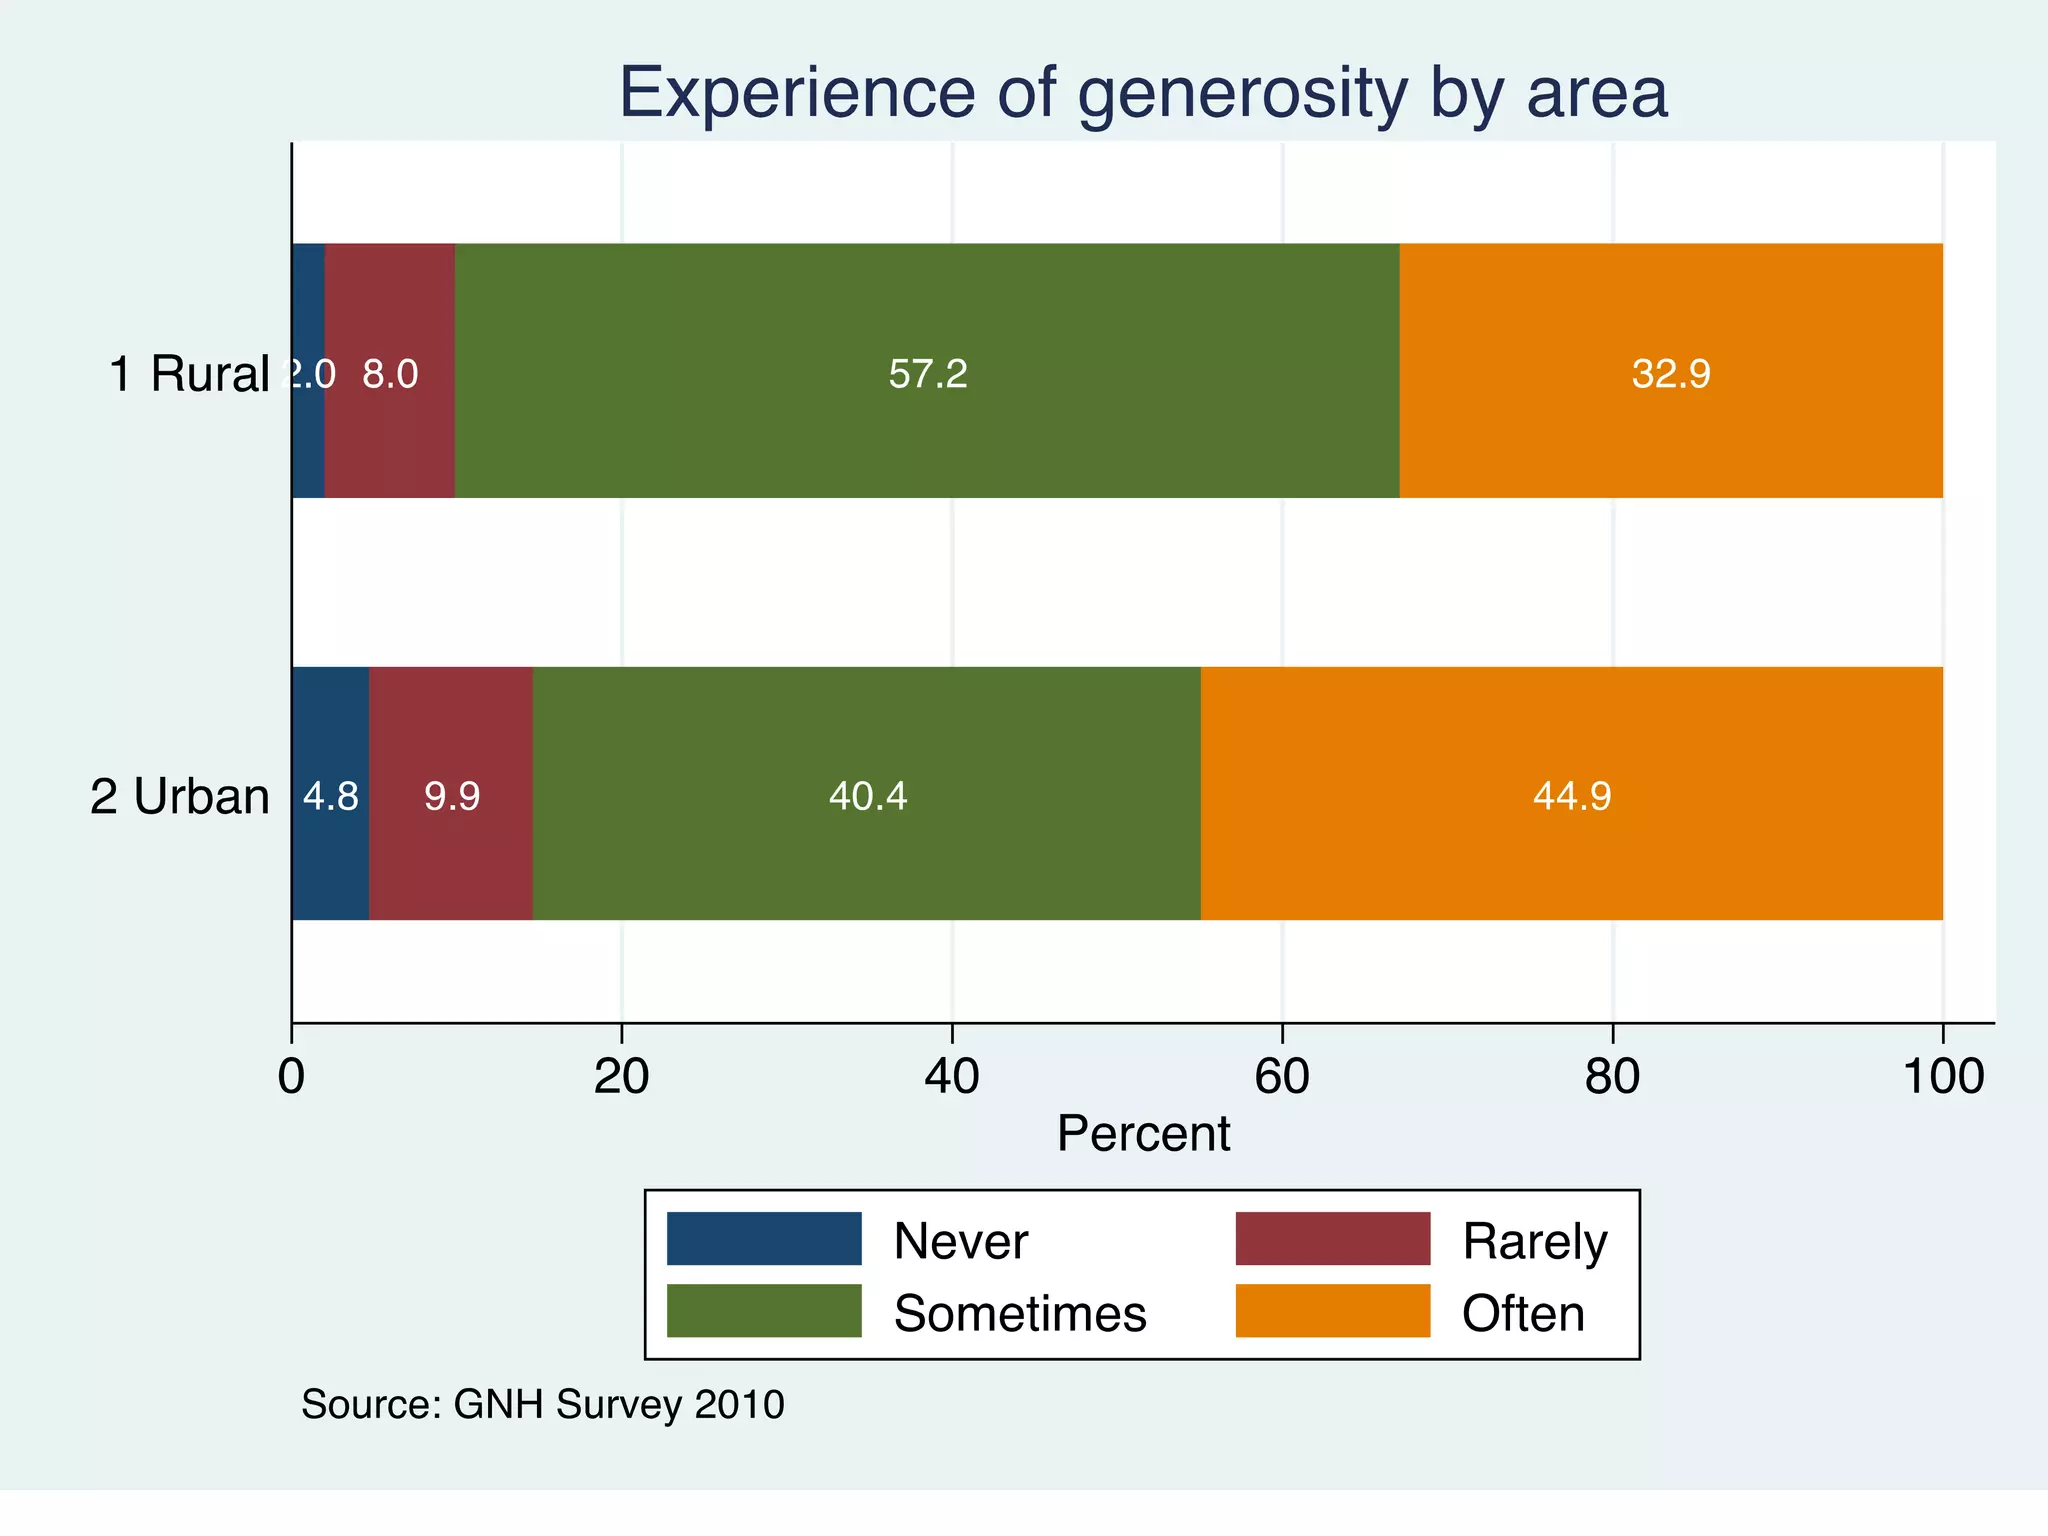
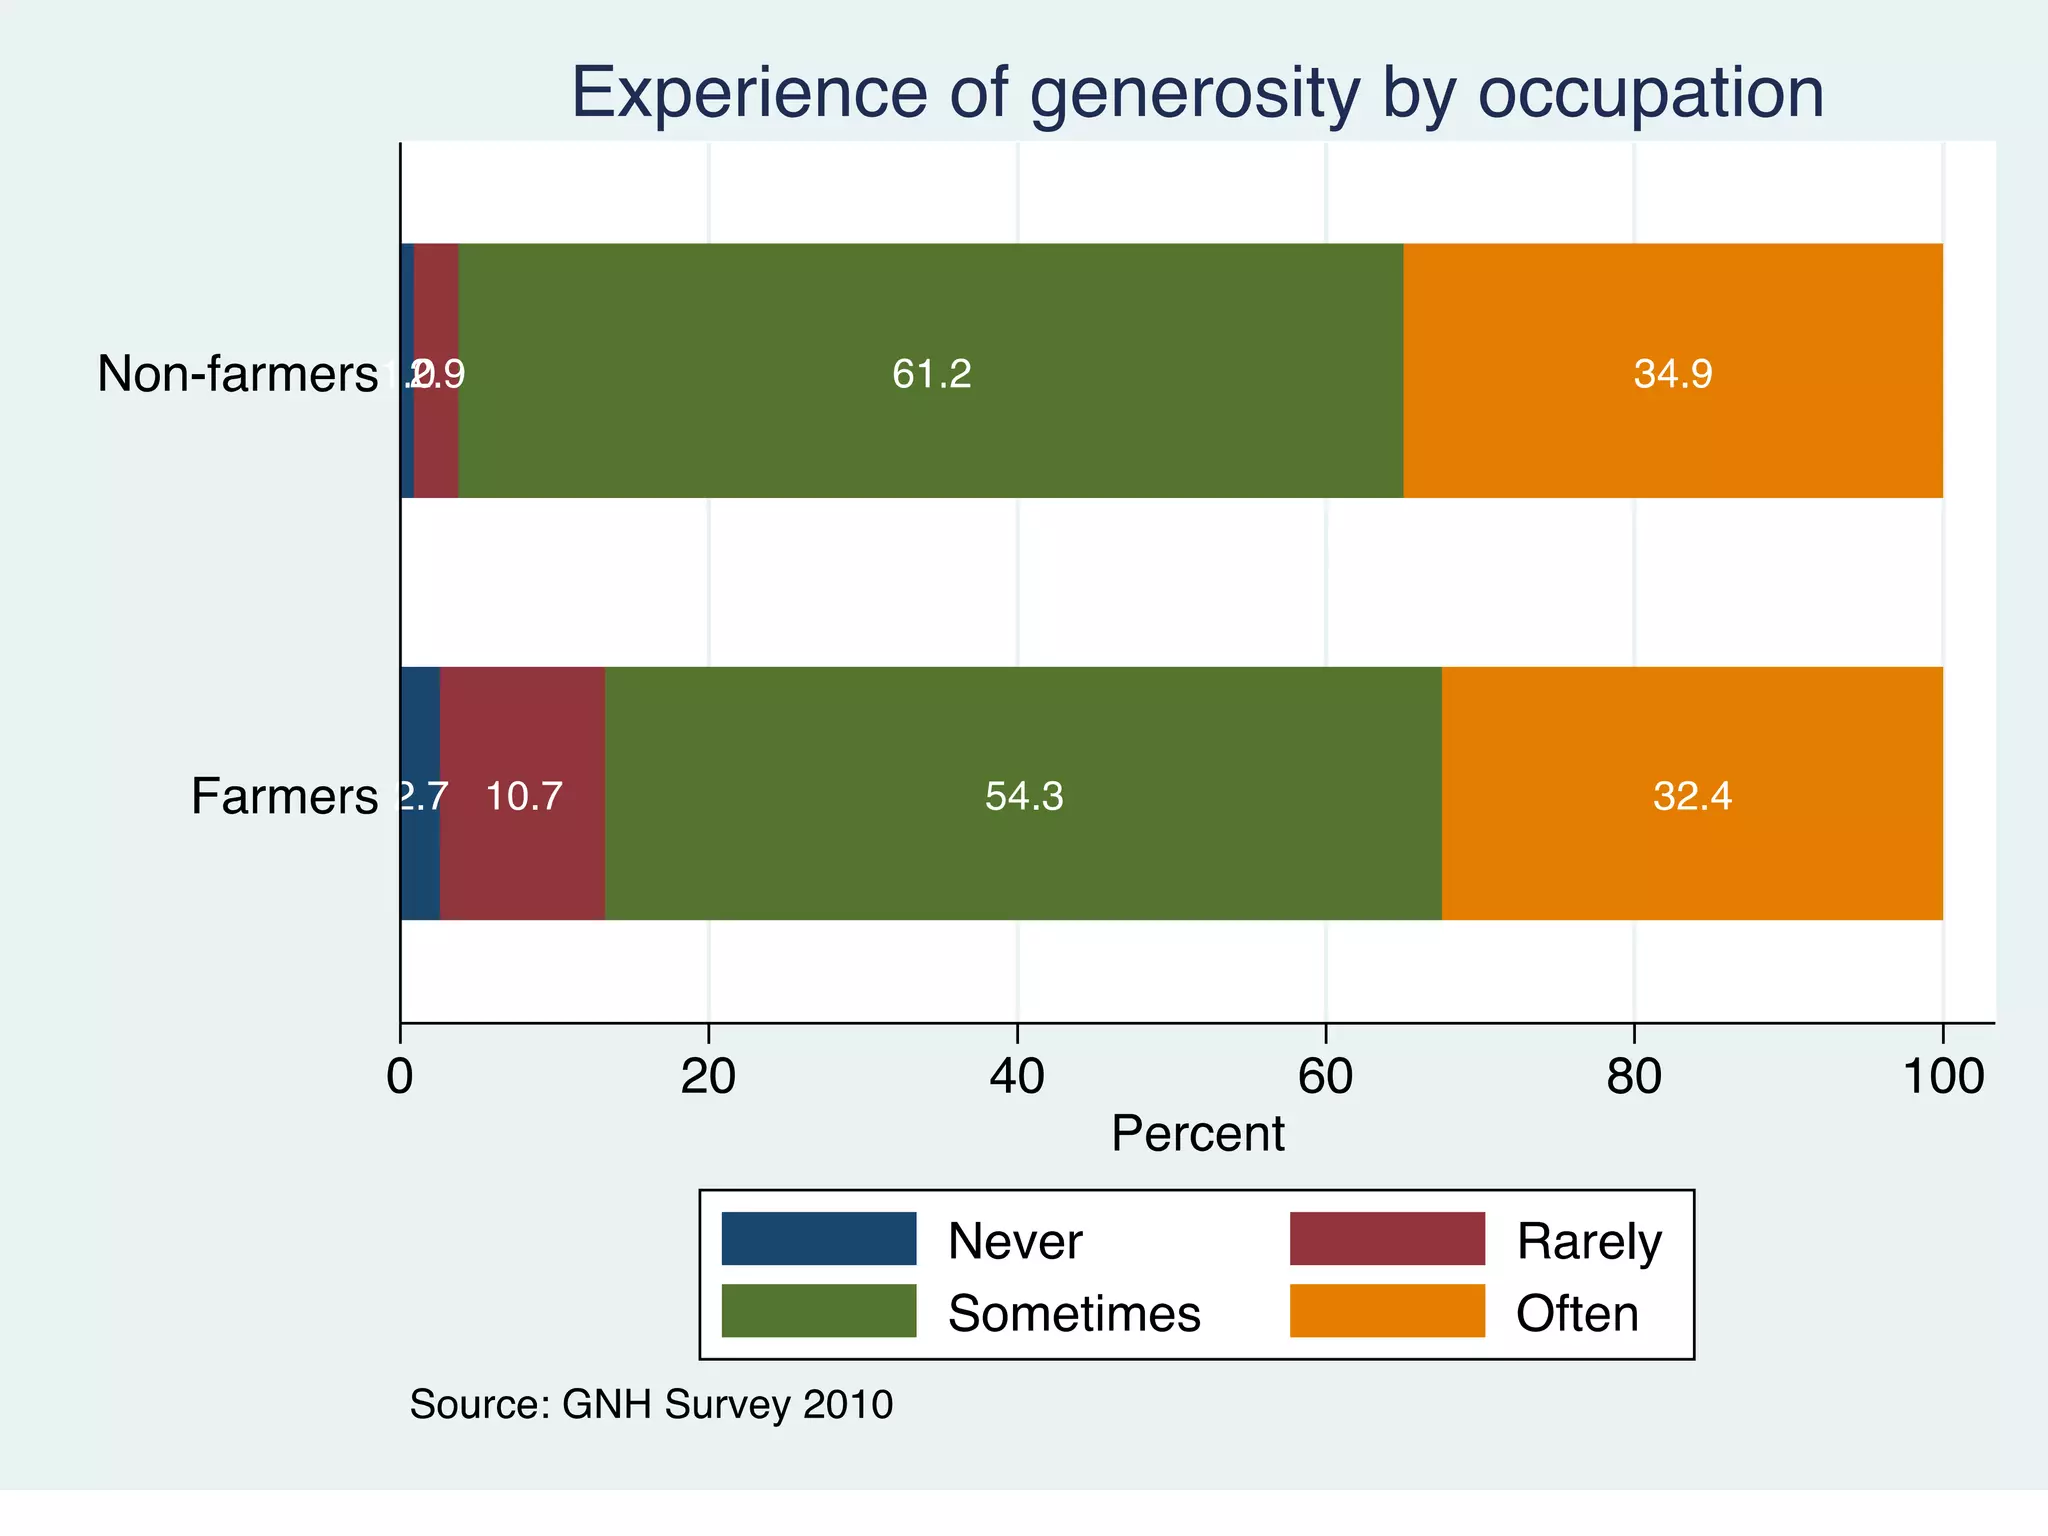
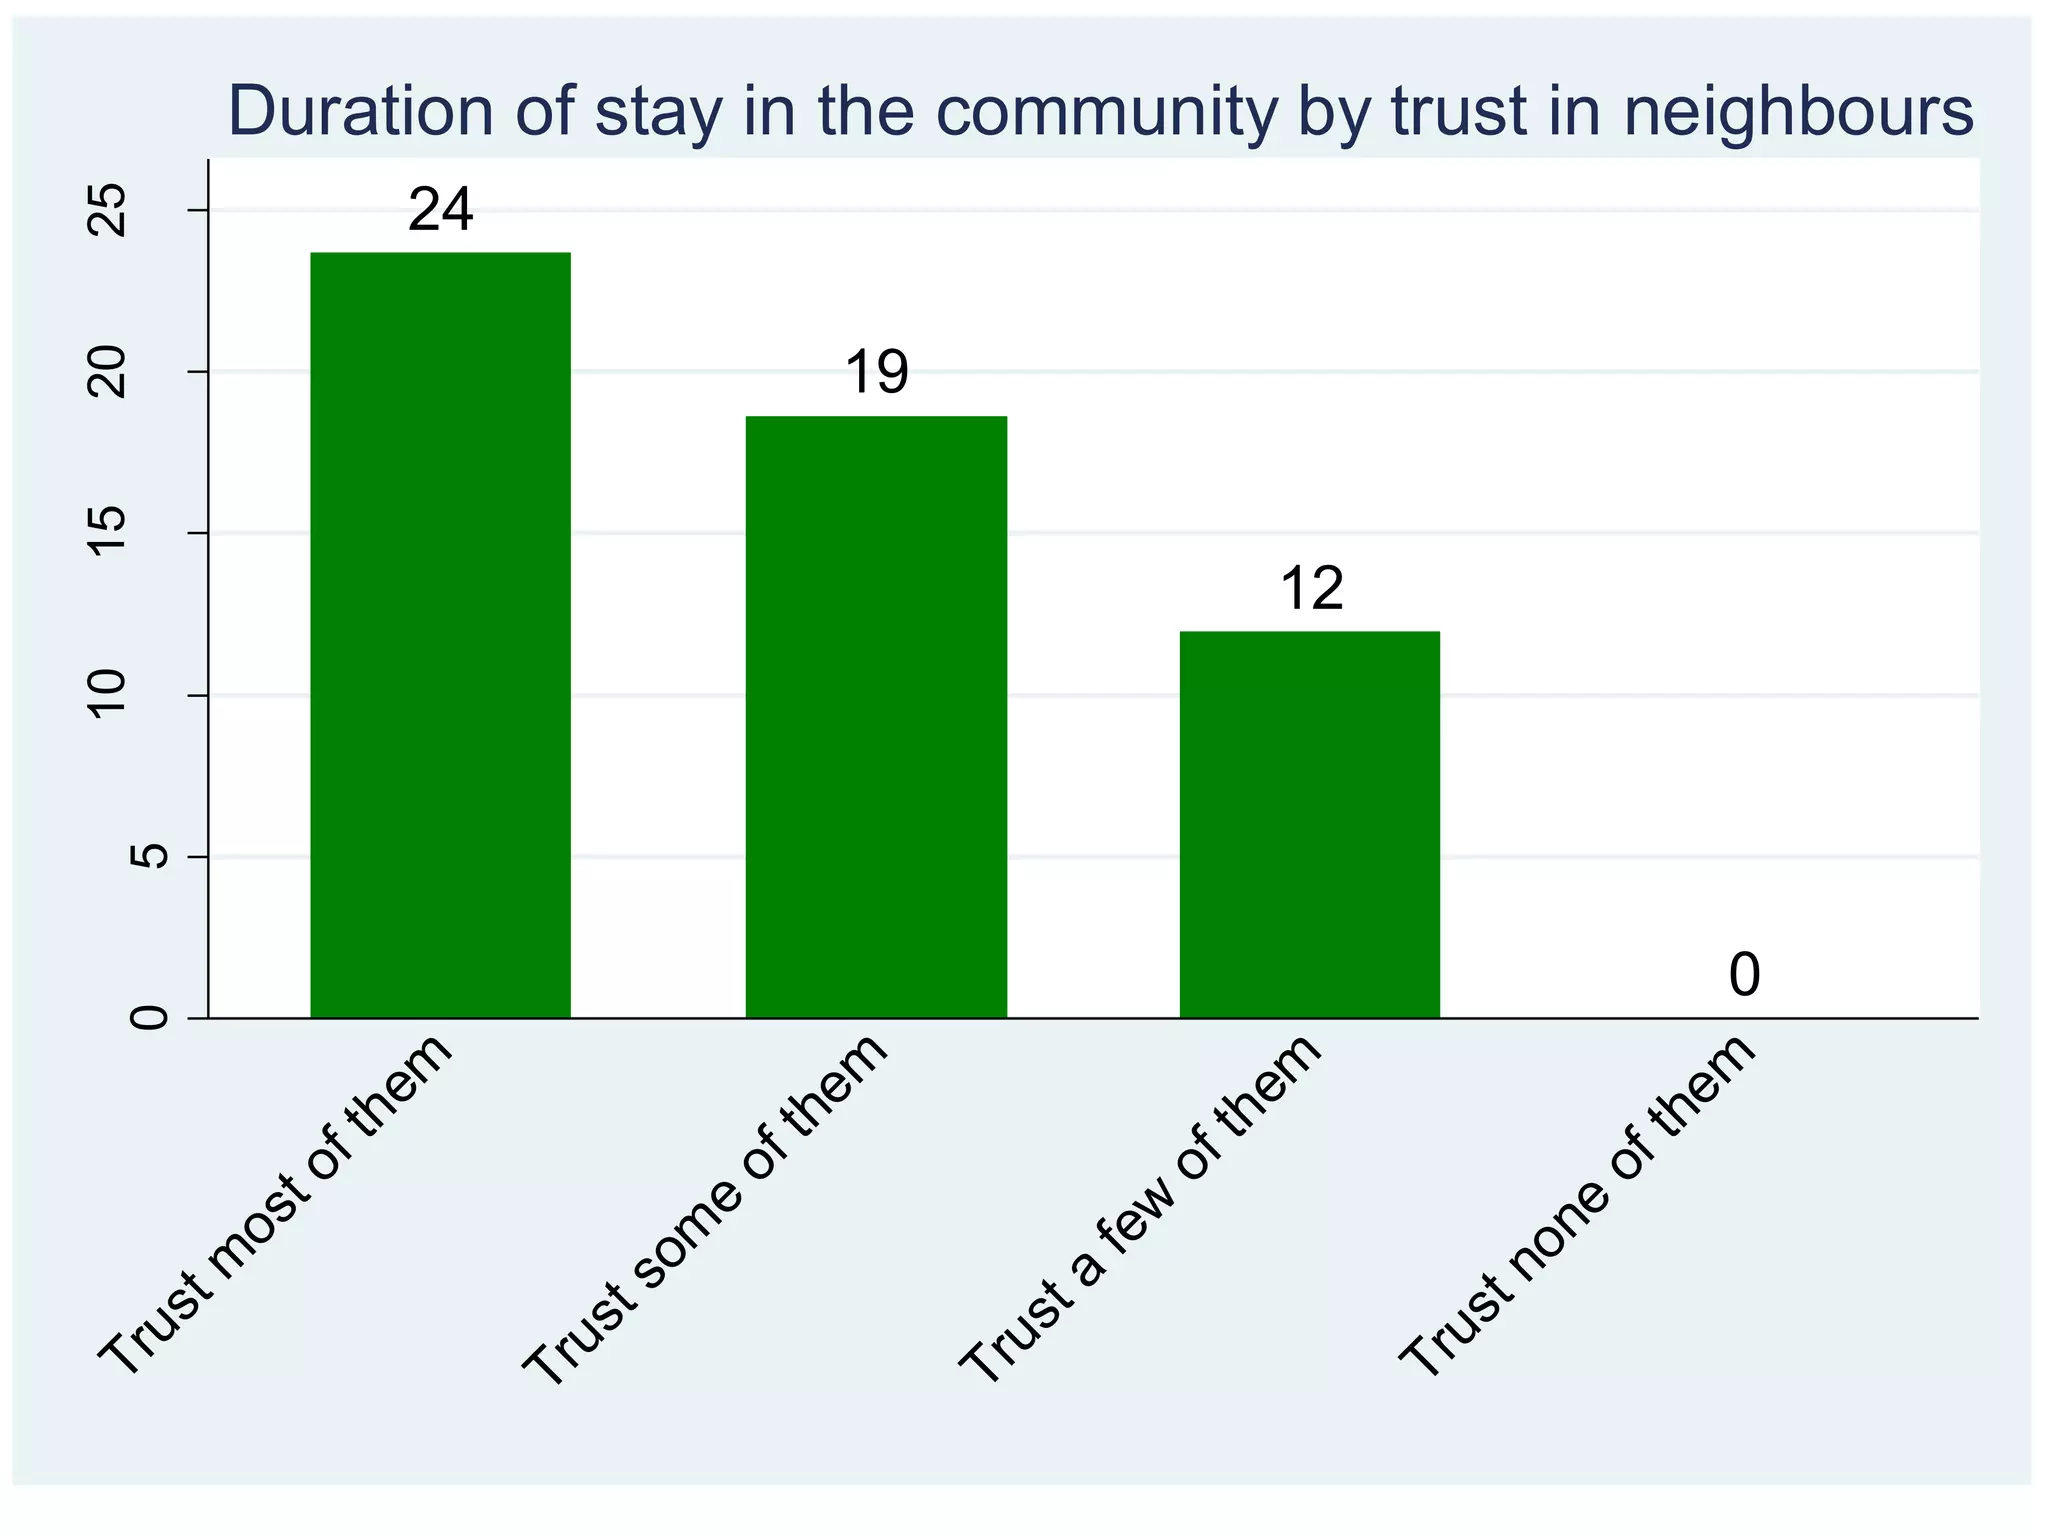
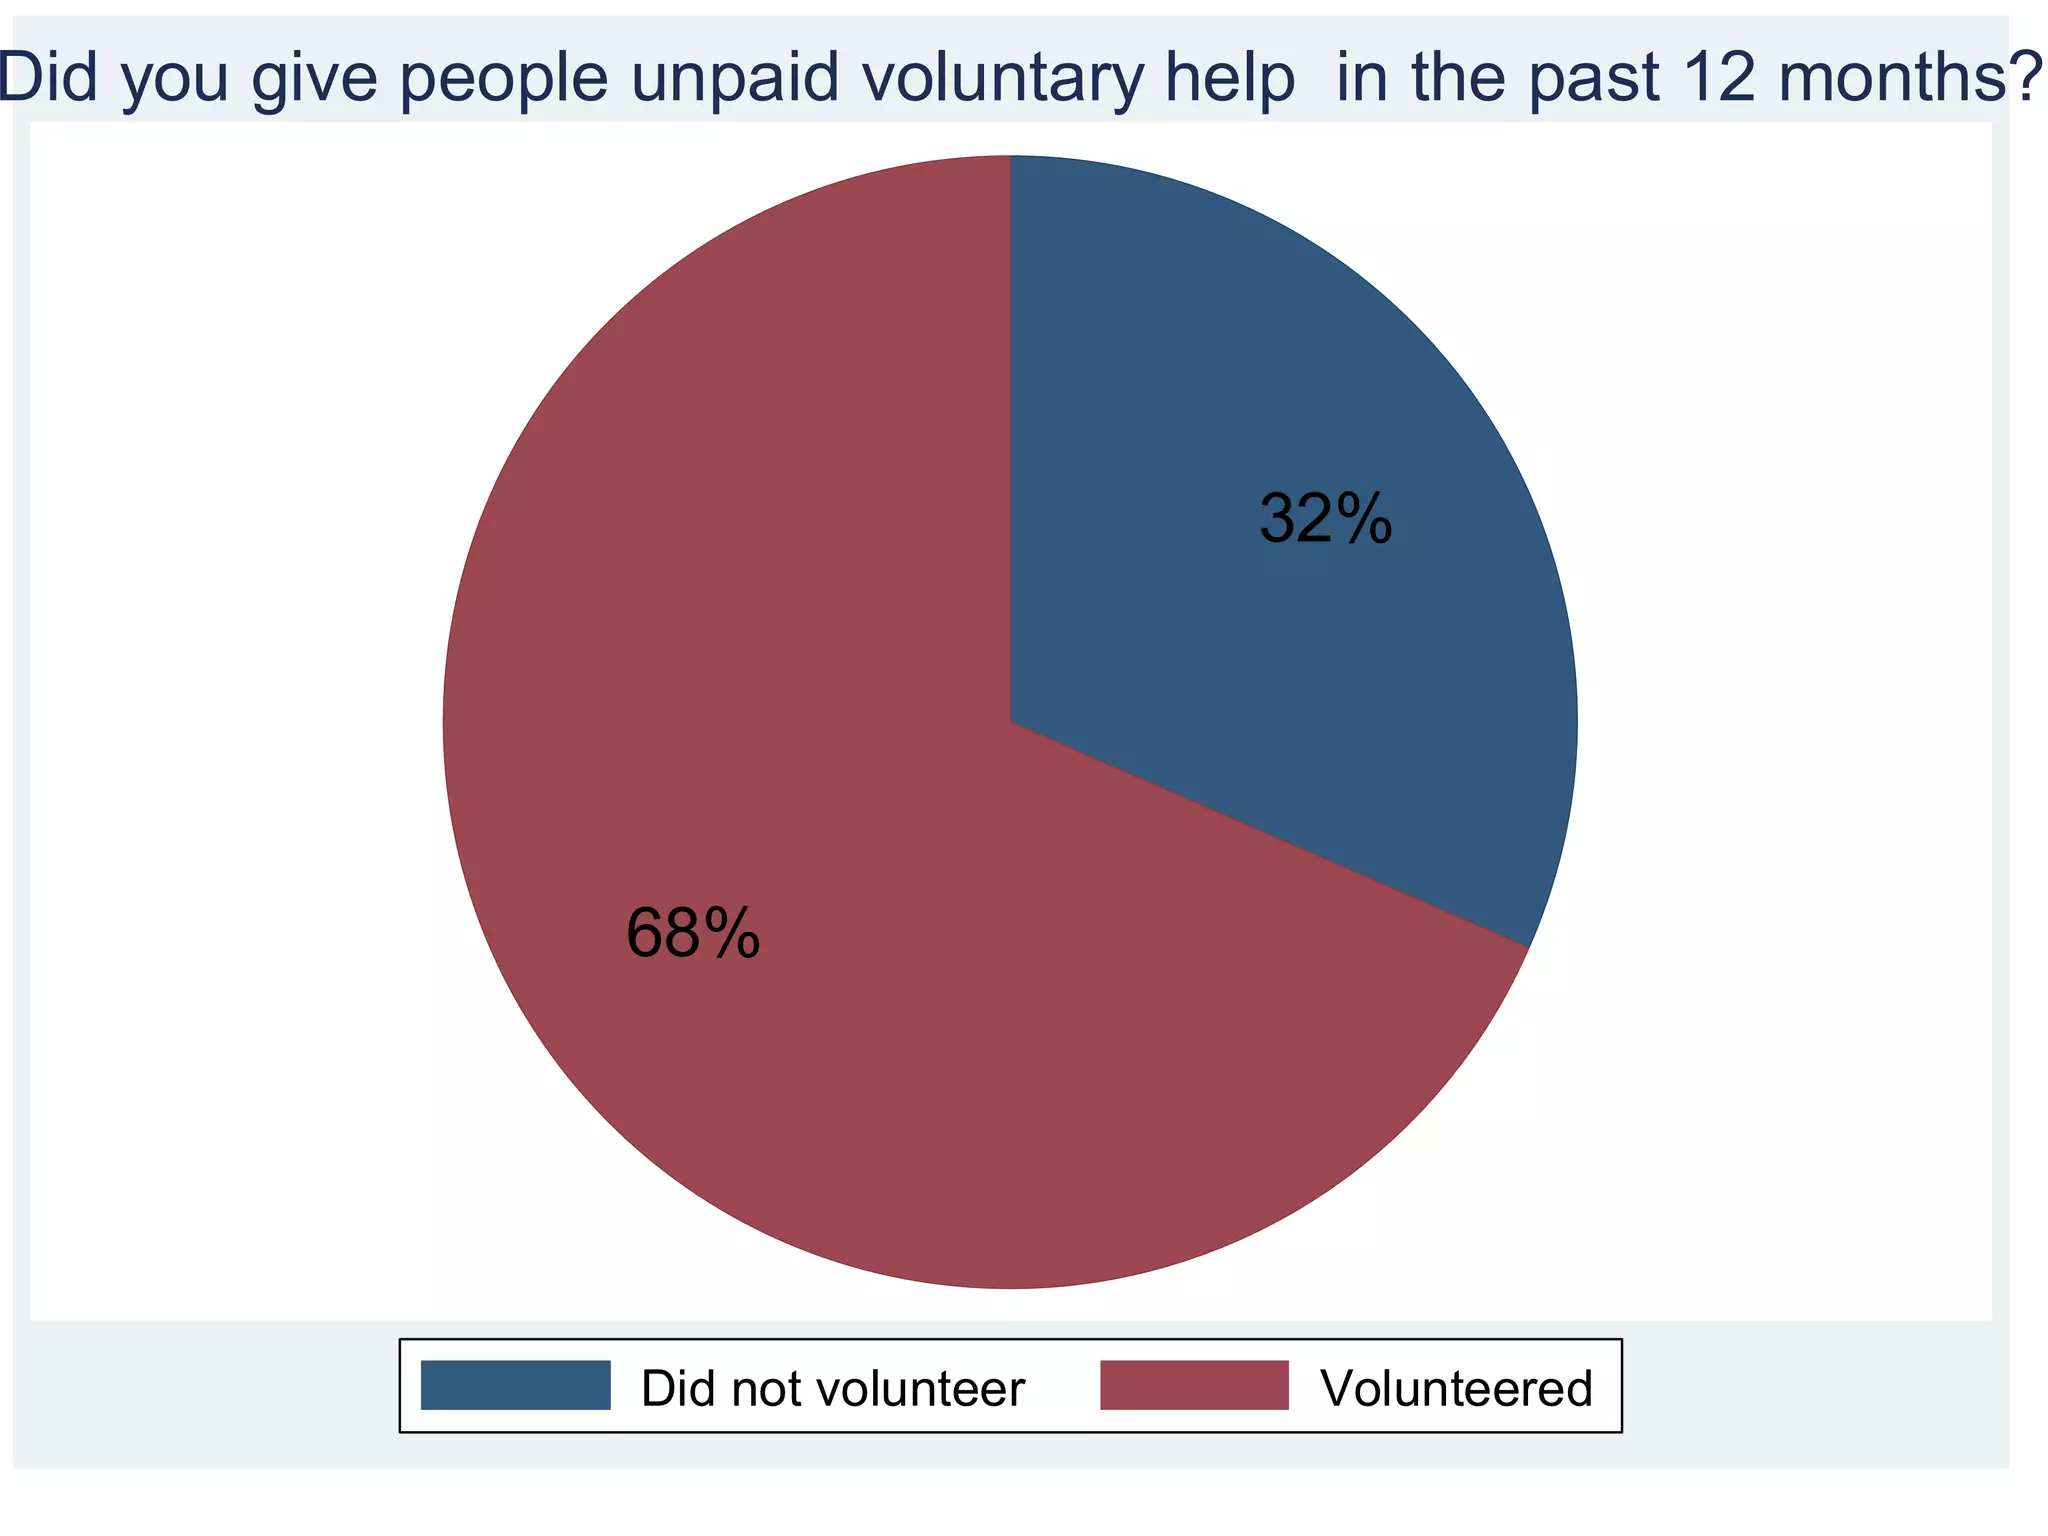
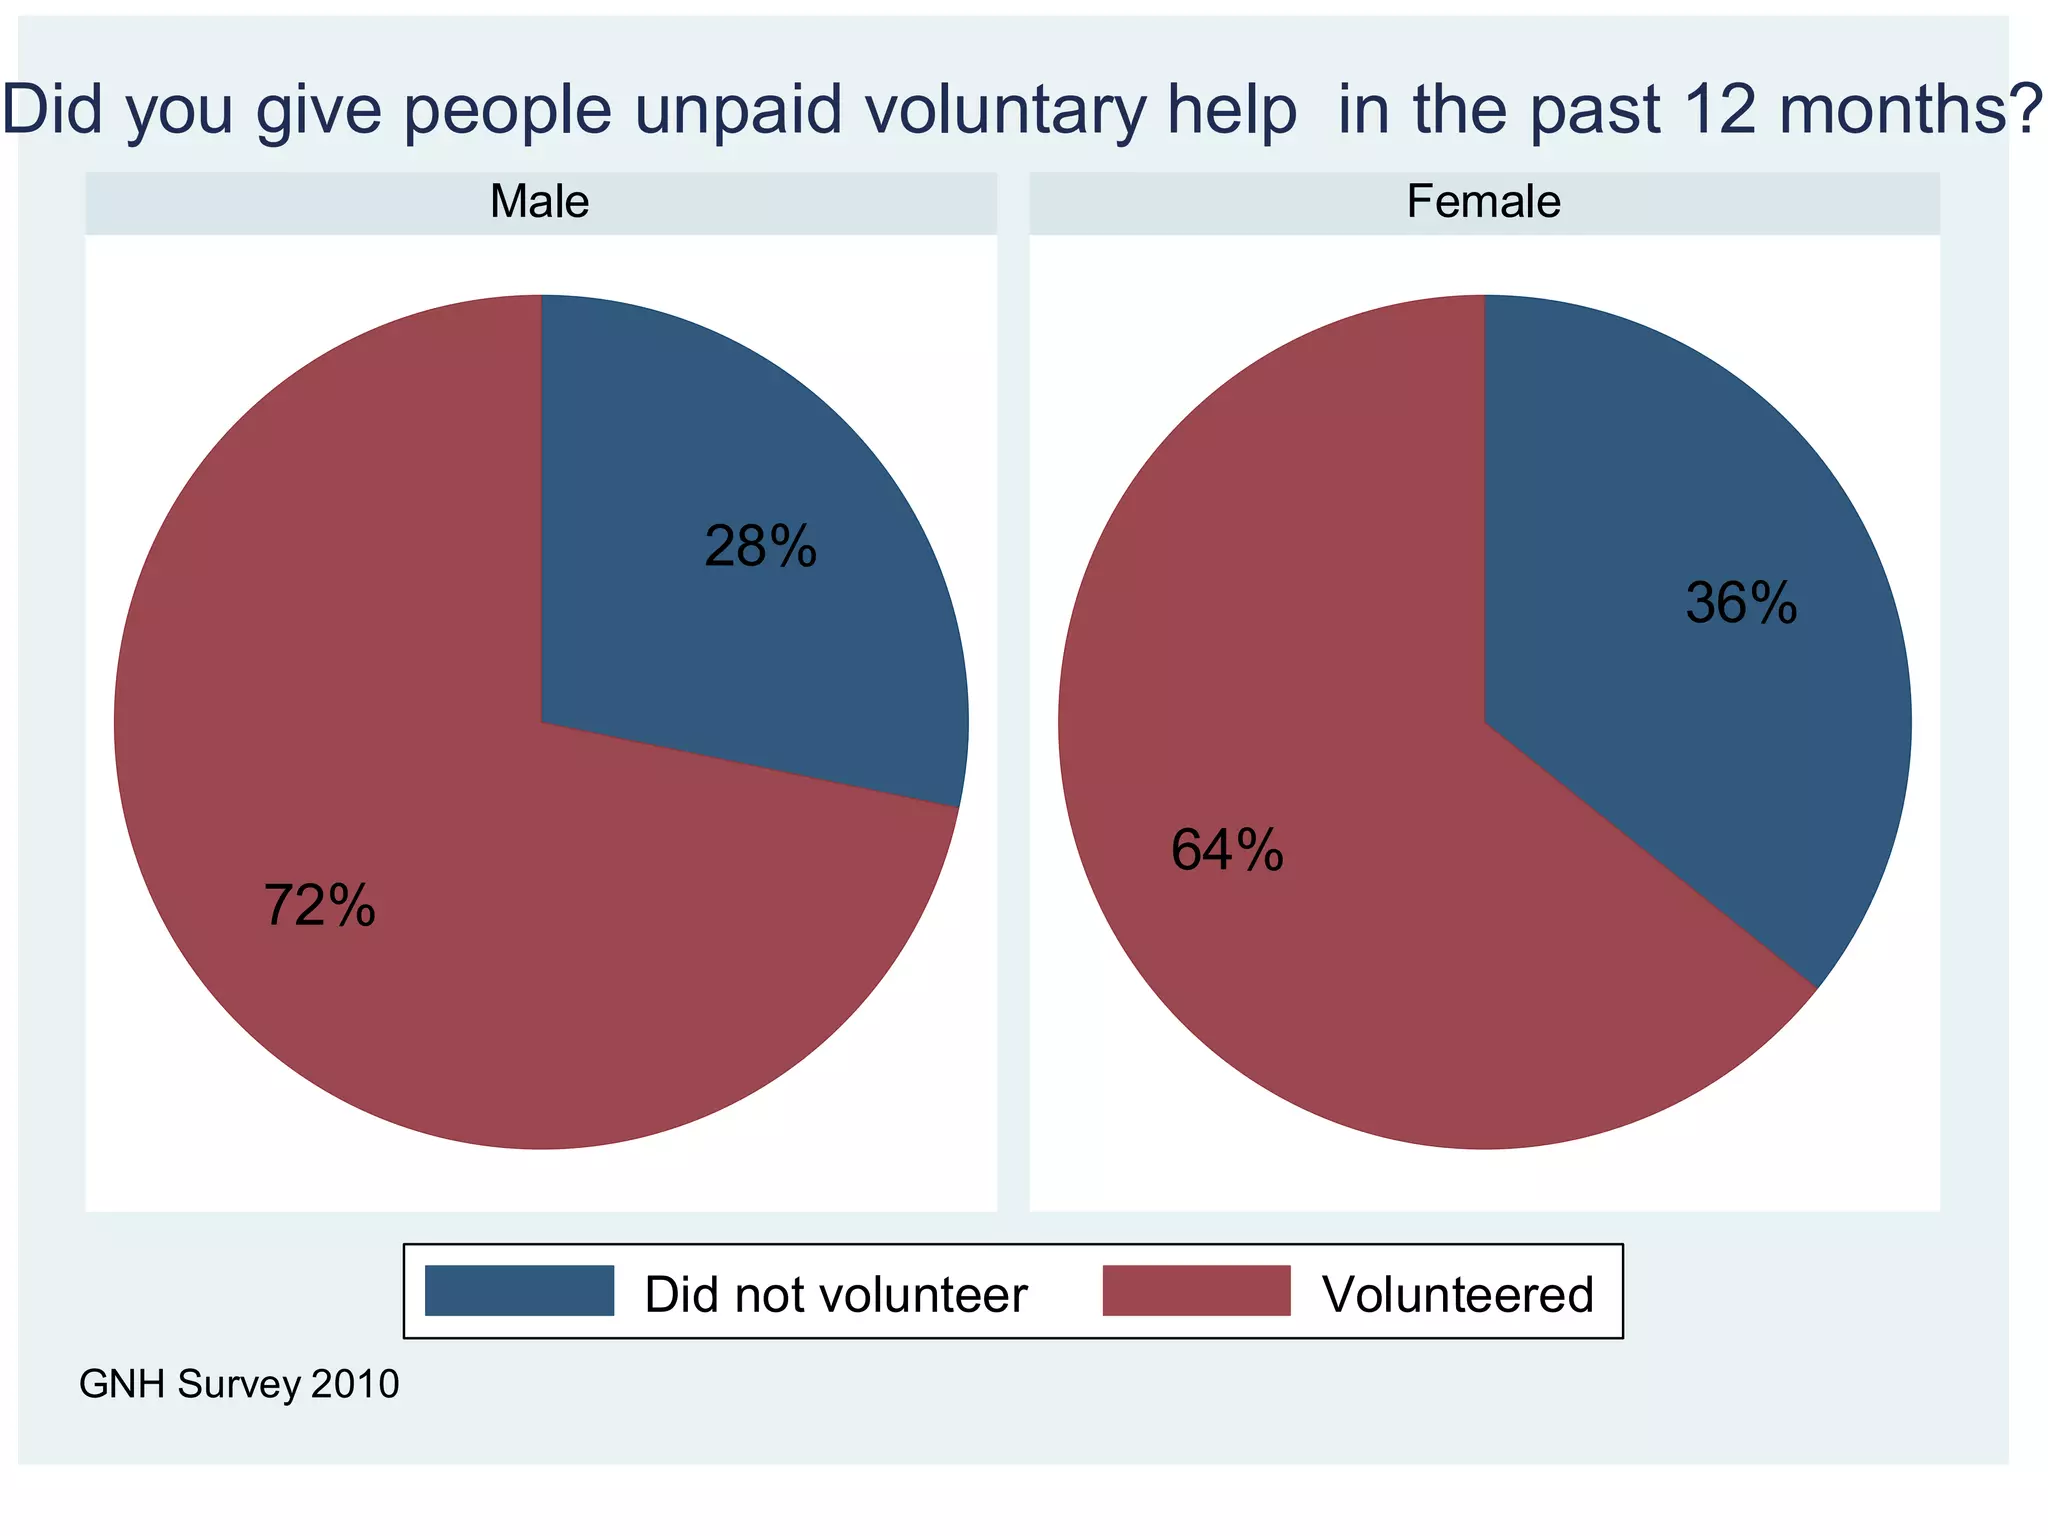
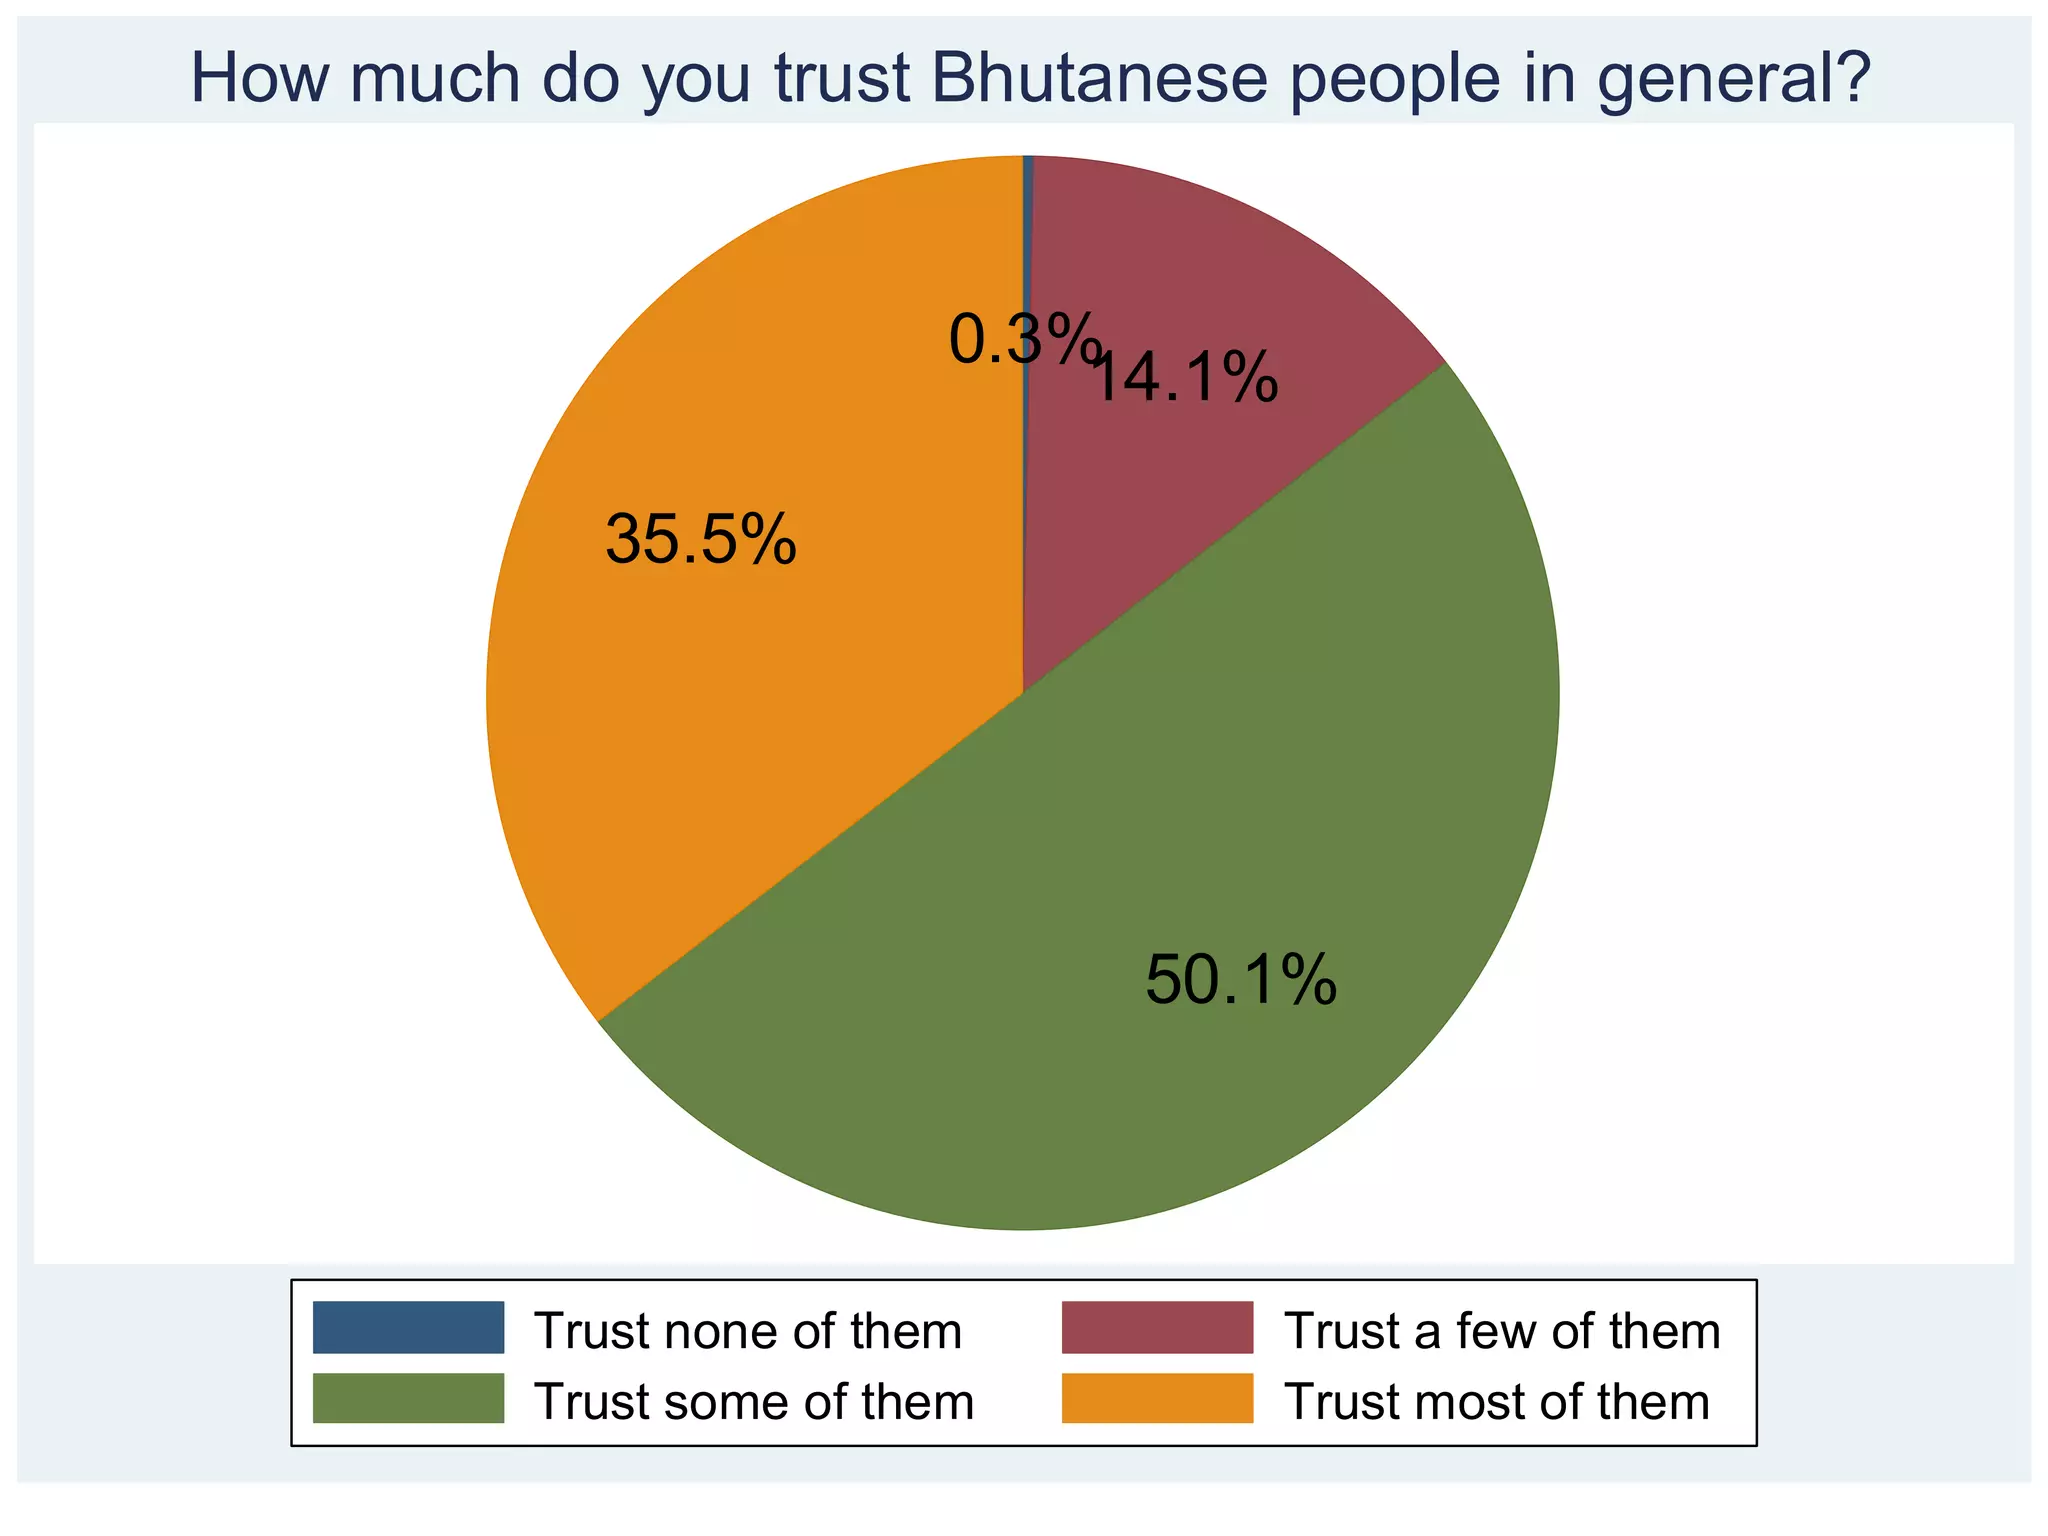
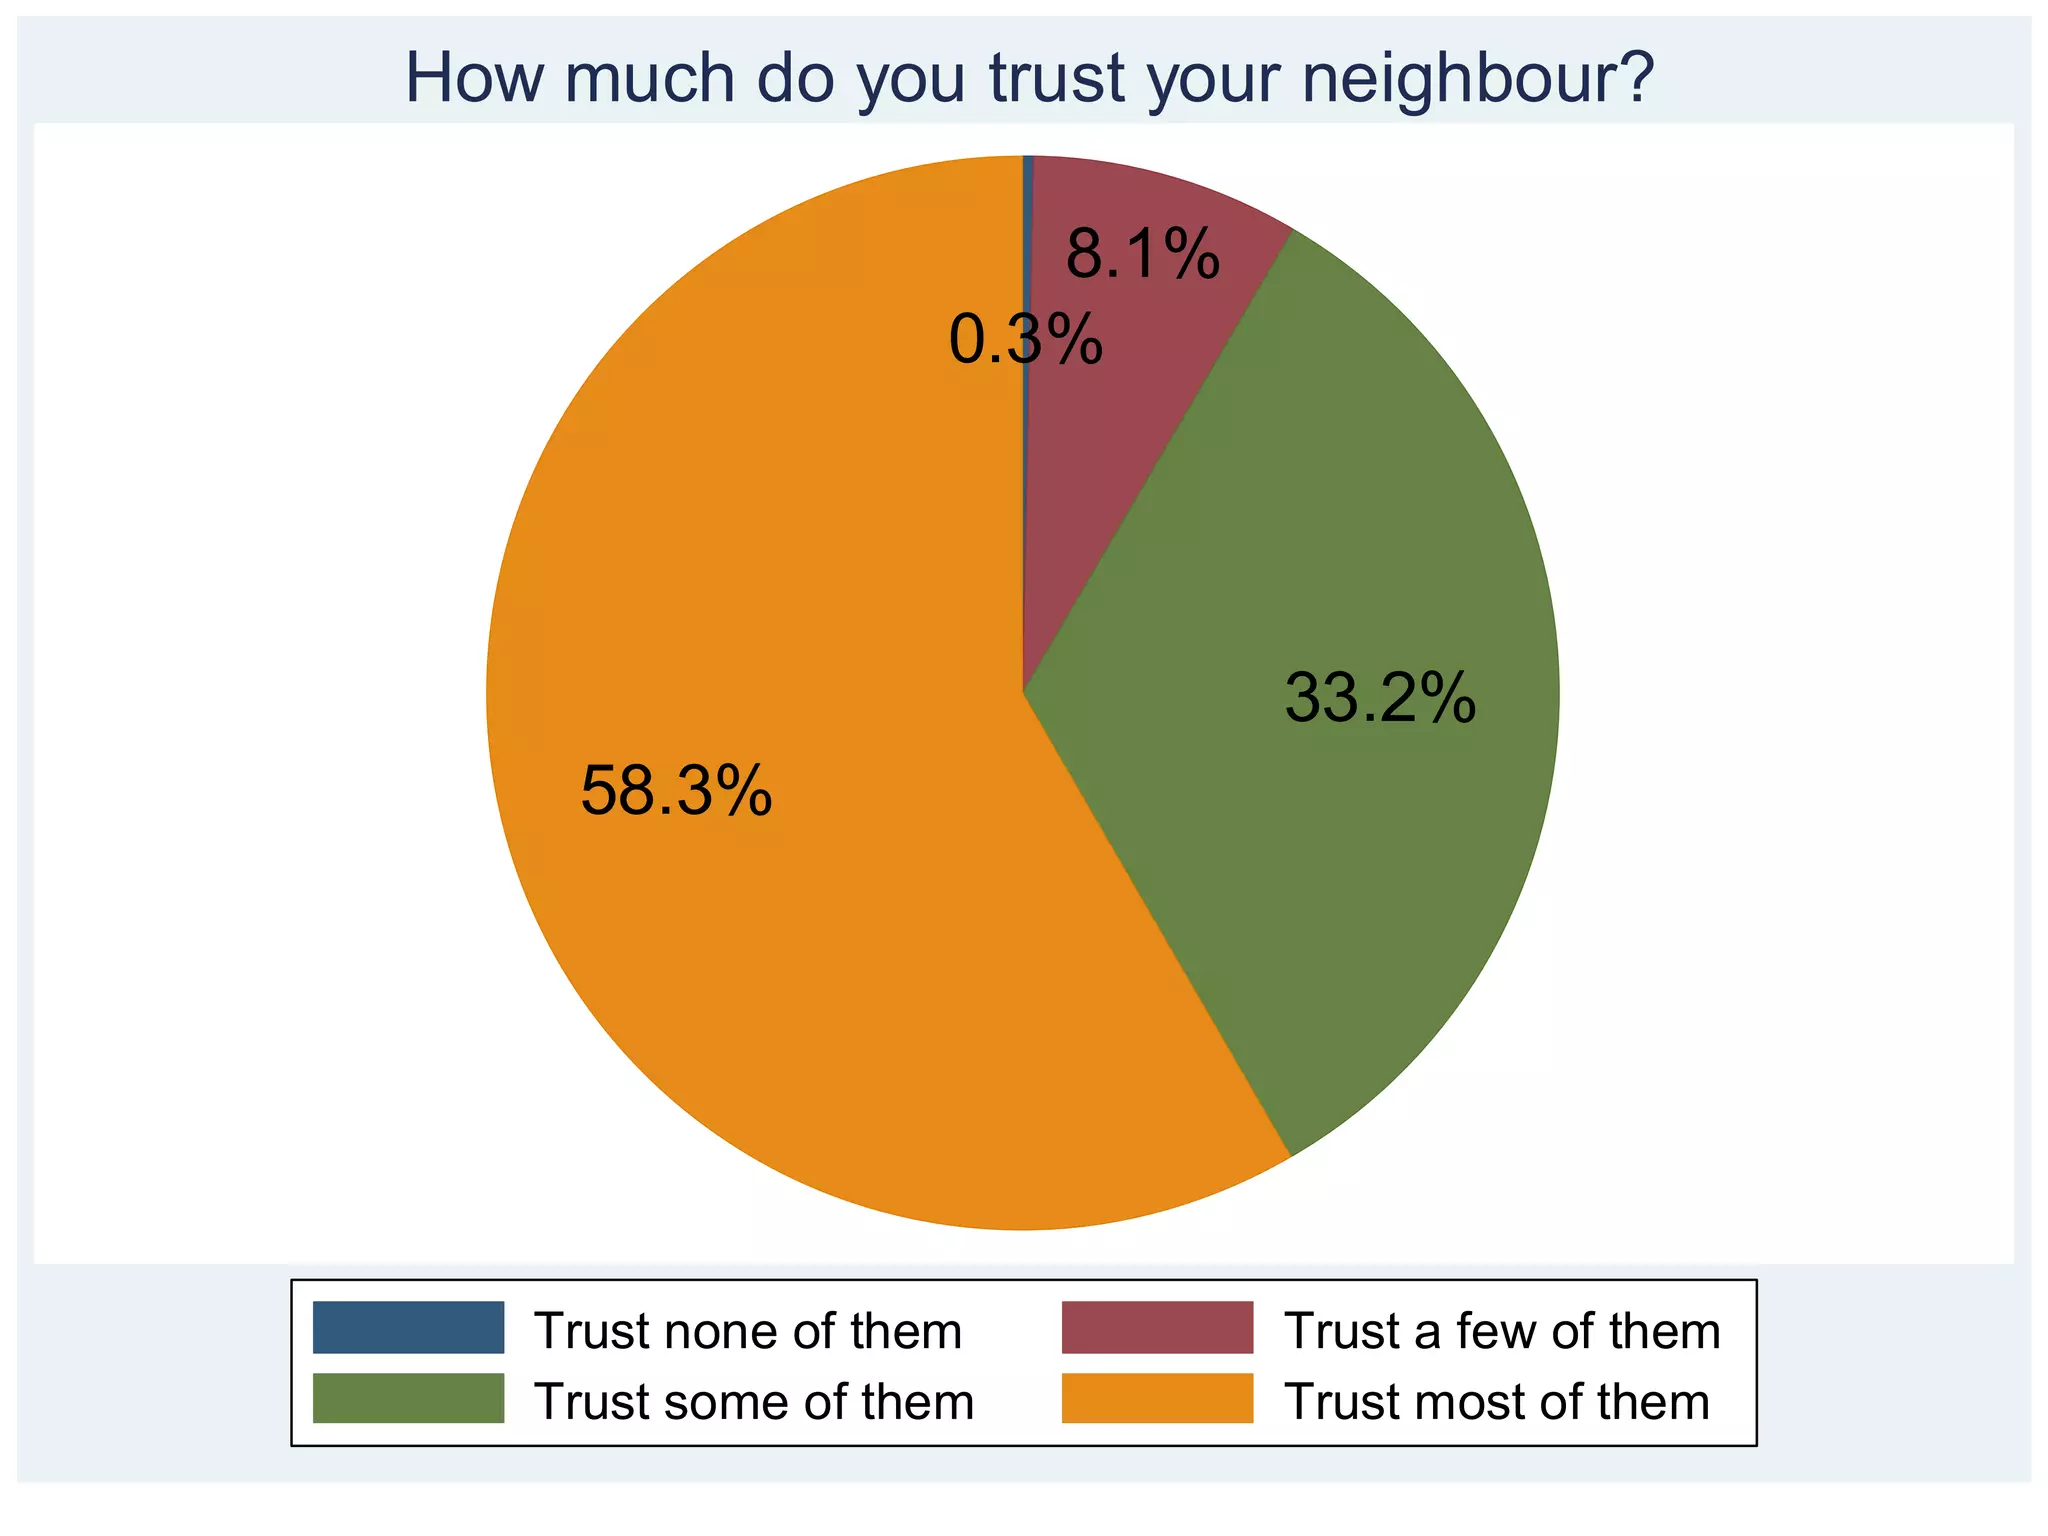
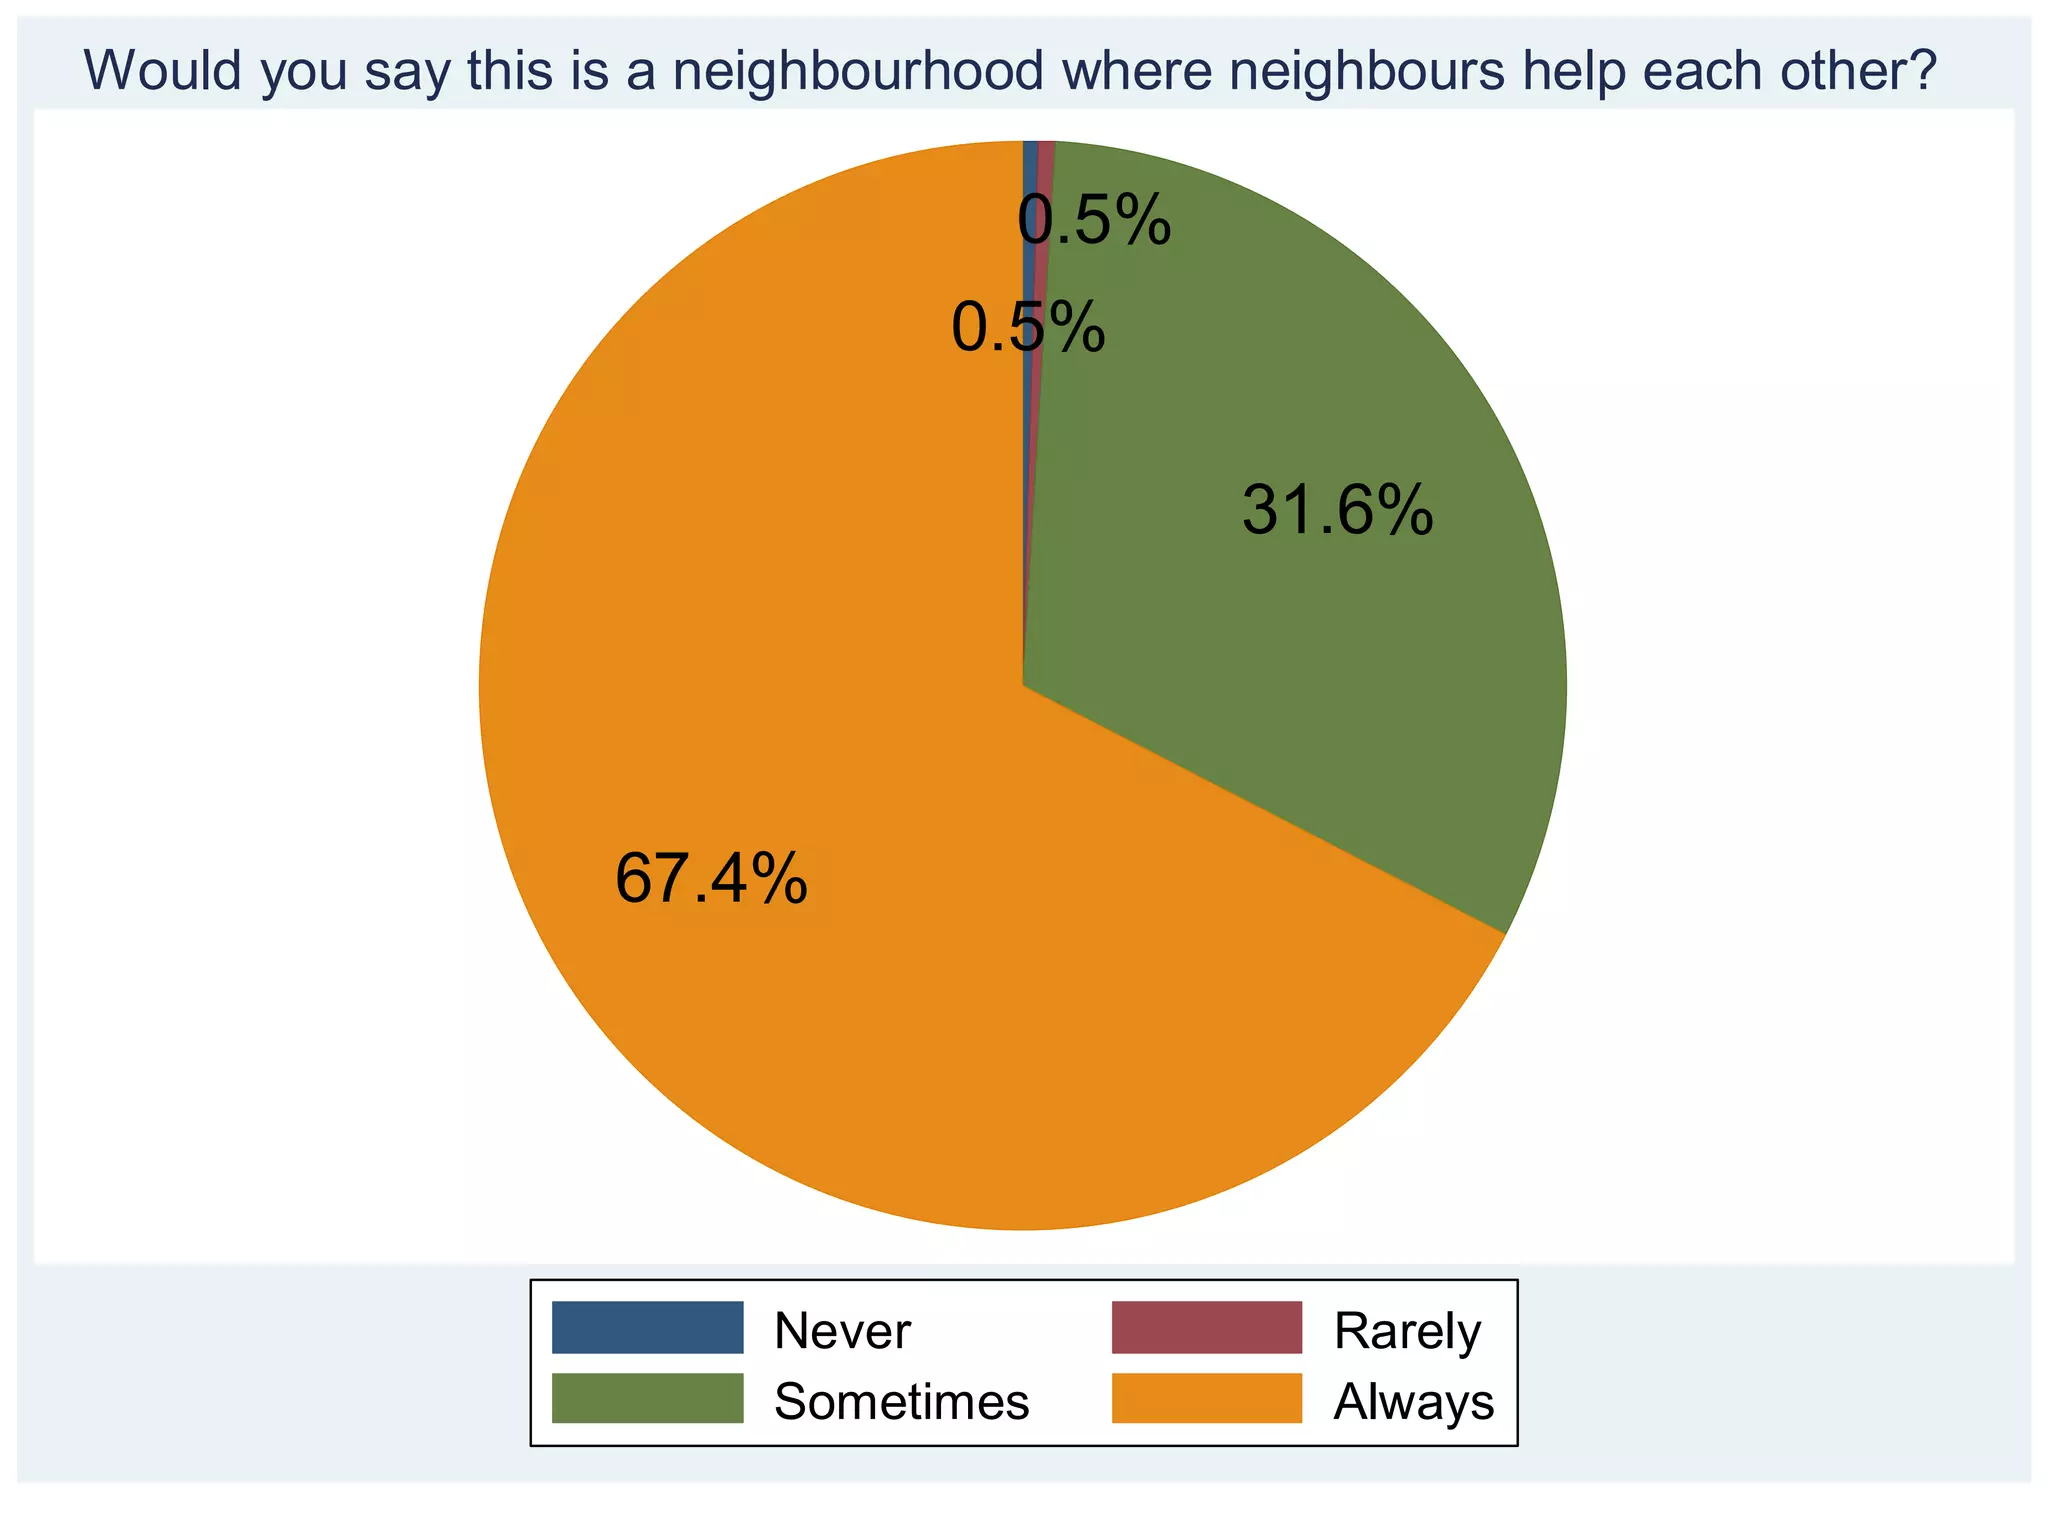
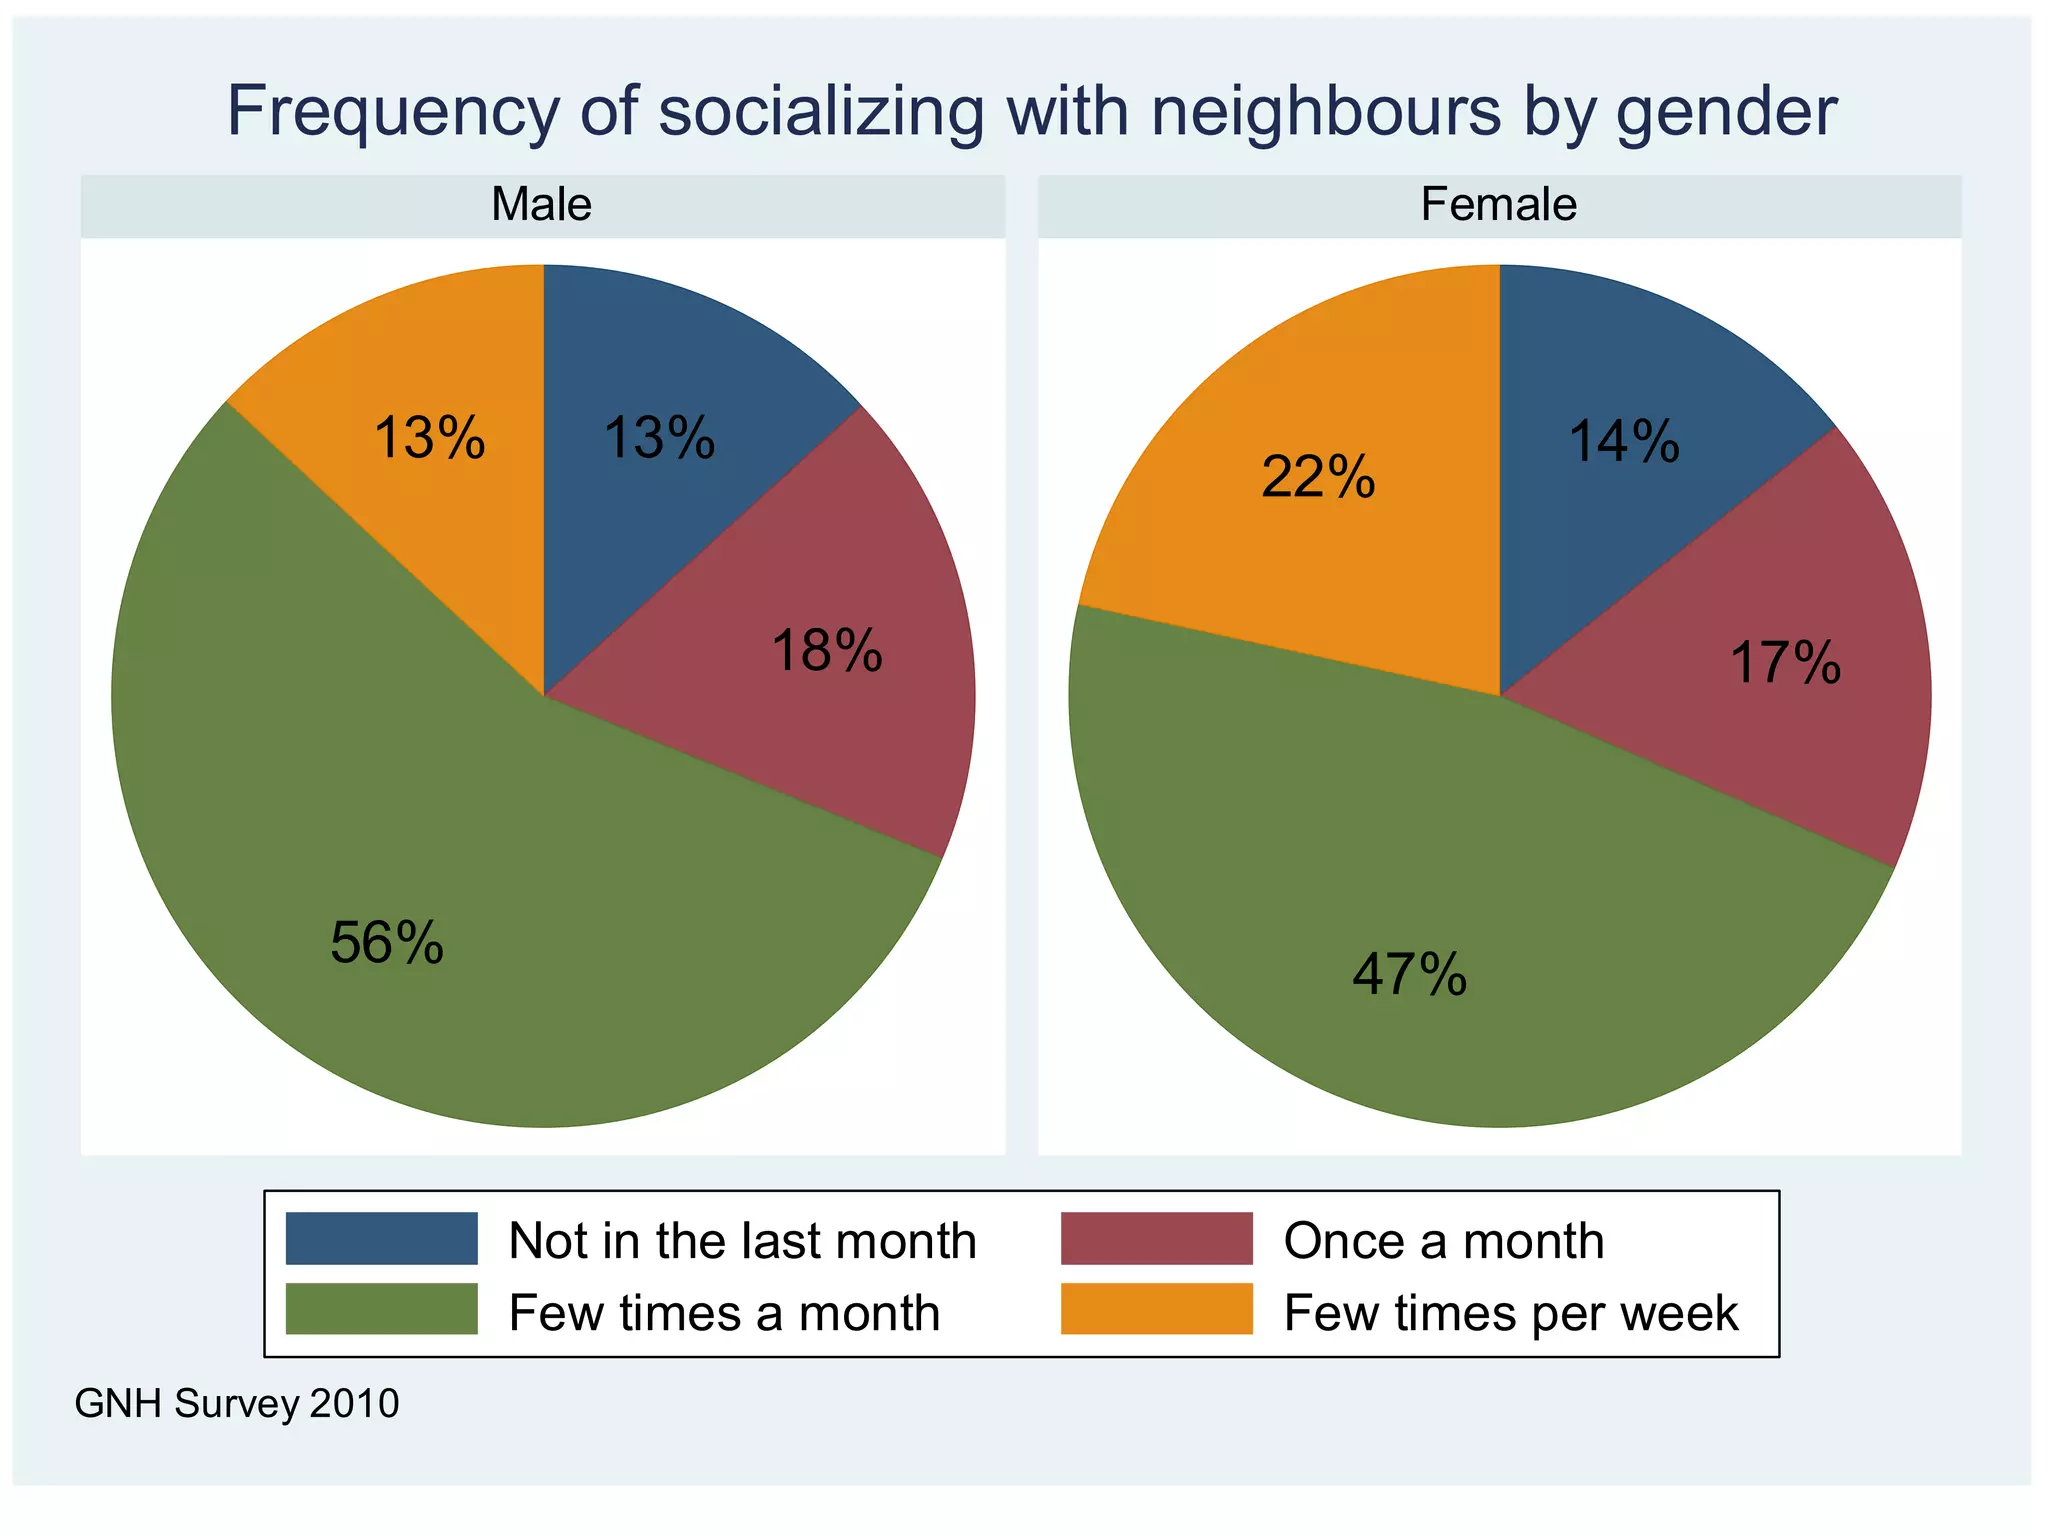
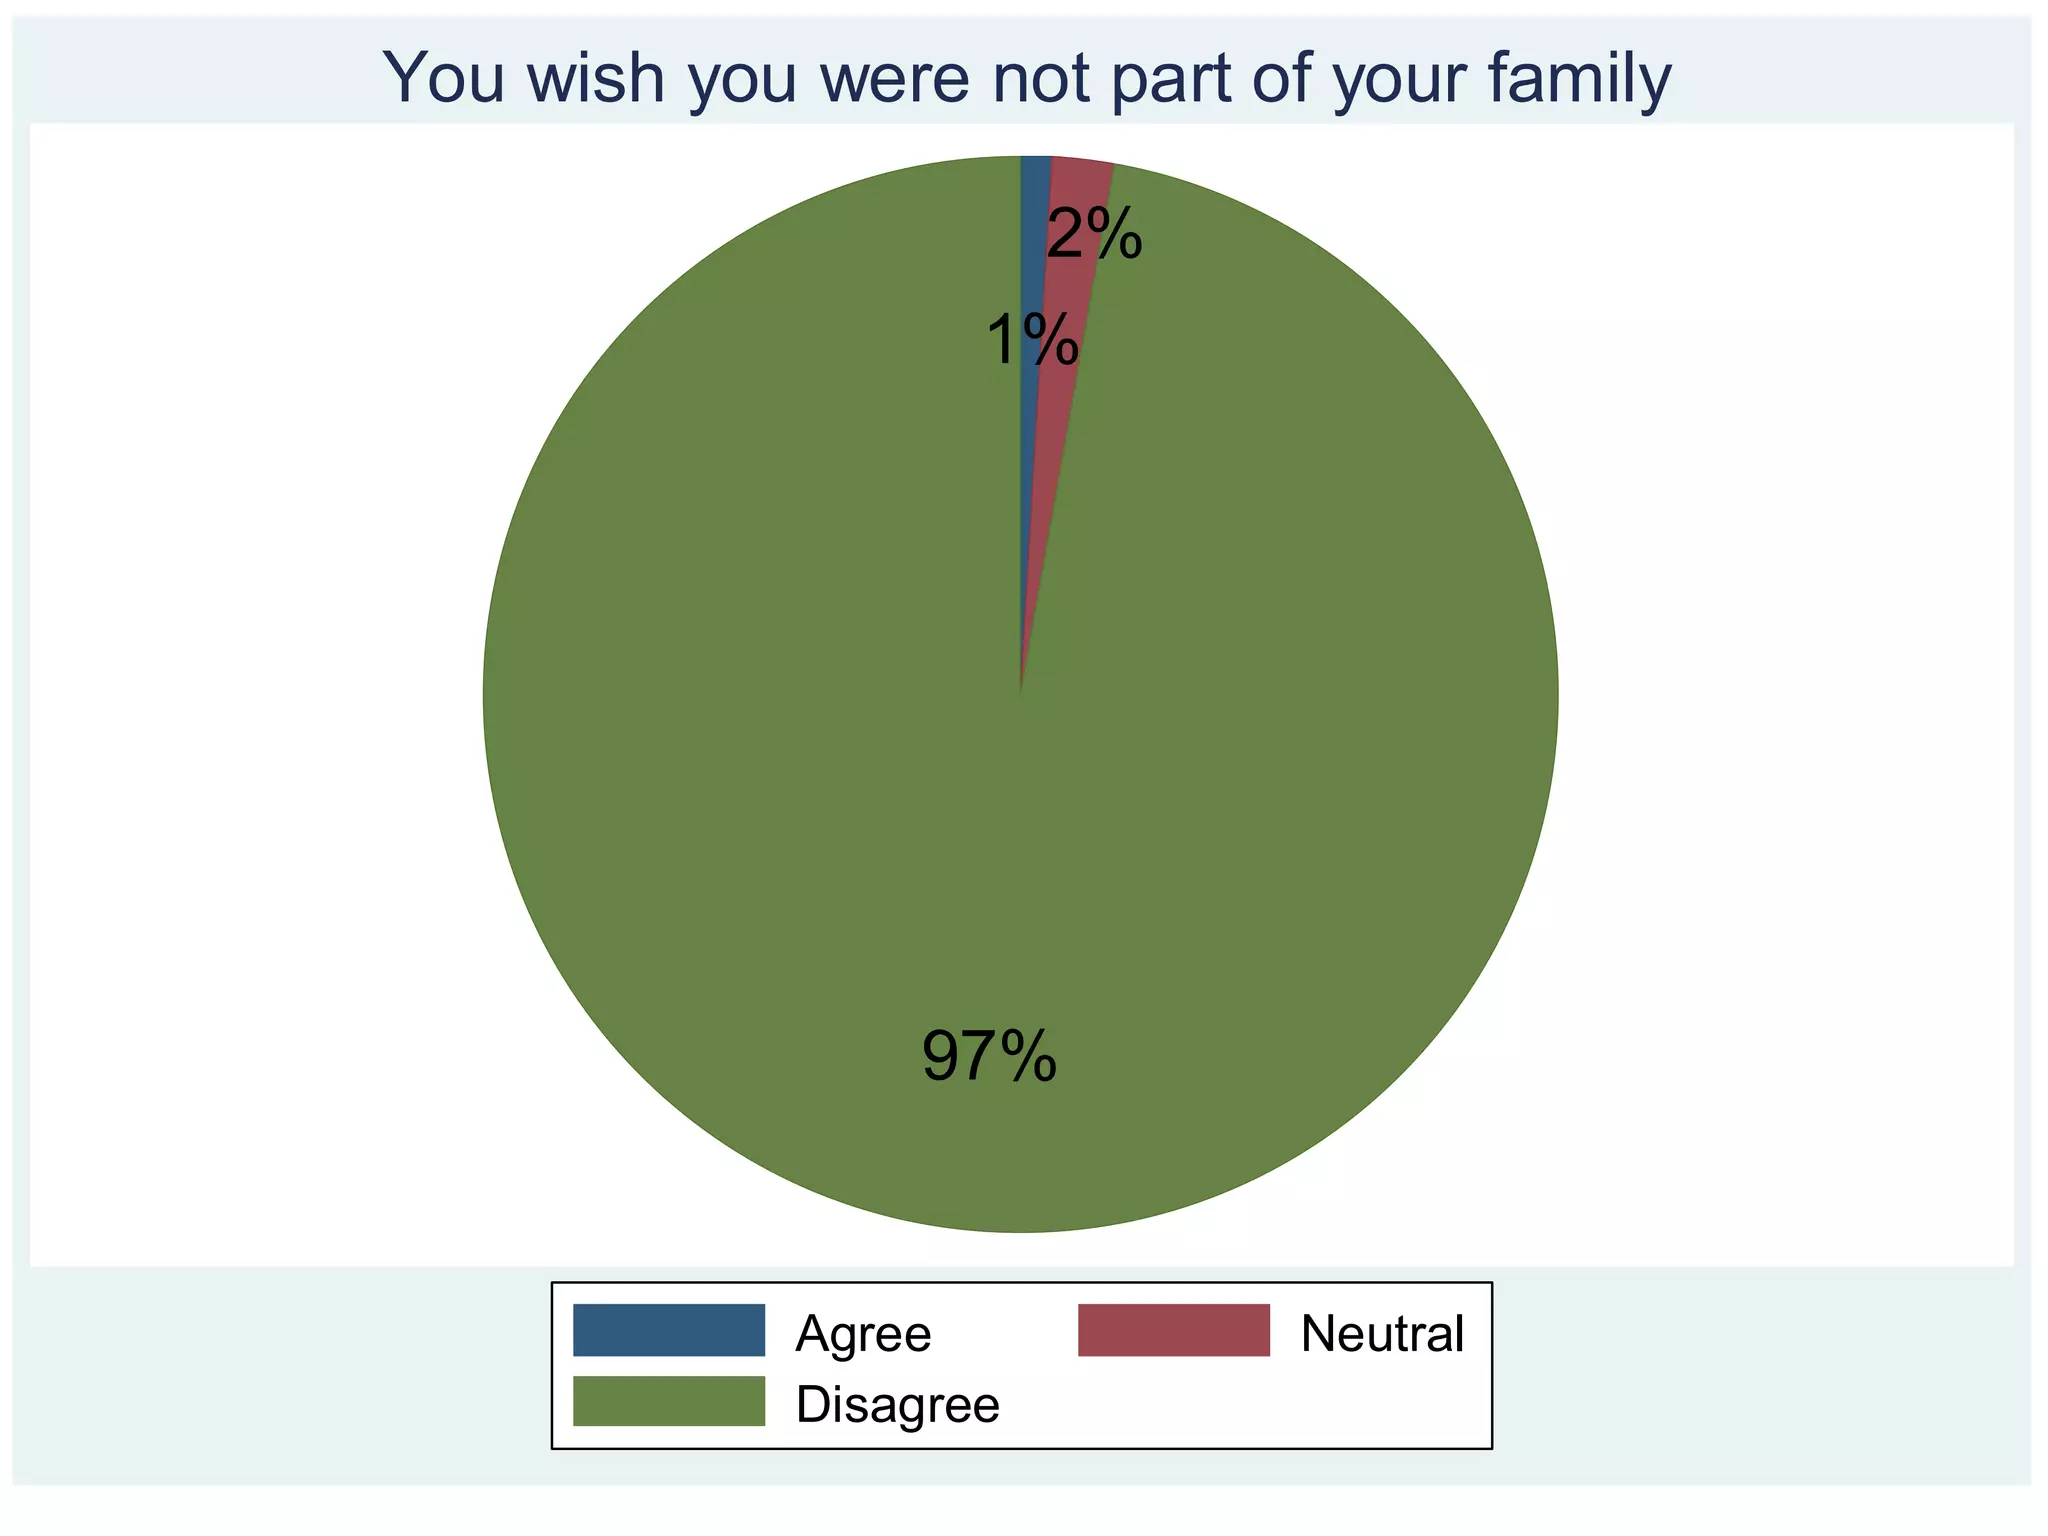
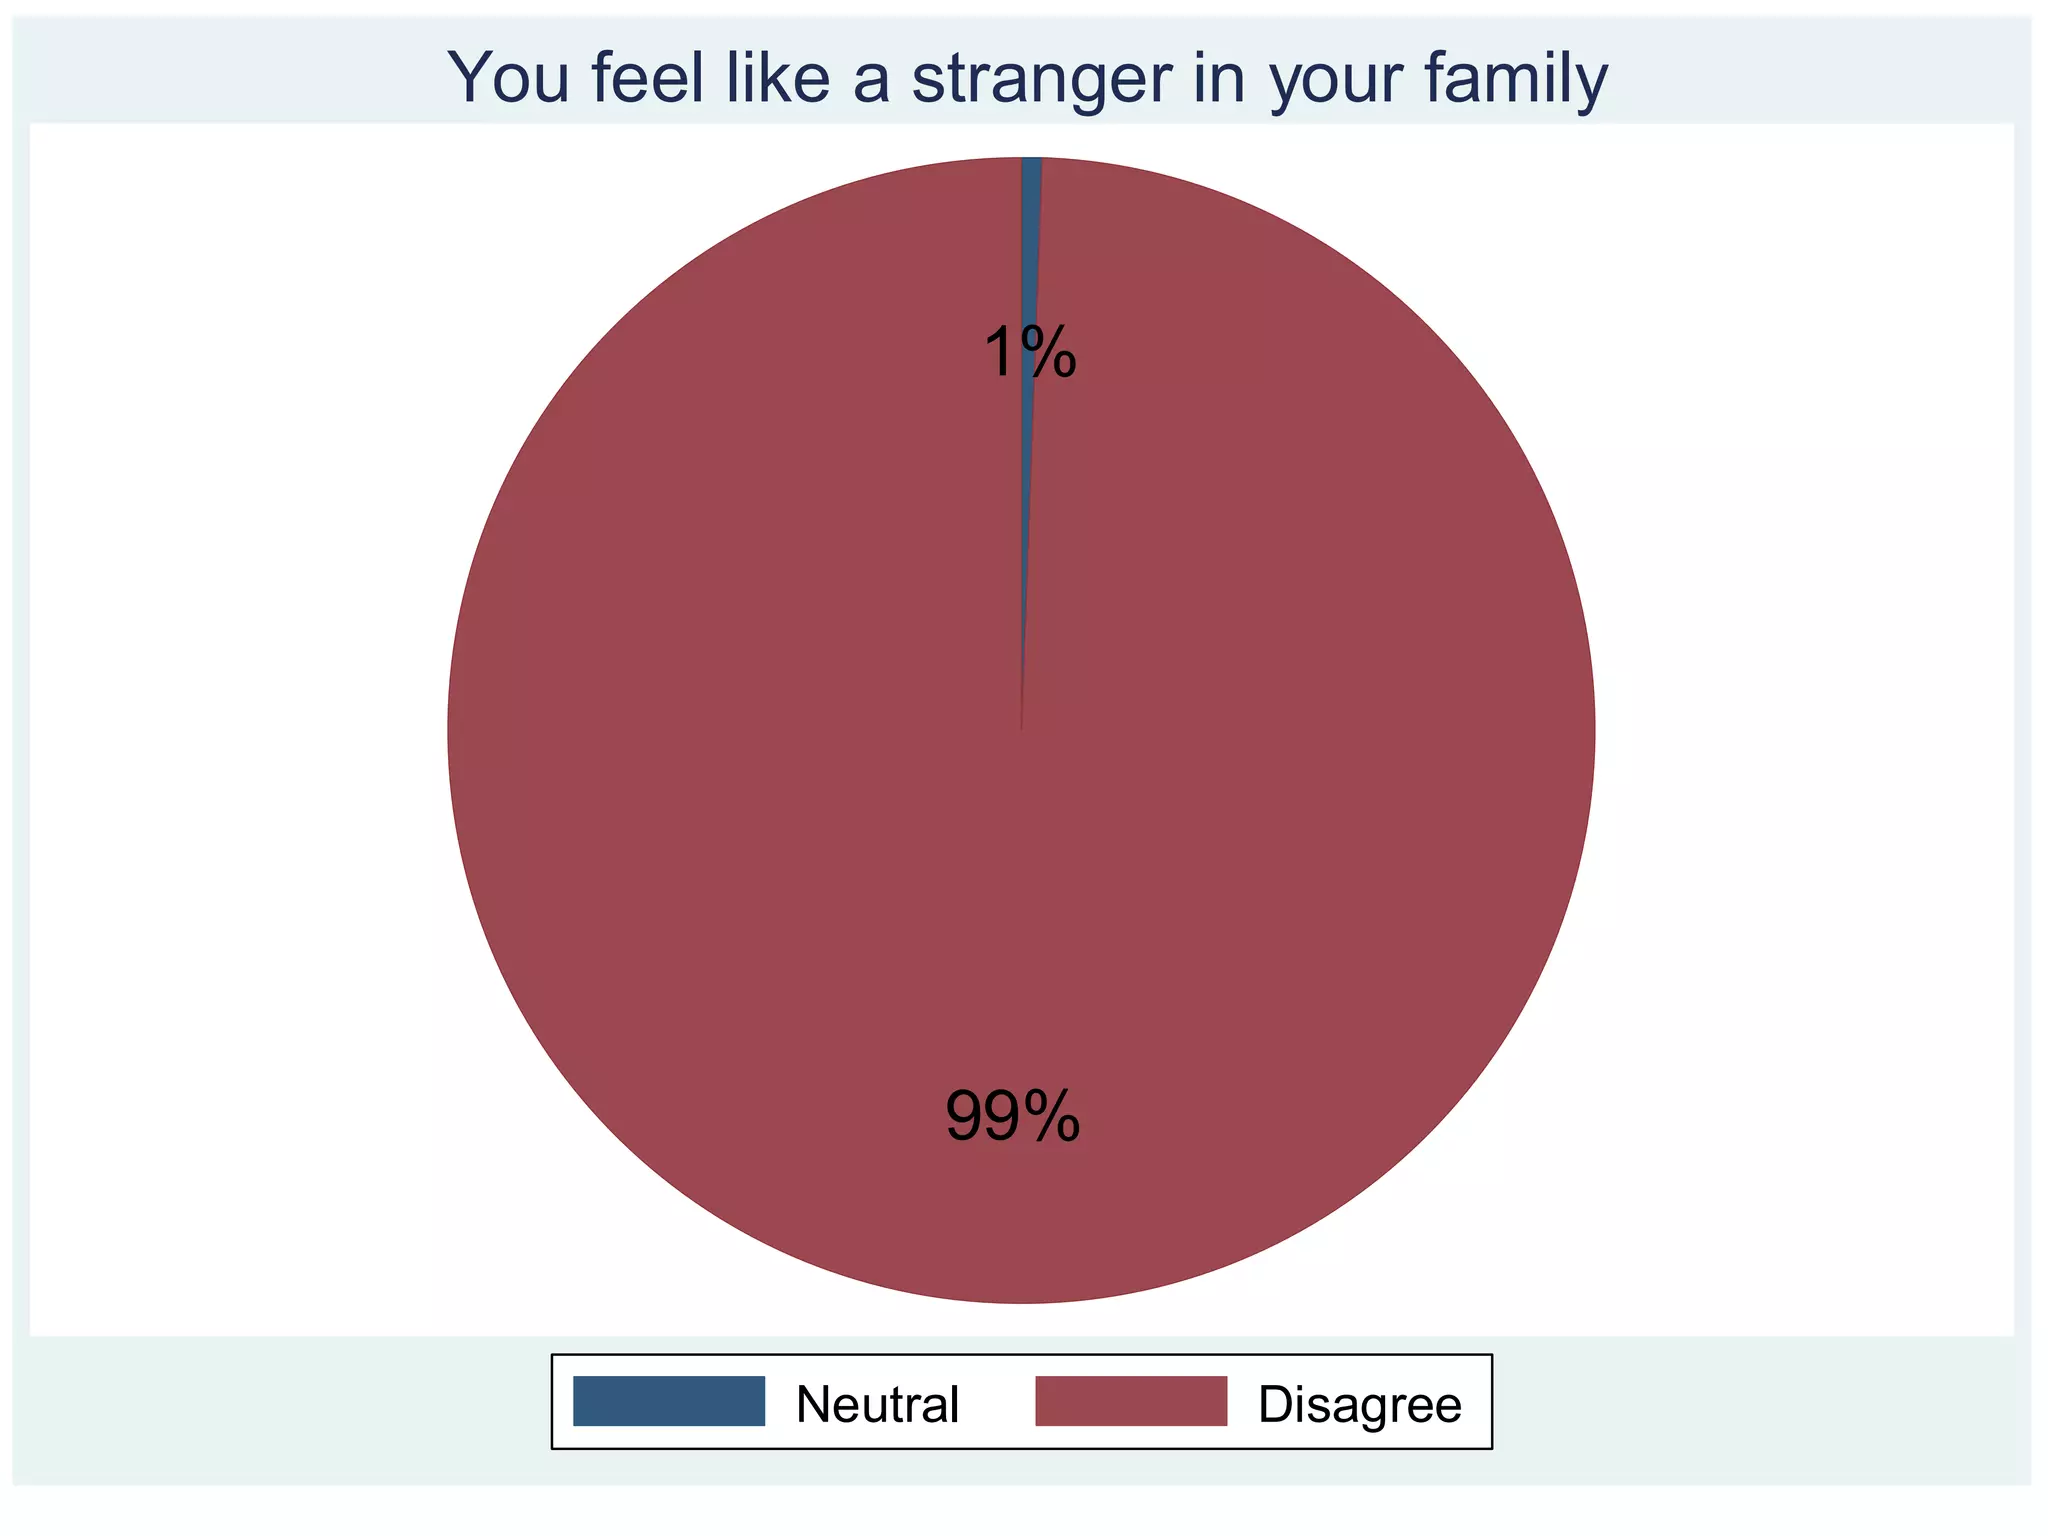
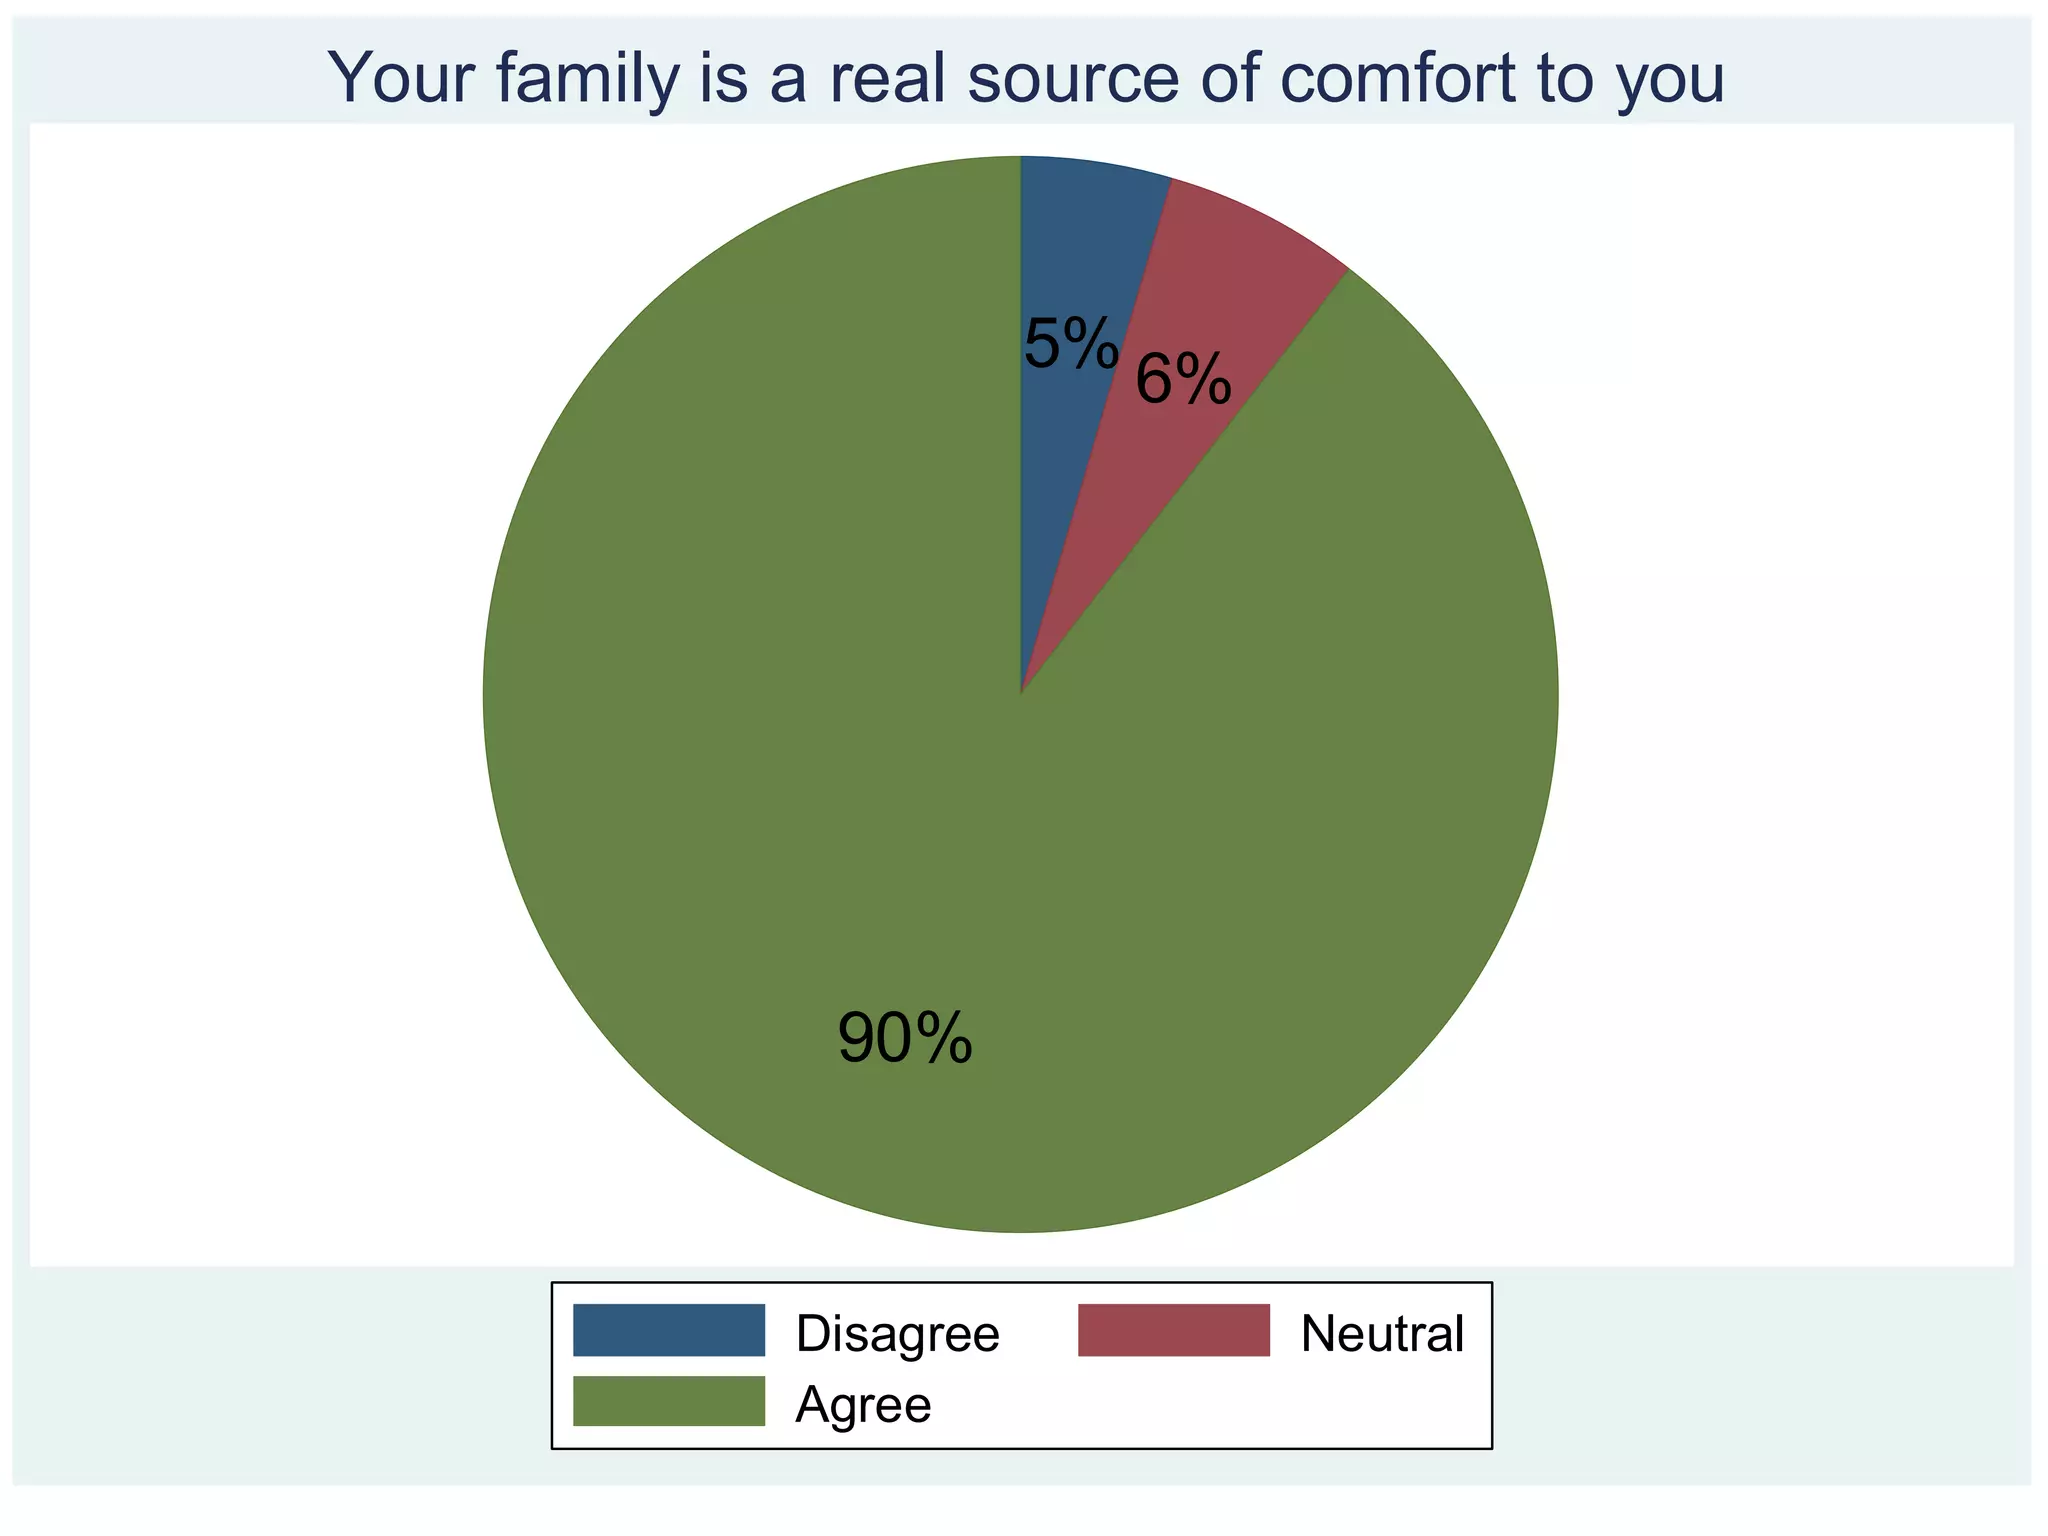
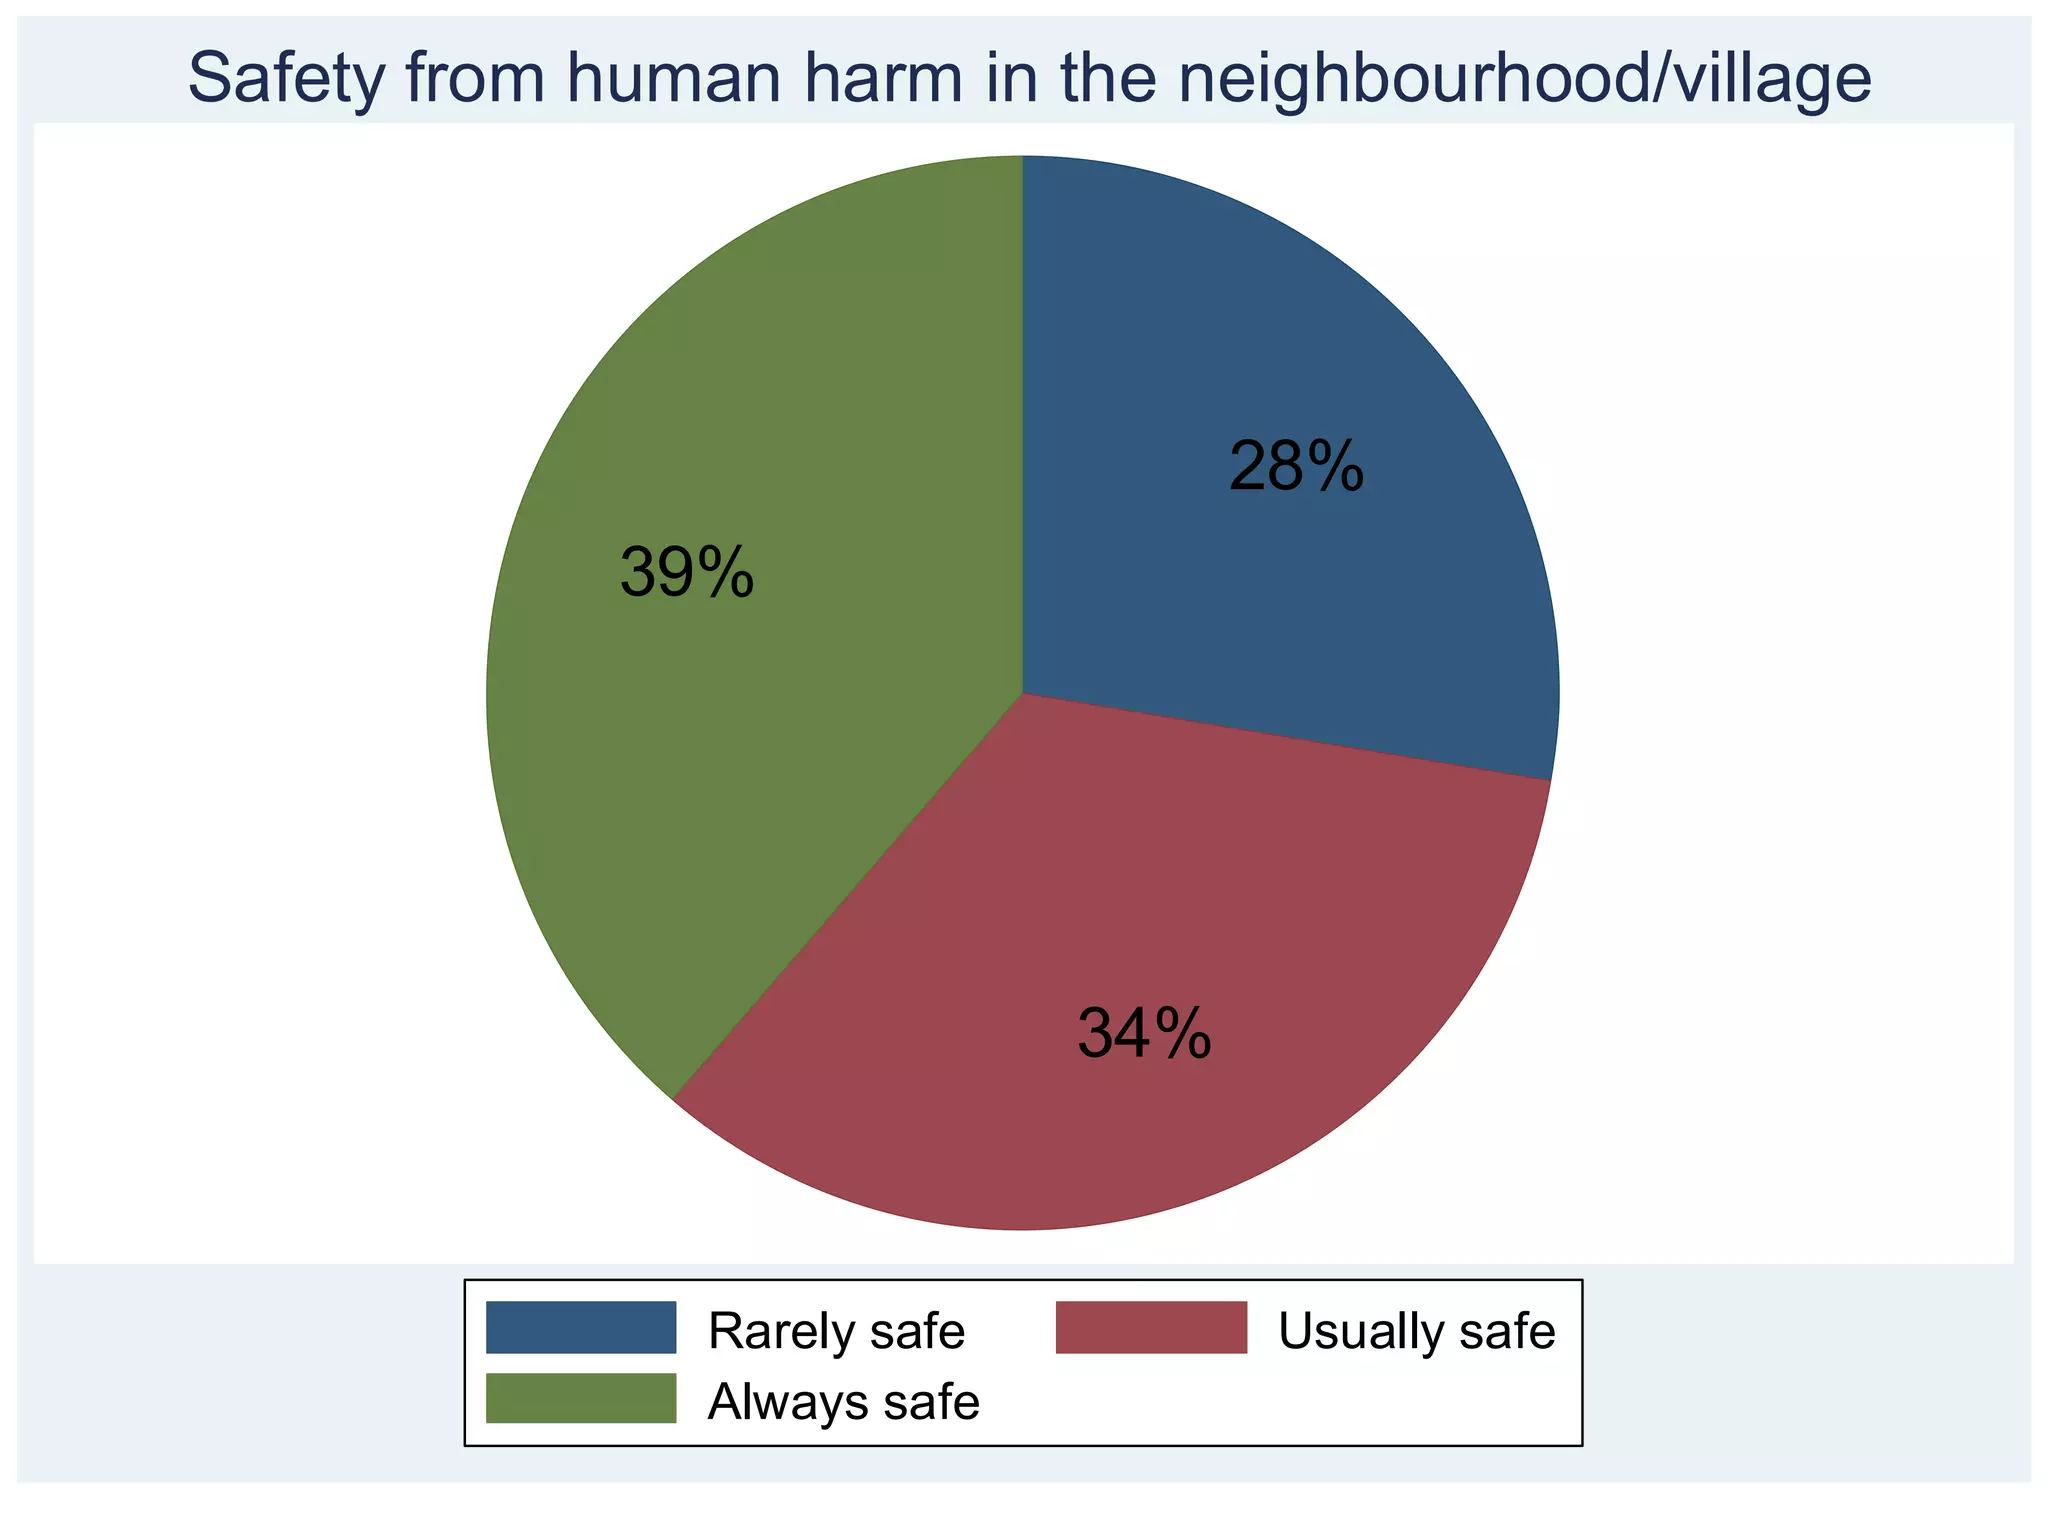
- Community vitality was strong, with high levels of trust, volunteering, and sense of belonging reported.
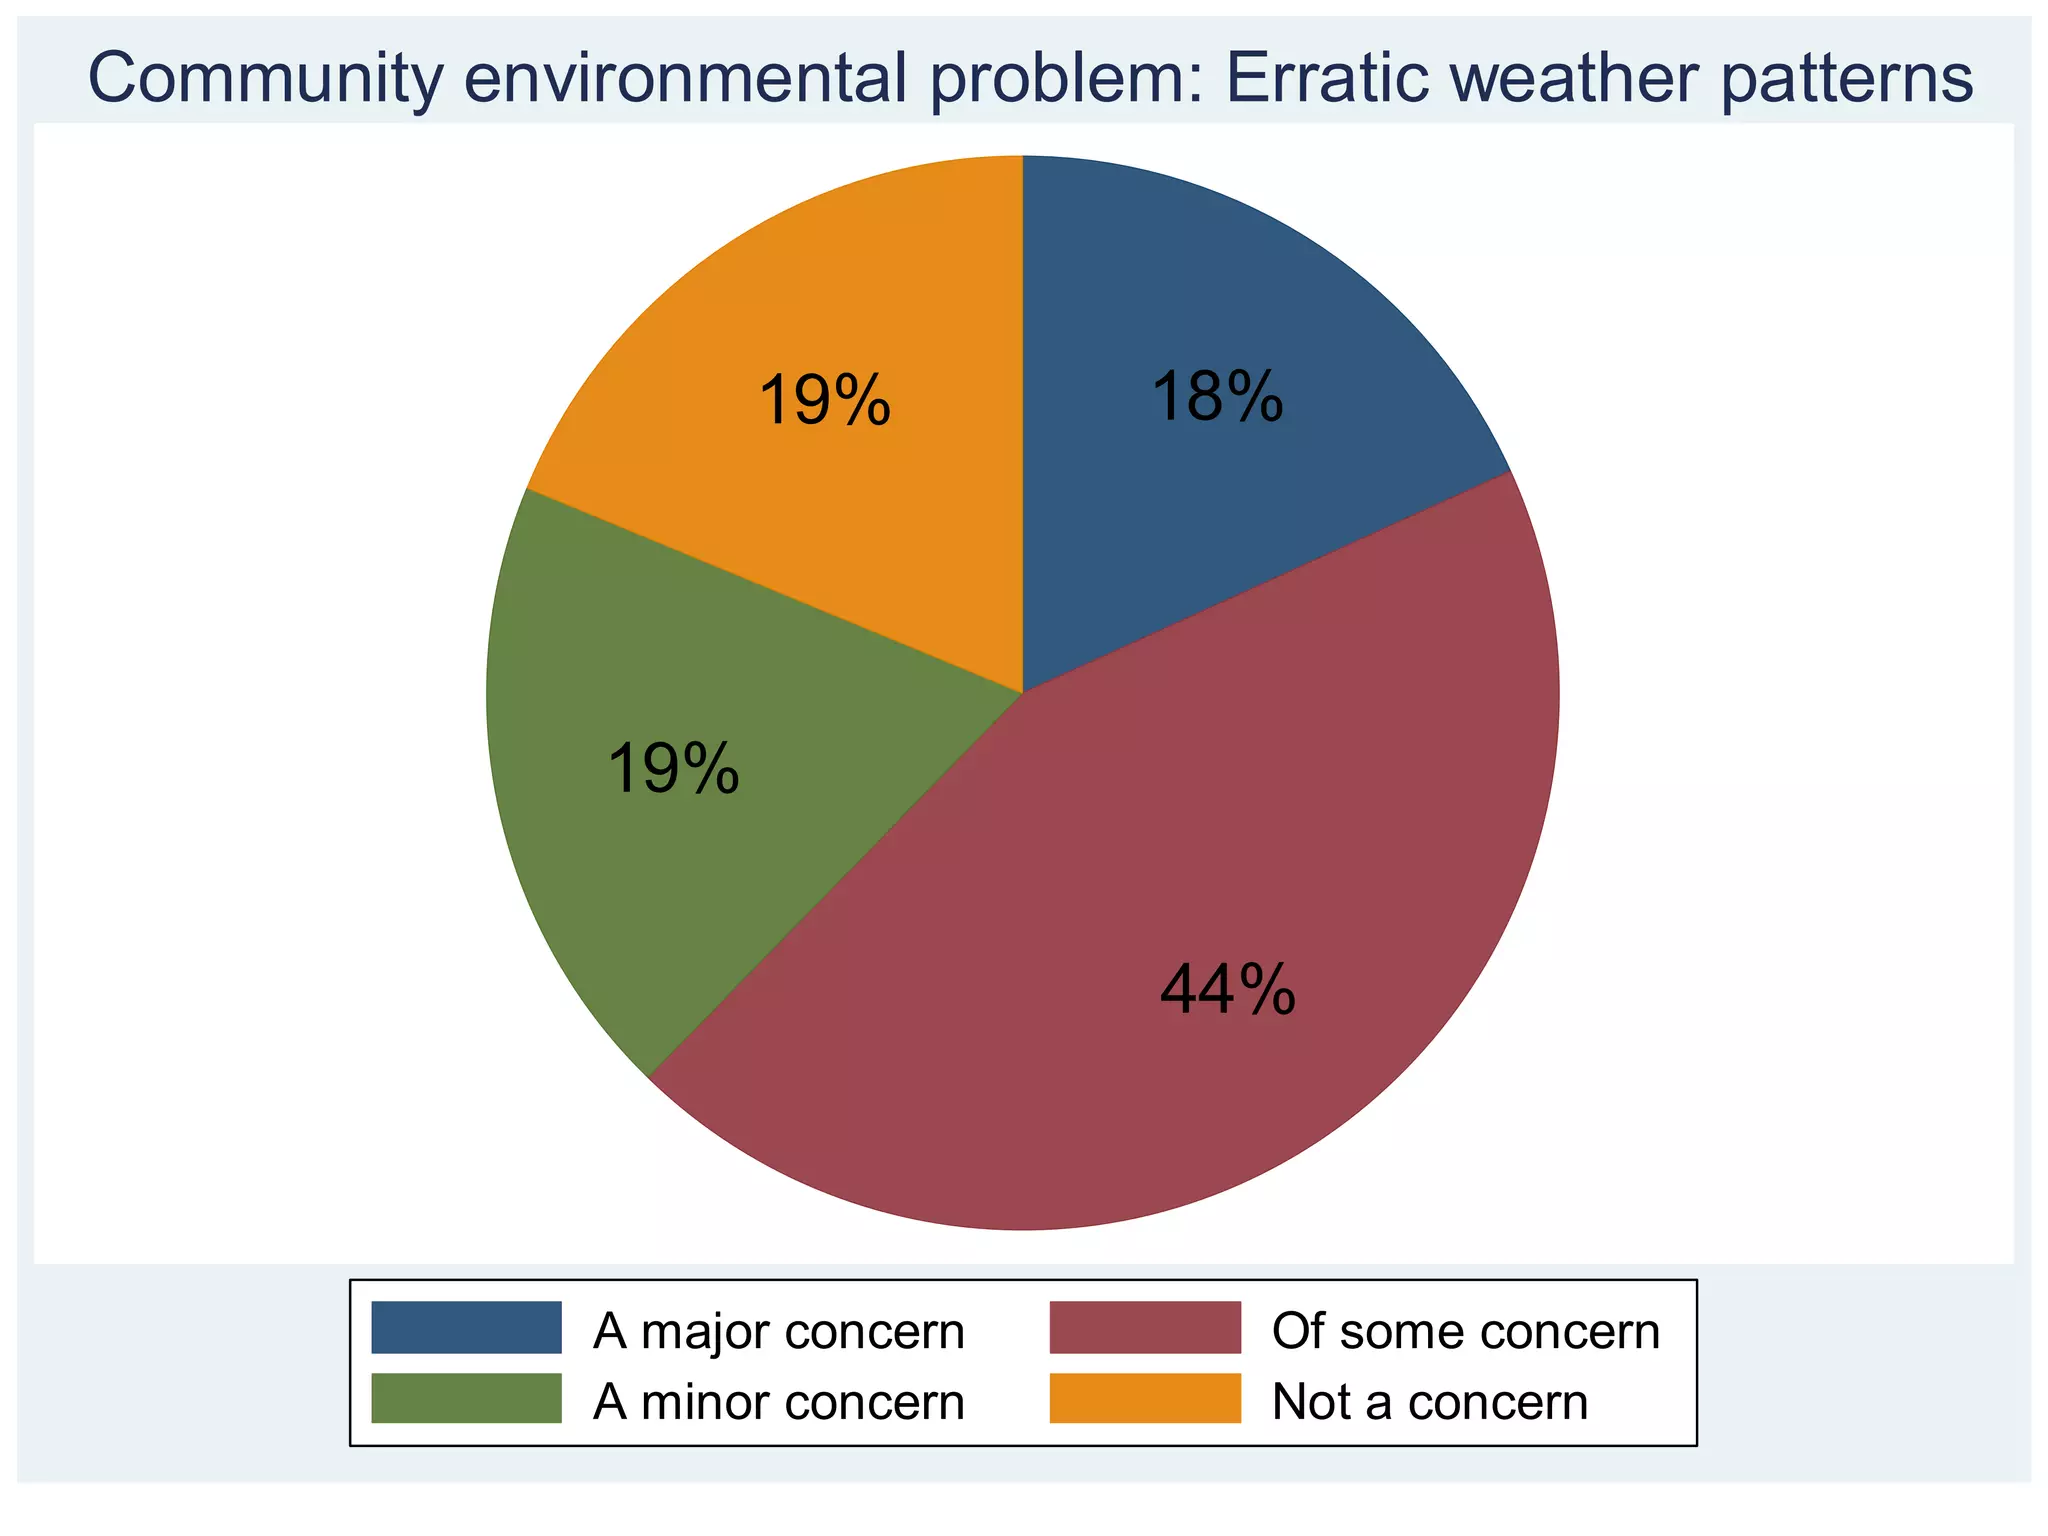
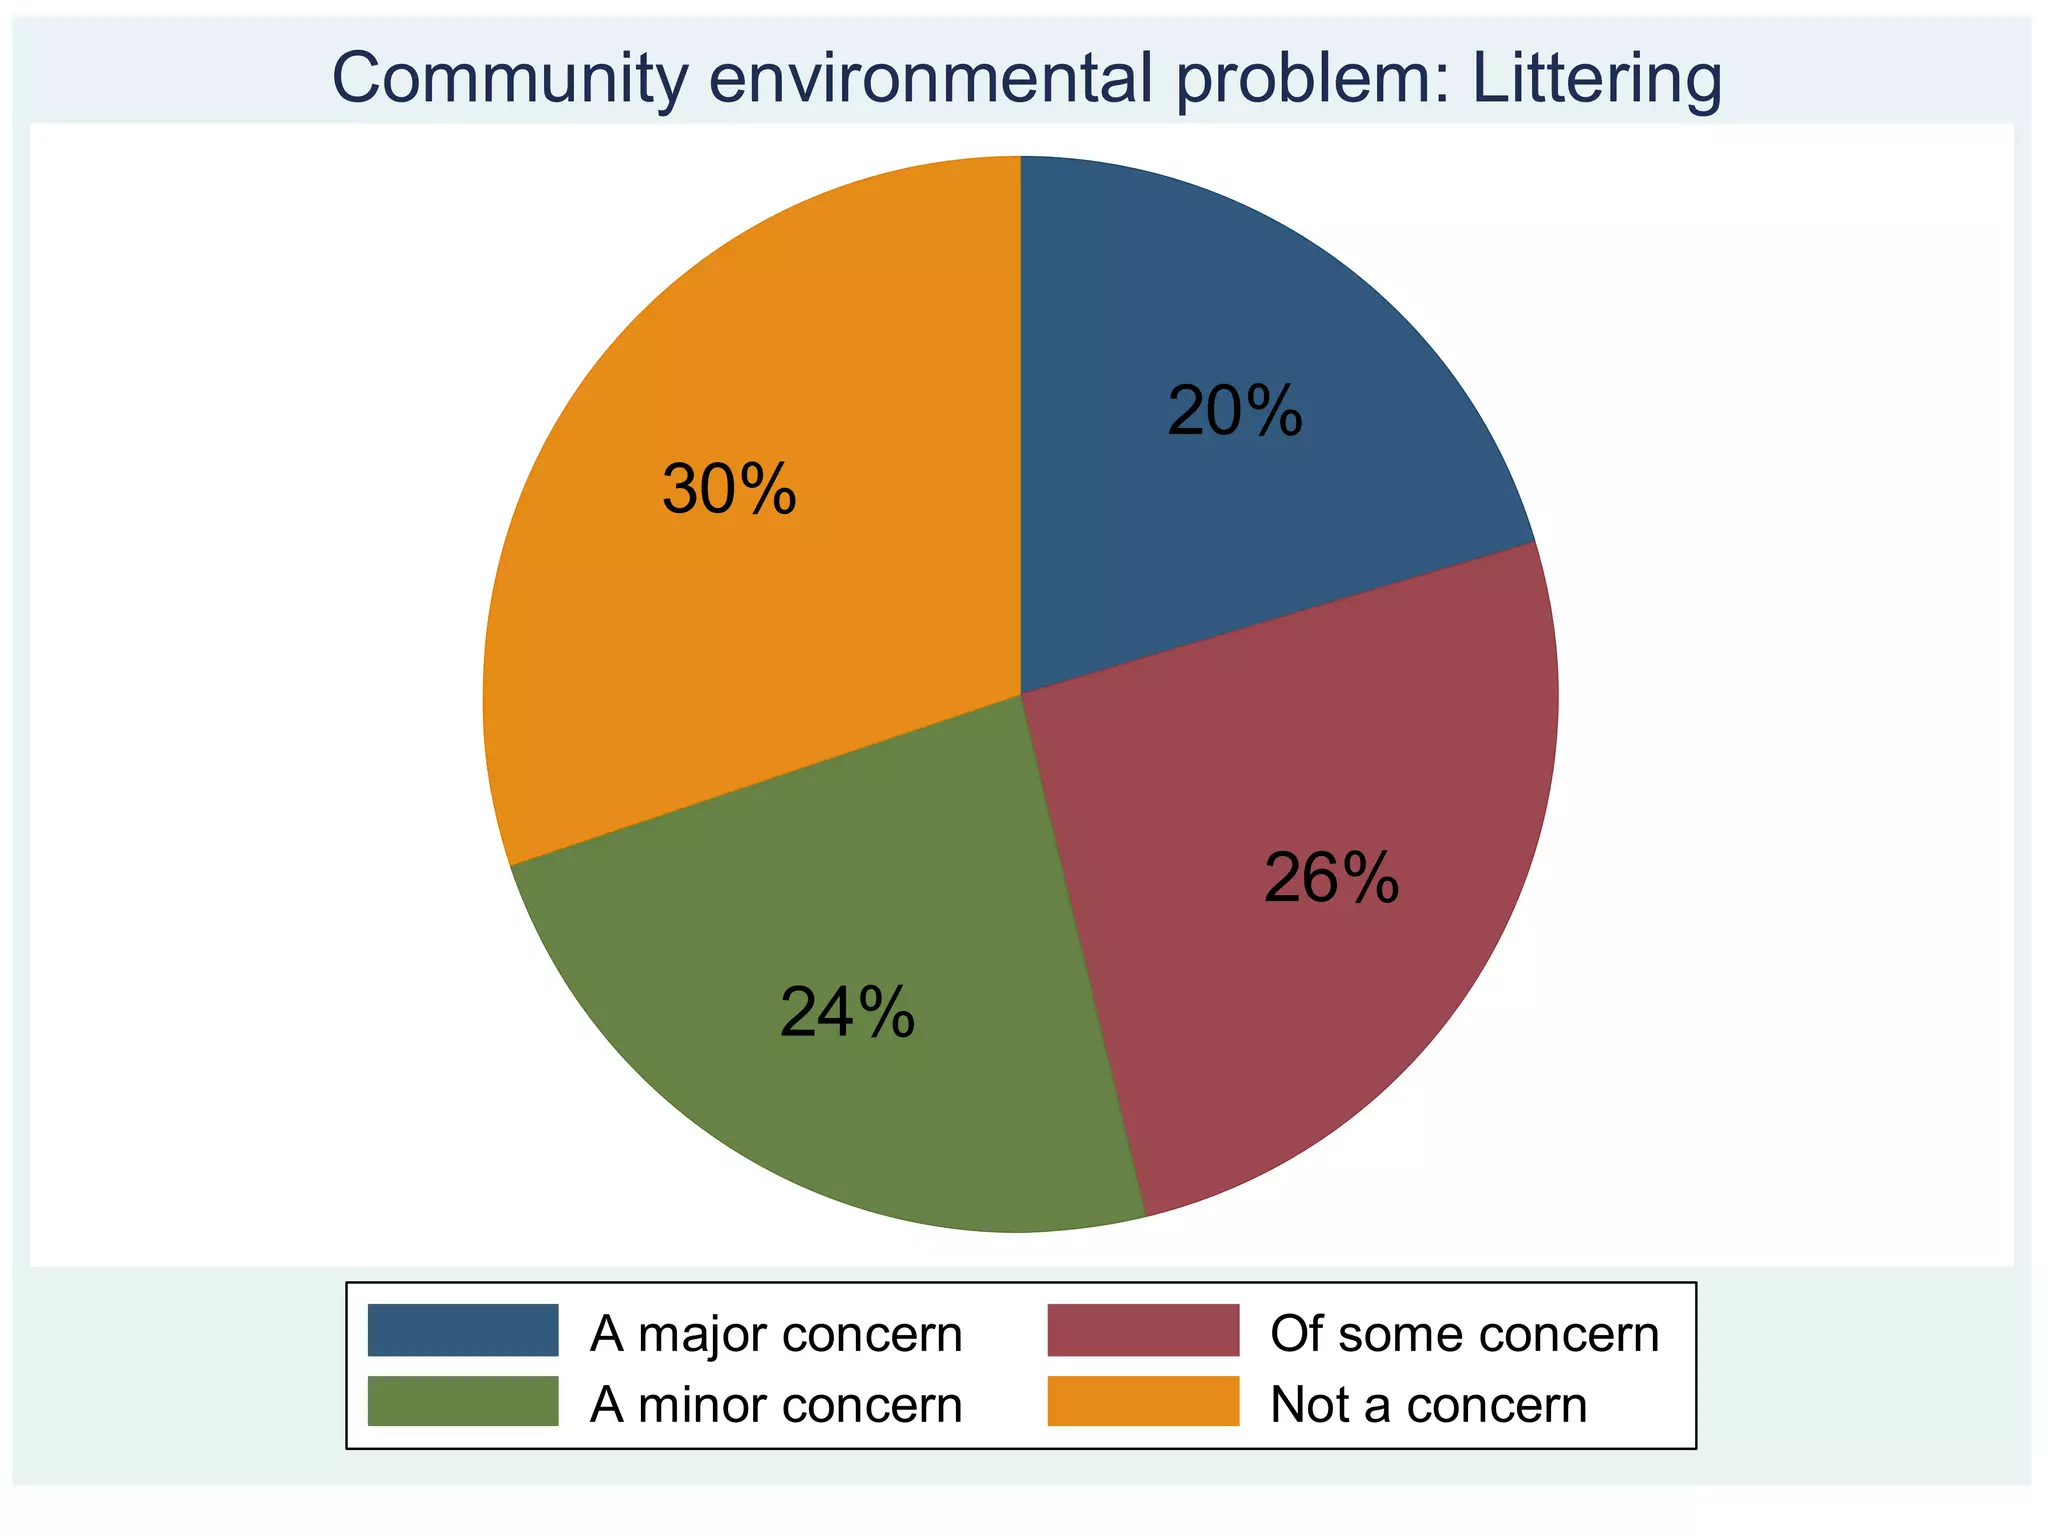
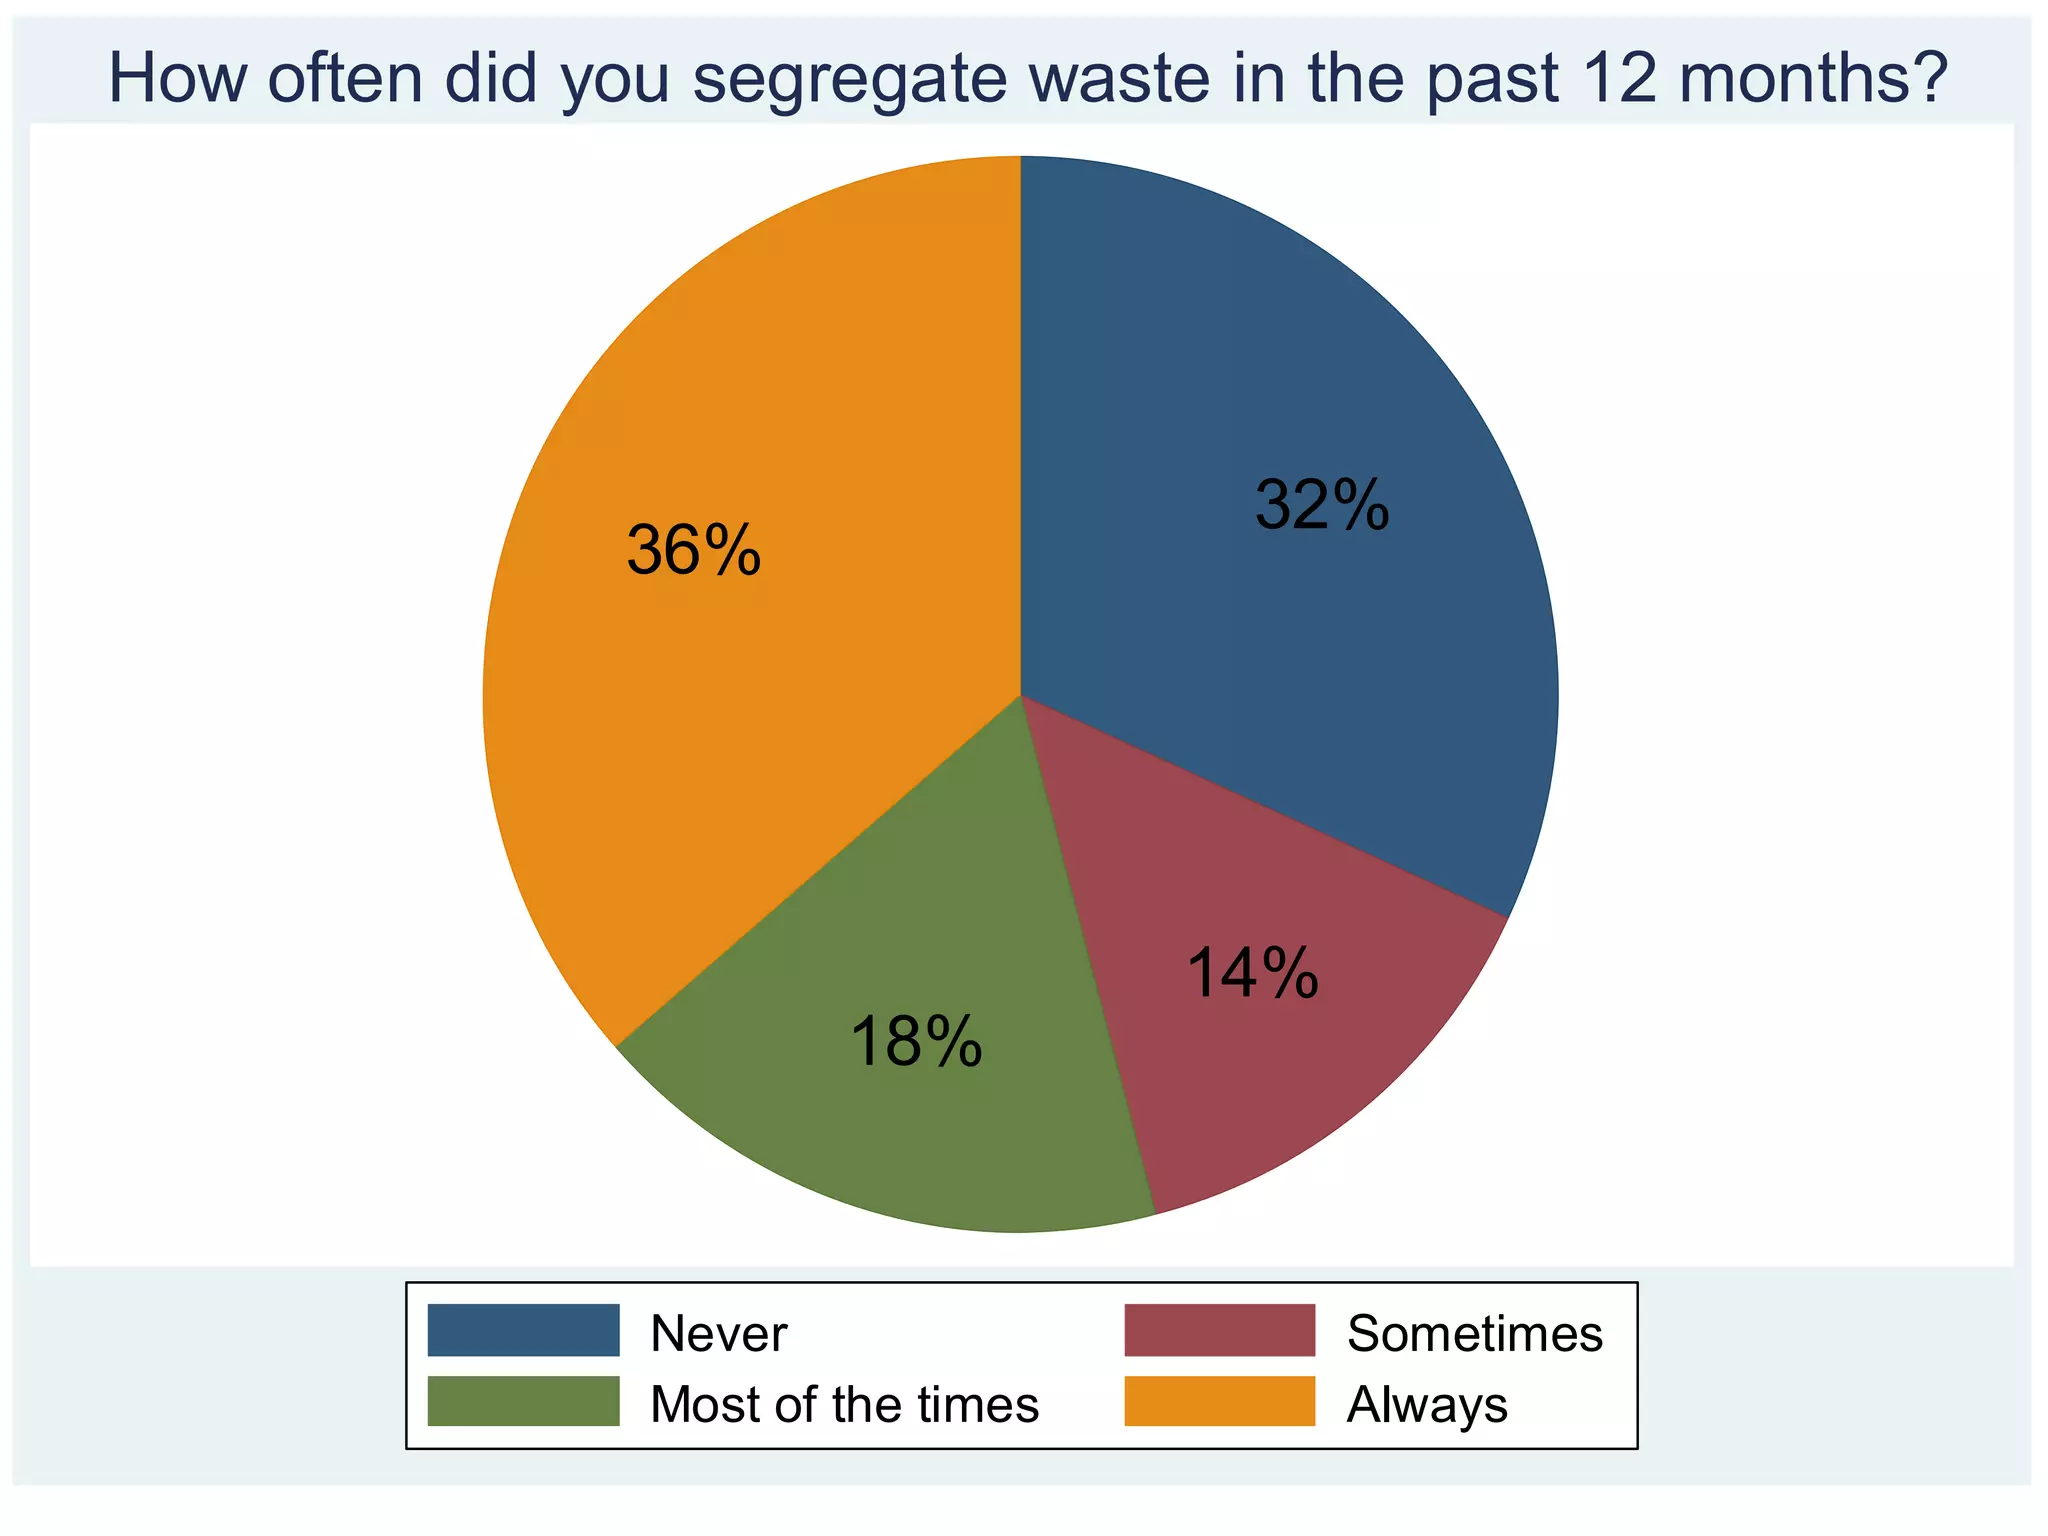
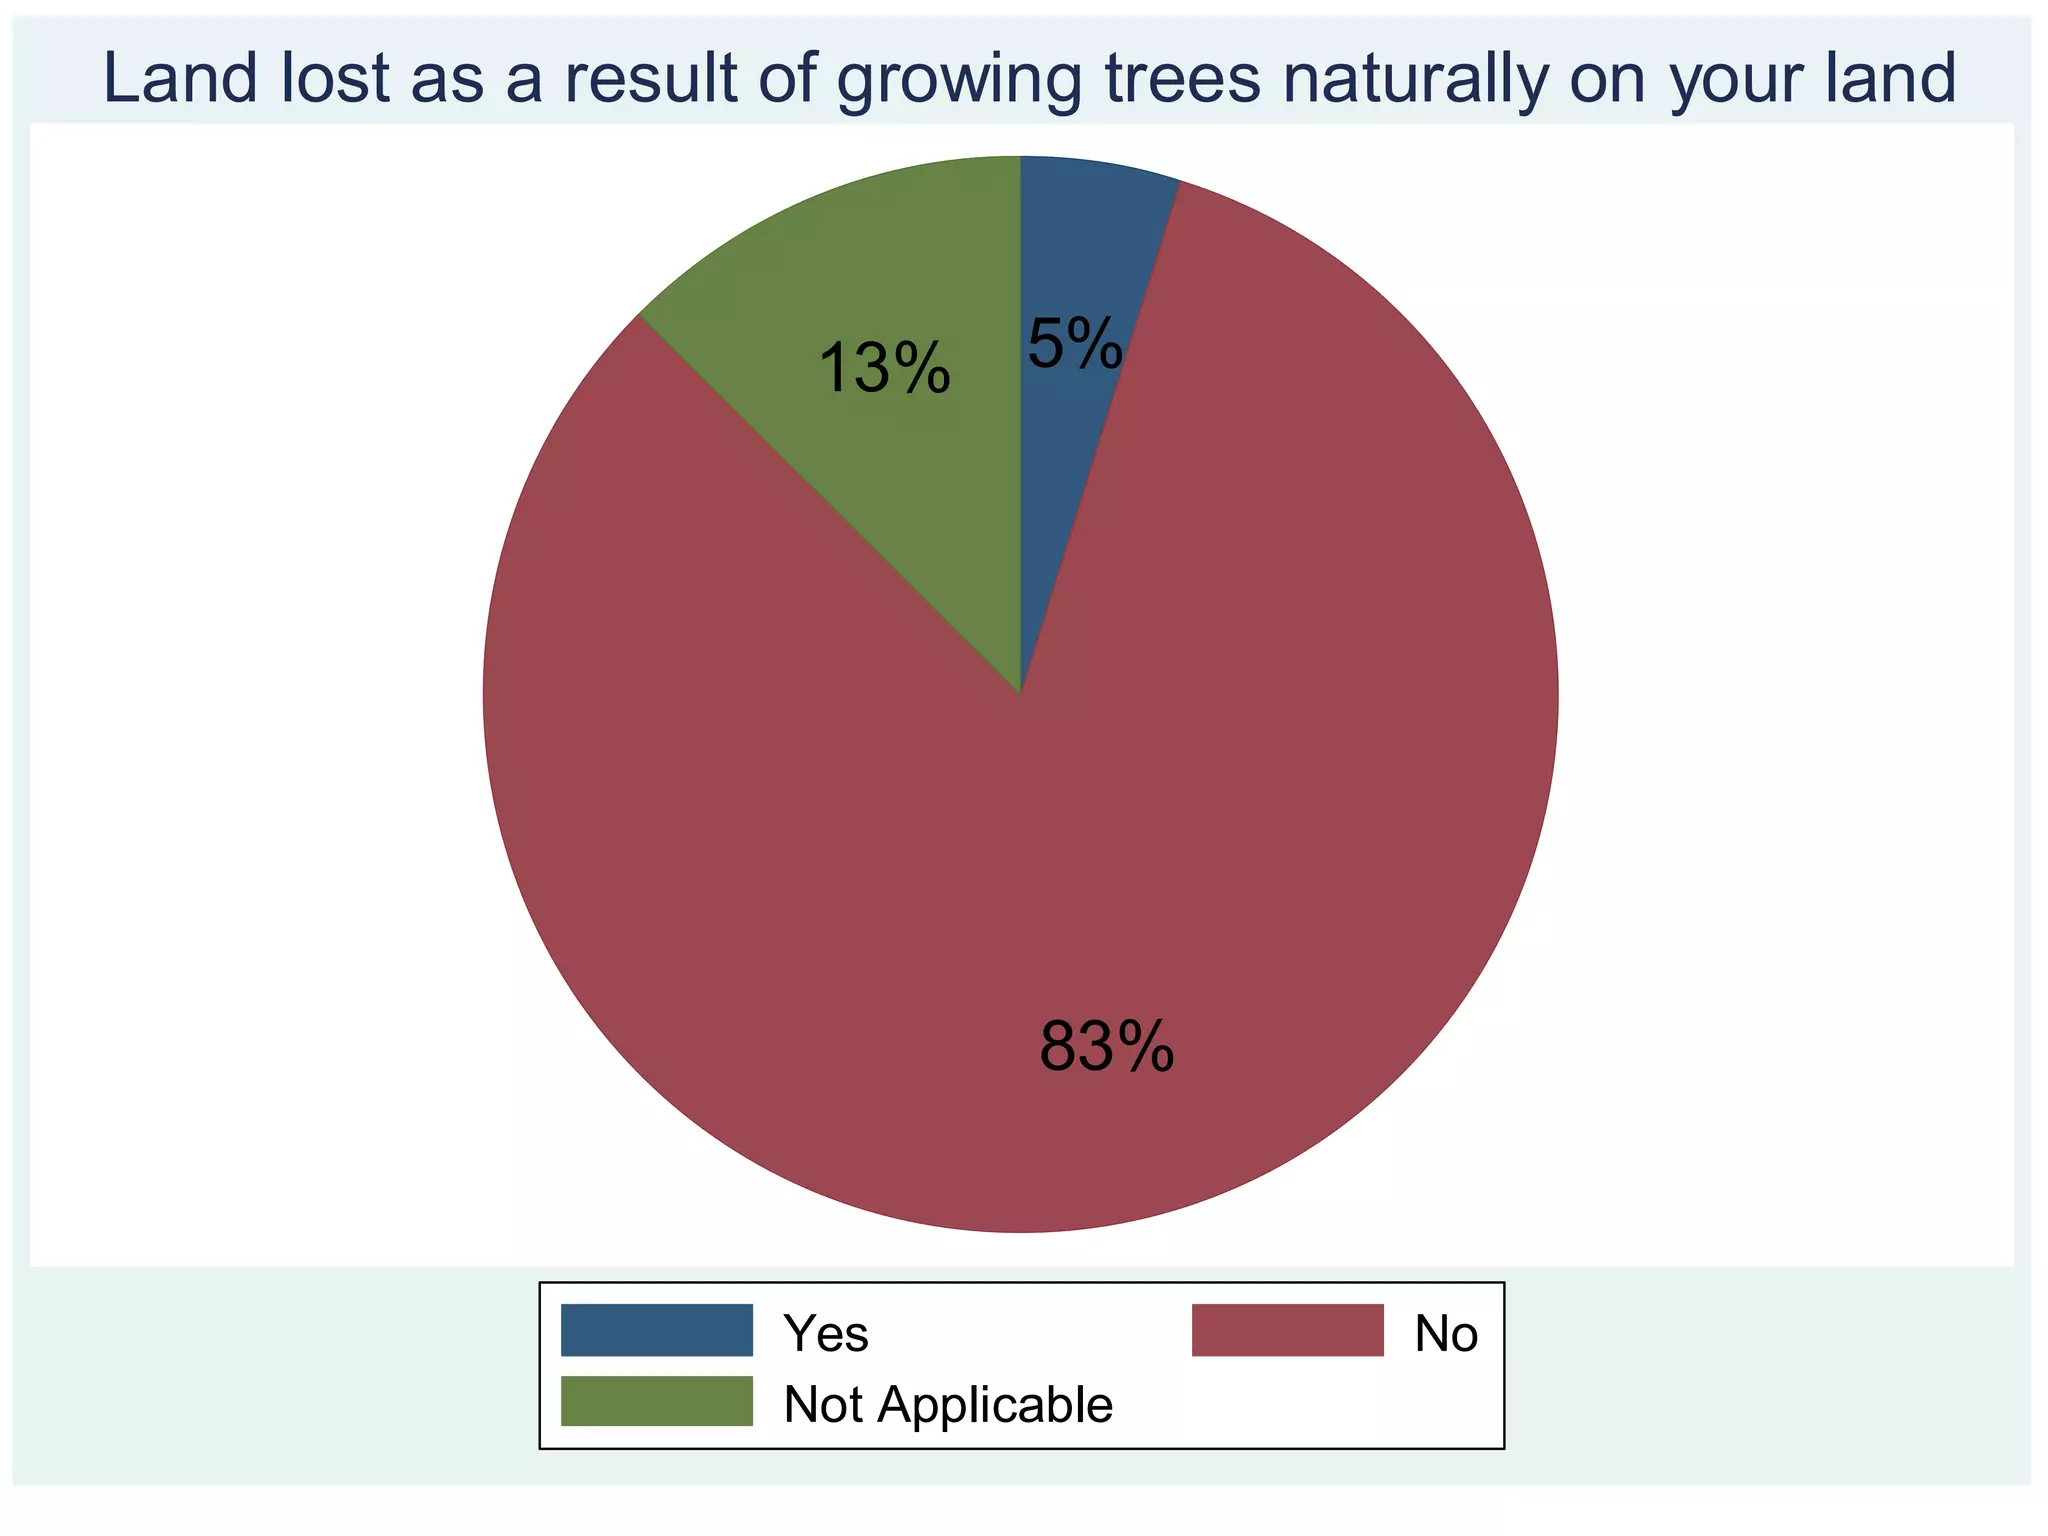
- Environmental stewardship was also high, with strong personal responsibility felt for conservation and high reuse and waste reduction behaviors.