SlideShare a Scribd company logo
1 of 36
Download to read offline
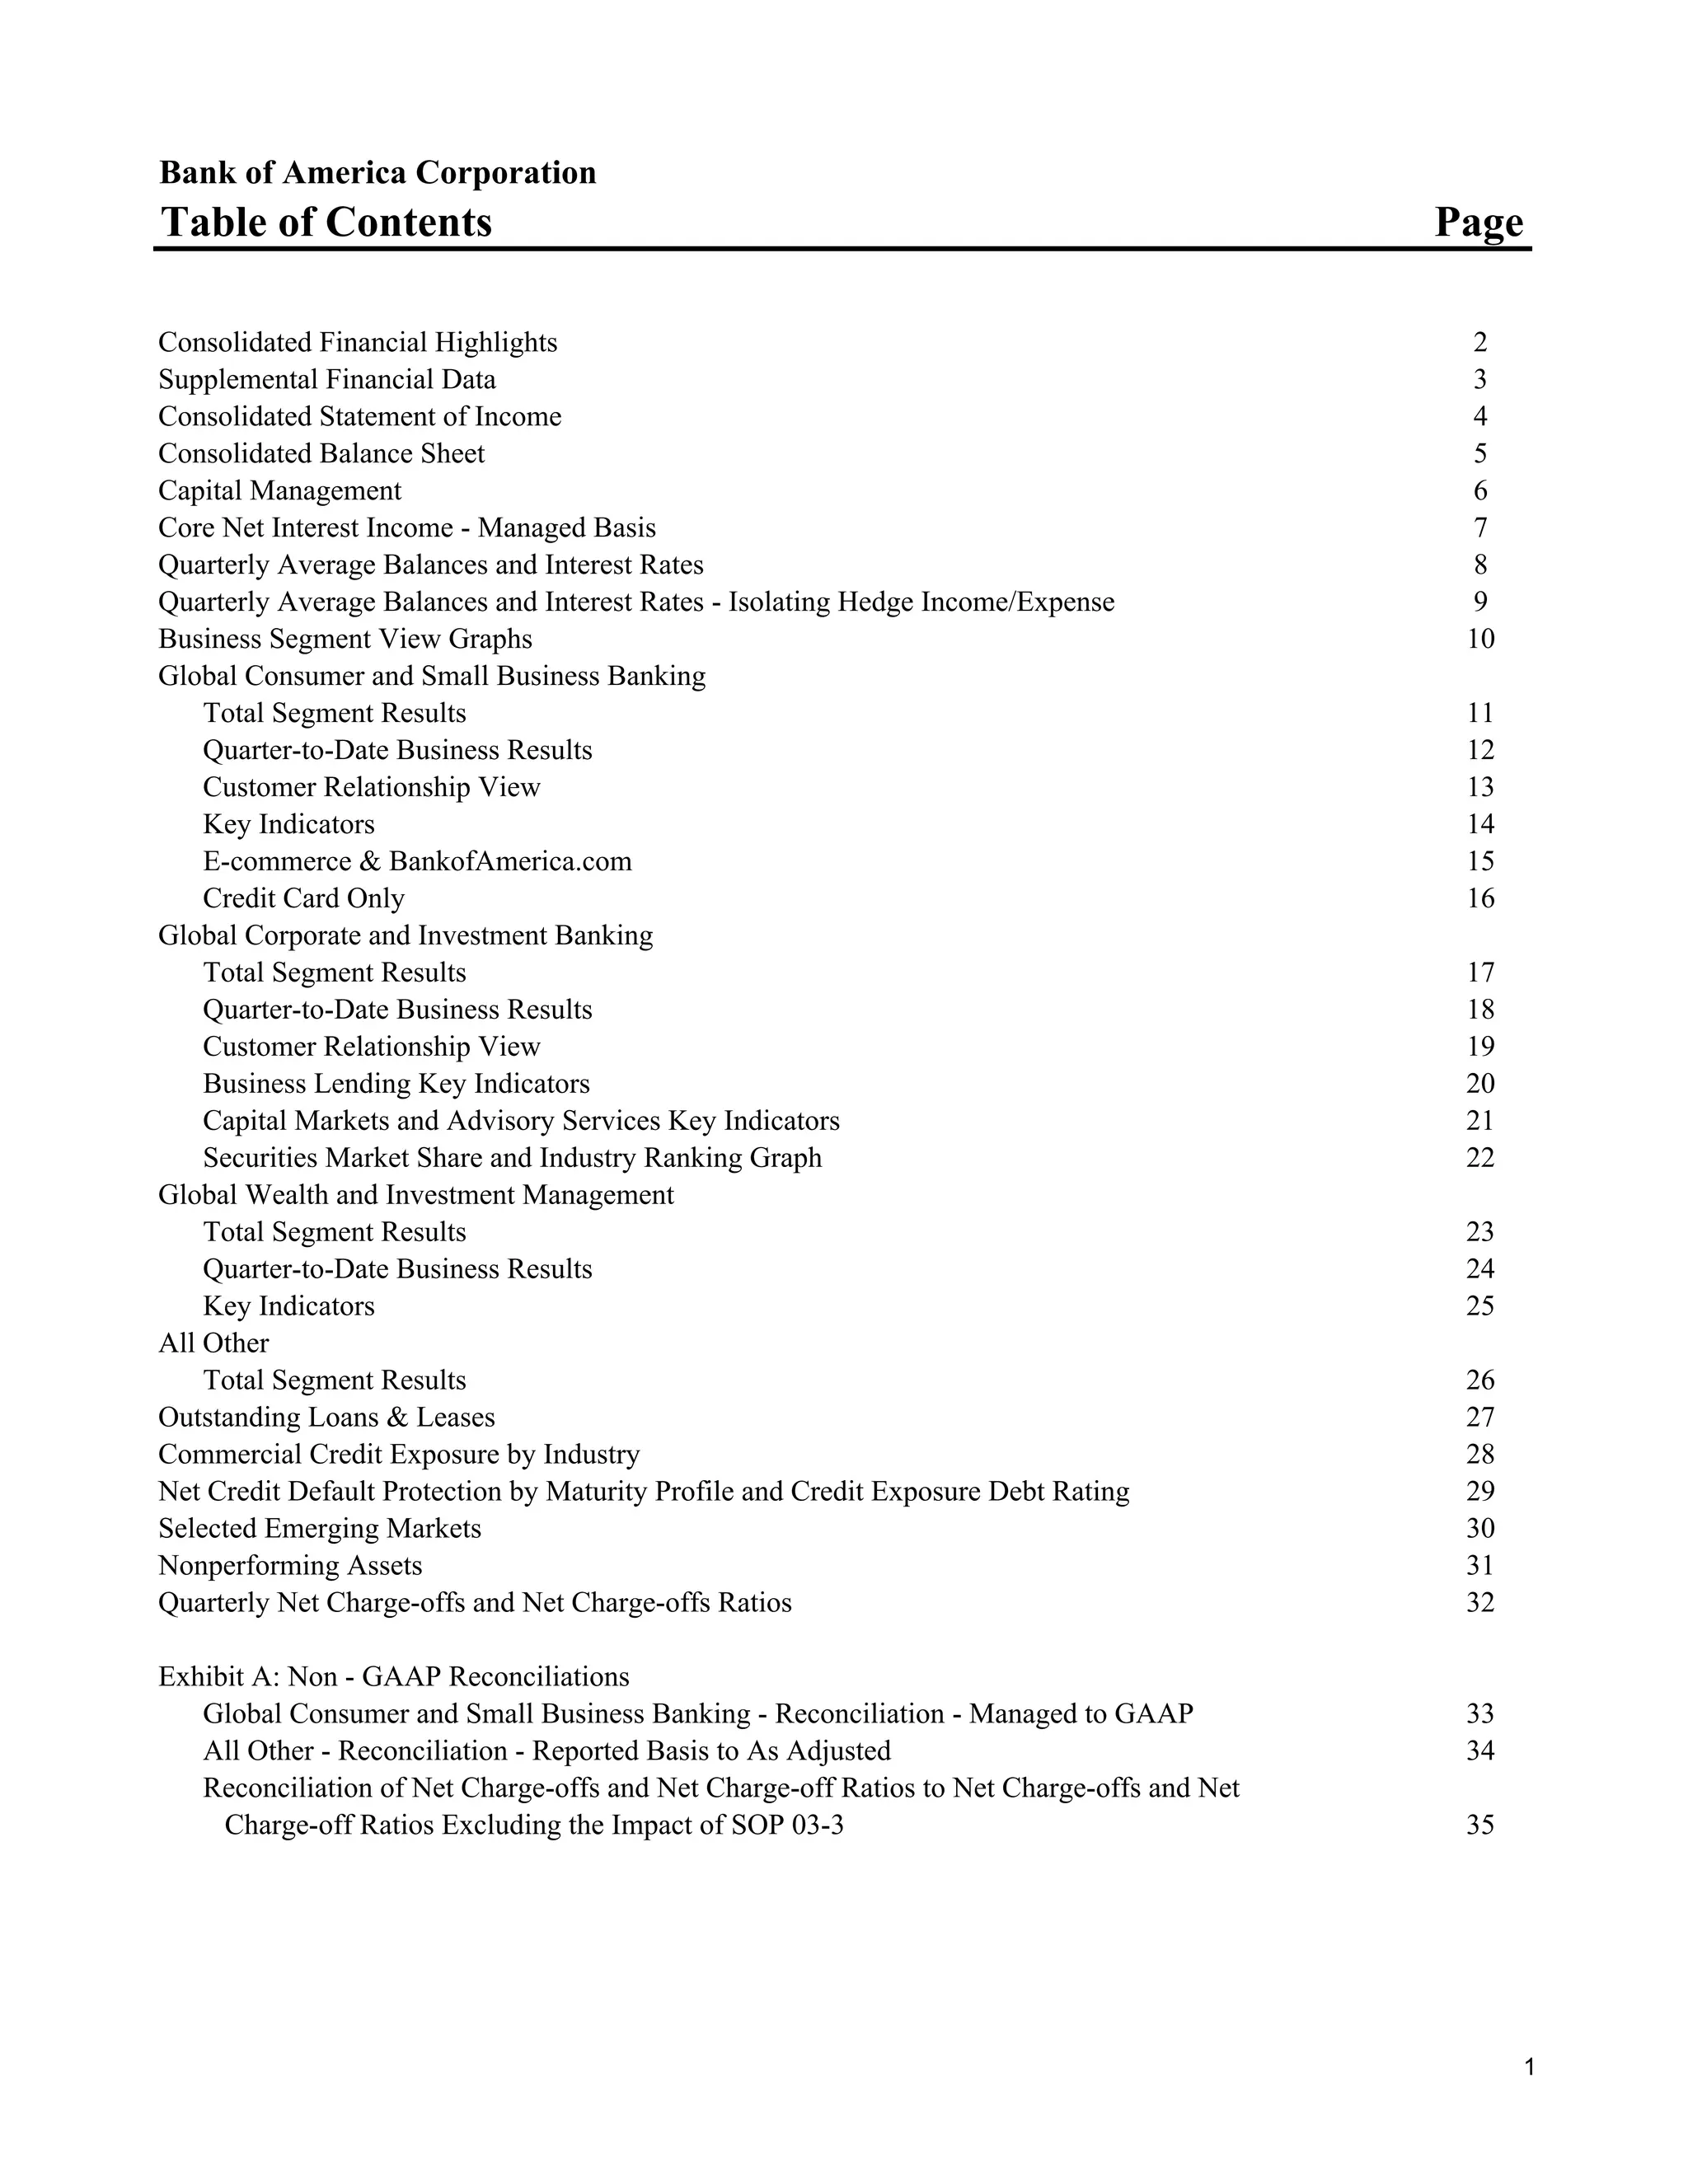
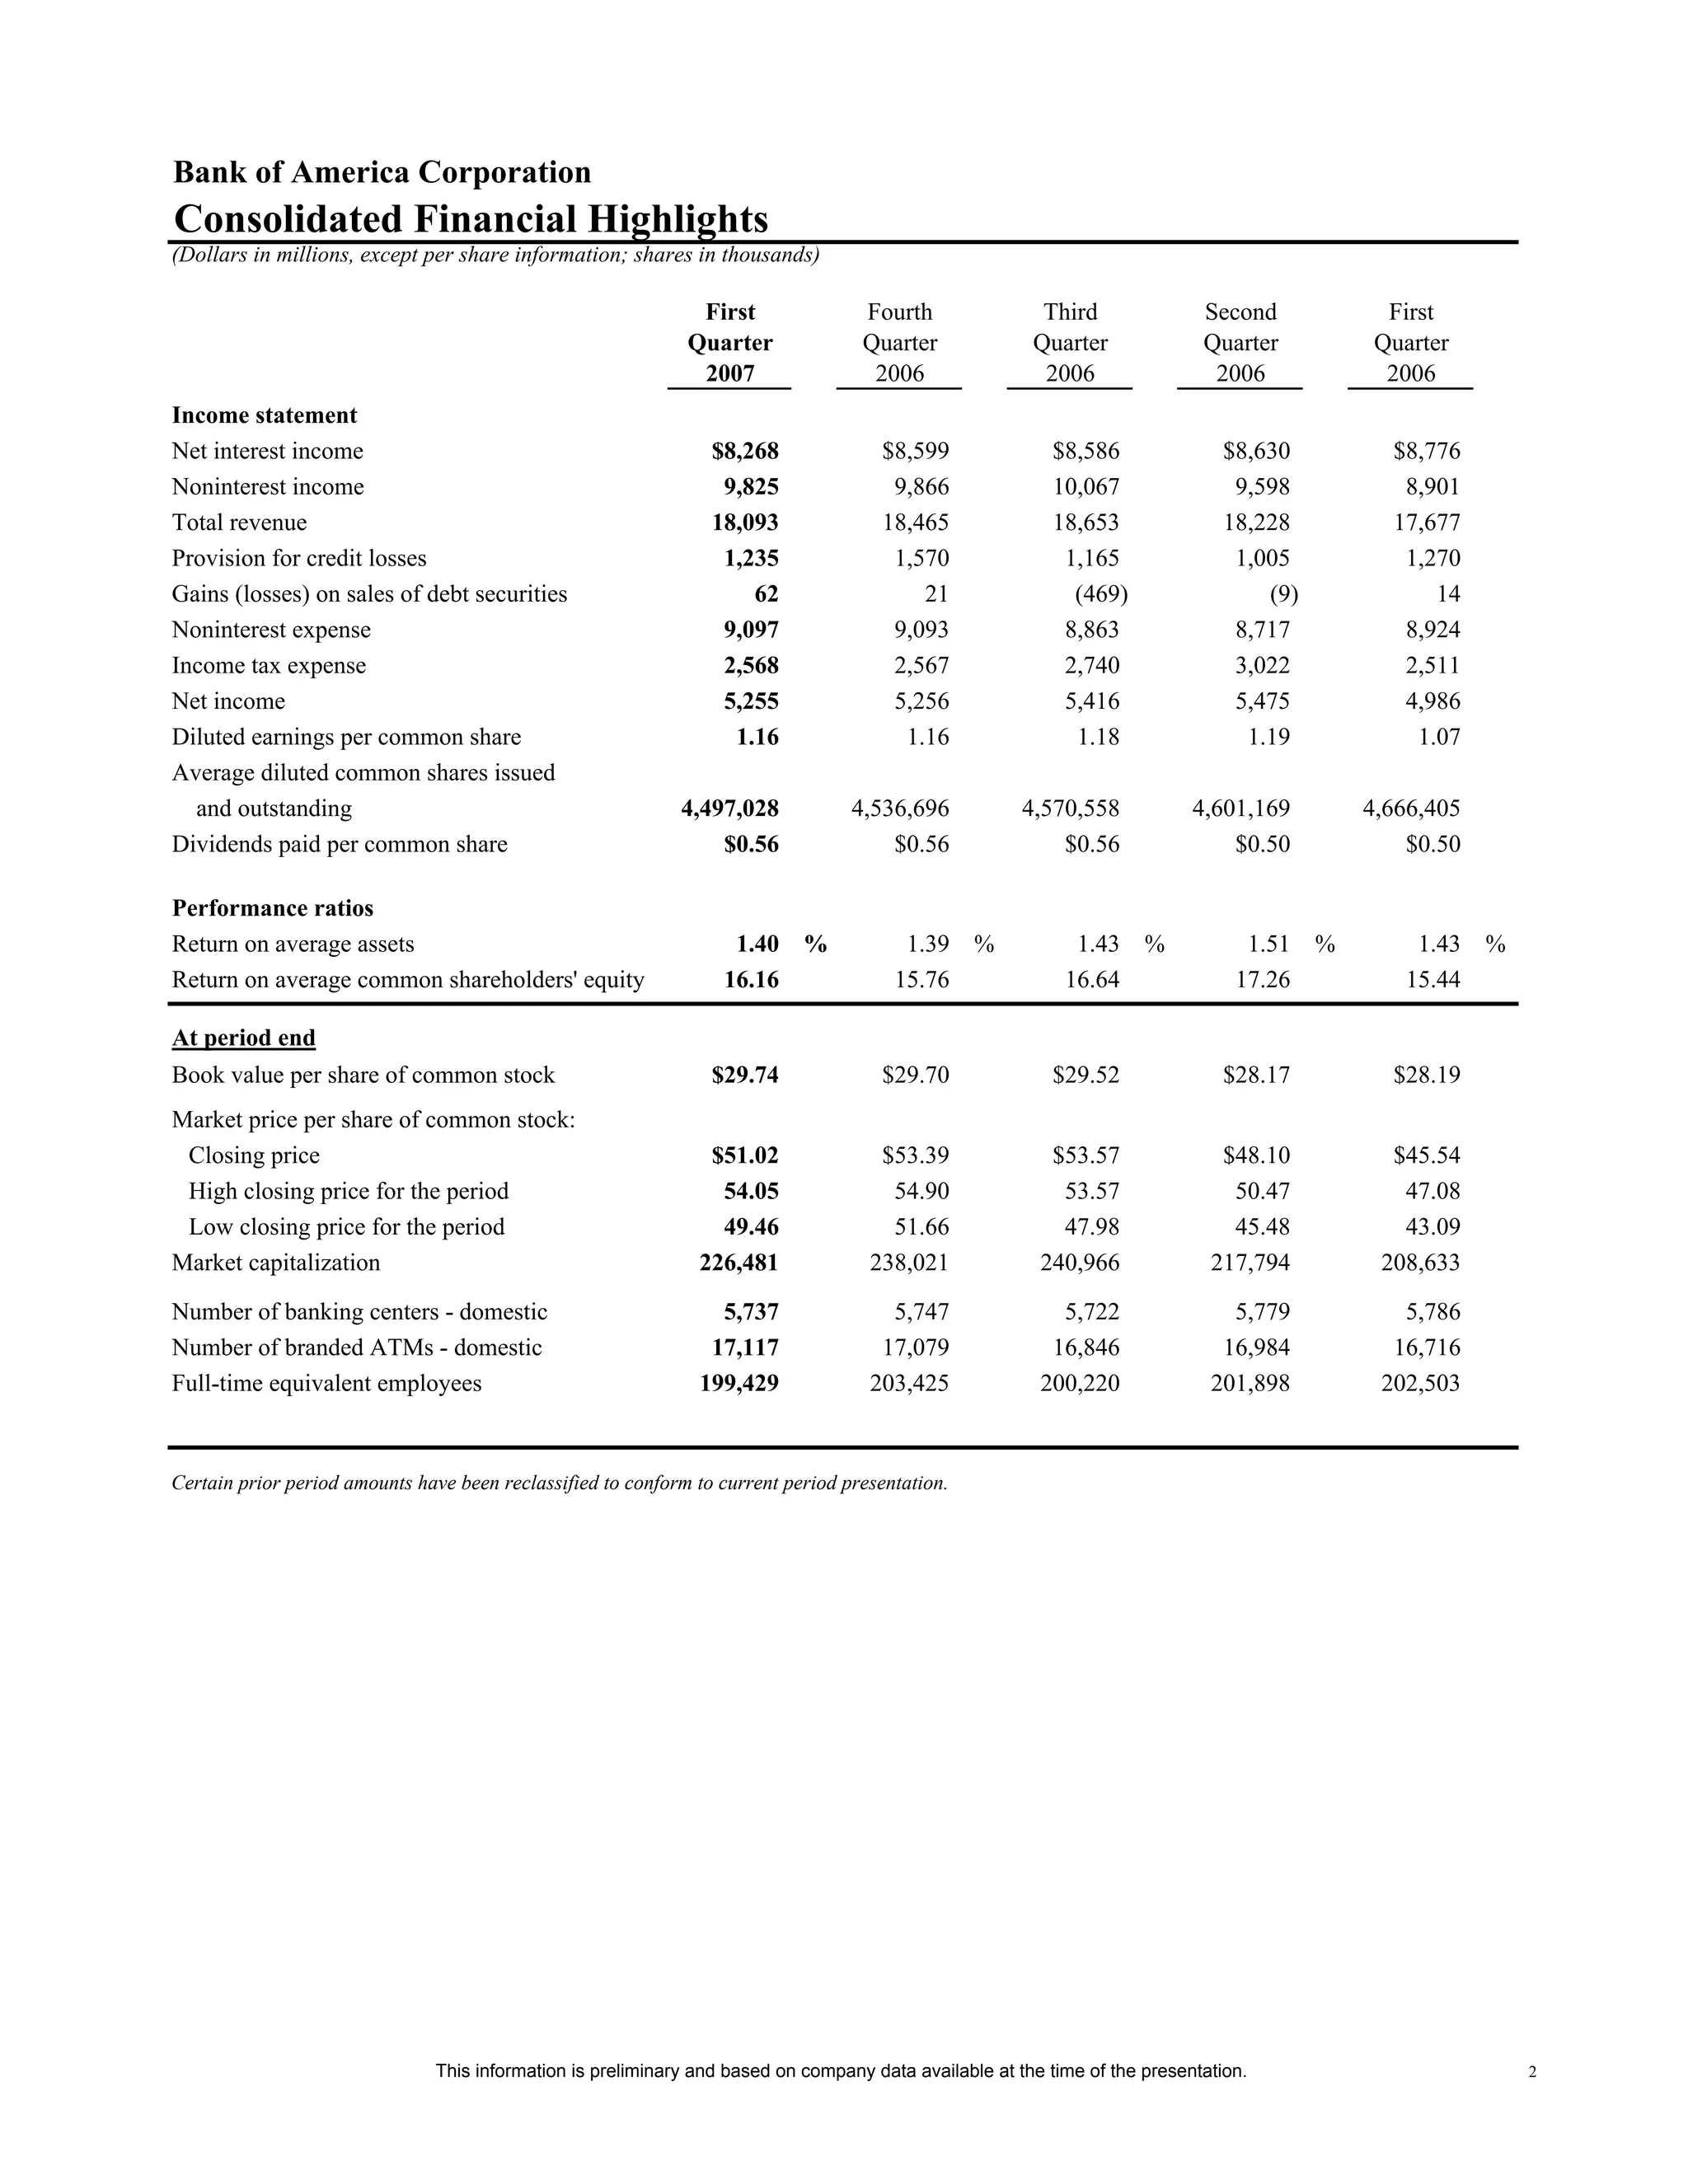
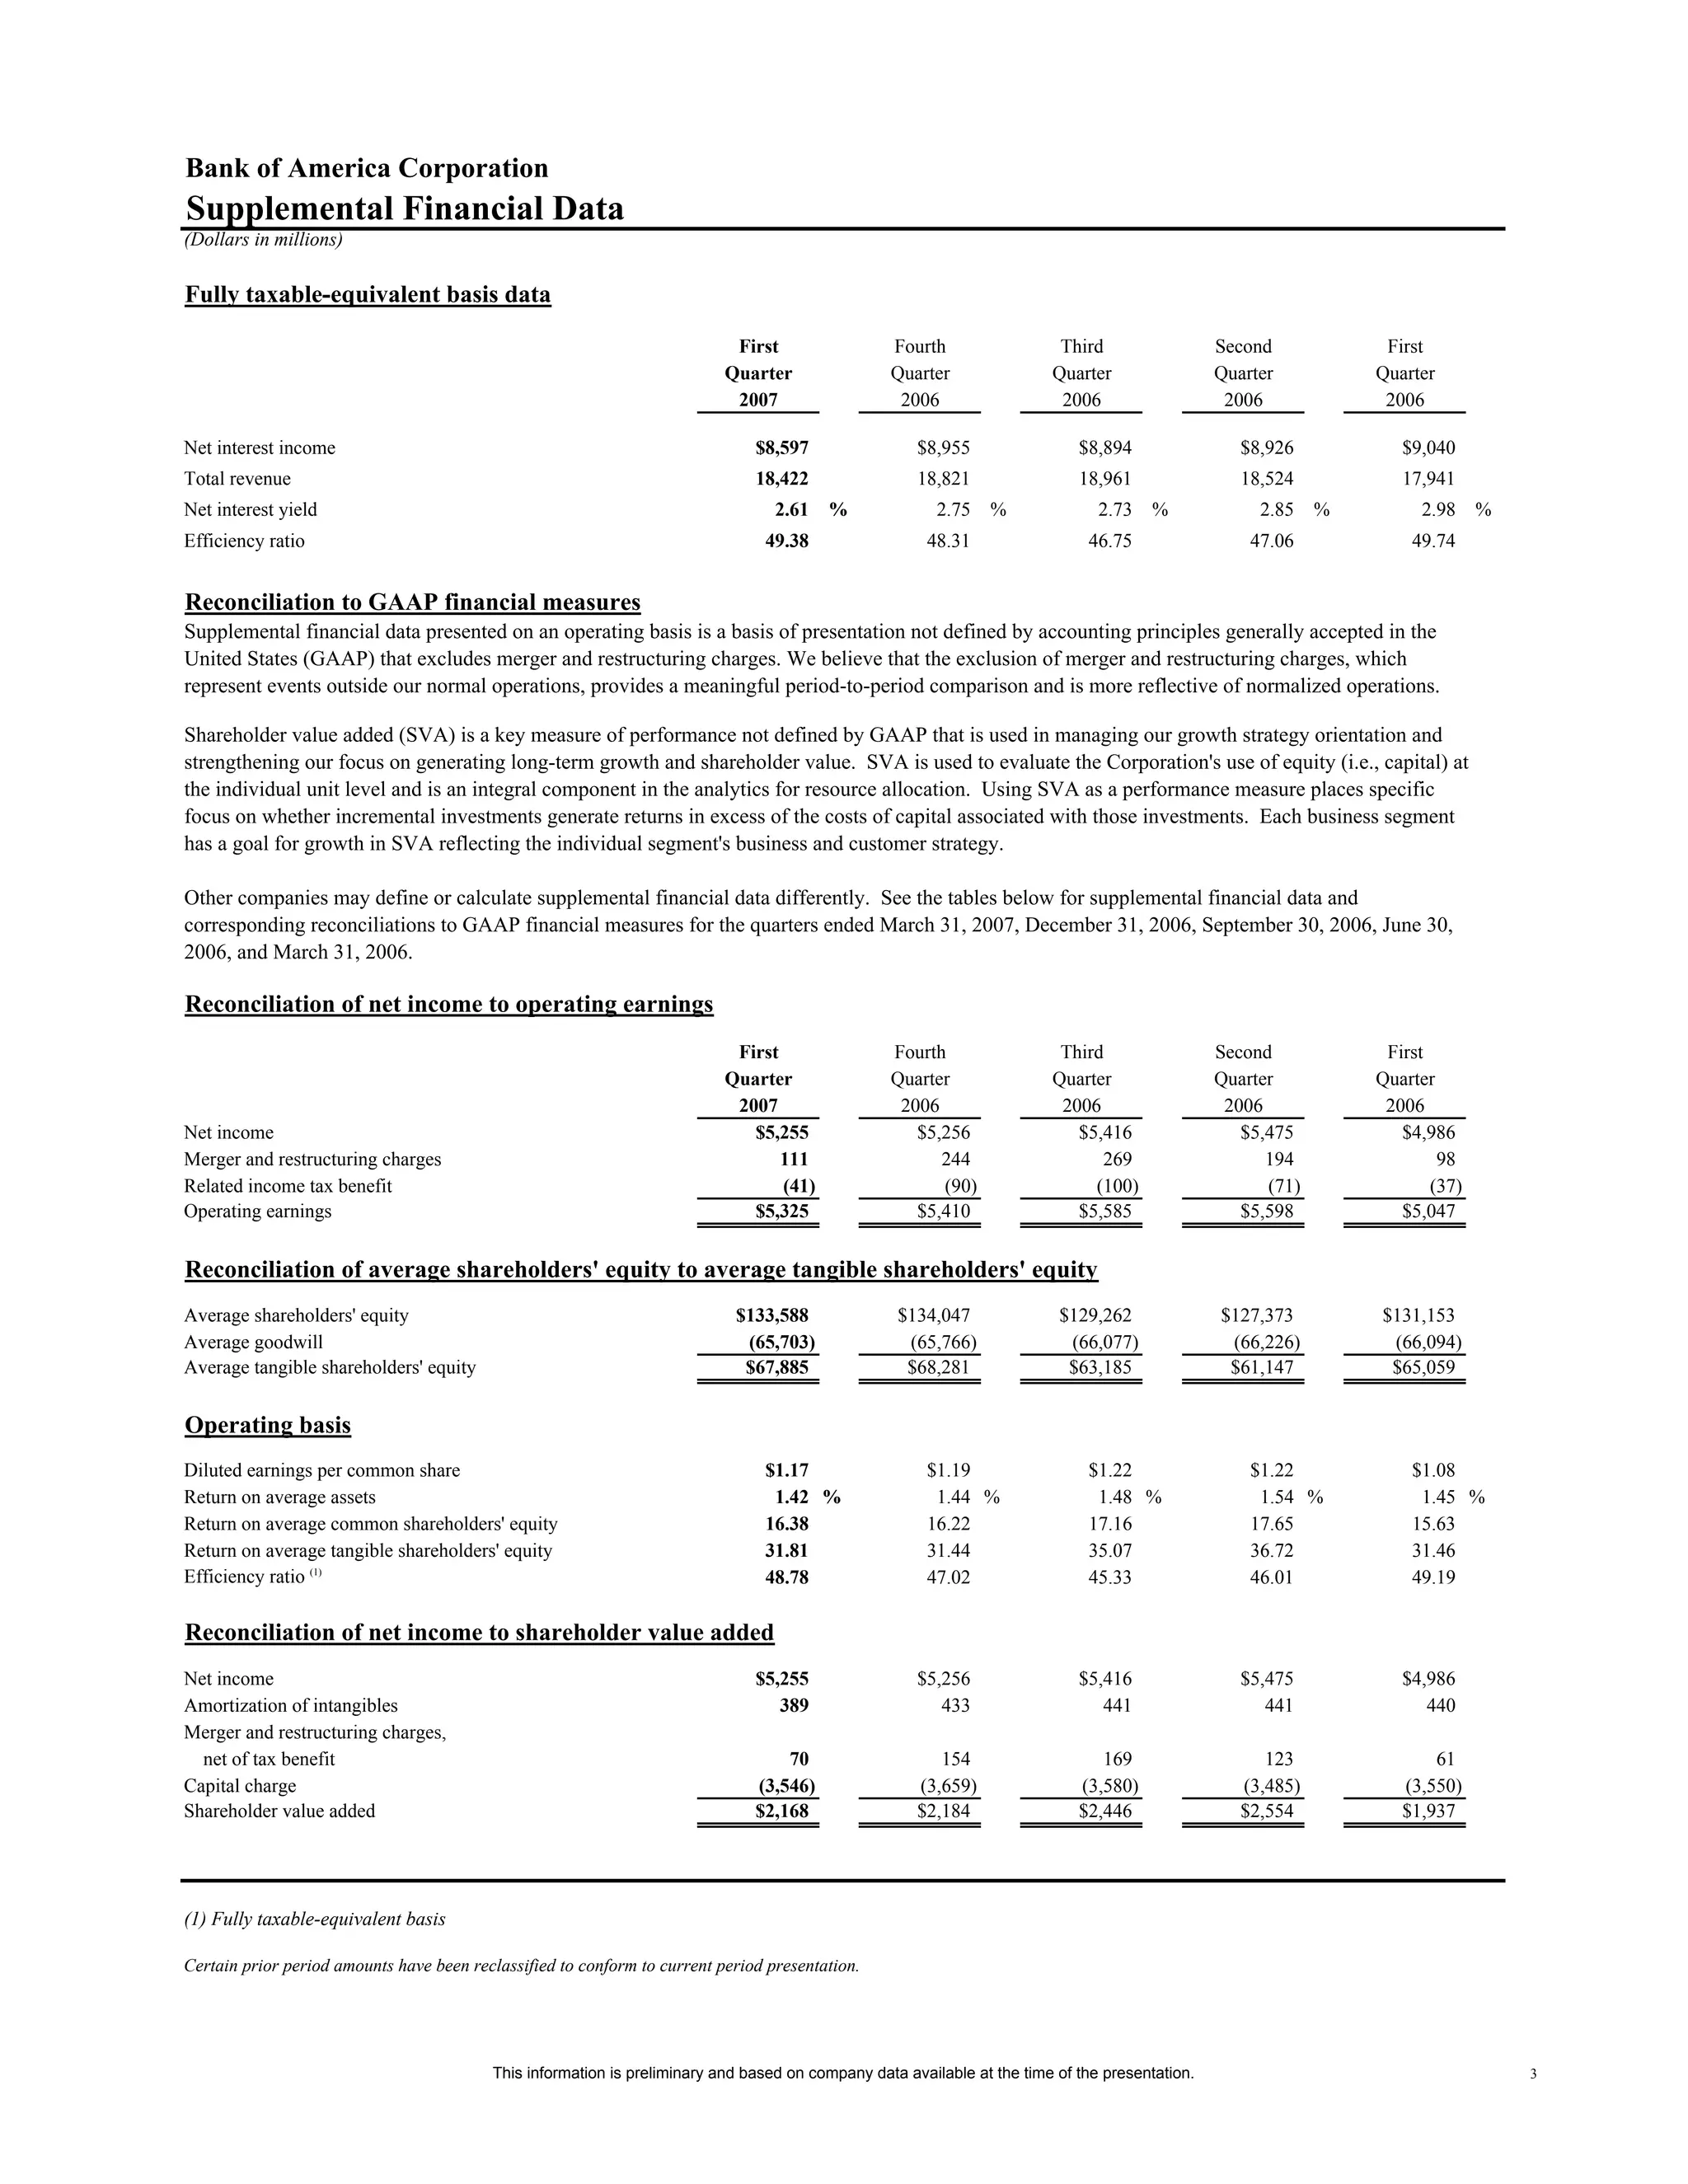
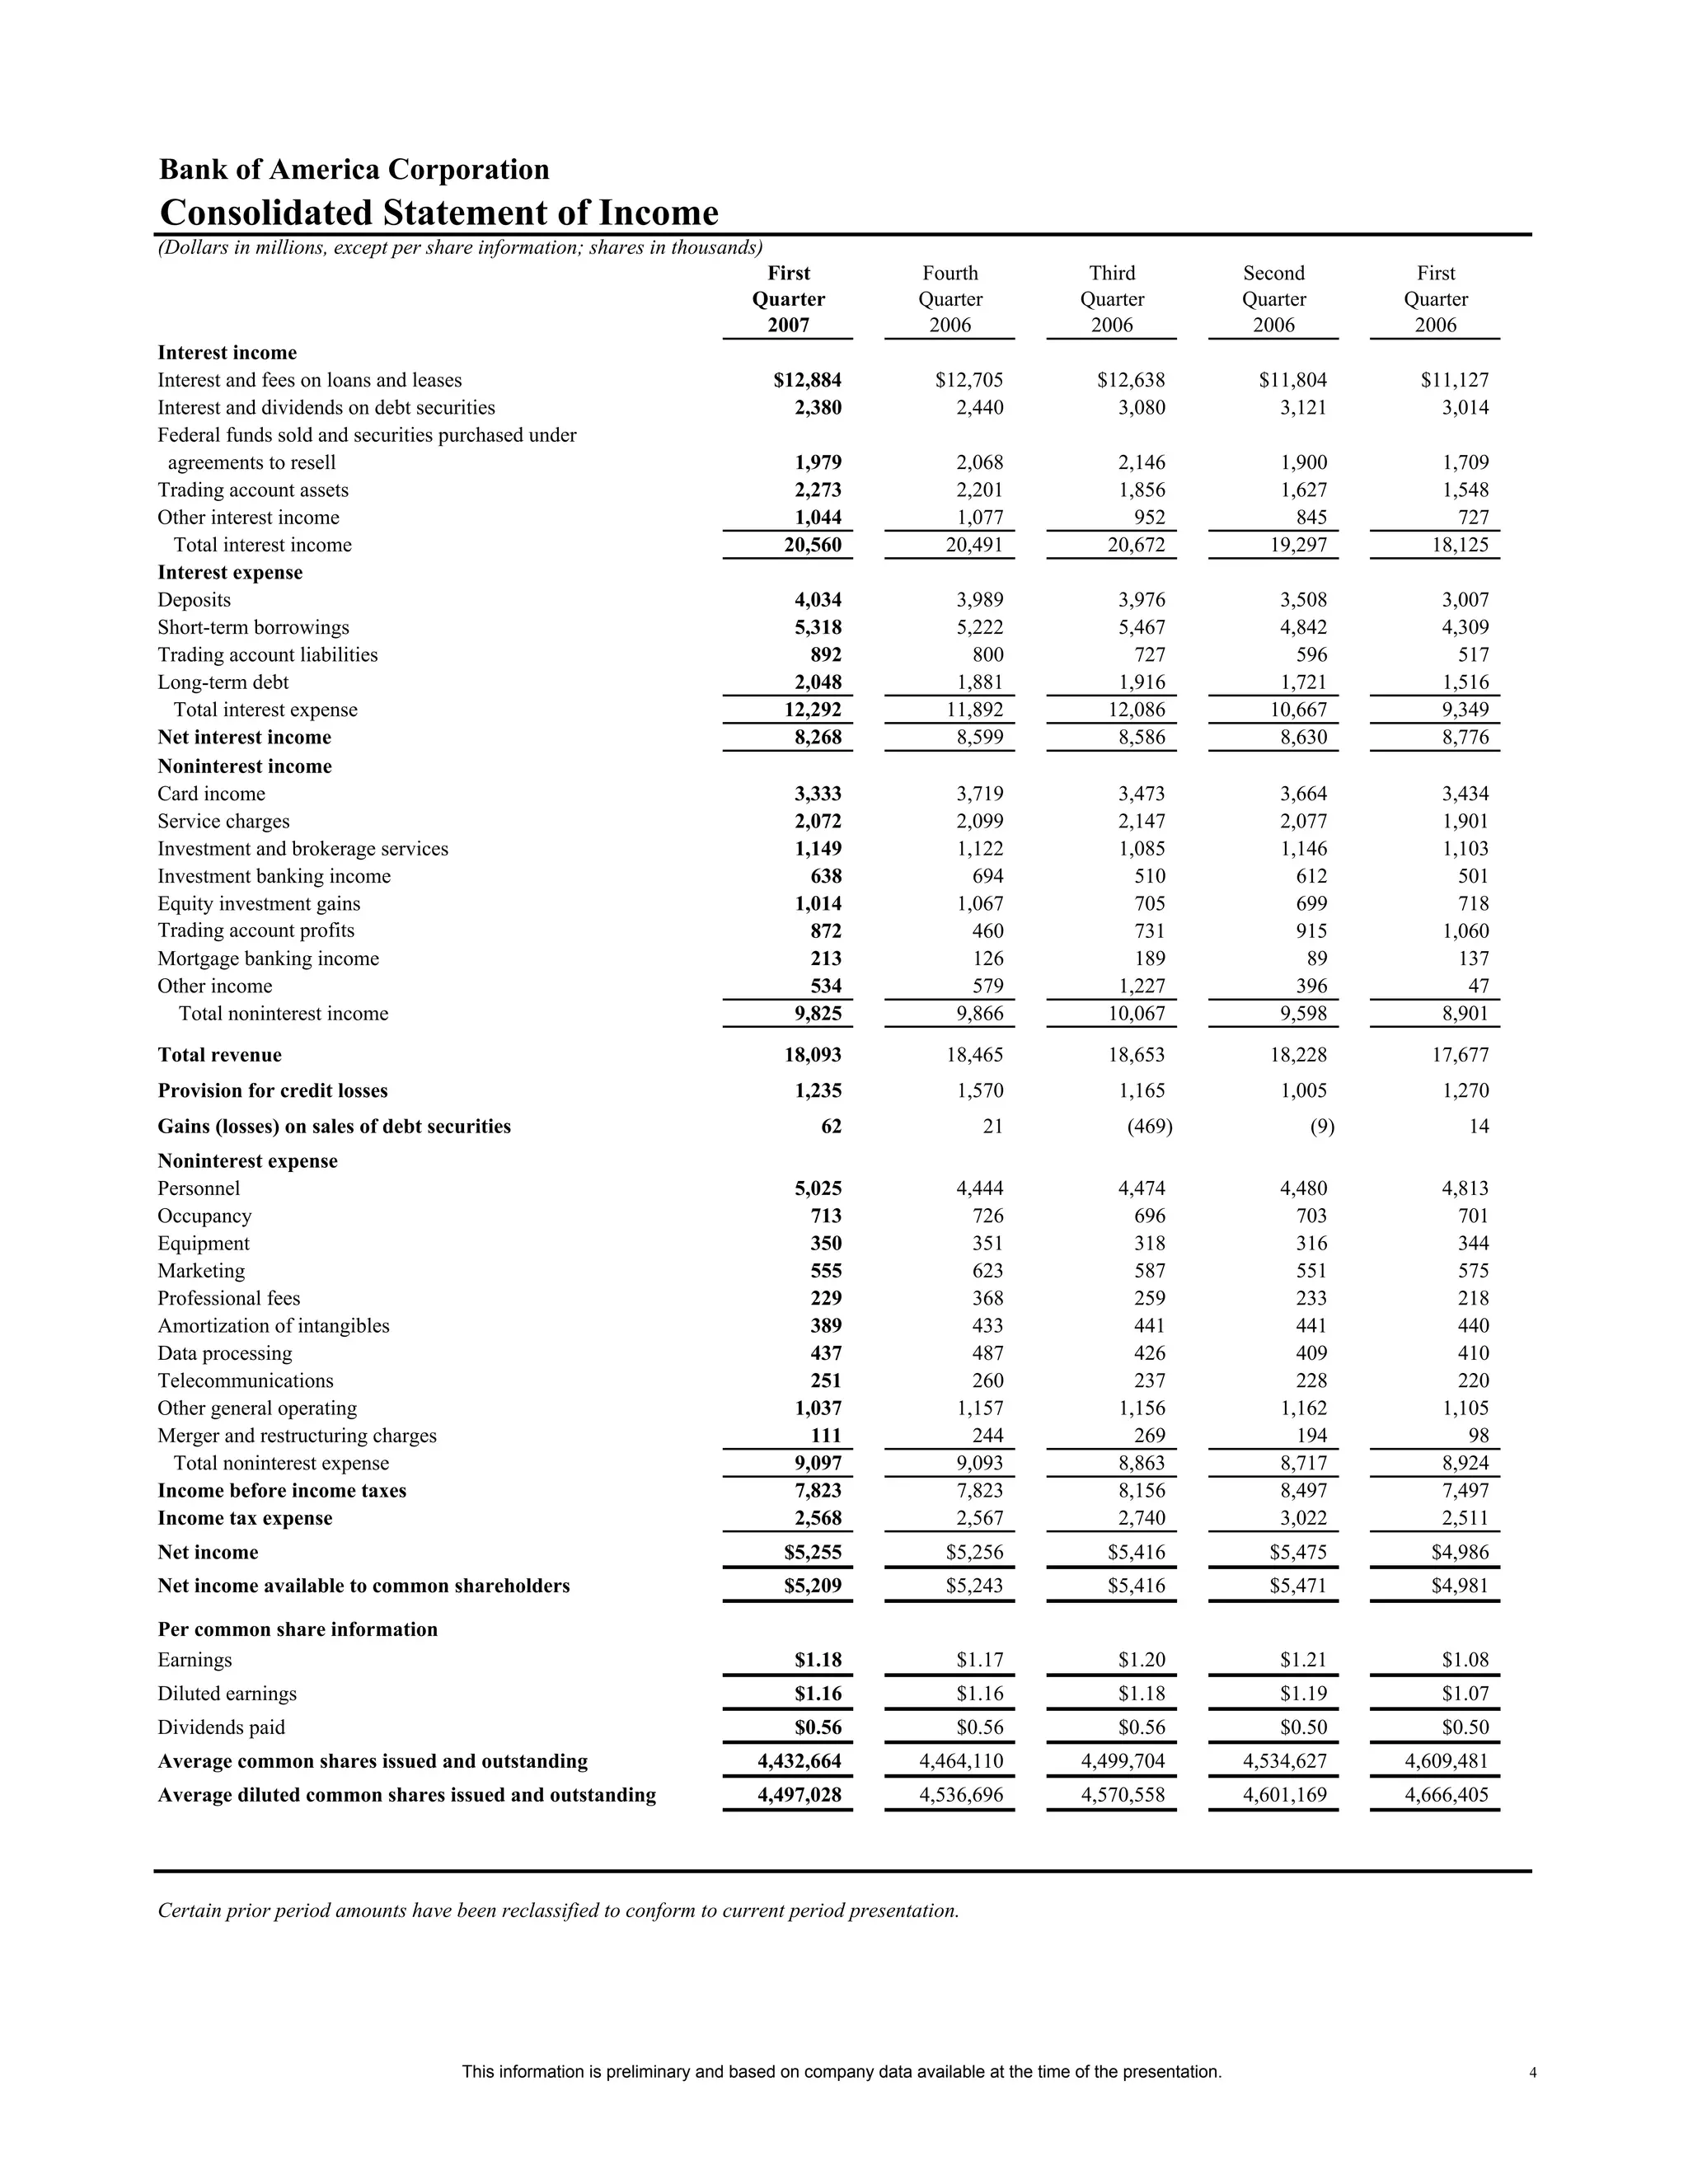
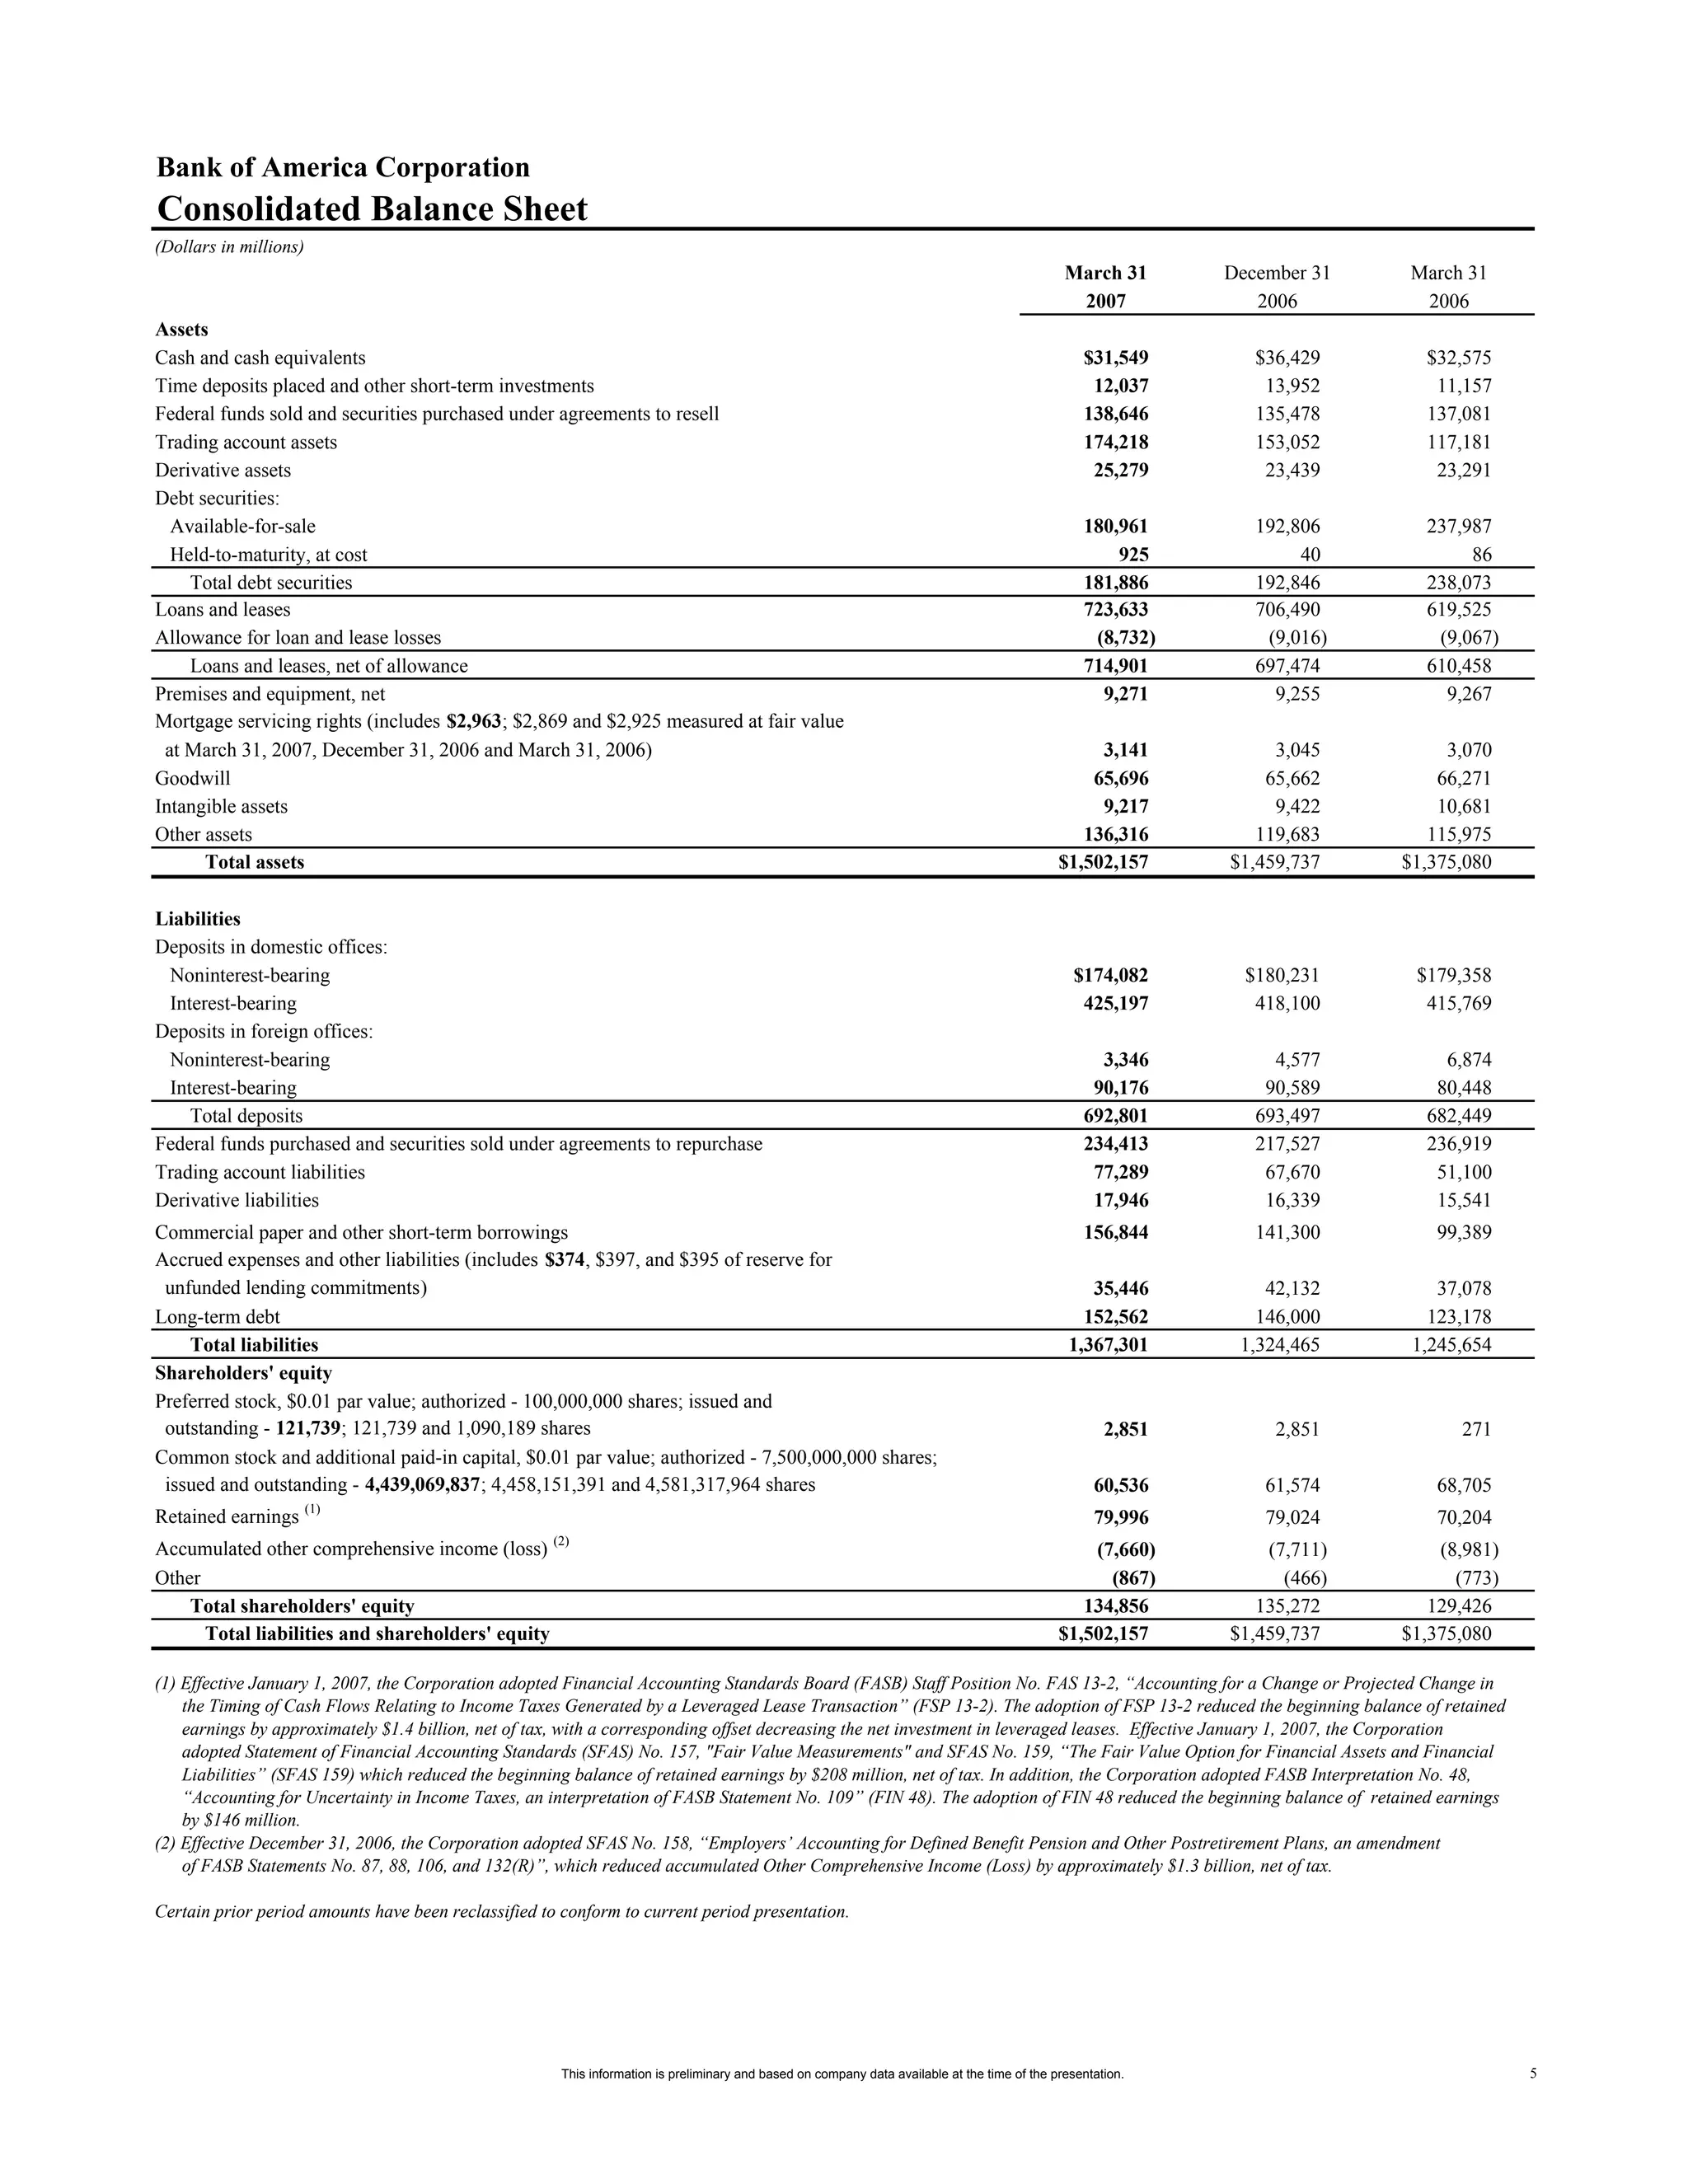
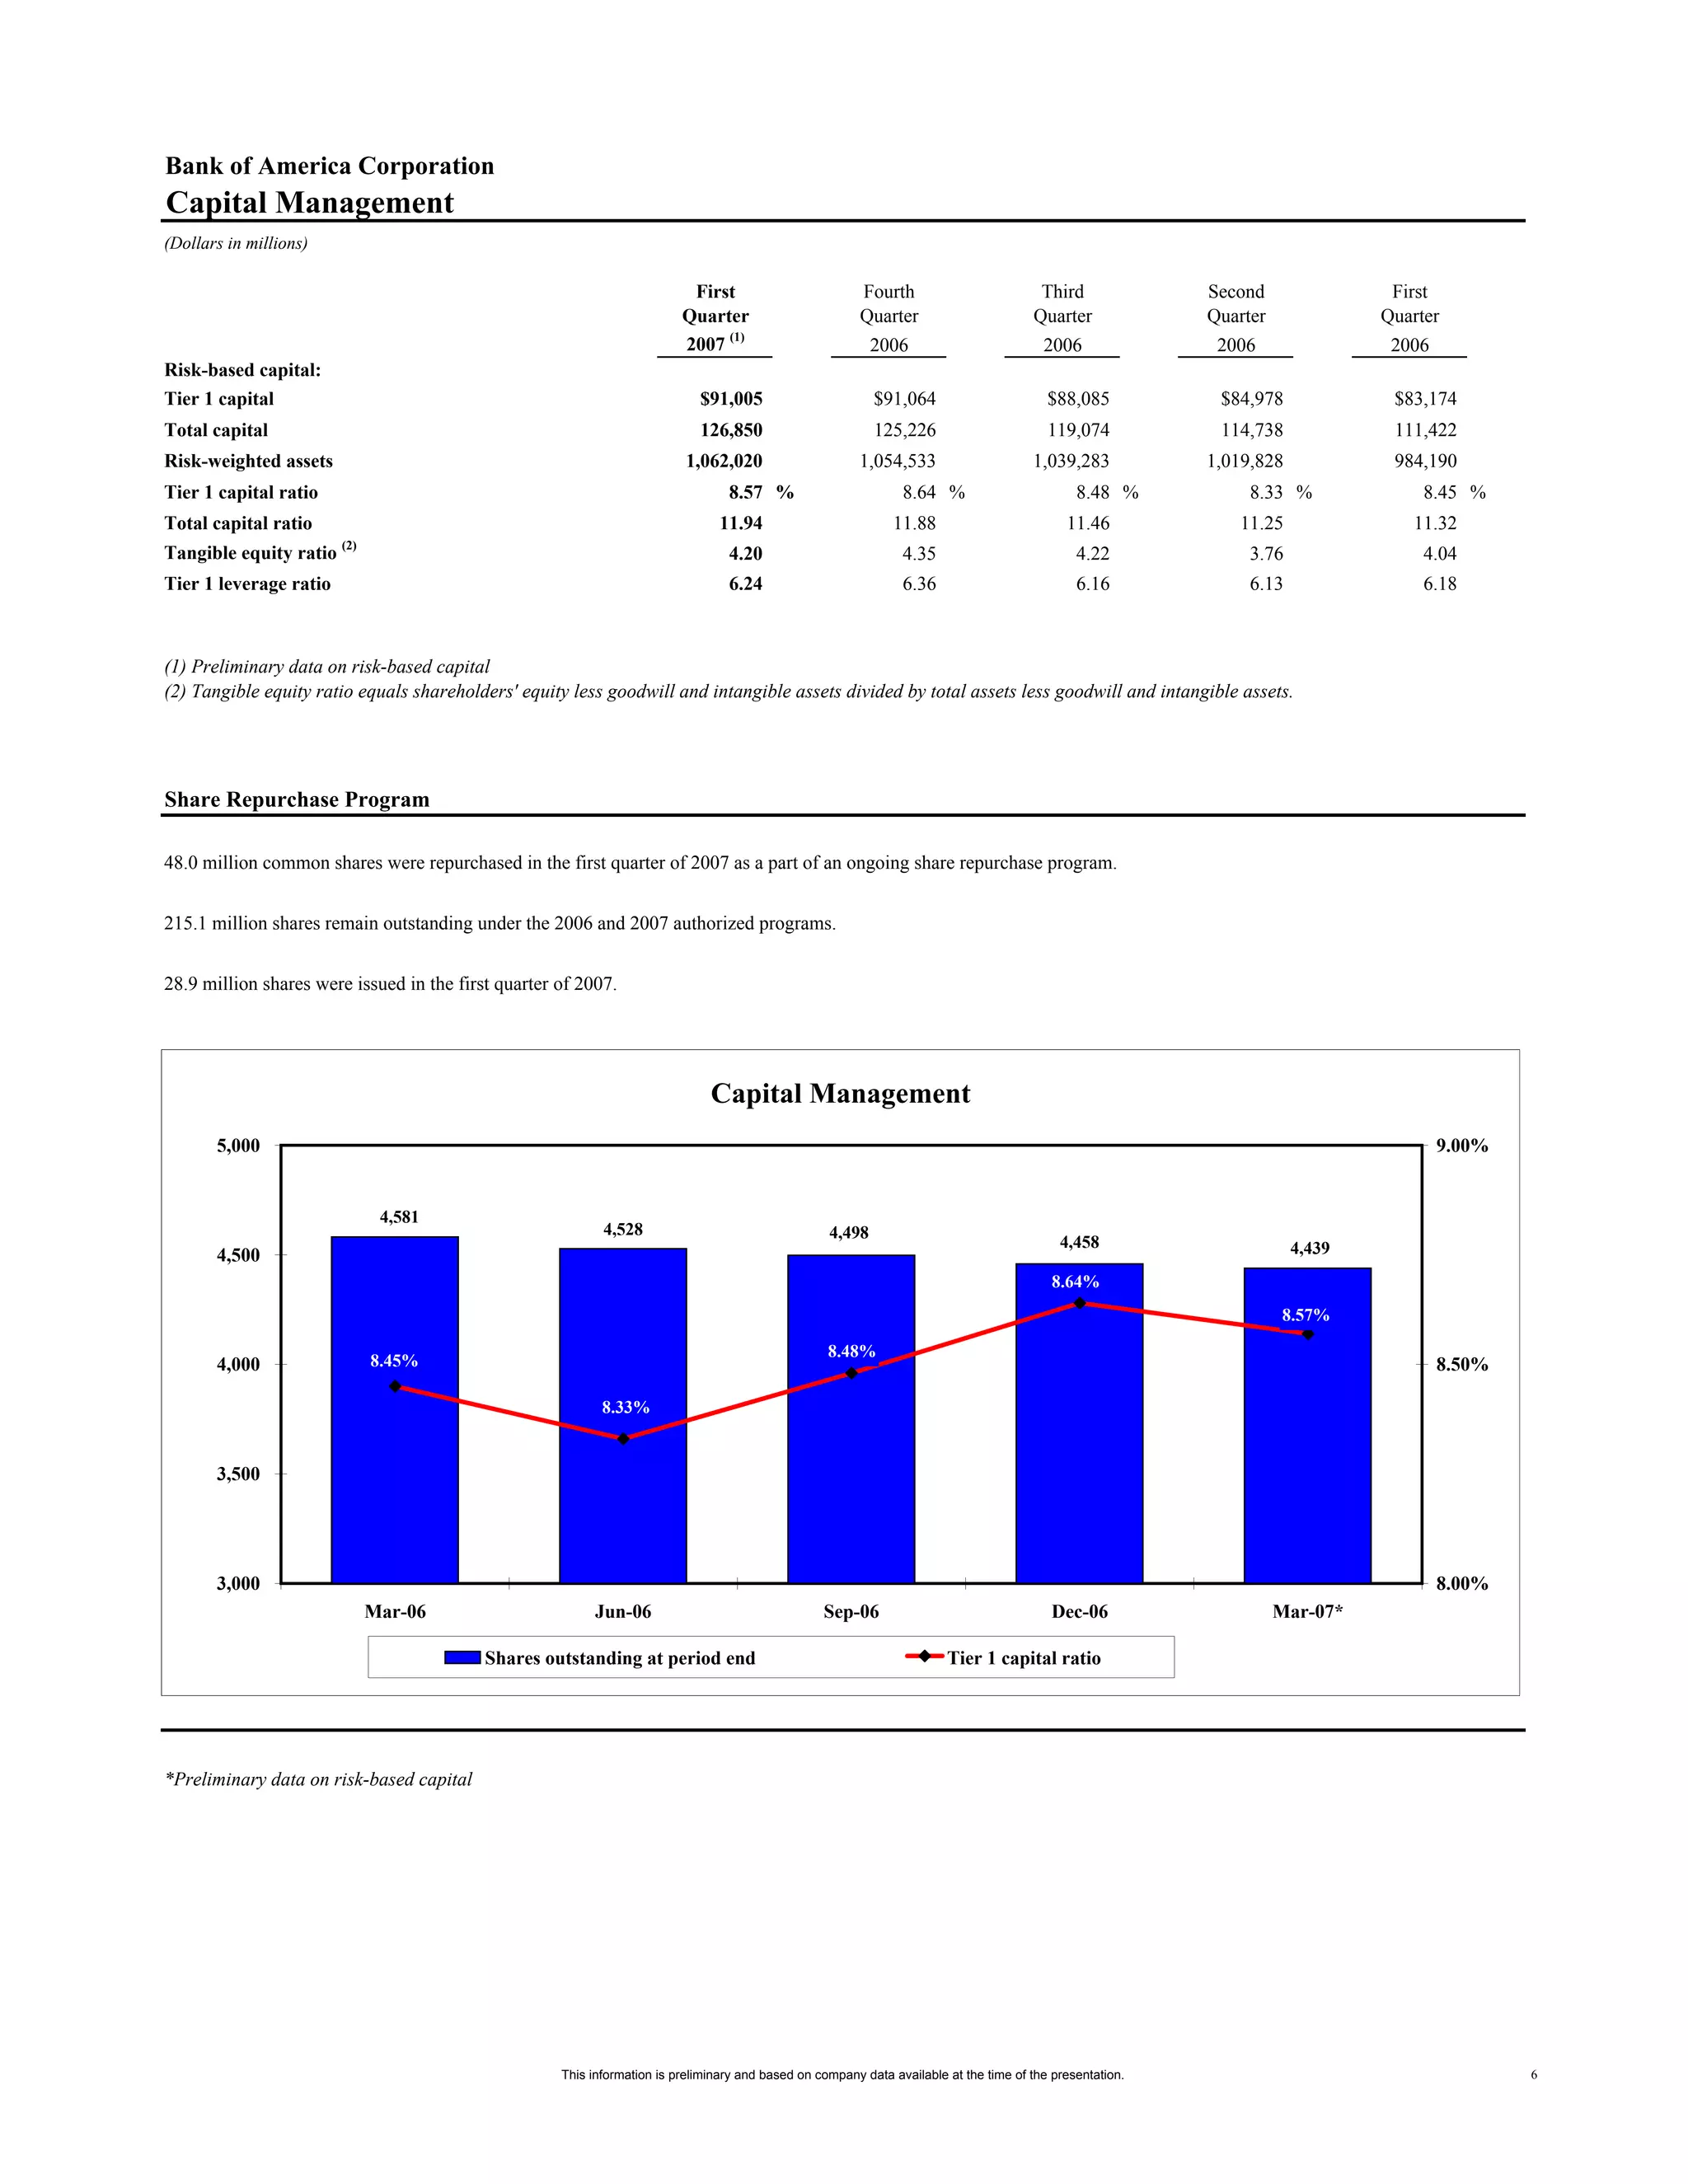
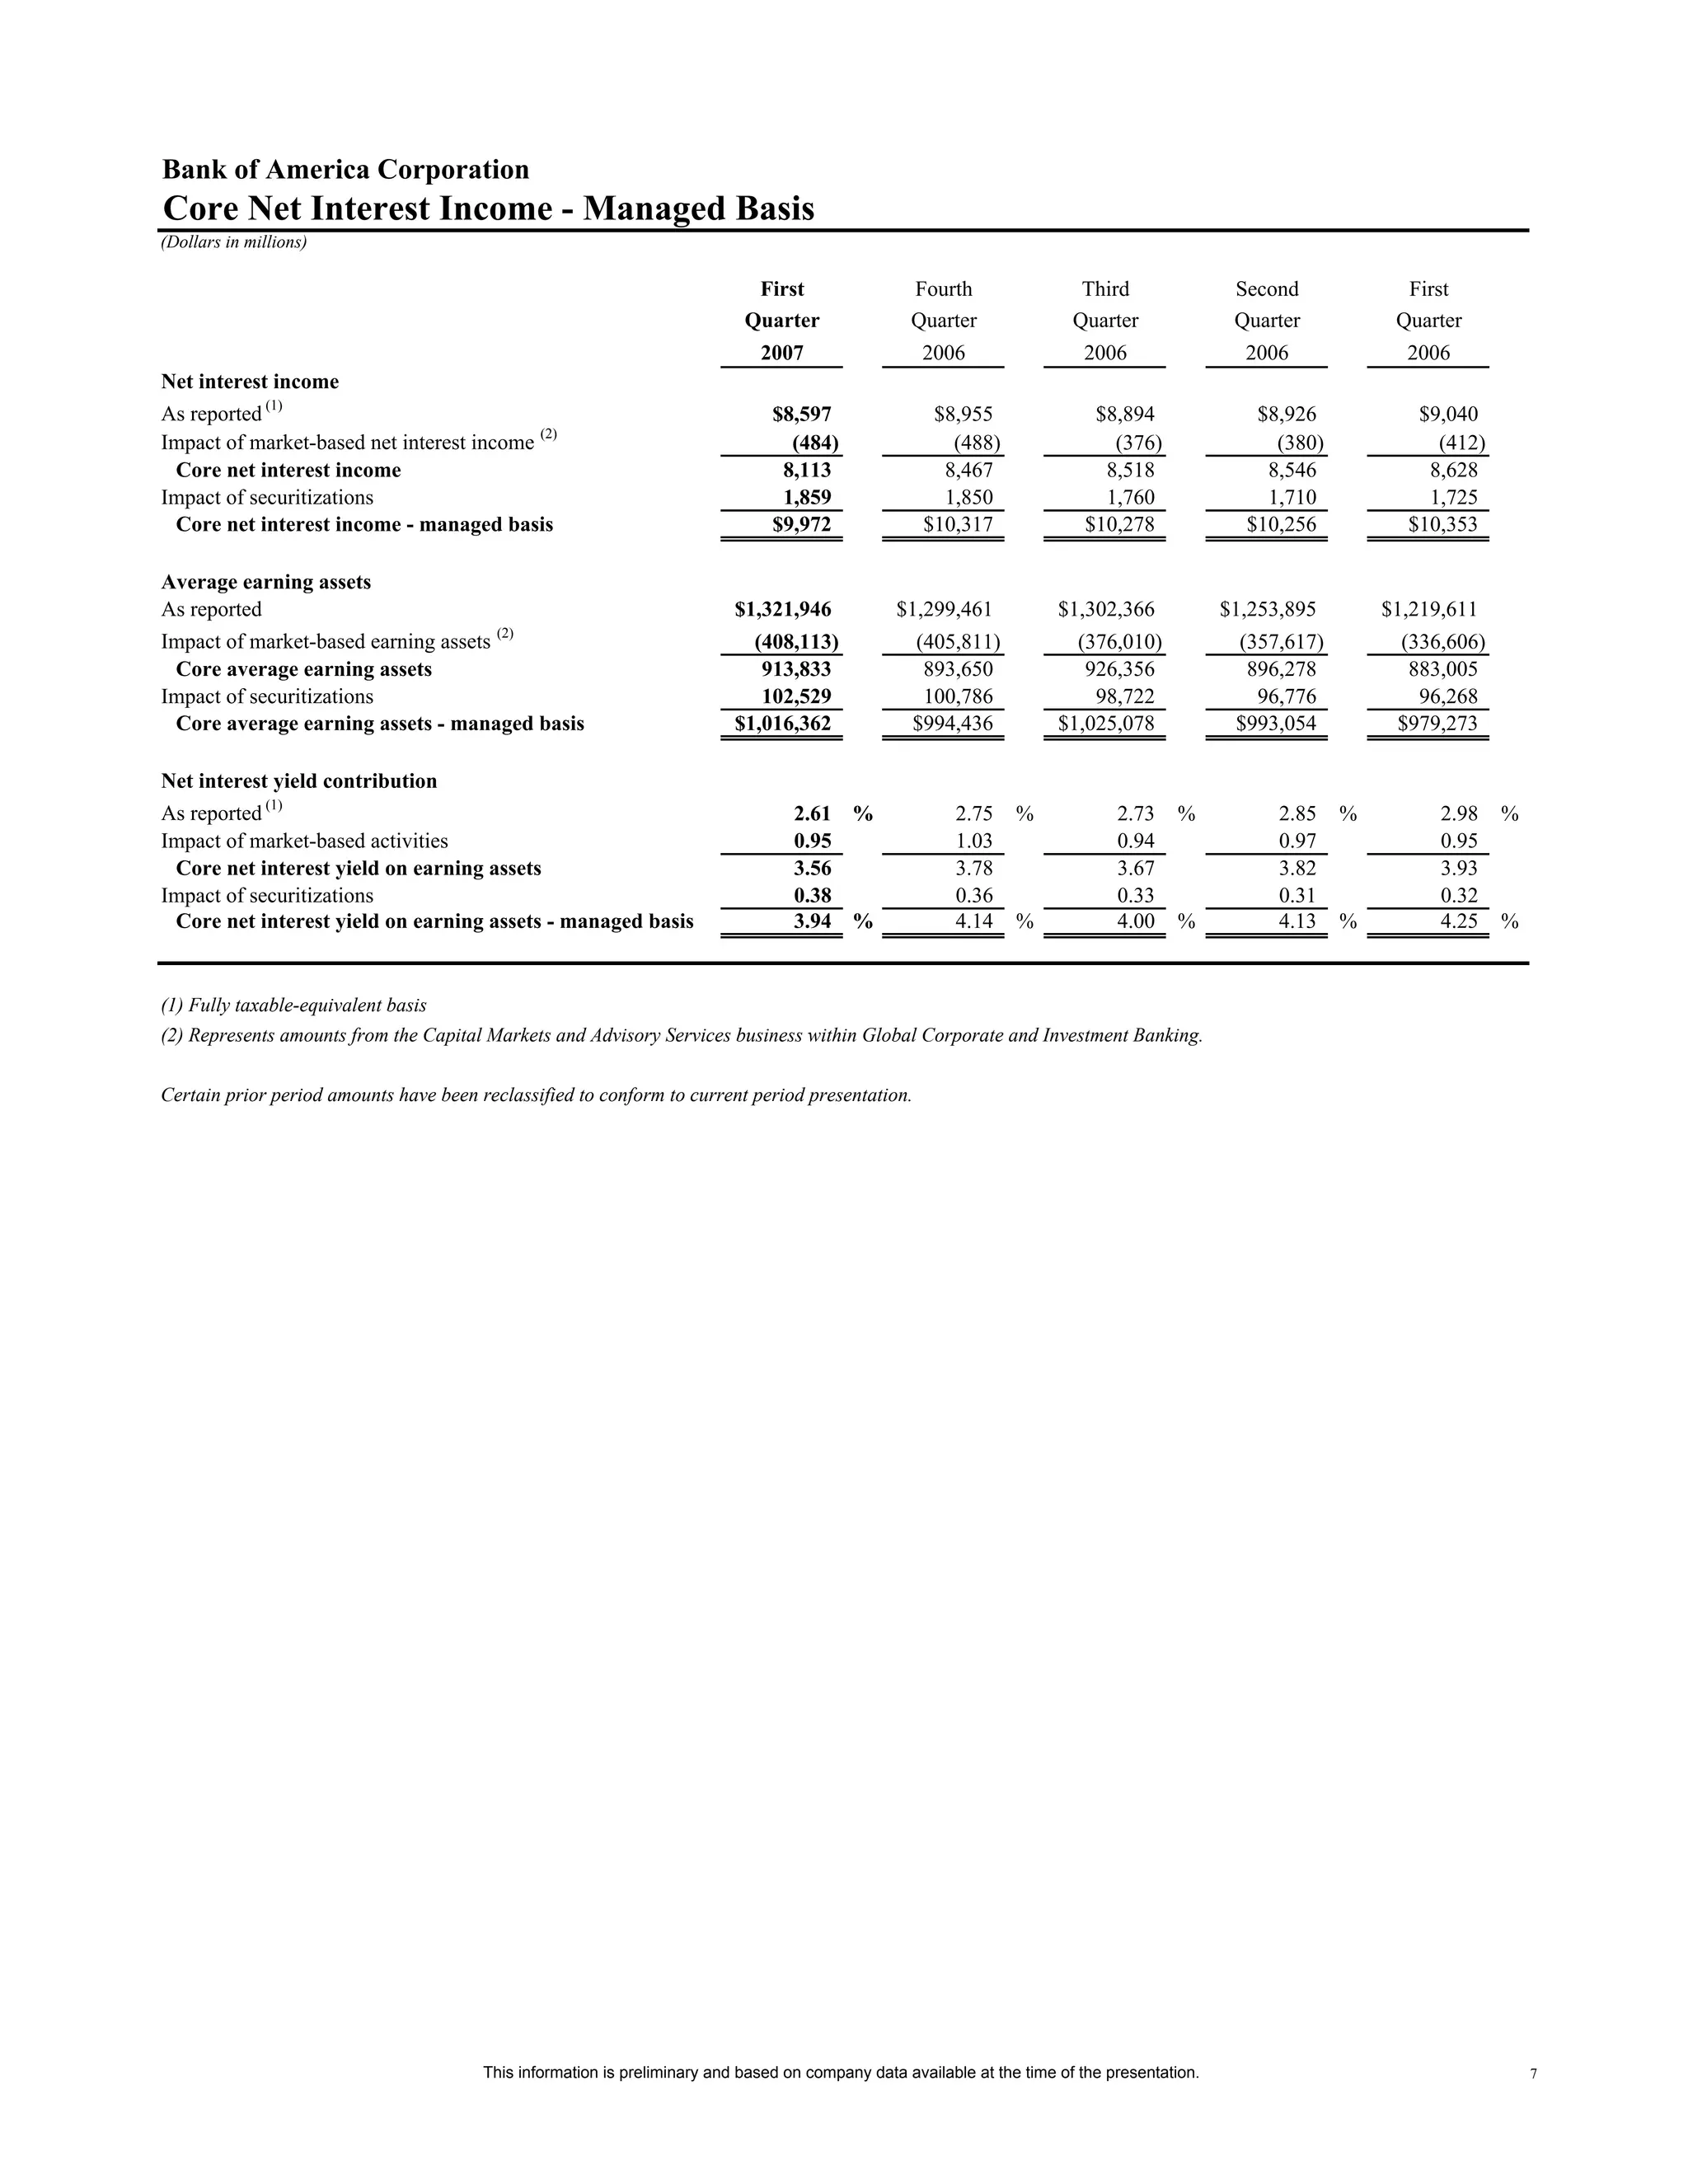
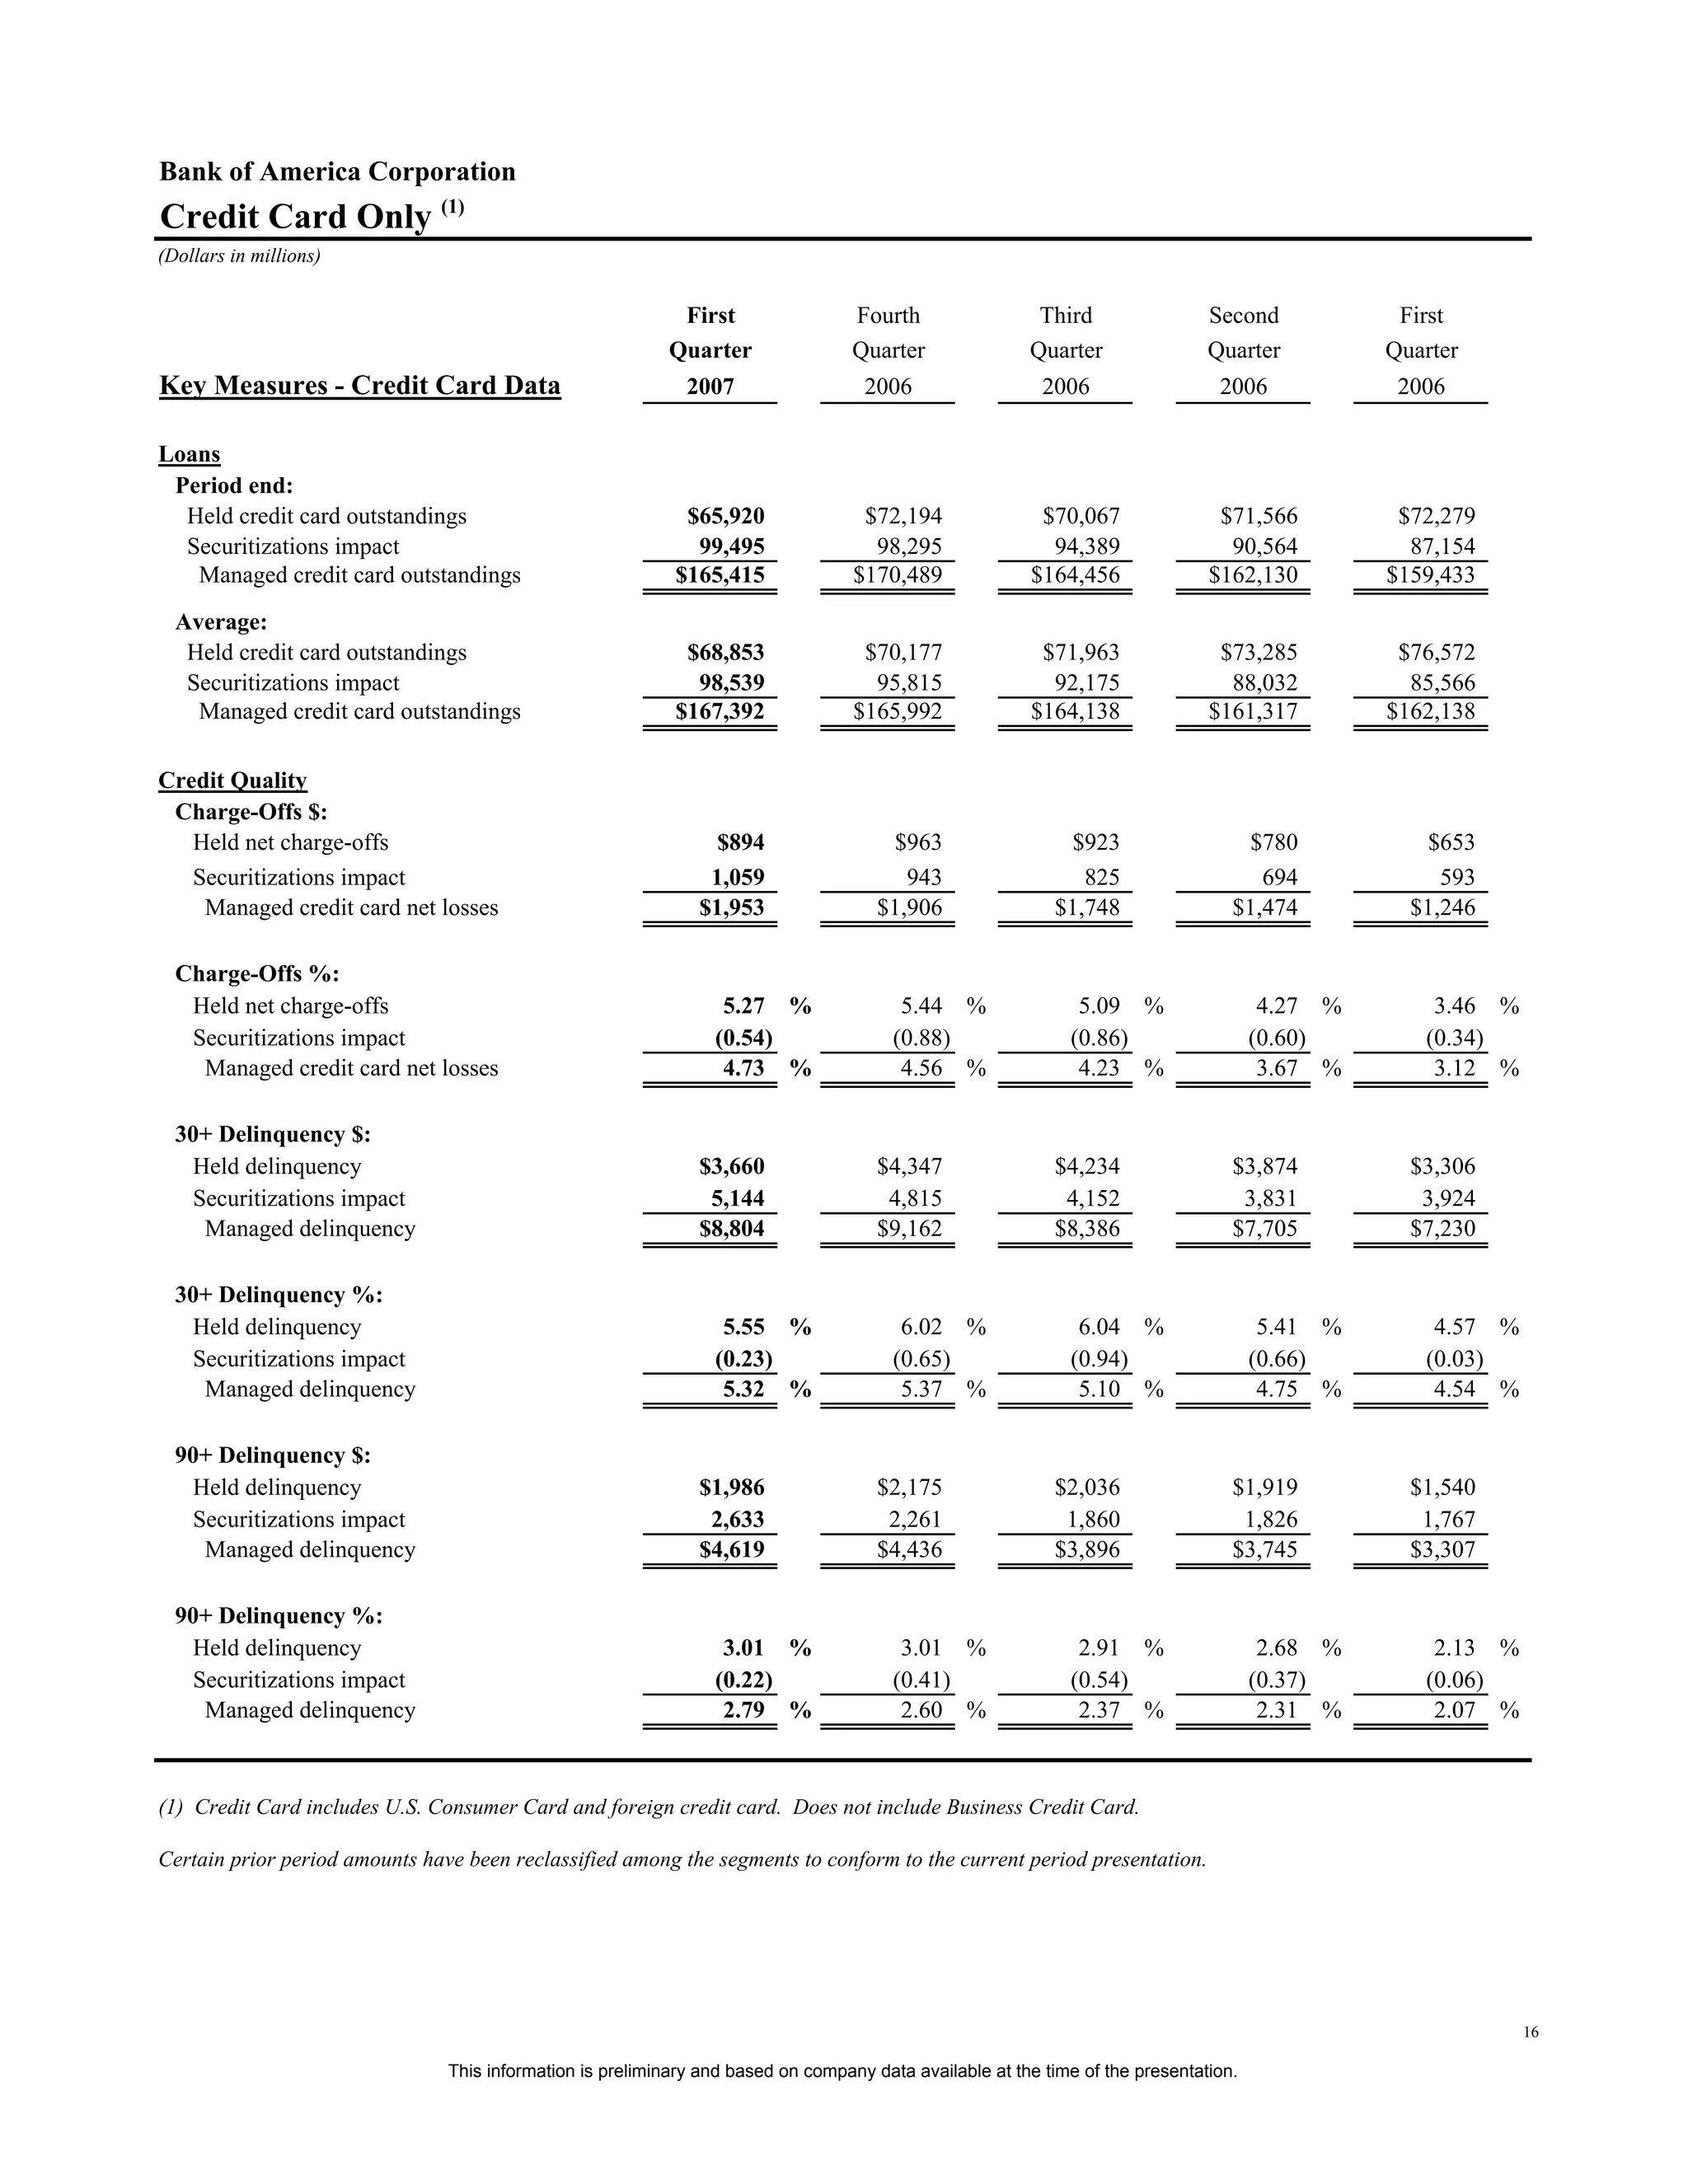
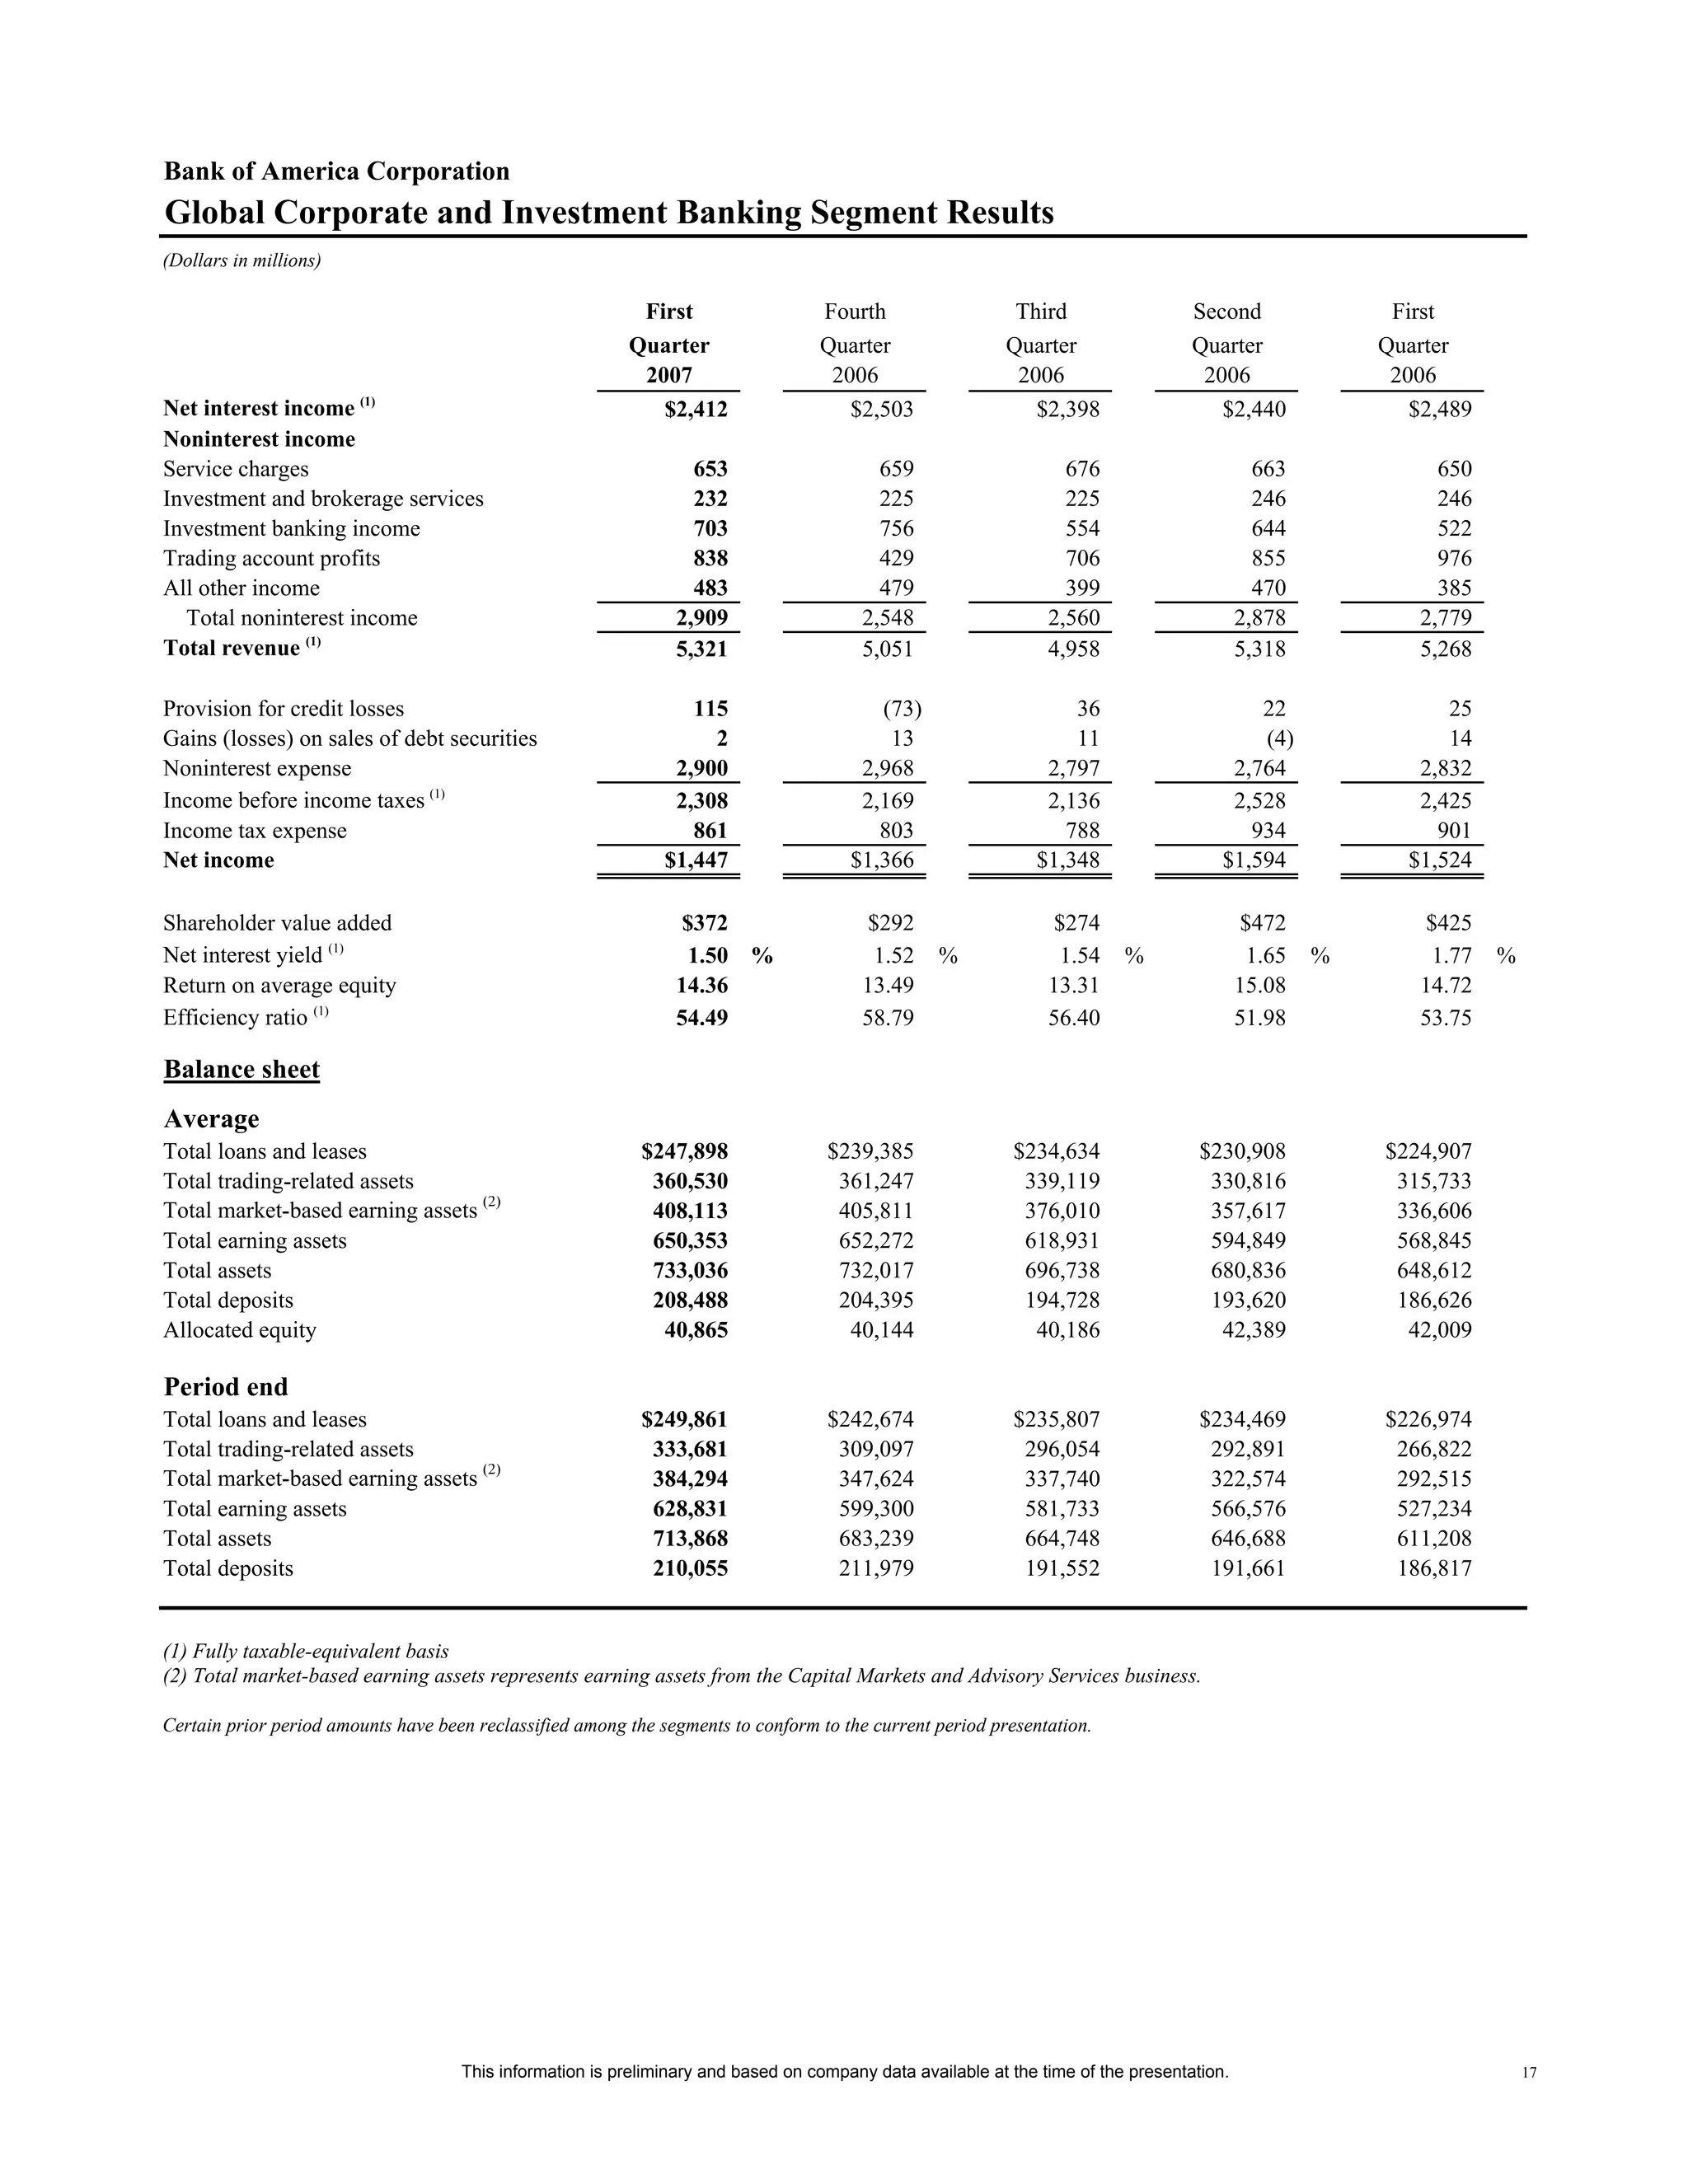
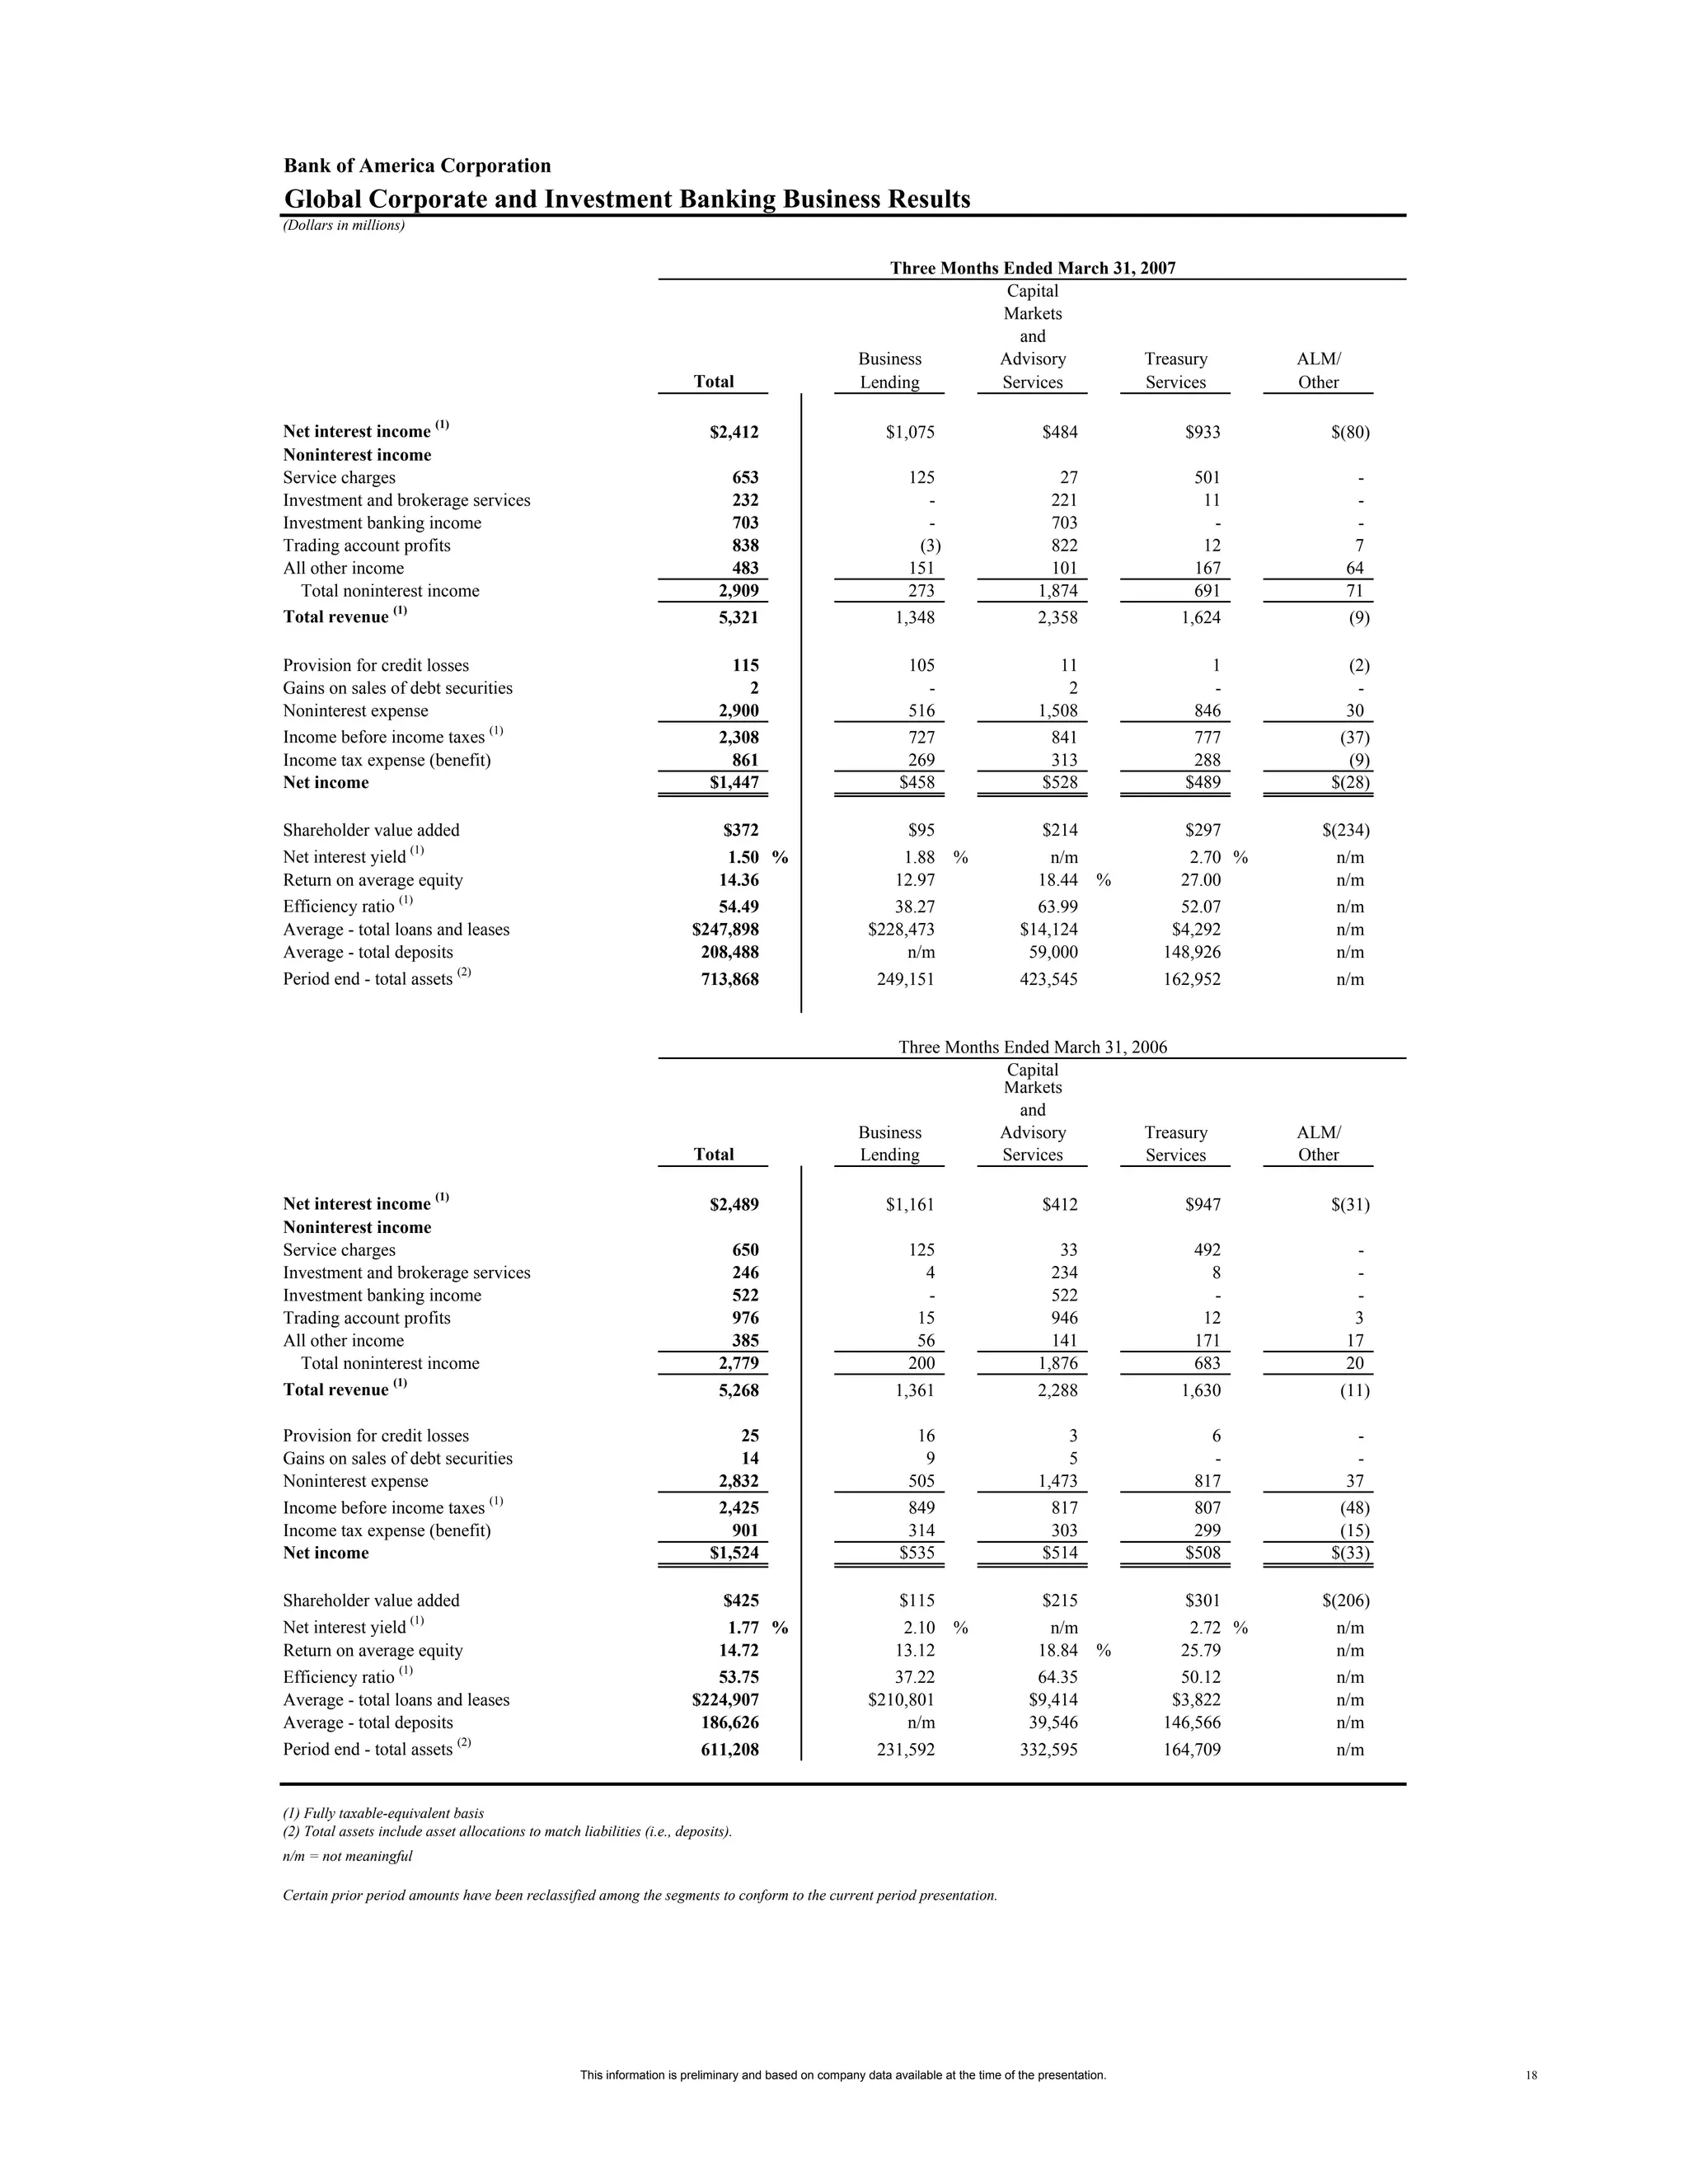
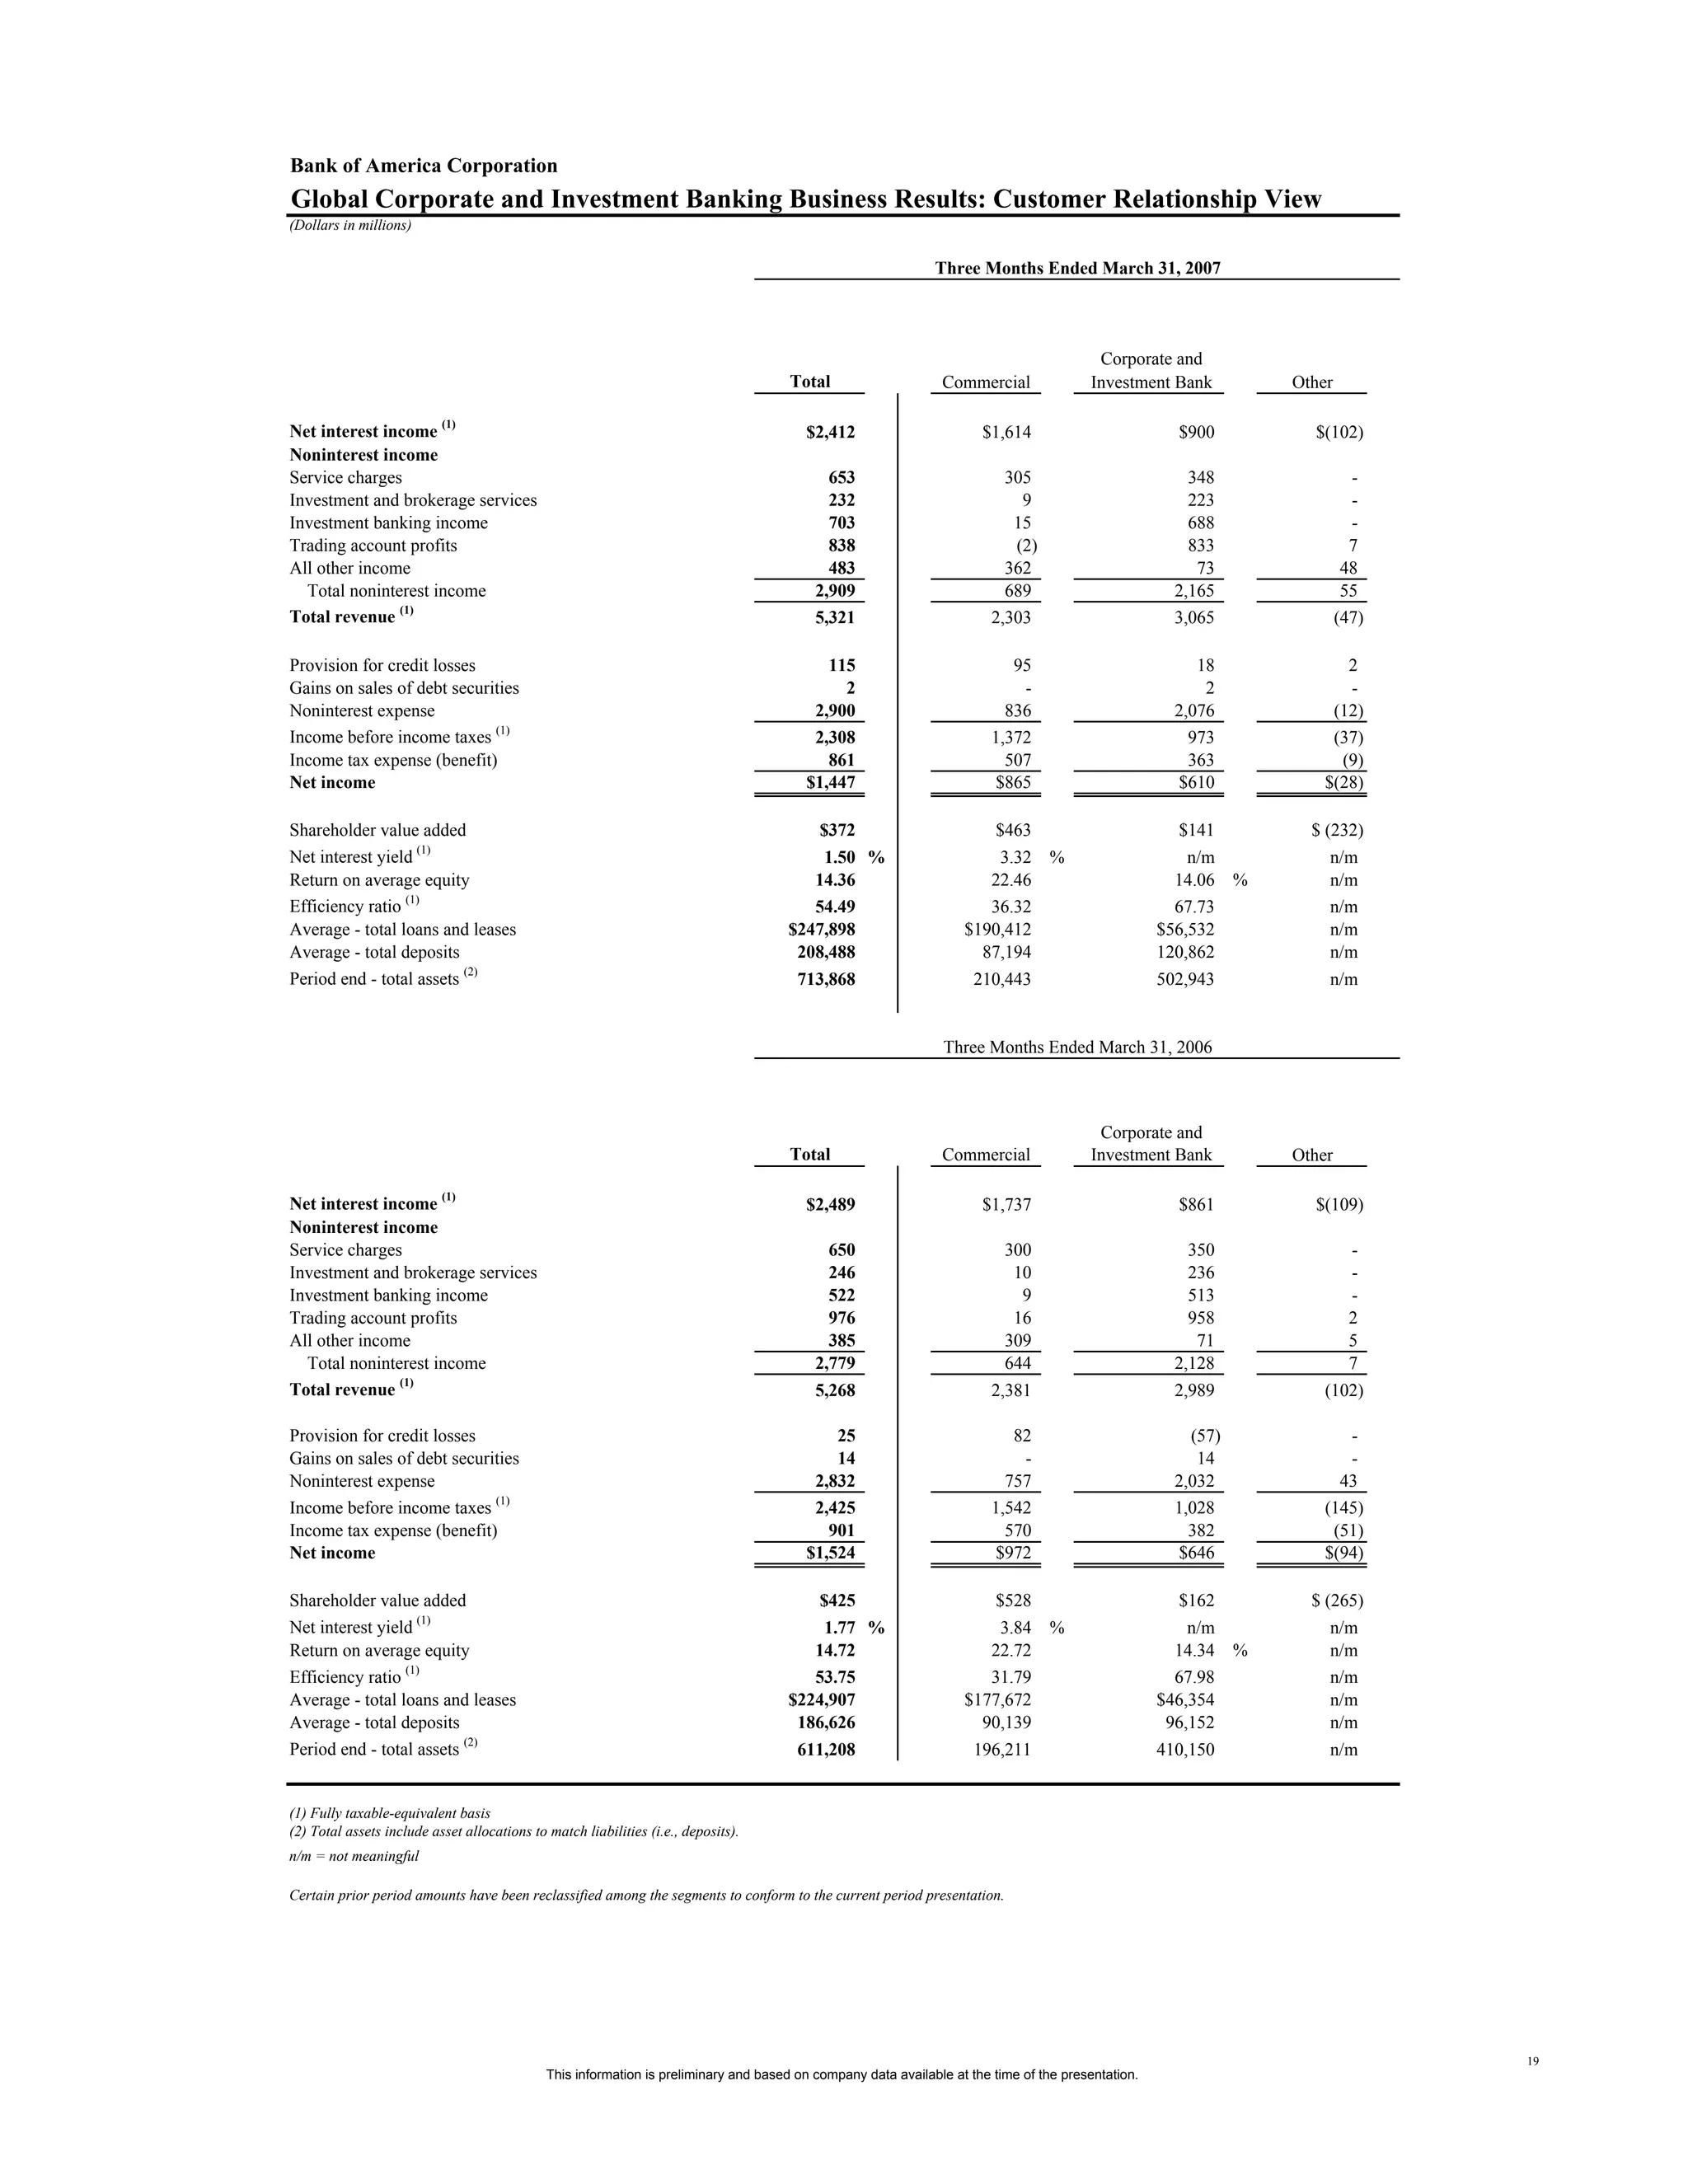
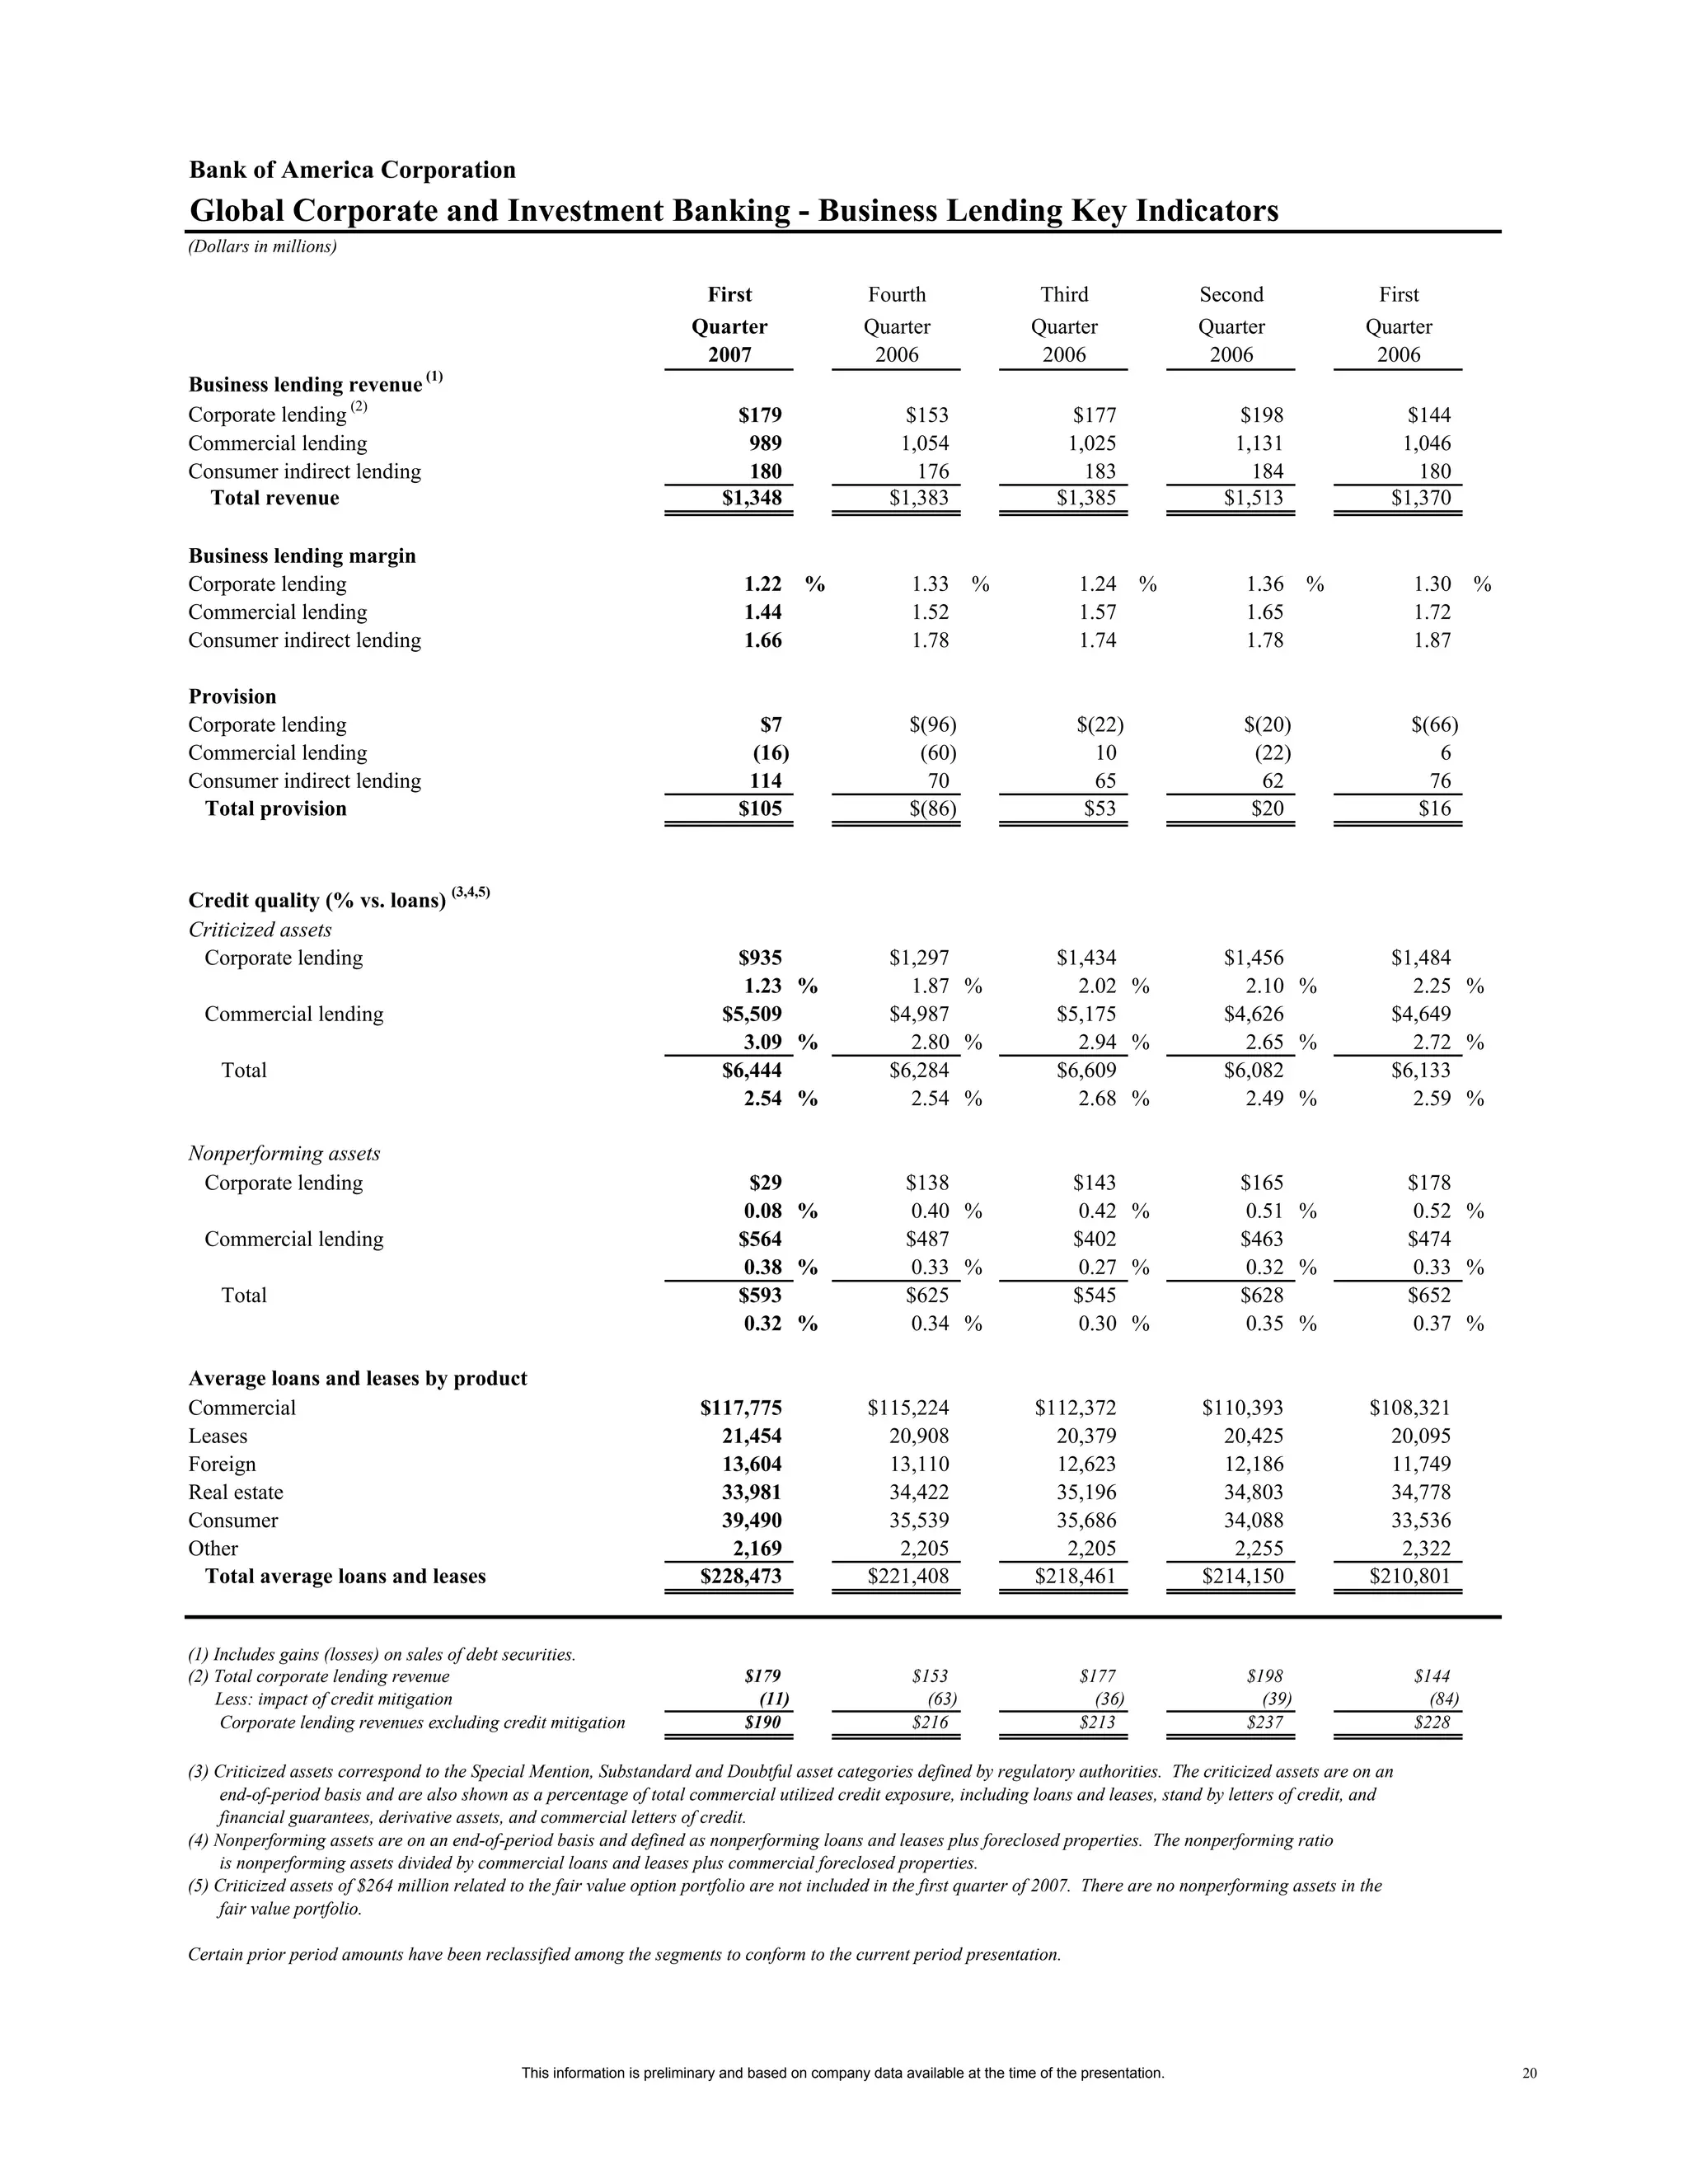
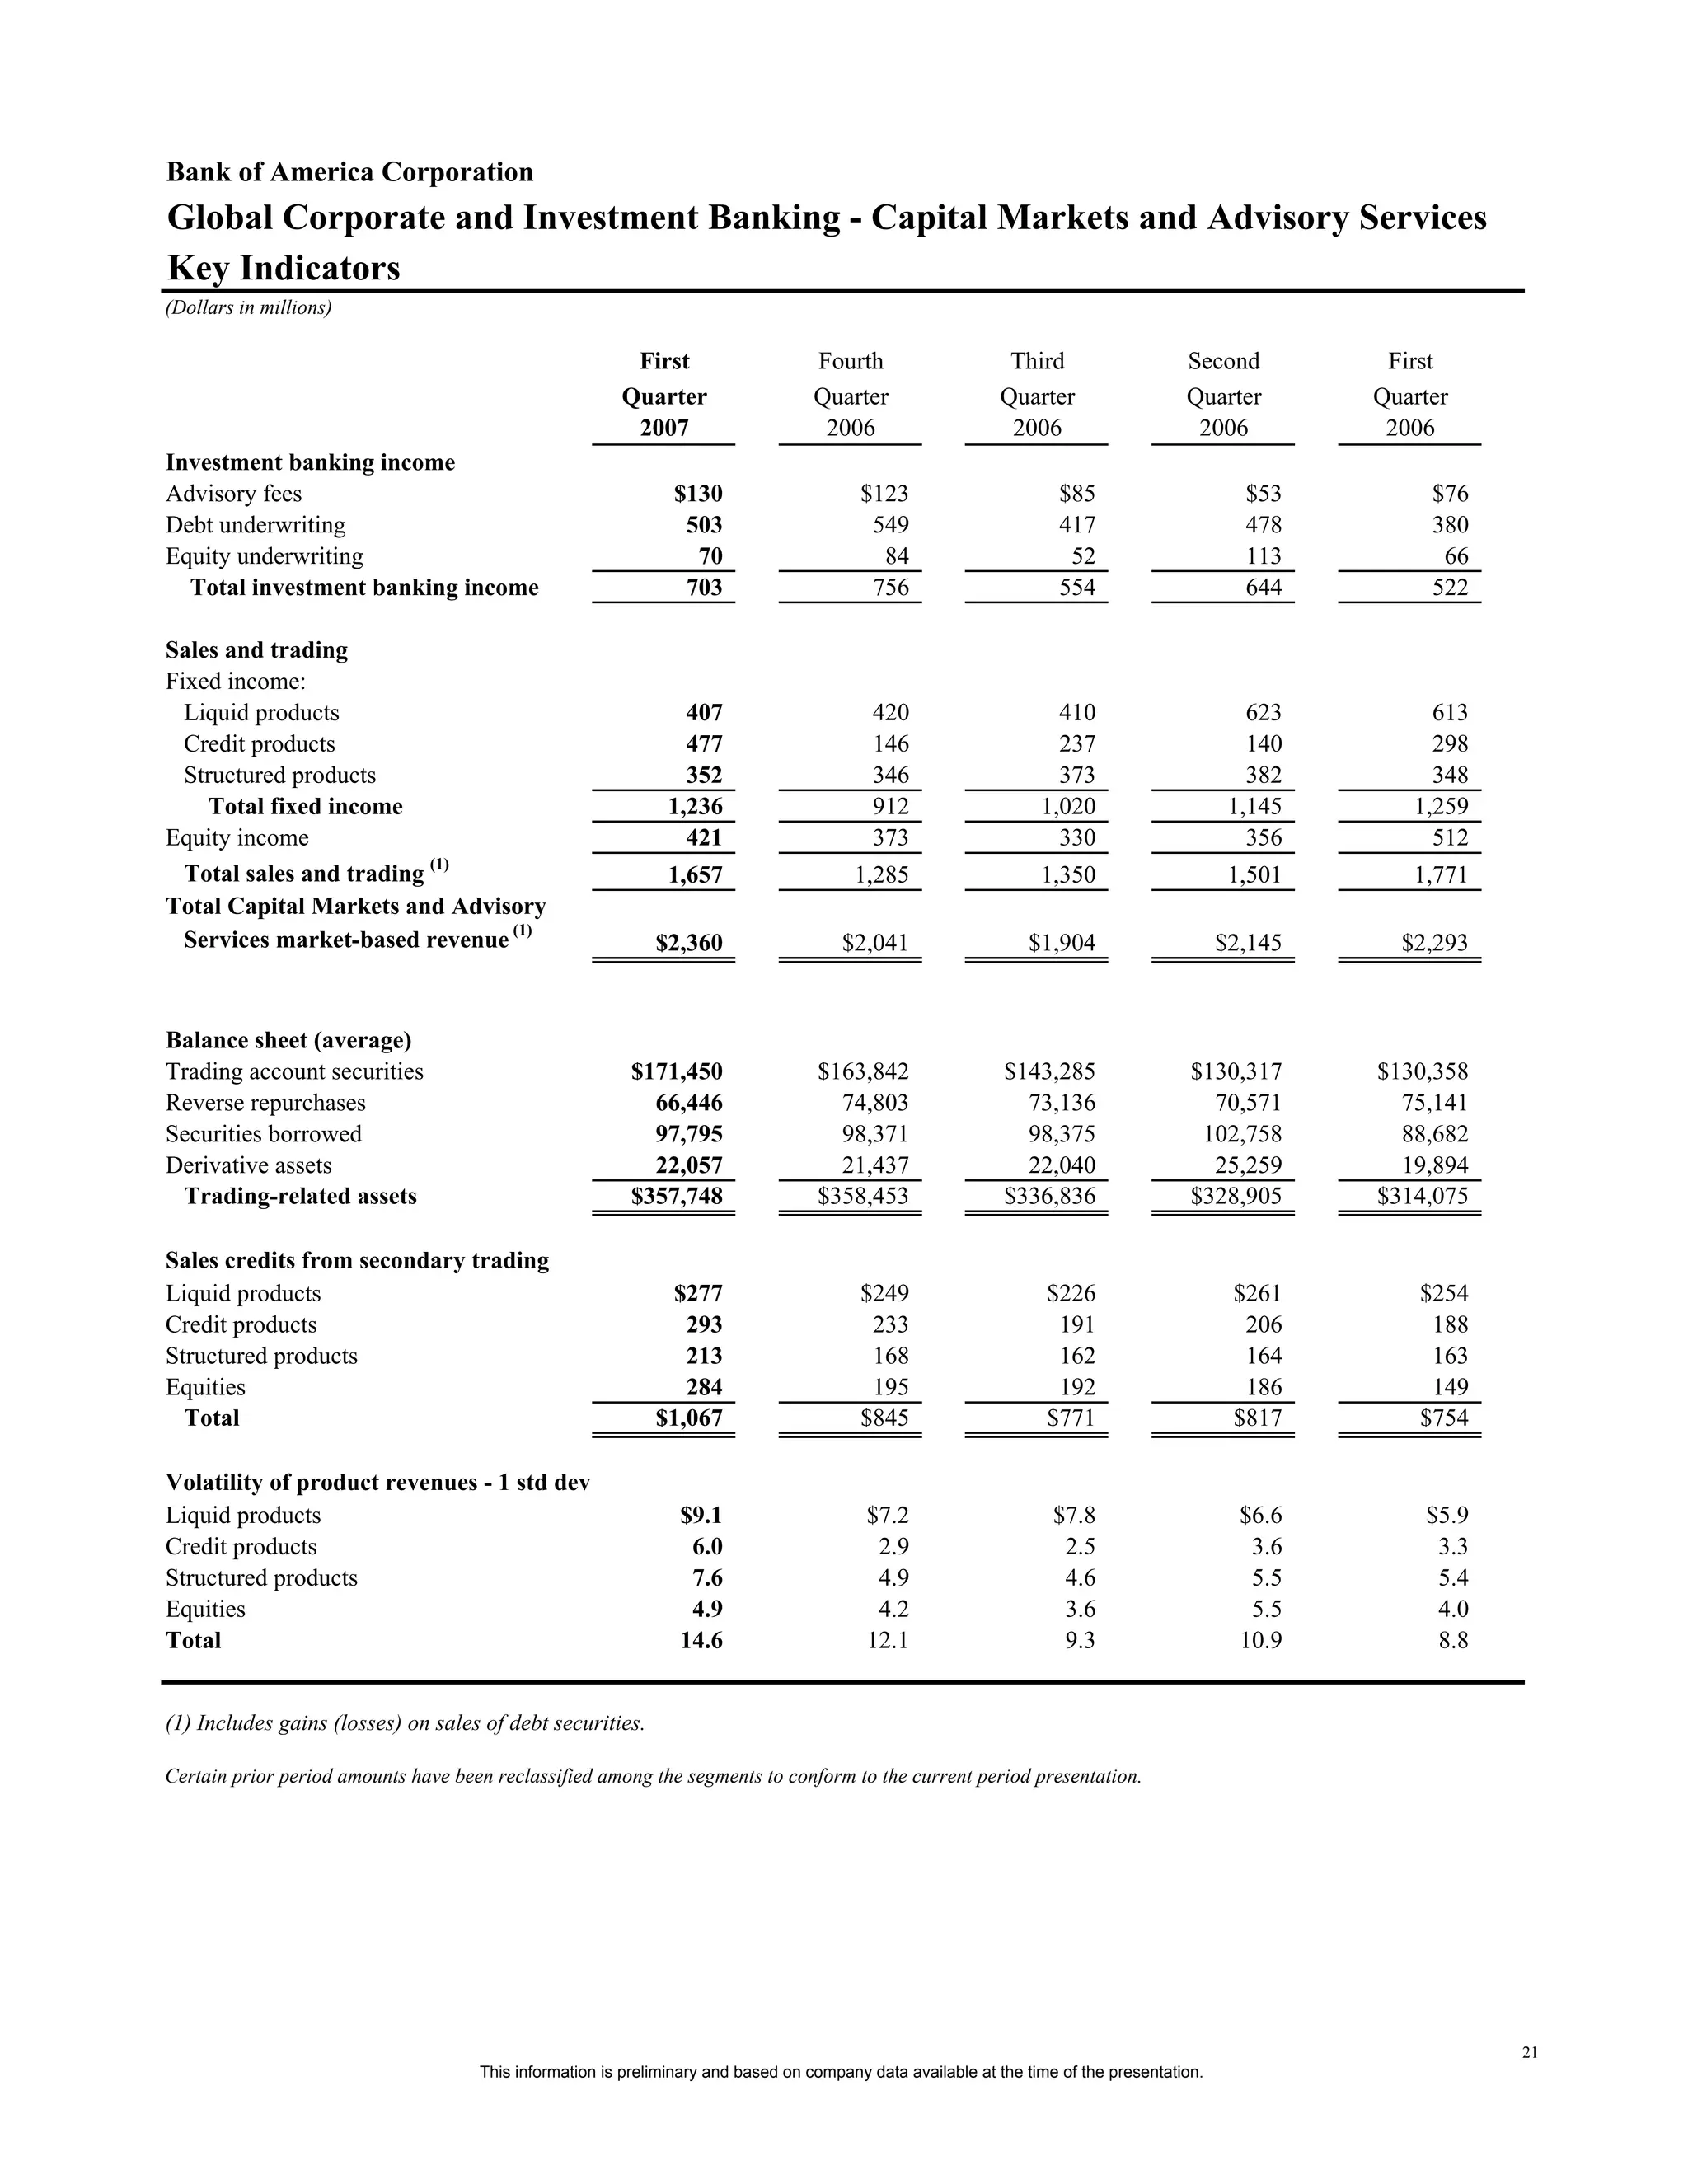
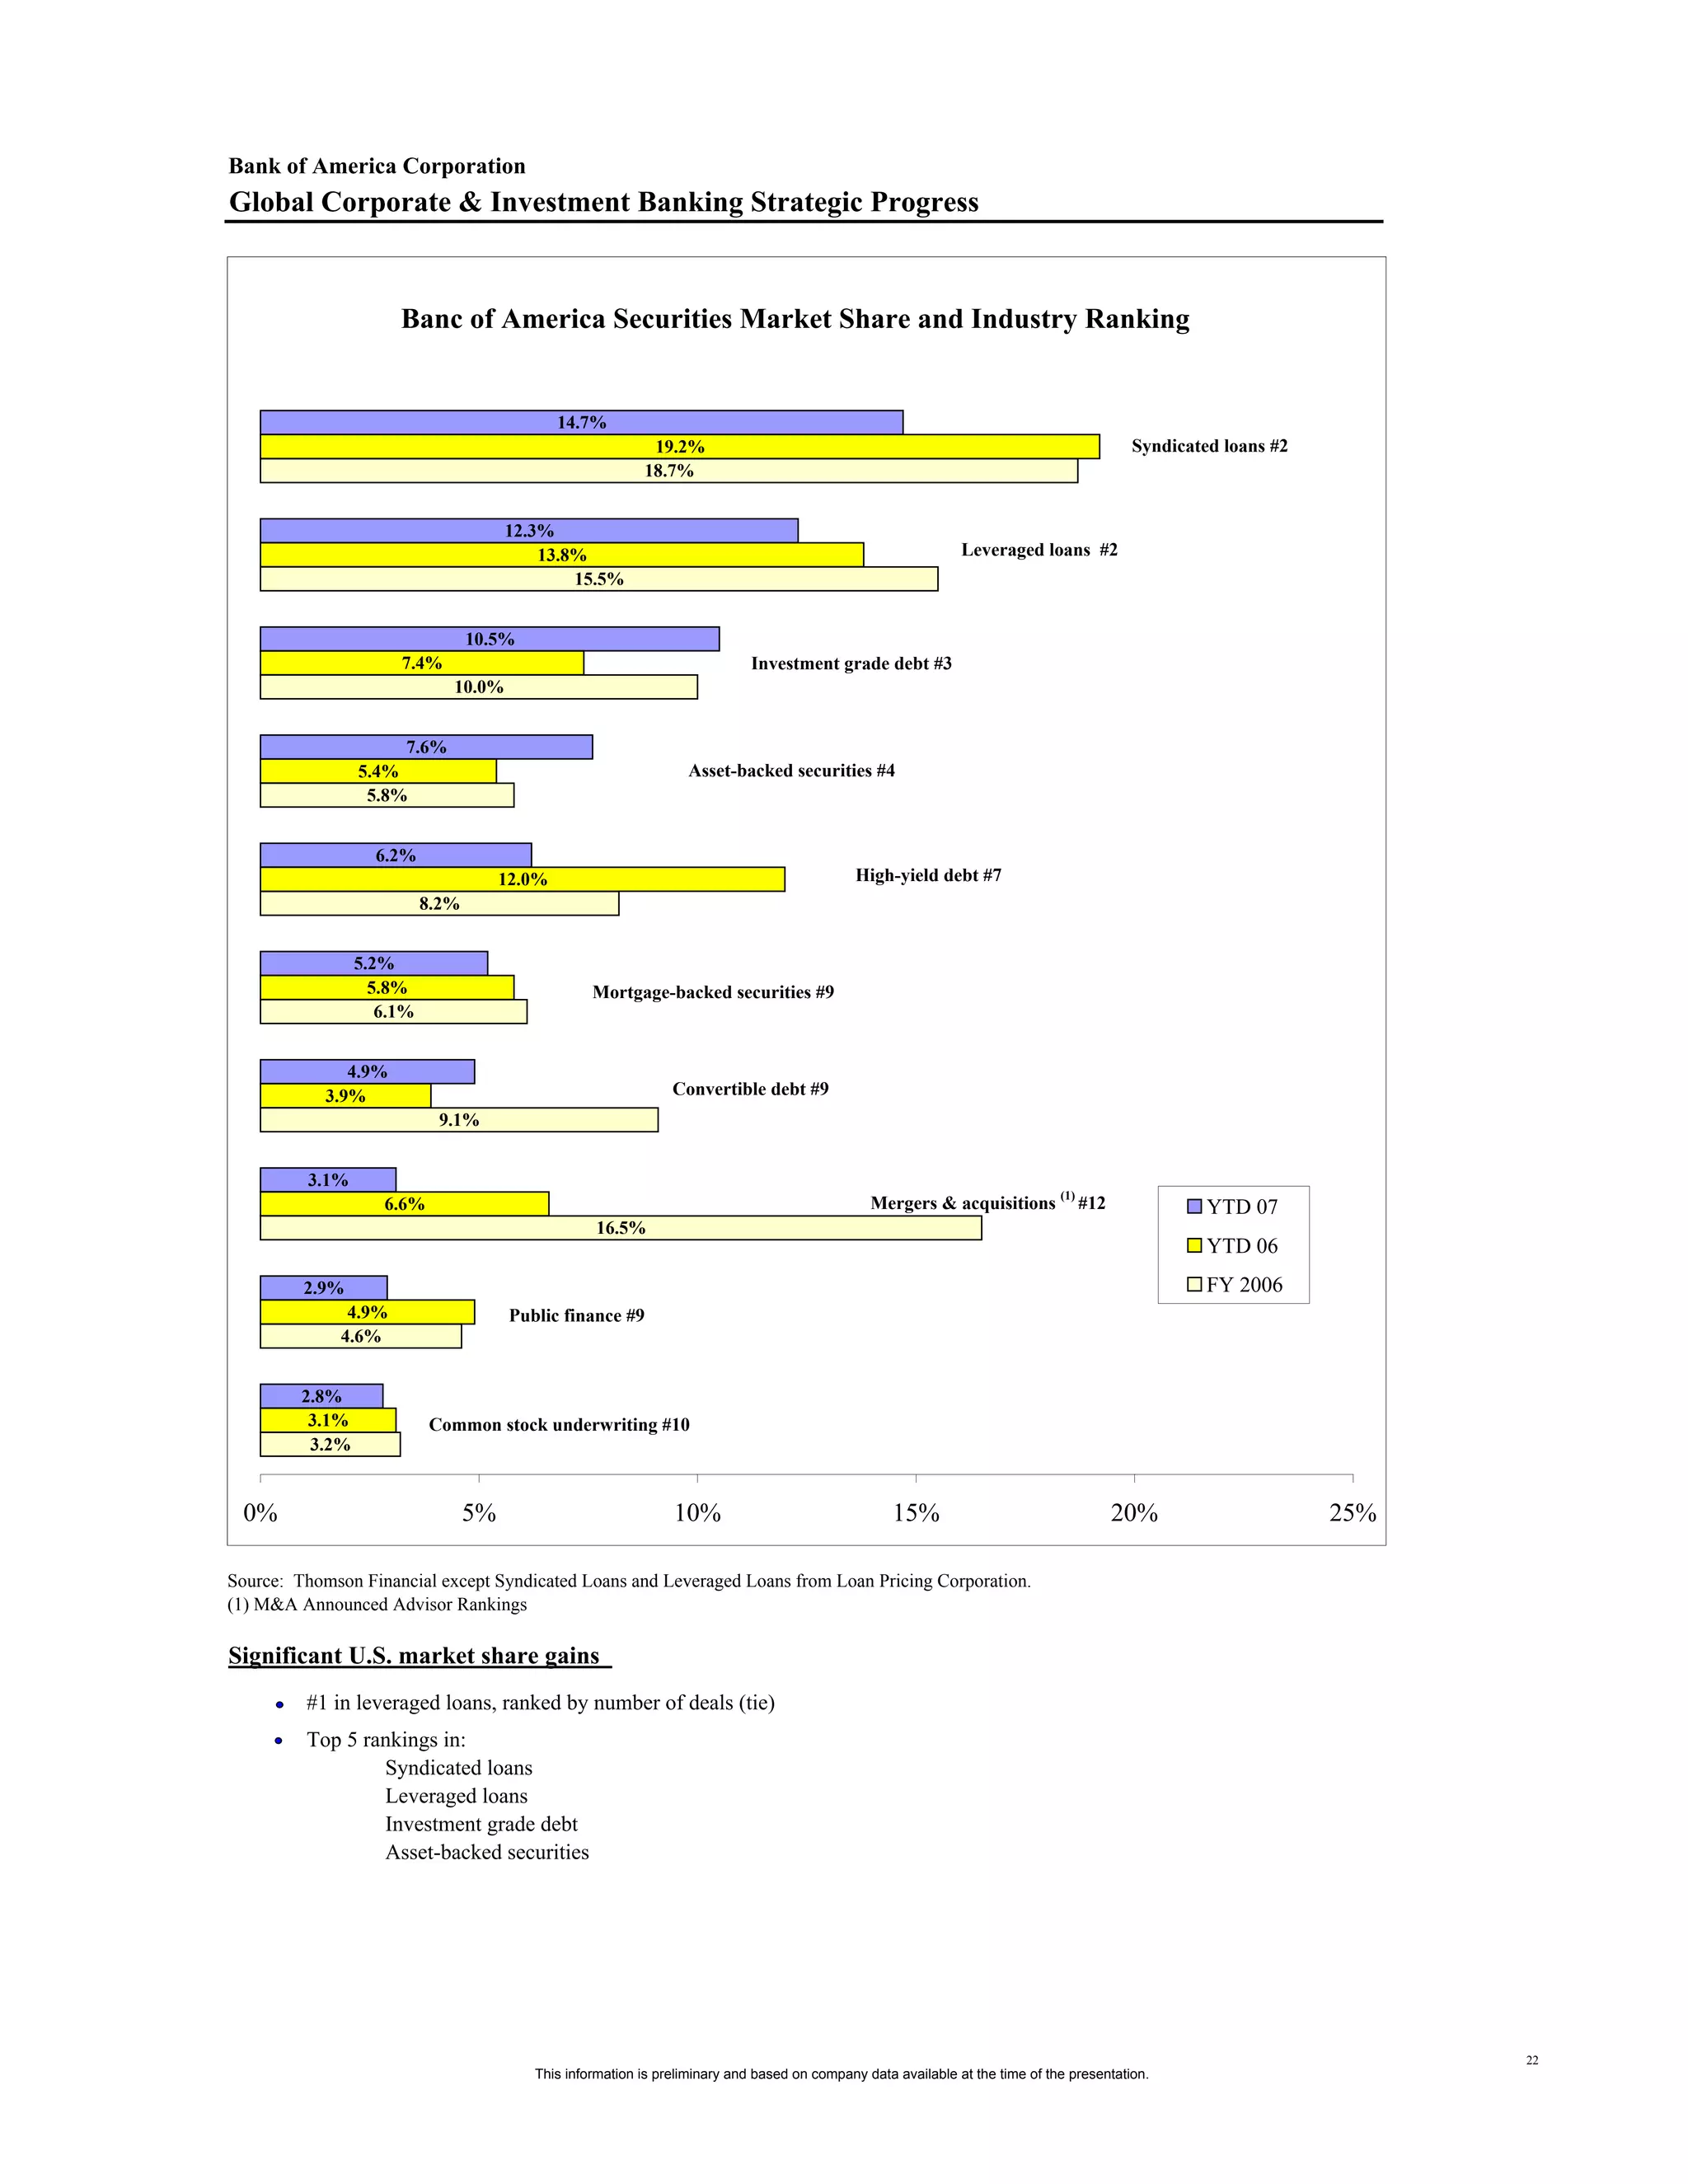
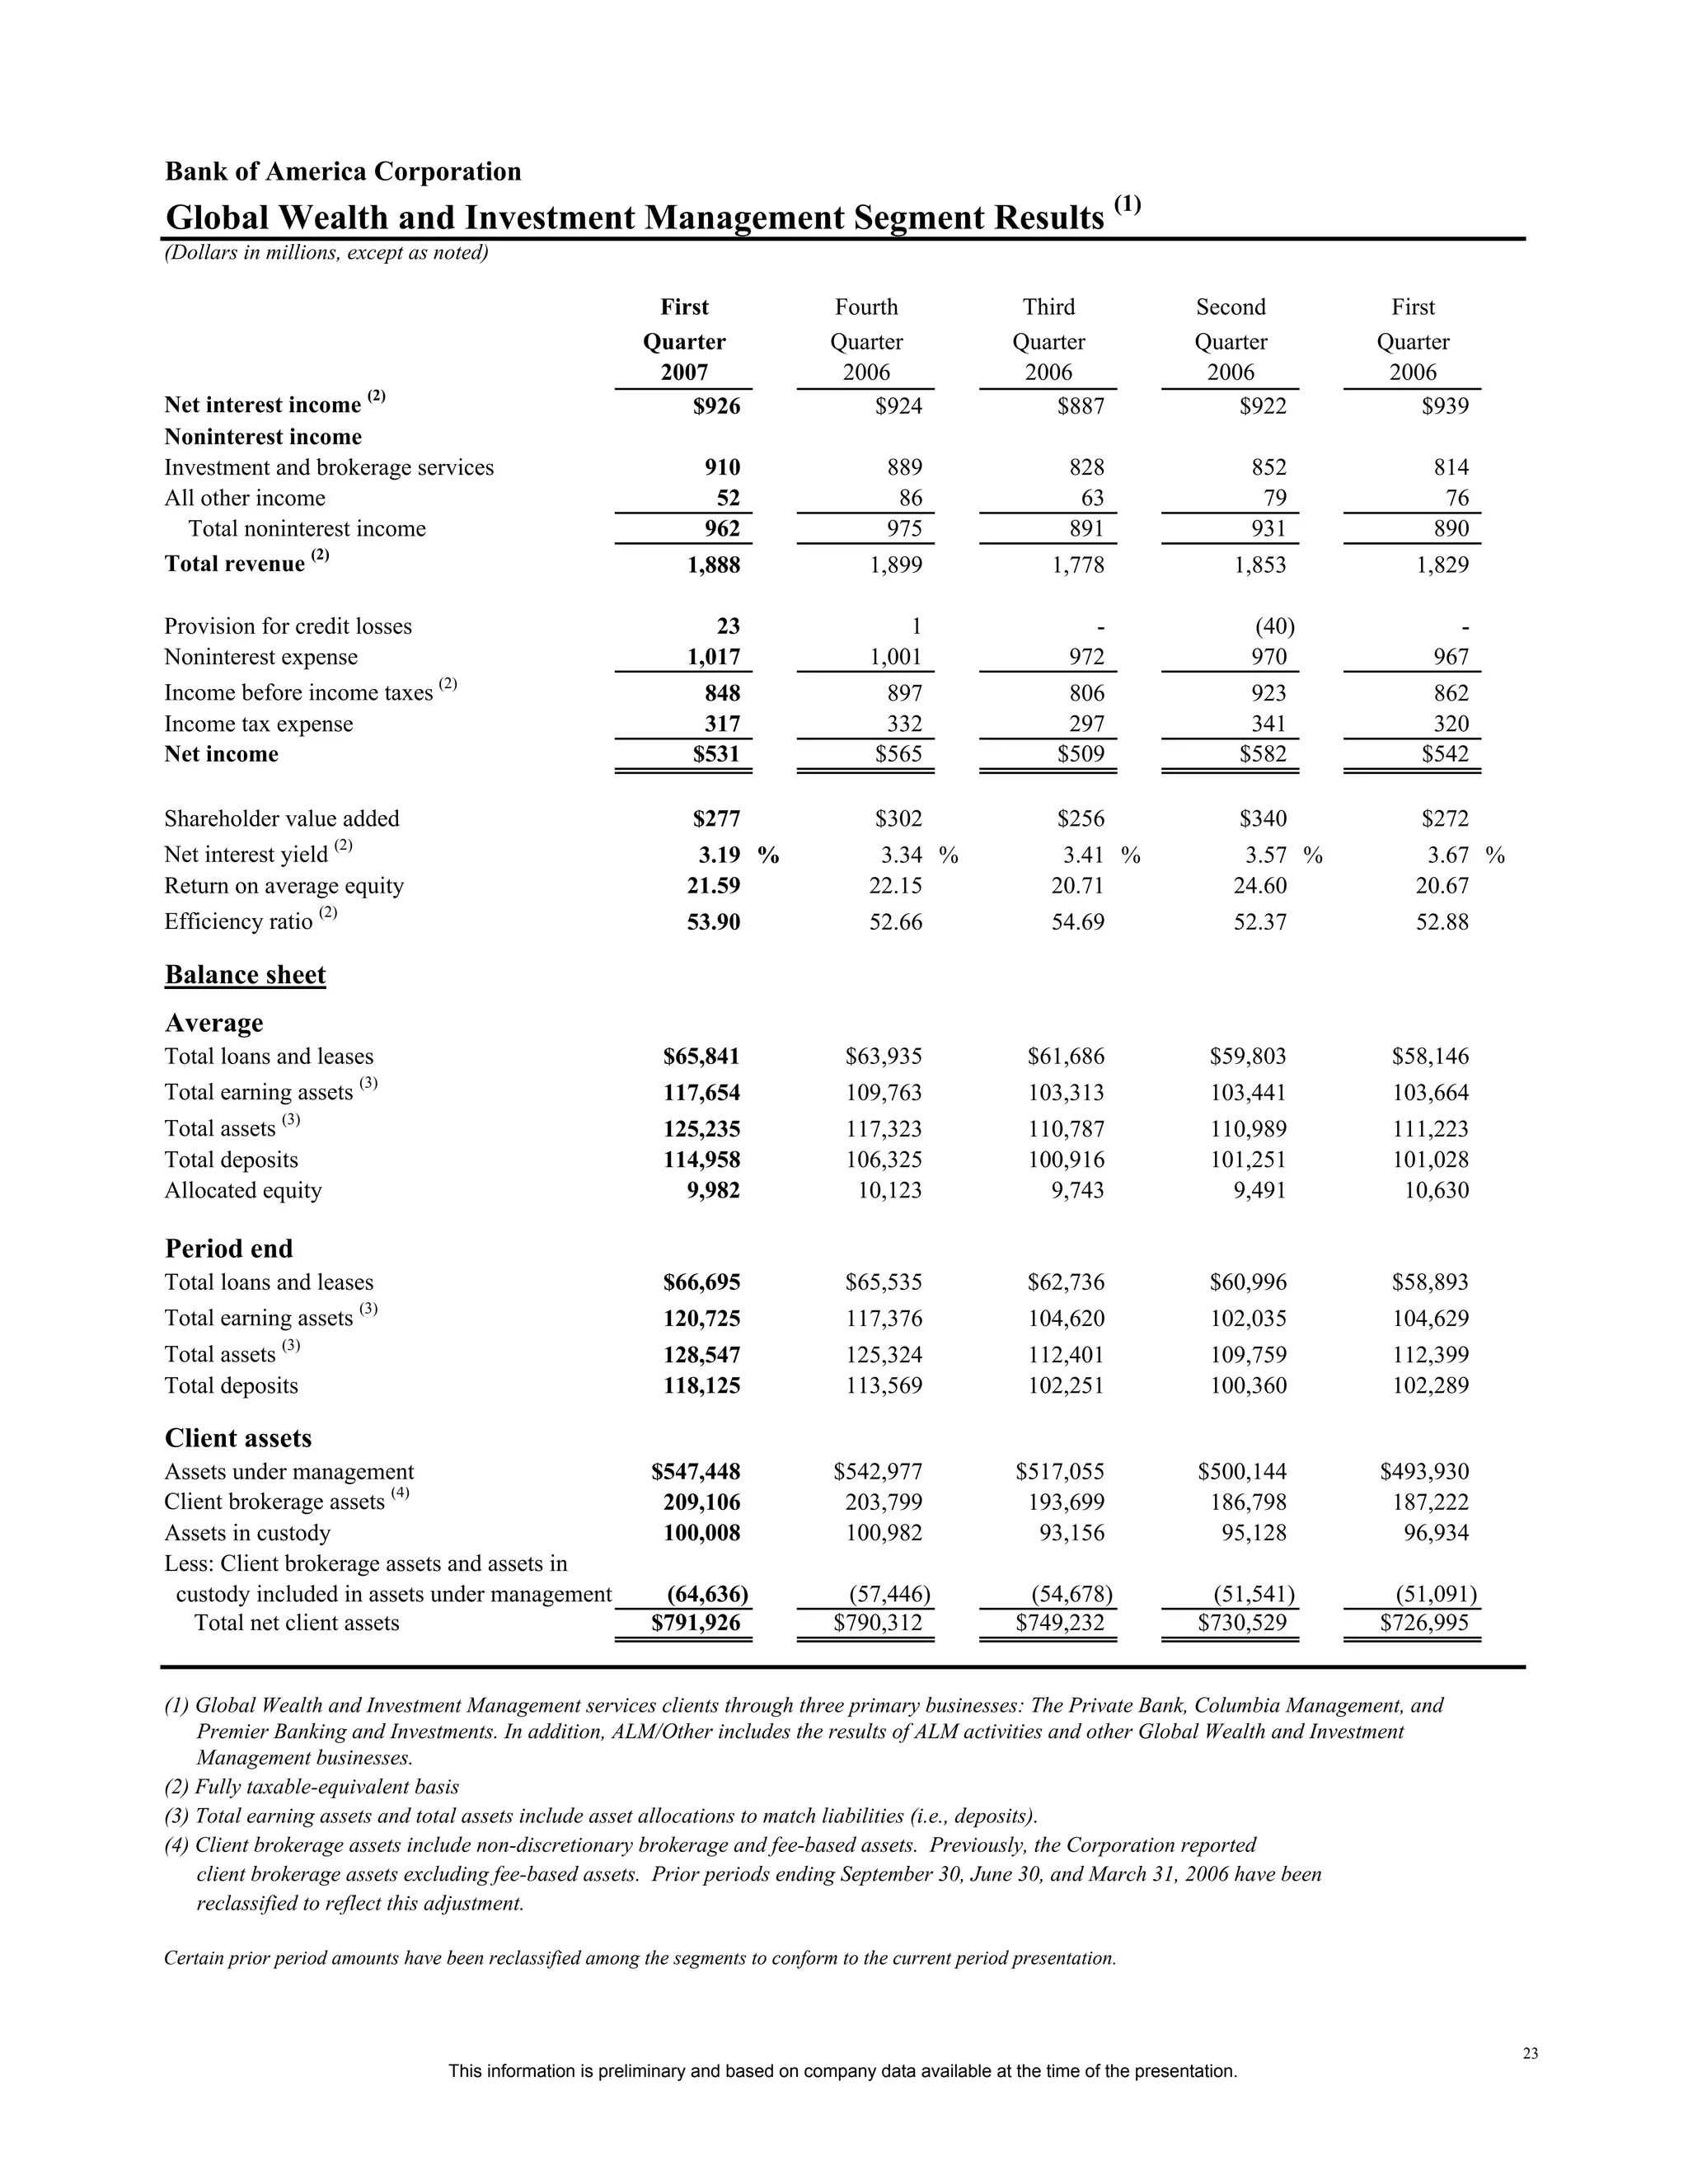
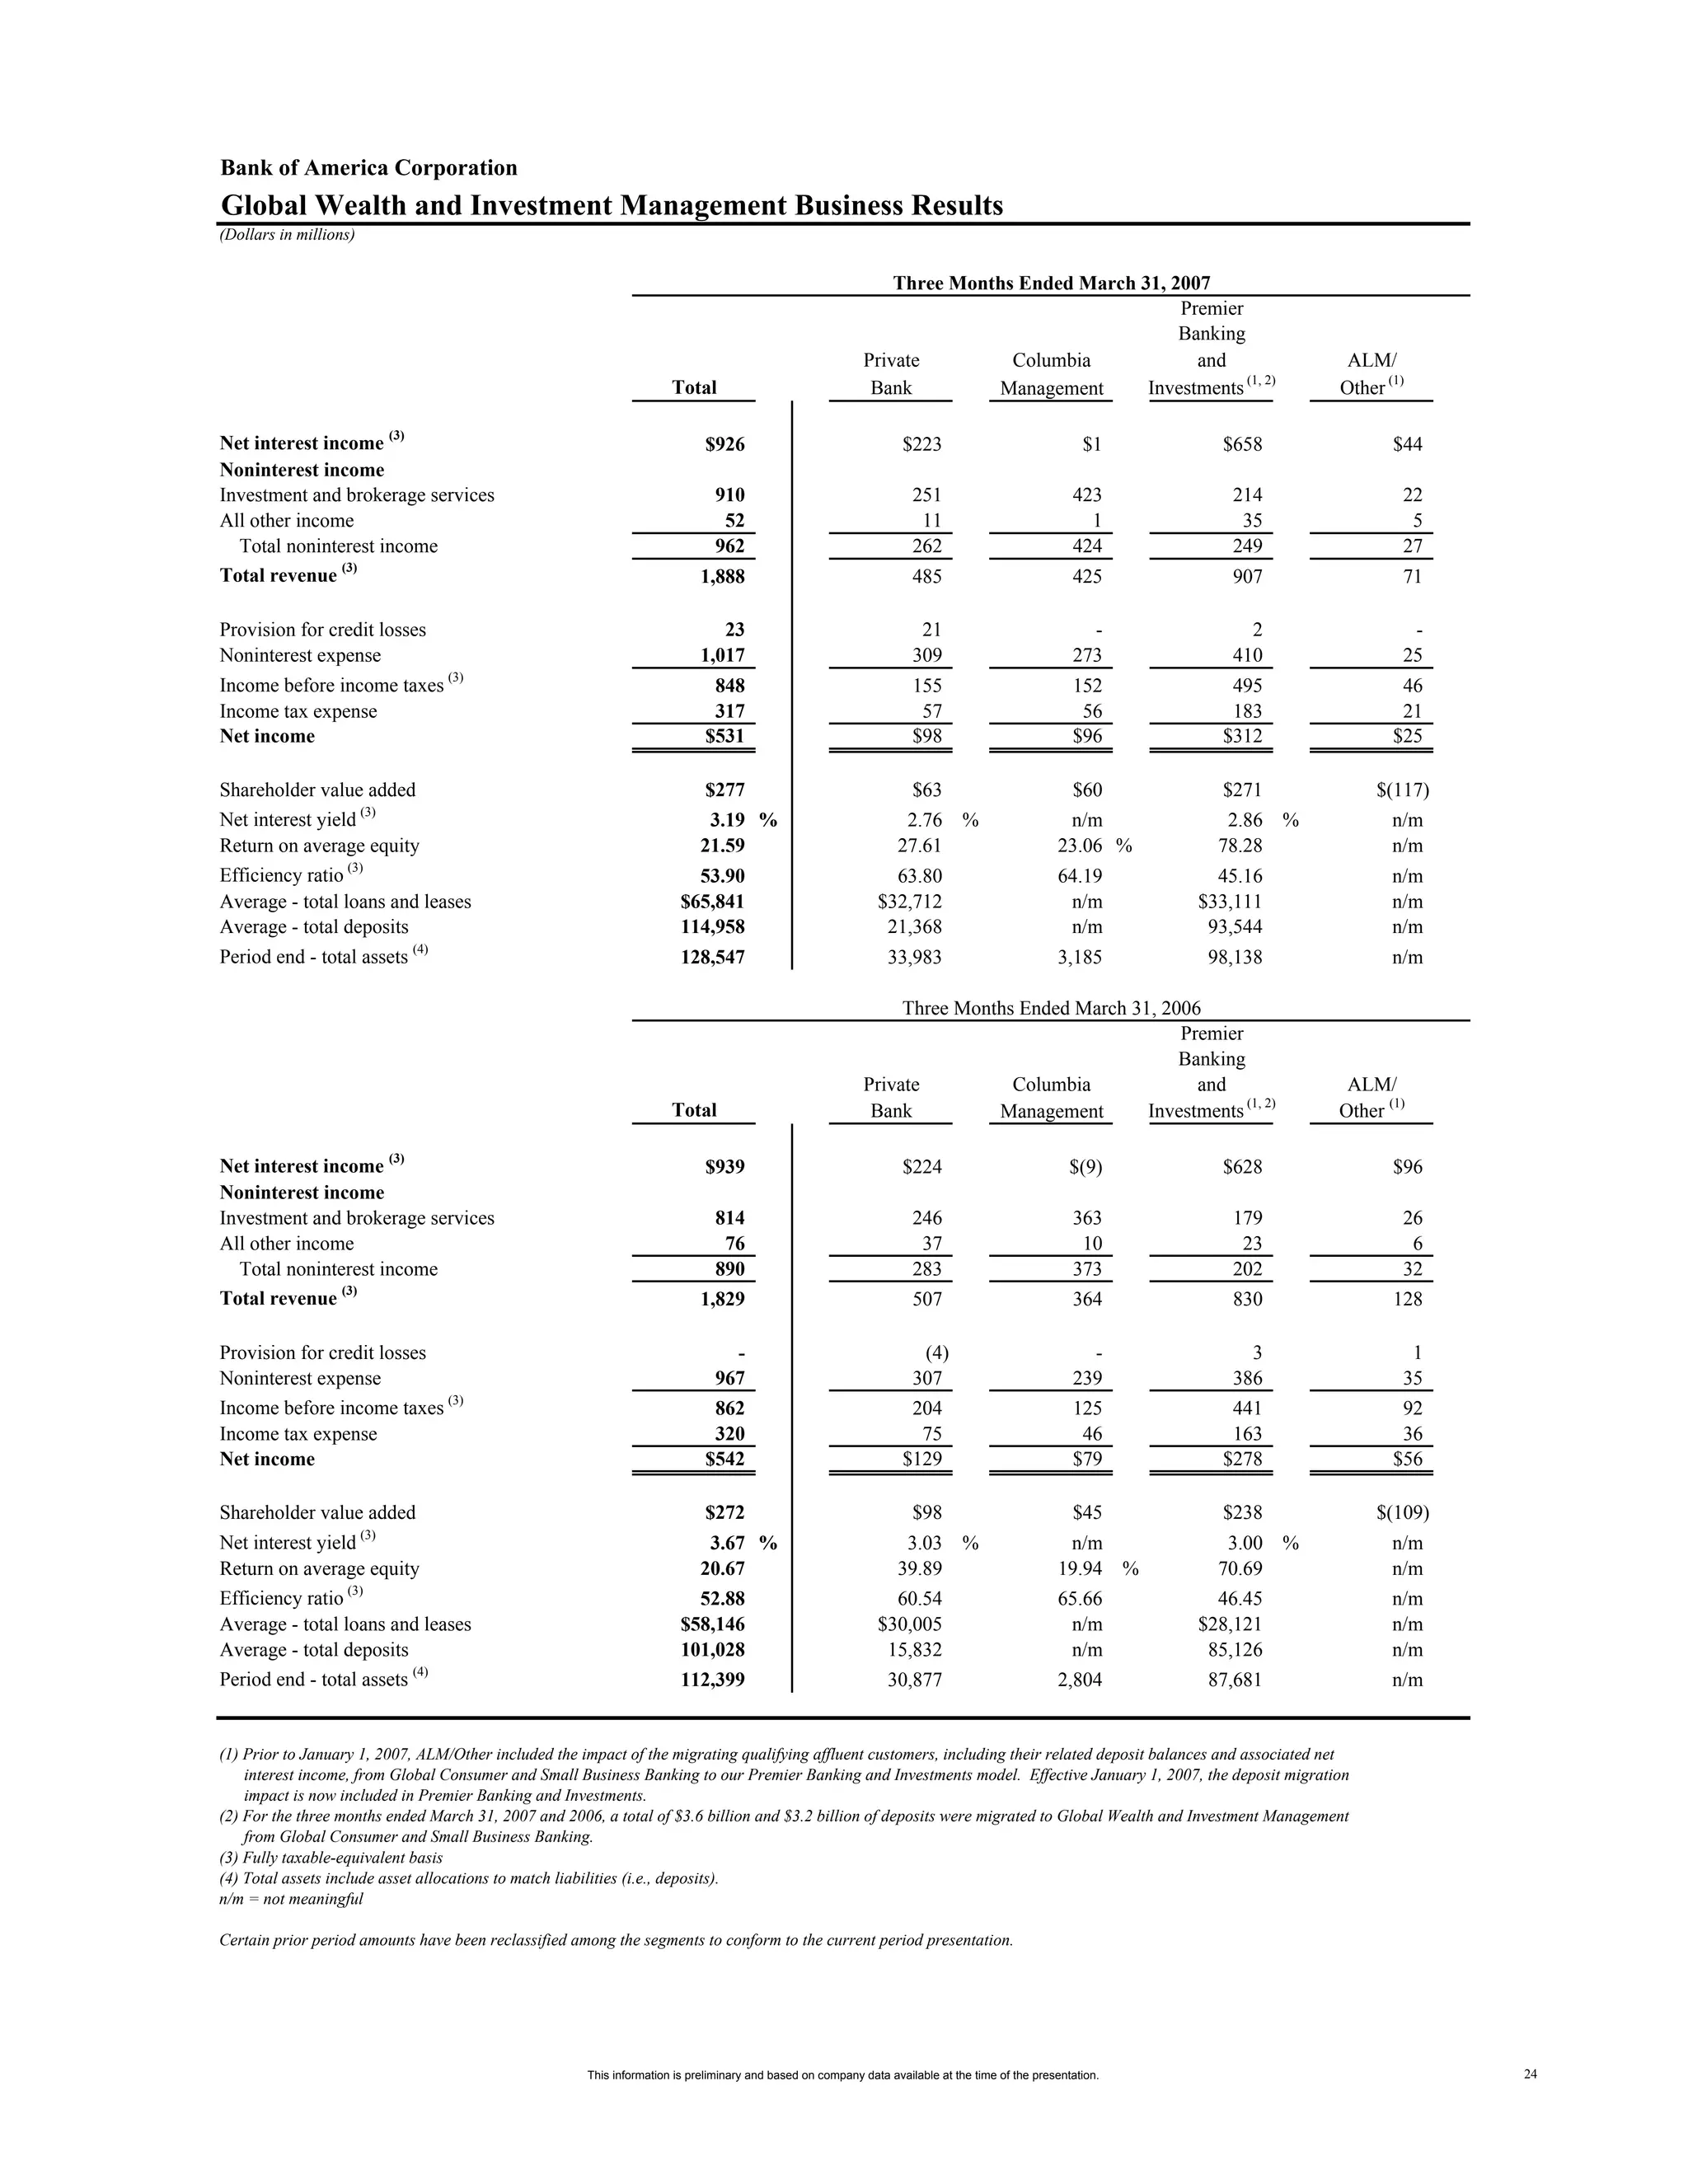
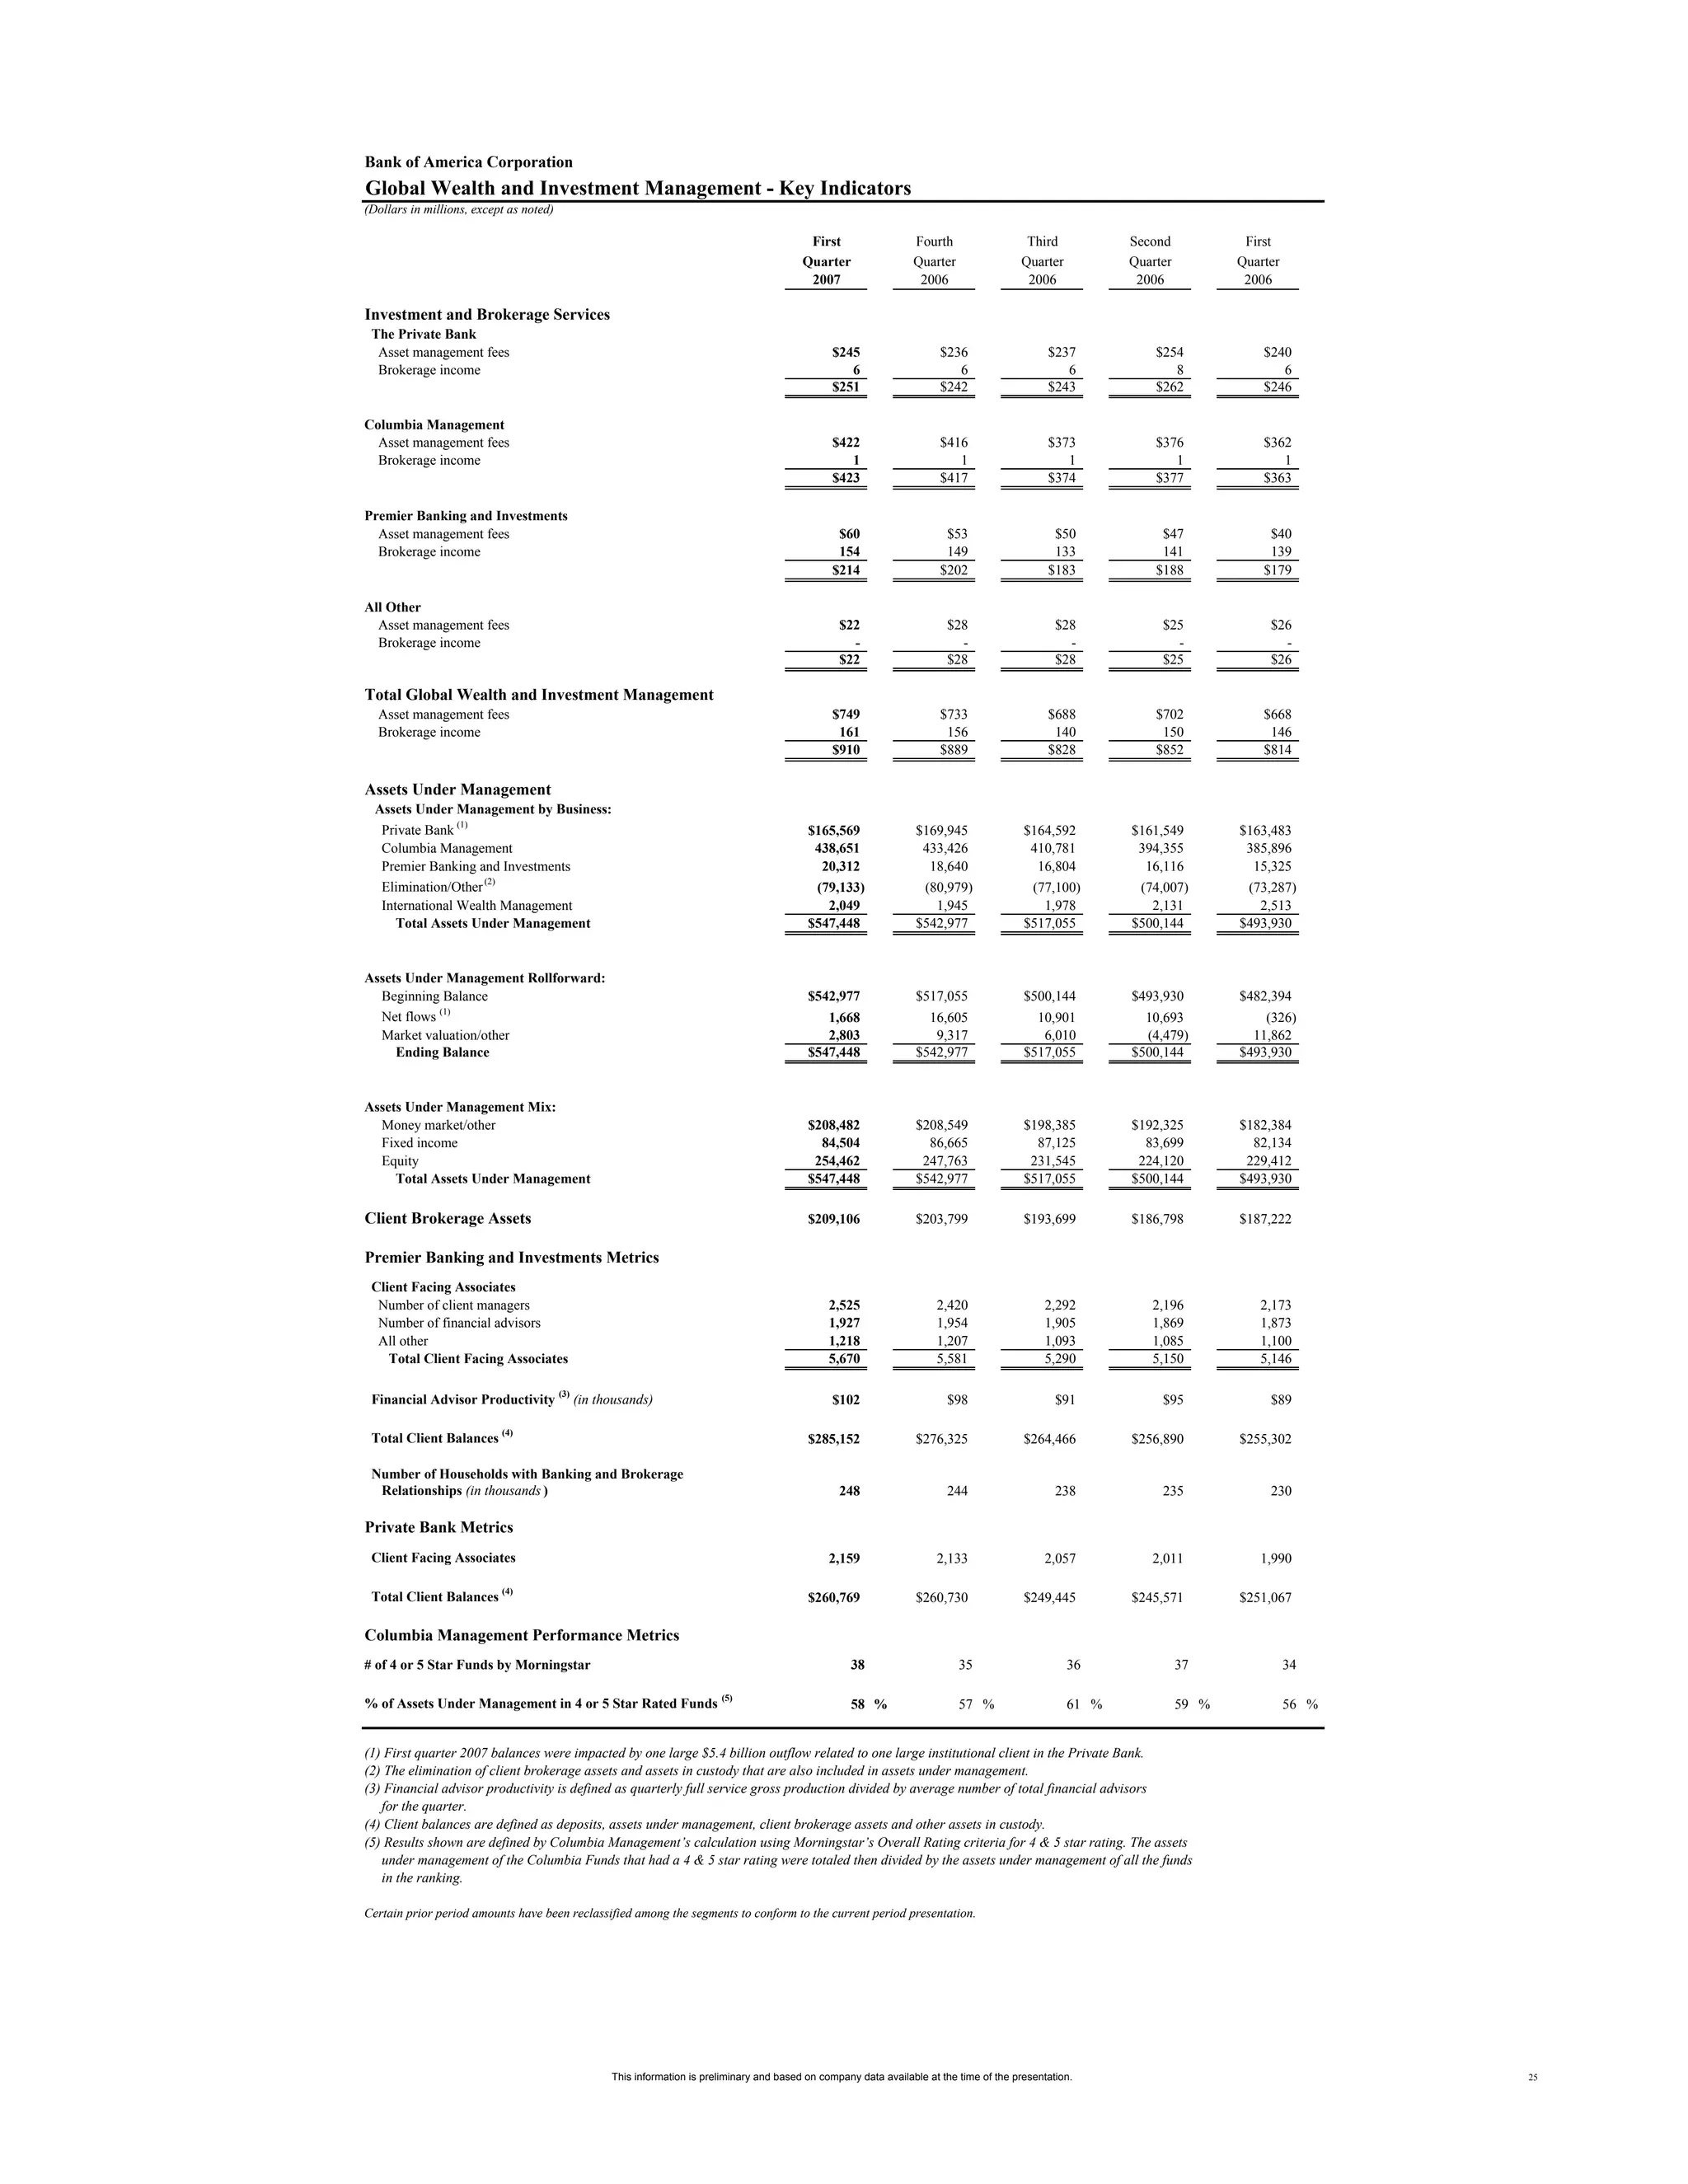
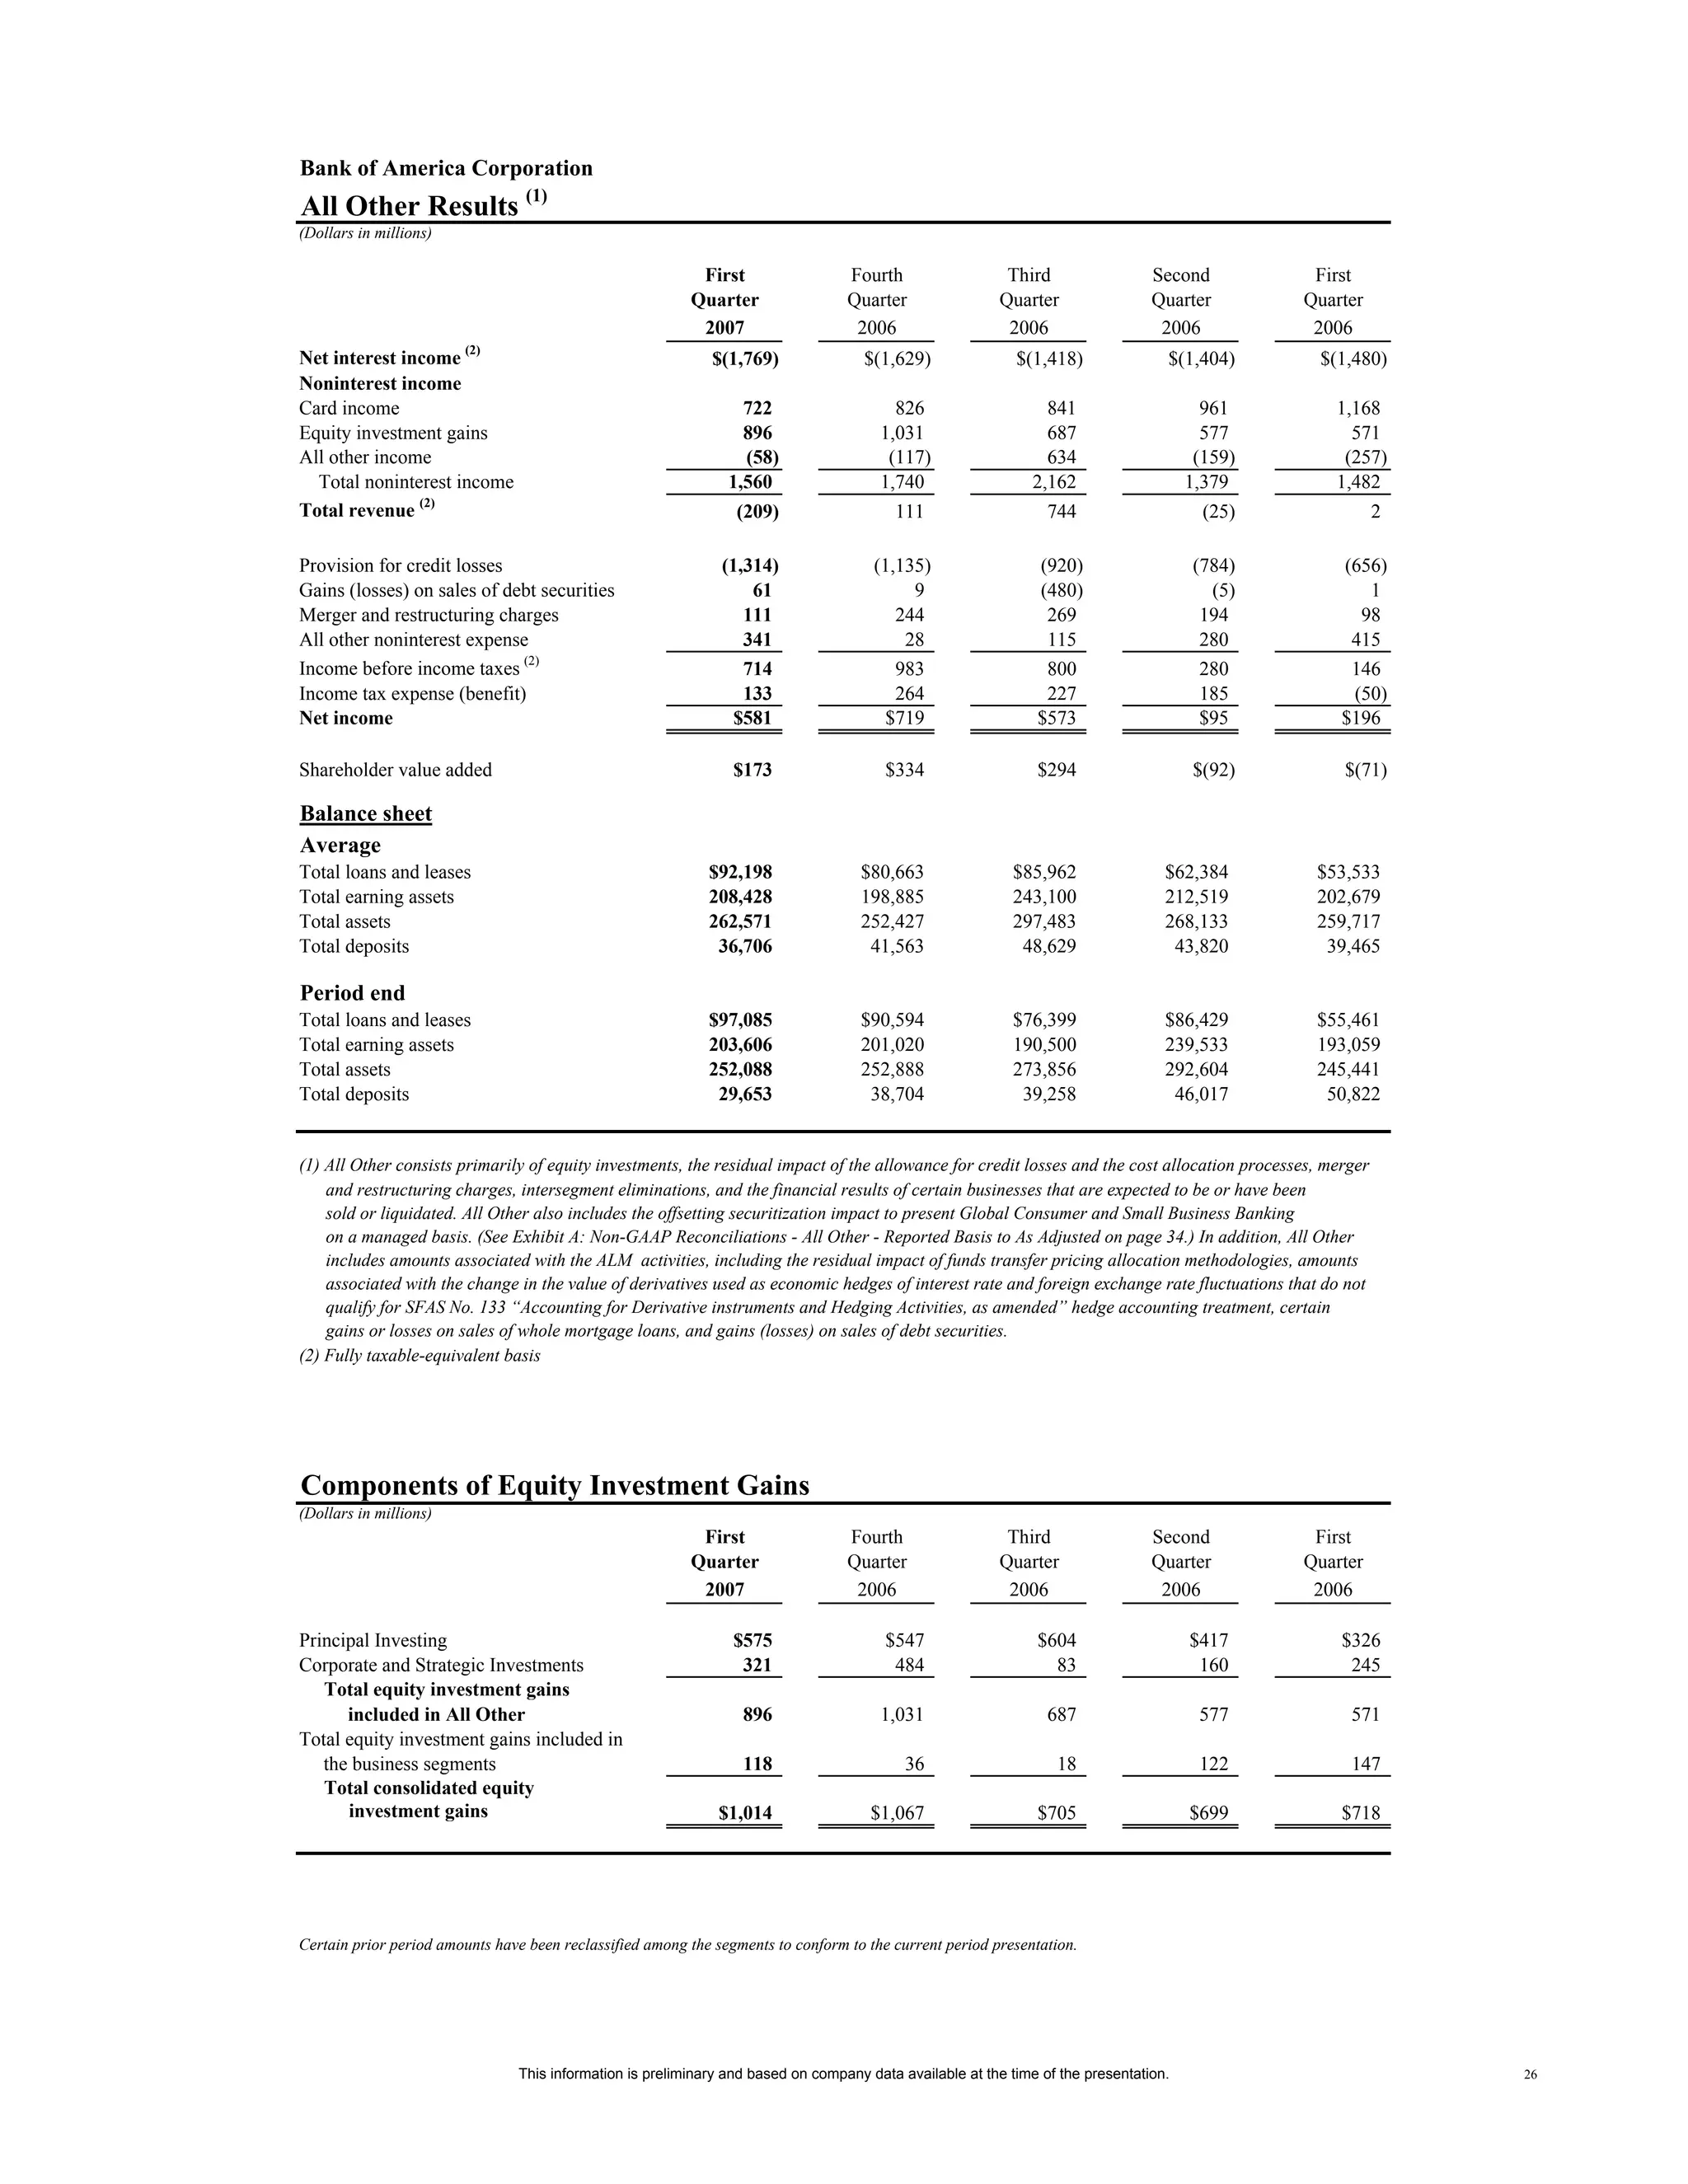
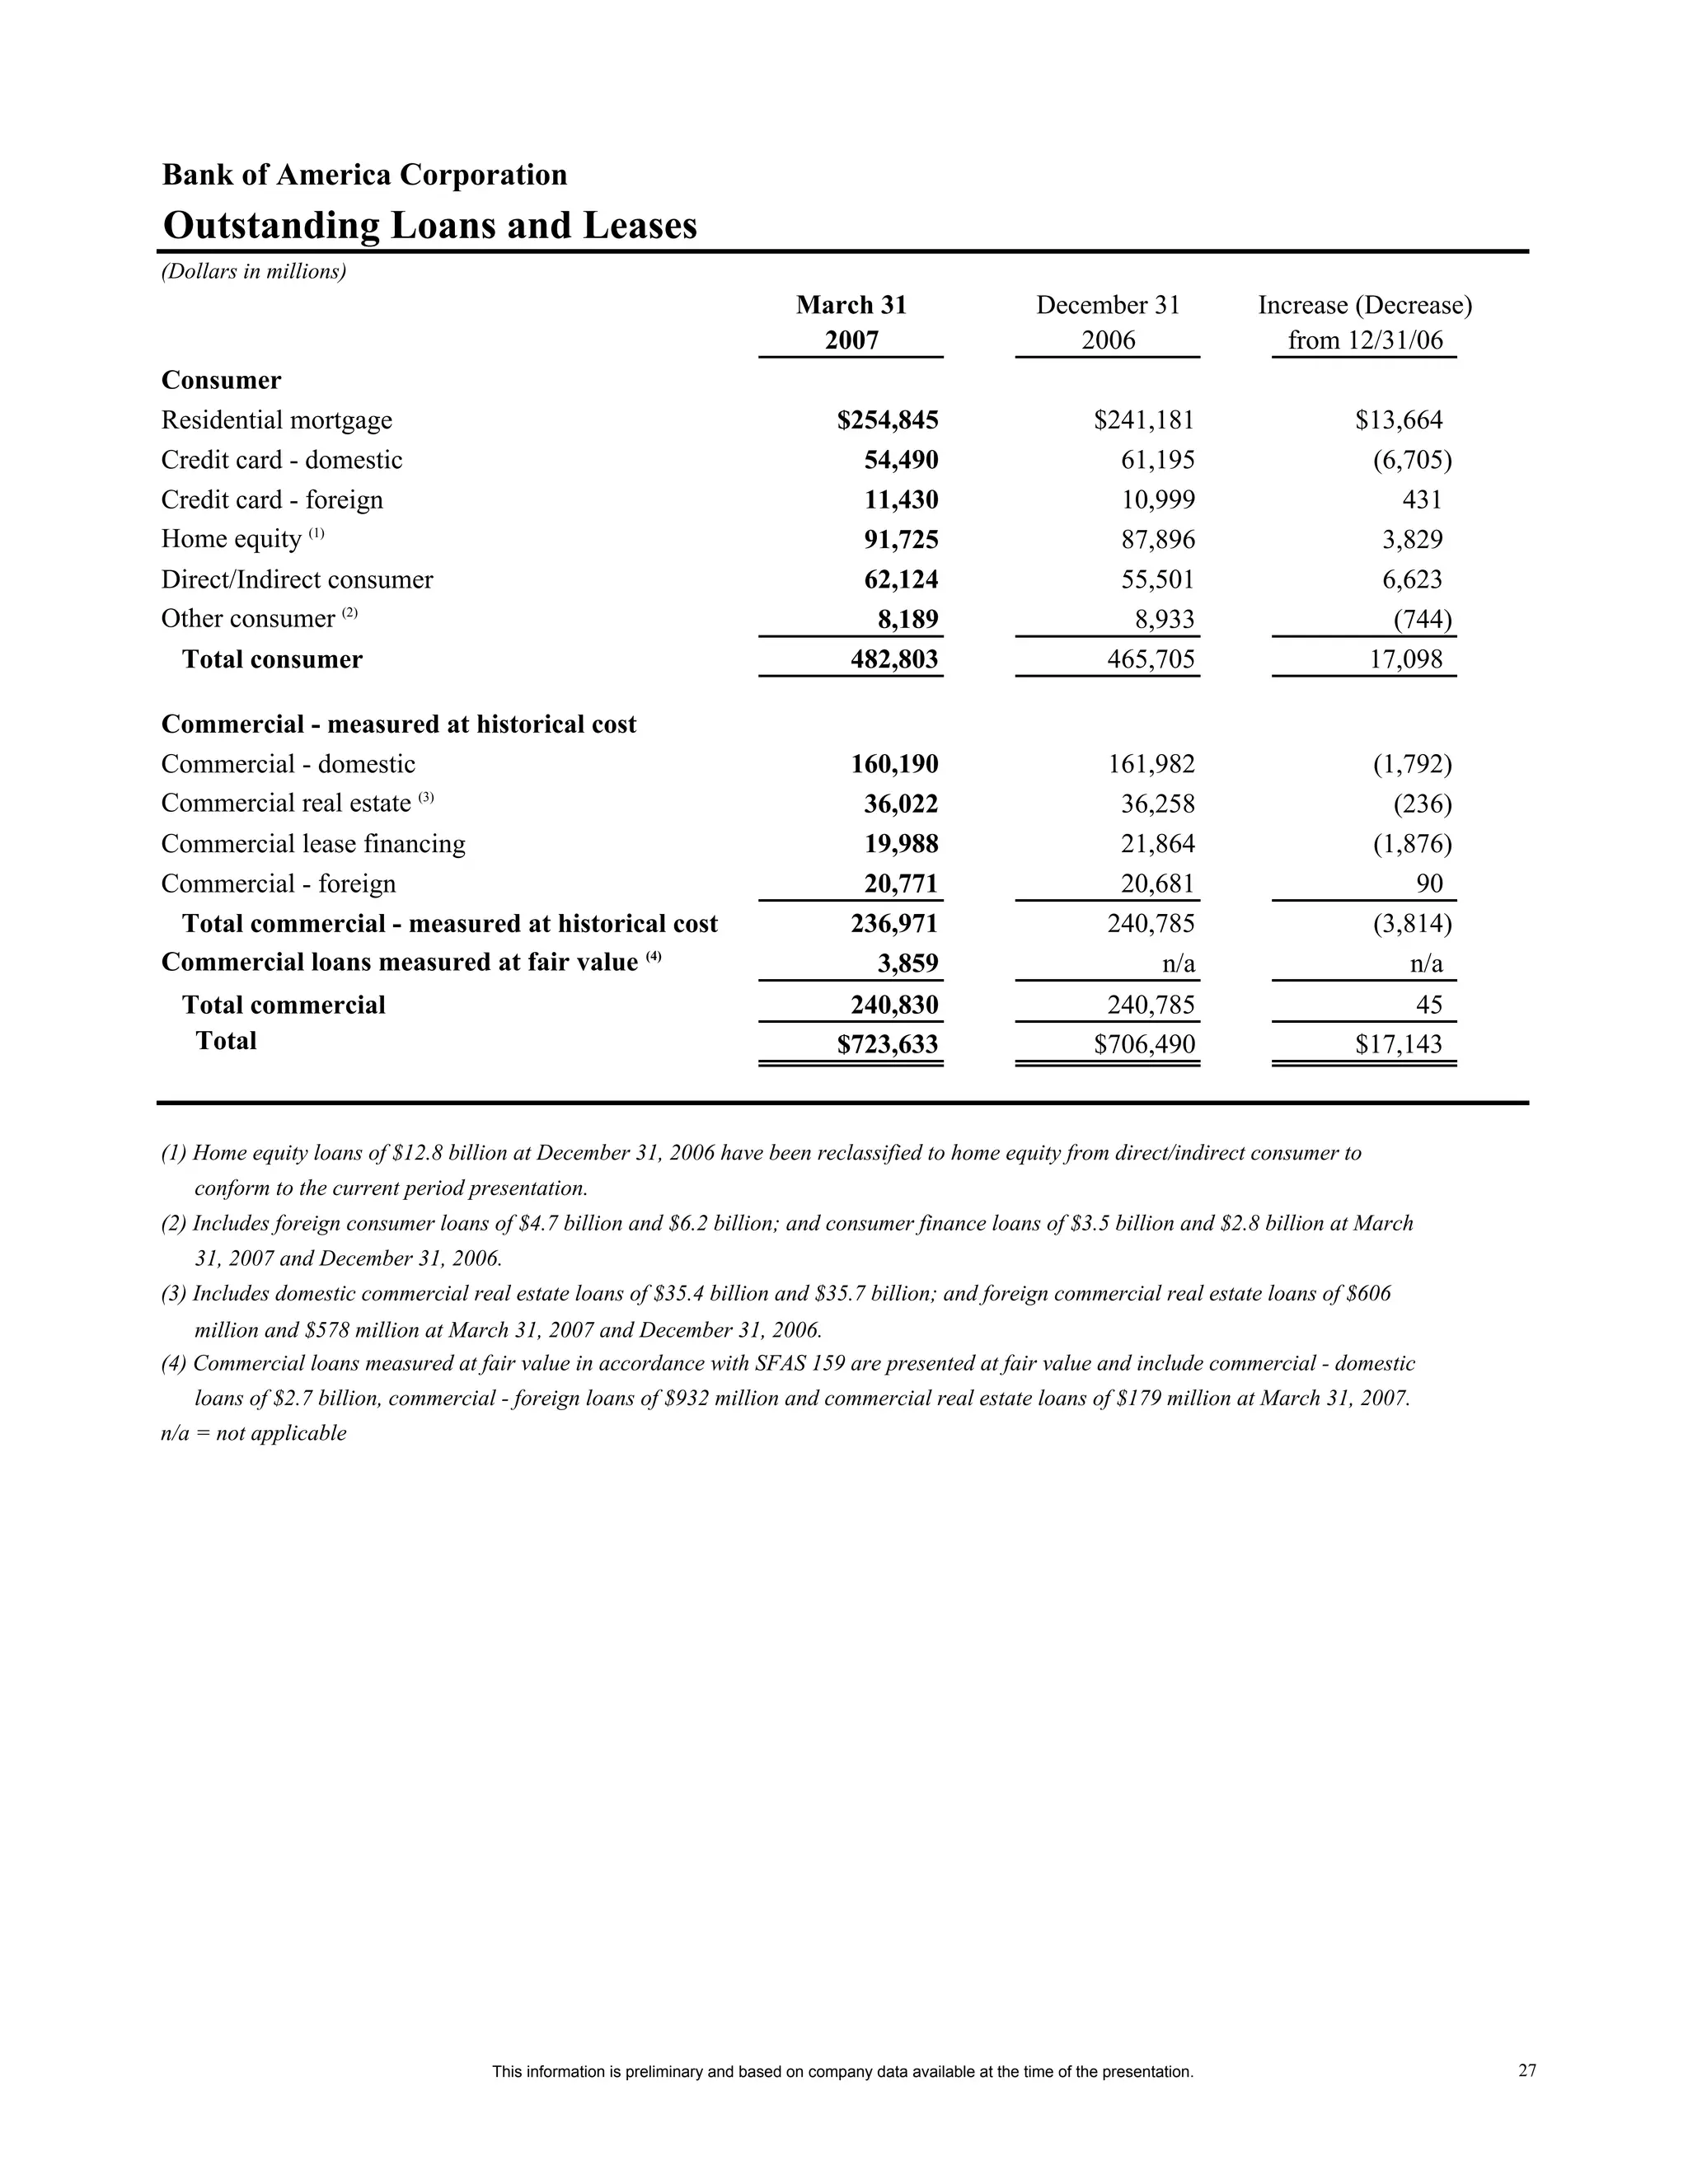
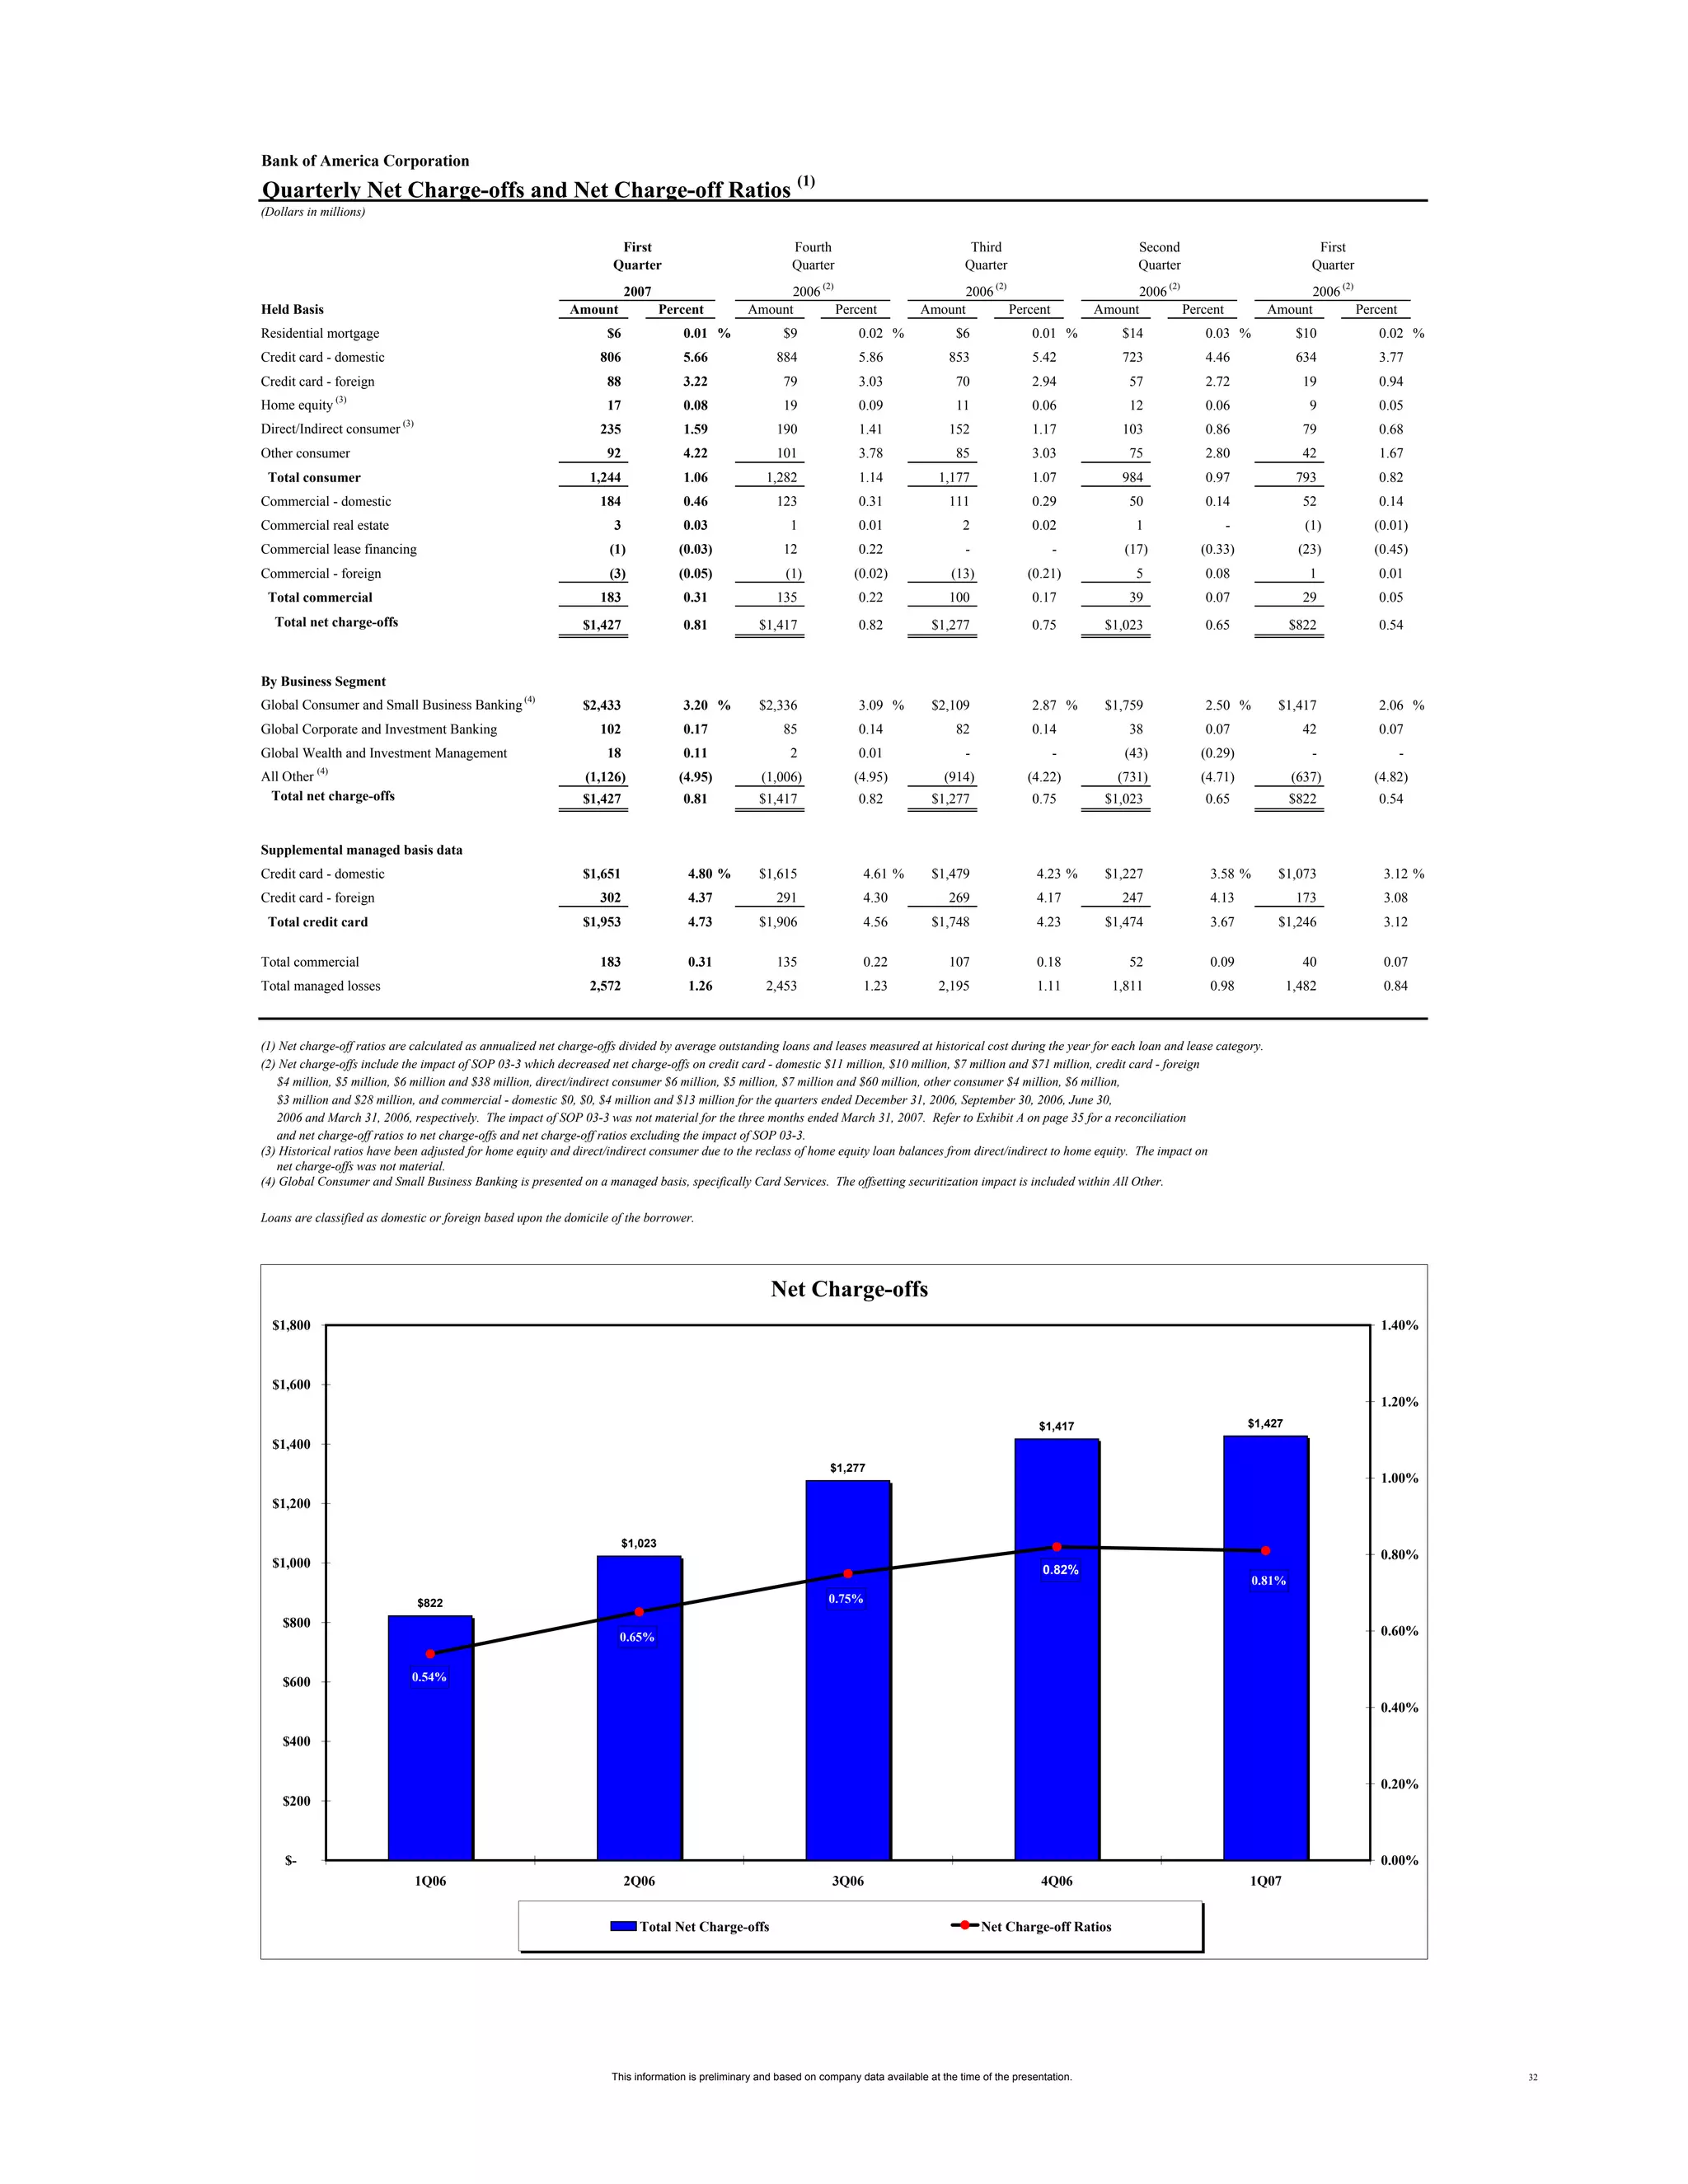
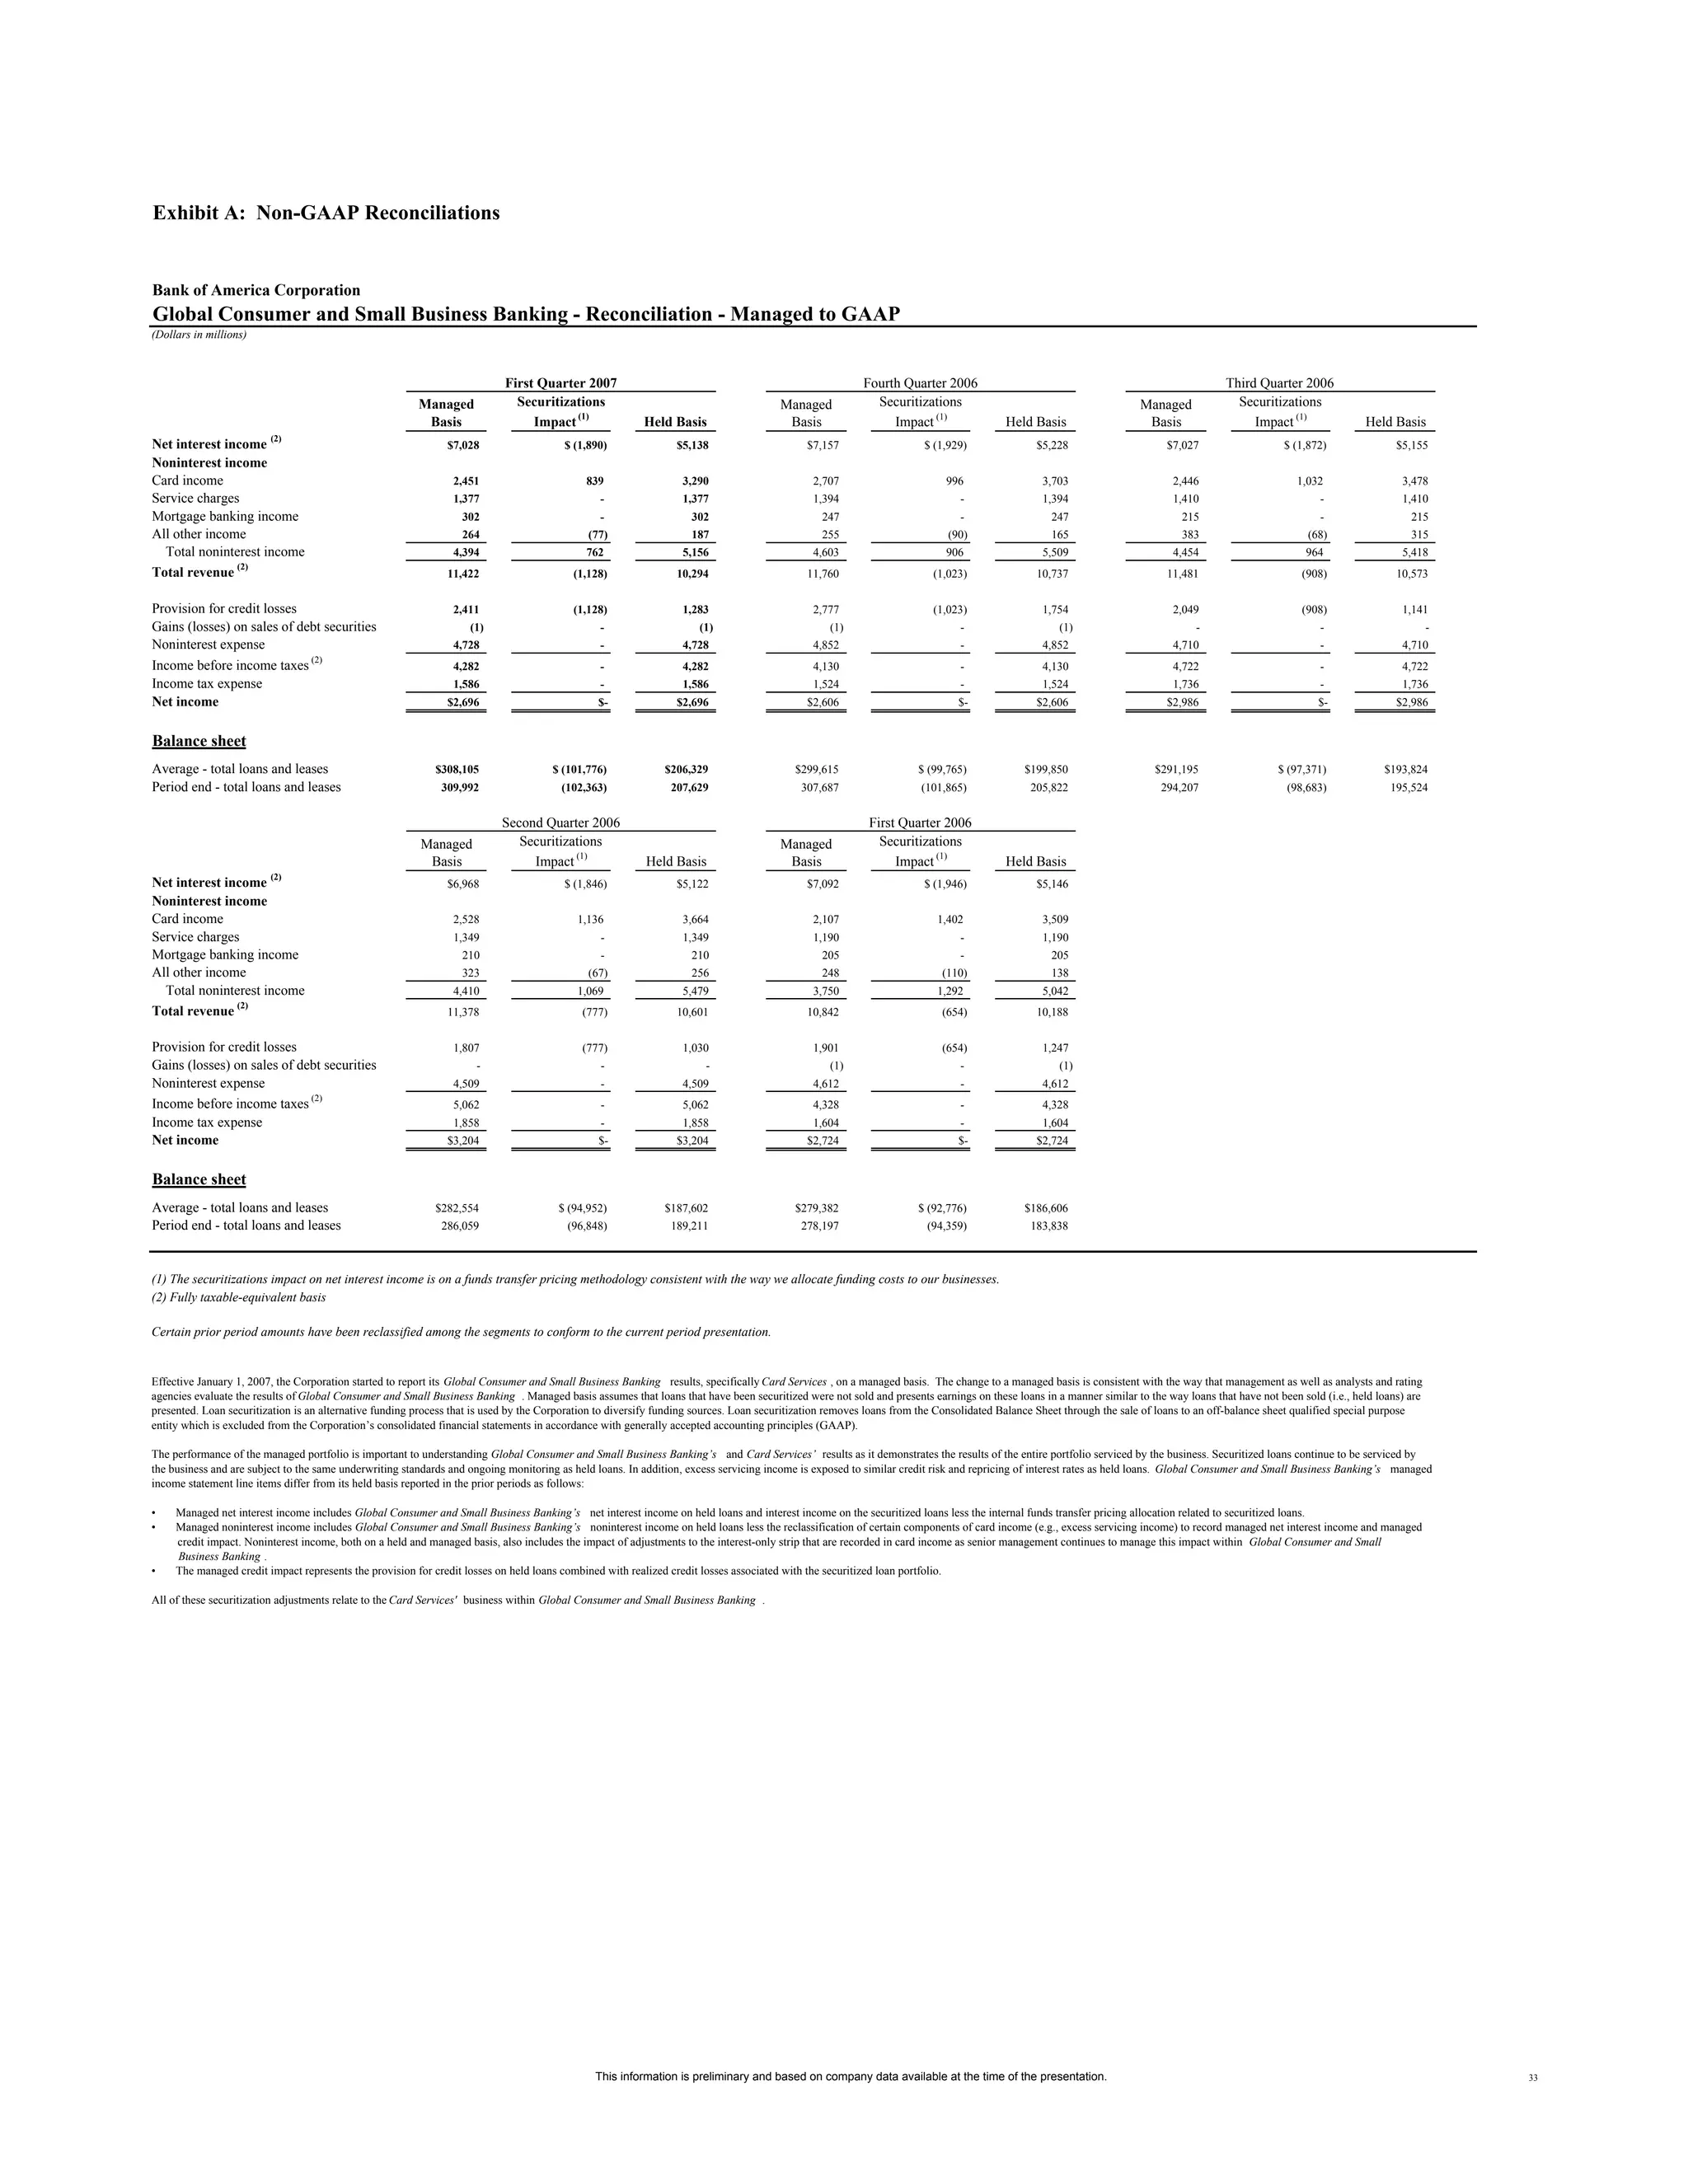
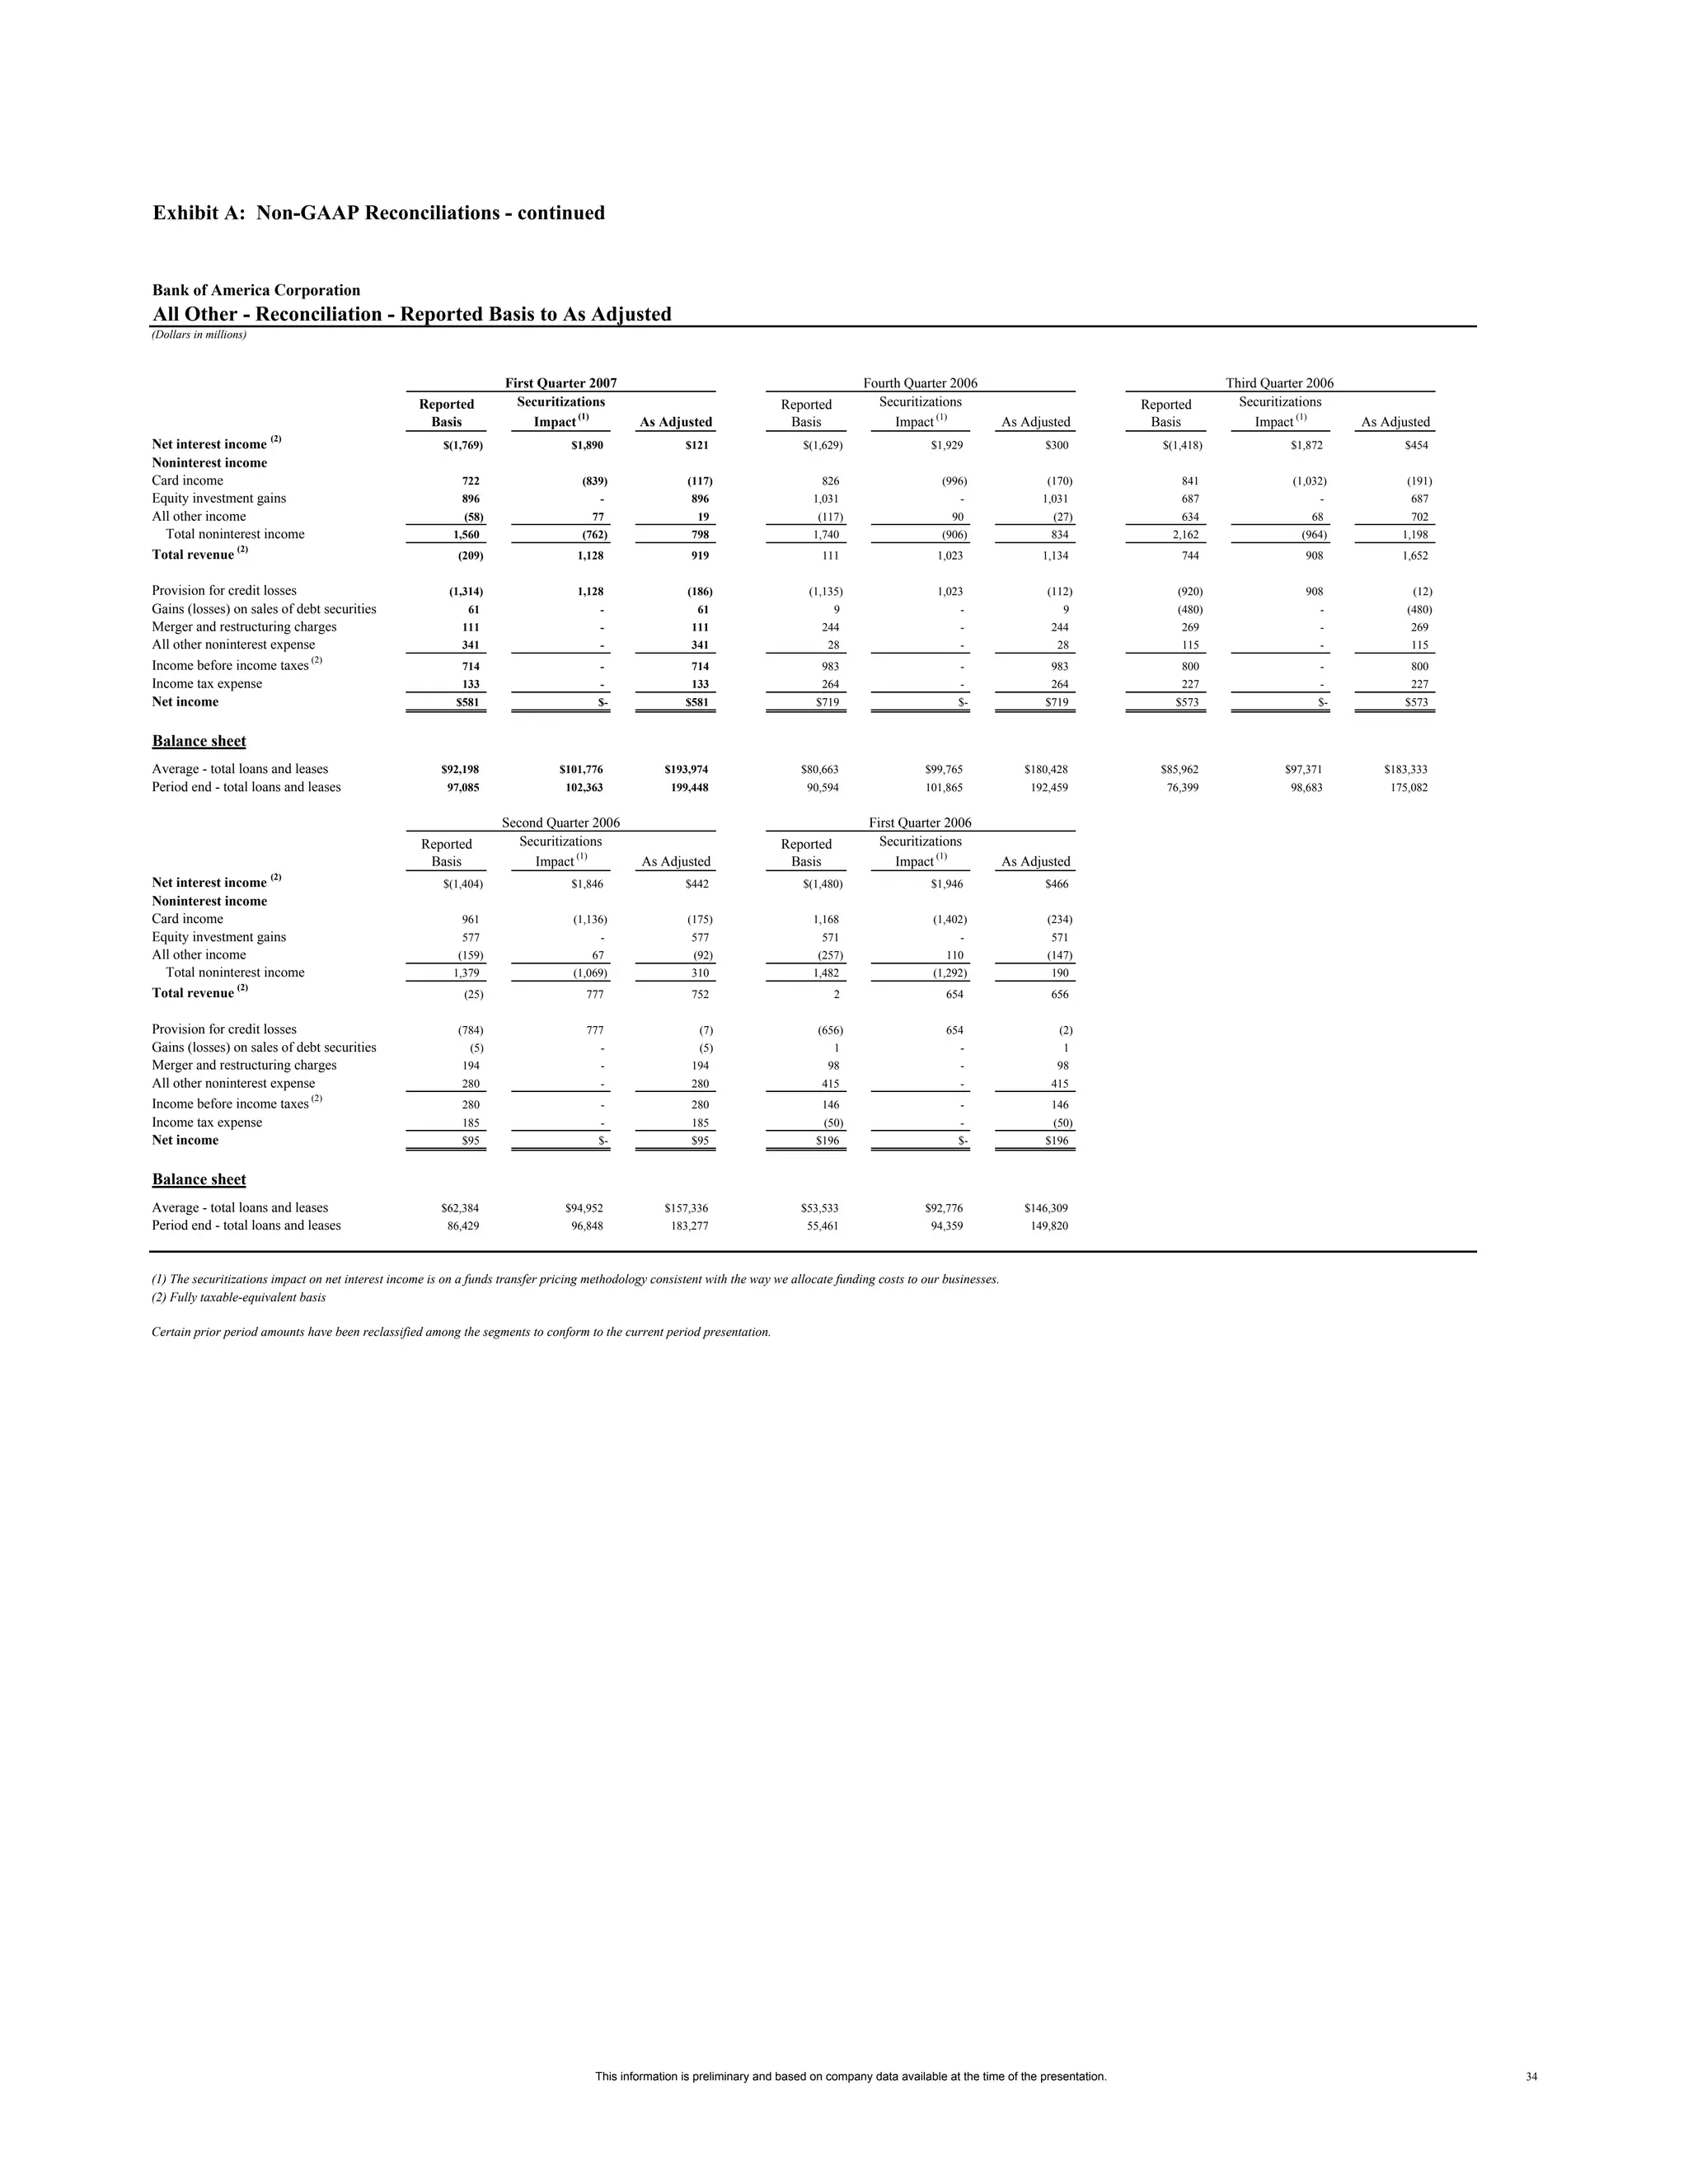
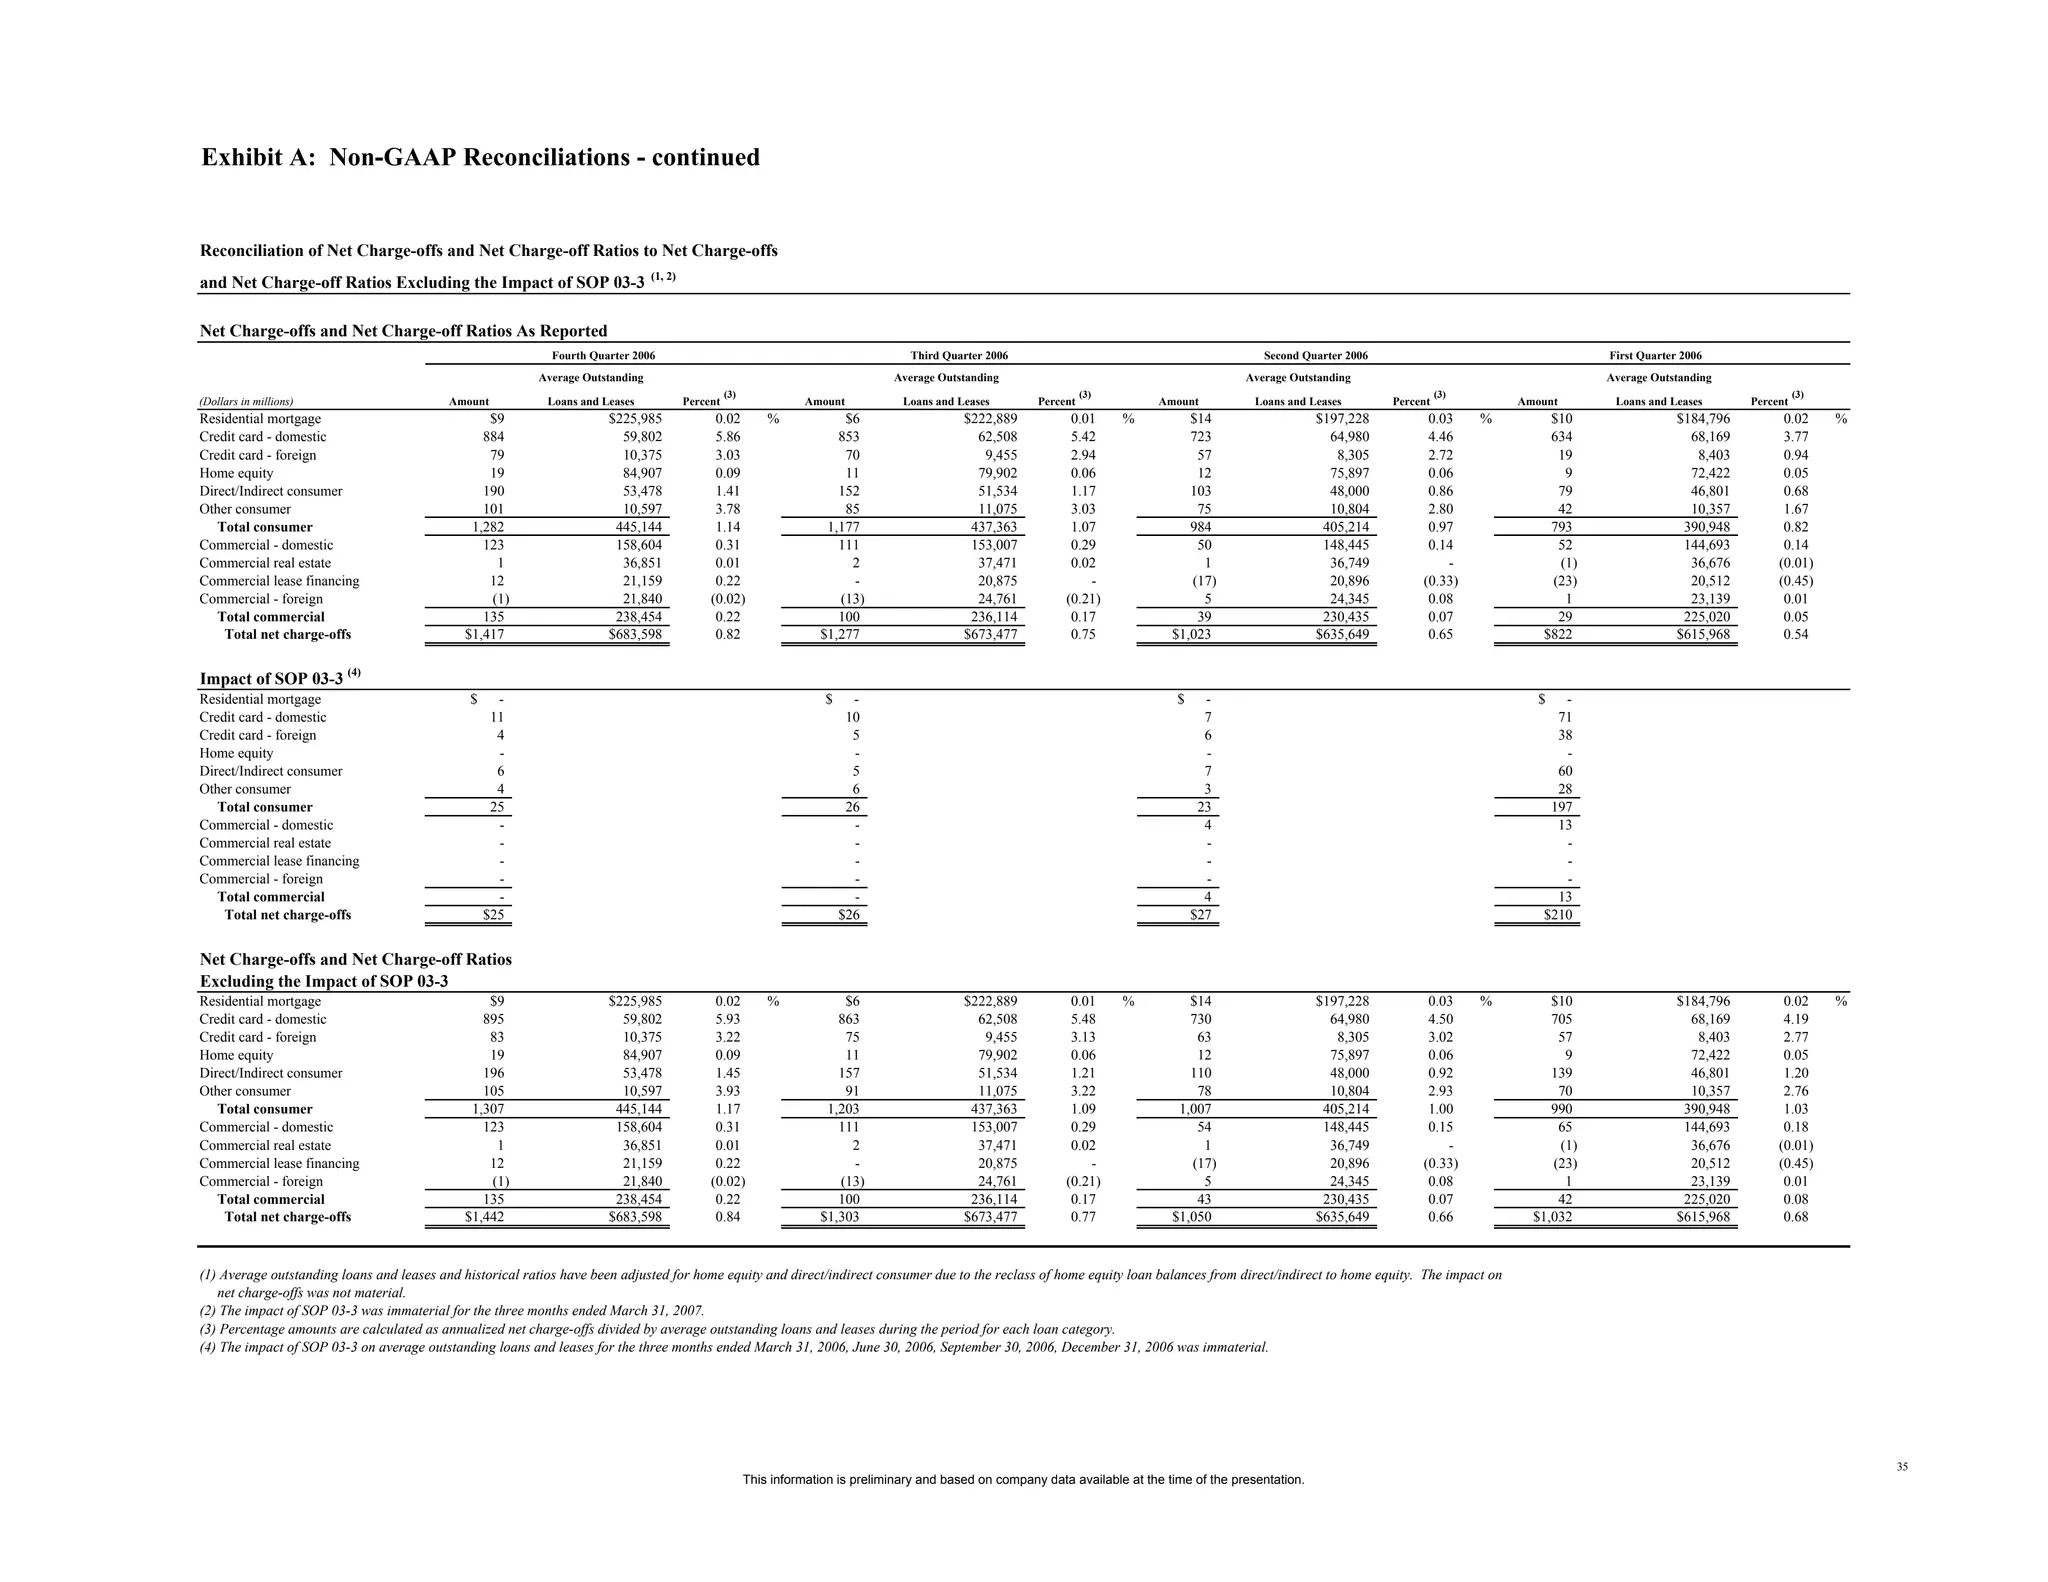
Supplemental Information
                           First Quarter 2007


This information is preliminary and based on company data available at the time of the presentation. It speaks only as
of the particular date or dates included in the accompanying pages. Bank of America does not undertake an obligation
to, and disclaims any duty to, correct or update any of the information provided. Any forward-looking statements in this
information are subject to the forward-looking language contained in Bank of America's reports filed with the SEC pursuant
to the Securities Exchange Act of 1934, which are available at the SEC's website (www.sec.gov) or at Bank of America's
website (www.bankofamerica.com). Bank of America's future financial performance is subject to risks and uncertainties as
described in its SEC filings.
Bank of America Corporation
Table of Contents                                                                           Page

Consolidated Financial Highlights                                                             2
Supplemental Financial Data                                                                   3
Consolidated Statement of Income                                                              4
Consolidated Balance Sheet                                                                    5
Capital Management                                                                            6
Core Net Interest Income - Managed Basis                                                      7
Quarterly Average Balances and Interest Rates                                                 8
Quarterly Average Balances and Interest Rates - Isolating Hedge Income/Expense                9
Business Segment View Graphs                                                                 10
Global Consumer and Small Business Banking
    Total Segment Results                                                                    11
    Quarter-to-Date Business Results                                                         12
    Customer Relationship View                                                               13
    Key Indicators                                                                           14
    E-commerce & BankofAmerica.com                                                           15
    Credit Card Only                                                                         16
Global Corporate and Investment Banking
    Total Segment Results                                                                    17
    Quarter-to-Date Business Results                                                         18
    Customer Relationship View                                                               19
    Business Lending Key Indicators                                                          20
    Capital Markets and Advisory Services Key Indicators                                     21
    Securities Market Share and Industry Ranking Graph                                       22
Global Wealth and Investment Management
    Total Segment Results                                                                    23
    Quarter-to-Date Business Results                                                         24
    Key Indicators                                                                           25
All Other
    Total Segment Results                                                                    26
Outstanding Loans & Leases                                                                   27
Commercial Credit Exposure by Industry                                                       28
Net Credit Default Protection by Maturity Profile and Credit Exposure Debt Rating            29
Selected Emerging Markets                                                                    30
Nonperforming Assets                                                                         31
Quarterly Net Charge-offs and Net Charge-offs Ratios                                         32

Exhibit A: Non - GAAP Reconciliations
   Global Consumer and Small Business Banking - Reconciliation - Managed to GAAP             33
   All Other - Reconciliation - Reported Basis to As Adjusted                                34
   Reconciliation of Net Charge-offs and Net Charge-off Ratios to Net Charge-offs and Net
     Charge-off Ratios Excluding the Impact of SOP 03-3                                      35


                                                                                                  1
Bank of America Corporation
Consolidated Financial Highlights
(Dollars in millions, except per share information; shares in thousands)

                                                               First               Fourth                Third               Second          First
                                                              Quarter              Quarter              Quarter              Quarter        Quarter
                                                               2007                 2006                 2006                 2006           2006
Income statement
Net interest income                                              $8,268               $8,599               $8,586               $8,630       $8,776
Noninterest income                                                9,825                9,866               10,067                9,598        8,901
Total revenue                                                    18,093               18,465               18,653               18,228       17,677
Provision for credit losses                                       1,235                1,570                1,165                1,005        1,270
Gains (losses) on sales of debt securities                           62                   21                 (469)                  (9)          14
Noninterest expense                                               9,097                9,093                8,863                8,717        8,924
Income tax expense                                                2,568                2,567                2,740                3,022        2,511
Net income                                                        5,255                5,256                5,416                5,475        4,986
Diluted earnings per common share                                  1.16                 1.16                 1.18                 1.19         1.07
Average diluted common shares issued
  and outstanding                                            4,497,028            4,536,696            4,570,558            4,601,169      4,666,405
Dividends paid per common share                                  $0.56                $0.56                $0.56                $0.50          $0.50

Performance ratios
Return on average assets                                           1.40 %               1.39 %               1.43 %               1.51 %       1.43 %
Return on average common shareholders' equity                     16.16                15.76                16.64                17.26        15.44

At period end
Book value per share of common stock                             $29.74               $29.70               $29.52               $28.17       $28.19
Market price per share of common stock:
 Closing price                                                  $51.02               $53.39               $53.57               $48.10        $45.54
 High closing price for the period                               54.05                54.90                53.57                50.47         47.08
 Low closing price for the period                                49.46                51.66                47.98                45.48         43.09
Market capitalization                                          226,481              238,021              240,966              217,794       208,633

Number of banking centers - domestic                             5,737                5,747                5,722                5,779         5,786
Number of branded ATMs - domestic                               17,117               17,079               16,846               16,984        16,716
Full-time equivalent employees                                 199,429              203,425              200,220              201,898       202,503


Certain prior period amounts have been reclassified to conform to current period presentation.


                               This information is preliminary and based on company data available at the time of the presentation.                     2
Bank of America Corporation
Supplemental Financial Data
(Dollars in millions)

Fully taxable-equivalent basis data

                                                                            First                 Fourth                  Third                  Second            First
                                                                           Quarter                Quarter                Quarter                 Quarter          Quarter
                                                                            2007                   2006                   2006                    2006             2006

Net interest income                                                            $8,597                 $8,955                 $8,894                 $8,926           $9,040
Total revenue                                                                  18,422                 18,821                 18,961                 18,524           17,941
Net interest yield                                                                2.61   %               2.75   %               2.73   %              2.85    %        2.98     %
Efficiency ratio                                                                49.38                  48.31                  46.75                  47.06            49.74


Reconciliation to GAAP financial measures
Supplemental financial data presented on an operating basis is a basis of presentation not defined by accounting principles generally accepted in the
United States (GAAP) that excludes merger and restructuring charges. We believe that the exclusion of merger and restructuring charges, which
represent events outside our normal operations, provides a meaningful period-to-period comparison and is more reflective of normalized operations.

Shareholder value added (SVA) is a key measure of performance not defined by GAAP that is used in managing our growth strategy orientation and
strengthening our focus on generating long-term growth and shareholder value. SVA is used to evaluate the Corporation's use of equity (i.e., capital) at
the individual unit level and is an integral component in the analytics for resource allocation. Using SVA as a performance measure places specific
focus on whether incremental investments generate returns in excess of the costs of capital associated with those investments. Each business segment
has a goal for growth in SVA reflecting the individual segment's business and customer strategy.

Other companies may define or calculate supplemental financial data differently. See the tables below for supplemental financial data and
corresponding reconciliations to GAAP financial measures for the quarters ended March 31, 2007, December 31, 2006, September 30, 2006, June 30,
2006, and March 31, 2006.

Reconciliation of net income to operating earnings
                                                                            First                 Fourth                  Third                  Second            First
                                                                           Quarter                Quarter                Quarter                 Quarter          Quarter
                                                                            2007                   2006                   2006                    2006             2006
Net income                                                                    $5,255                 $5,256                 $5,416                  $5,475           $4,986
Merger and restructuring charges                                                  111                   244                    269                     194                98
Related income tax benefit                                                        (41)                  (90)                  (100)                    (71)              (37)
Operating earnings                                                            $5,325                 $5,410                 $5,585                  $5,598           $5,047


Reconciliation of average shareholders' equity to average tangible shareholders' equity
Average shareholders' equity                                                $133,588               $134,047               $129,262               $127,373         $131,153
Average goodwill                                                             (65,703)               (65,766)               (66,077)               (66,226)         (66,094)
Average tangible shareholders' equity                                        $67,885                $68,281                $63,185                $61,147          $65,059


Operating basis
Diluted earnings per common share                                               $1.17                  $1.19                  $1.22                  $1.22            $1.08
Return on average assets                                                         1.42 %                 1.44 %                 1.48 %                 1.54 %           1.45 %
Return on average common shareholders' equity                                   16.38                  16.22                  17.16                  17.65            15.63
Return on average tangible shareholders' equity                                 31.81                  31.44                  35.07                  36.72            31.46
Efficiency ratio (1)                                                            48.78                  47.02                  45.33                  46.01            49.19

Reconciliation of net income to shareholder value added
Net income                                                                     $5,255                 $5,256                 $5,416                 $5,475           $4,986
Amortization of intangibles                                                       389                    433                    441                    441              440
Merger and restructuring charges,
  net of tax benefit                                                               70                    154                    169                    123               61
Capital charge                                                                 (3,546)                (3,659)                (3,580)                (3,485)          (3,550)
Shareholder value added                                                        $2,168                 $2,184                 $2,446                 $2,554           $1,937


(1) Fully taxable-equivalent basis

Certain prior period amounts have been reclassified to conform to current period presentation.


                                          This information is preliminary and based on company data available at the time of the presentation.                                      3
Bank of America Corporation
Consolidated Statement of Income
(Dollars in millions, except per share information; shares in thousands)
                                                                           First                Fourth                Third                Second           First
                                                                          Quarter               Quarter              Quarter               Quarter         Quarter
                                                                           2007                  2006                 2006                  2006            2006
Interest income
Interest and fees on loans and leases                                       $12,884               $12,705              $12,638              $11,804         $11,127
Interest and dividends on debt securities                                     2,380                 2,440                3,080                3,121           3,014
Federal funds sold and securities purchased under
 agreements to resell                                                          1,979                2,068                2,146                1,900           1,709
Trading account assets                                                         2,273                2,201                1,856                1,627           1,548
Other interest income                                                          1,044                1,077                  952                  845             727
  Total interest income                                                       20,560               20,491               20,672               19,297          18,125
Interest expense
Deposits                                                                       4,034                3,989                3,976                3,508            3,007
Short-term borrowings                                                          5,318                5,222                5,467                4,842            4,309
Trading account liabilities                                                      892                  800                  727                  596              517
Long-term debt                                                                 2,048                1,881                1,916                1,721            1,516
  Total interest expense                                                      12,292               11,892               12,086               10,667            9,349
Net interest income                                                            8,268                8,599                8,586                8,630            8,776
Noninterest income
Card income                                                                    3,333                 3,719               3,473                 3,664           3,434
Service charges                                                                2,072                 2,099               2,147                 2,077           1,901
Investment and brokerage services                                              1,149                 1,122               1,085                 1,146           1,103
Investment banking income                                                        638                   694                 510                   612             501
Equity investment gains                                                        1,014                 1,067                 705                   699             718
Trading account profits                                                          872                   460                 731                   915           1,060
Mortgage banking income                                                          213                   126                 189                    89             137
Other income                                                                     534                   579               1,227                   396              47
   Total noninterest income                                                    9,825                 9,866              10,067                 9,598           8,901
Total revenue                                                                 18,093               18,465               18,653               18,228          17,677
Provision for credit losses                                                    1,235                 1,570                1,165                1,005           1,270
Gains (losses) on sales of debt securities                                         62                     21               (469)                     (9)             14
Noninterest expense
Personnel                                                                      5,025                 4,444                4,474                4,480           4,813
Occupancy                                                                        713                   726                  696                  703             701
Equipment                                                                        350                   351                  318                  316             344
Marketing                                                                        555                   623                  587                  551             575
Professional fees                                                                229                   368                  259                  233             218
Amortization of intangibles                                                      389                   433                  441                  441             440
Data processing                                                                  437                   487                  426                  409             410
Telecommunications                                                               251                   260                  237                  228             220
Other general operating                                                        1,037                 1,157                1,156                1,162           1,105
Merger and restructuring charges                                                 111                   244                  269                  194              98
  Total noninterest expense                                                    9,097                 9,093                8,863                8,717           8,924
Income before income taxes                                                     7,823                 7,823                8,156                8,497           7,497
Income tax expense                                                             2,568                 2,567                2,740                3,022           2,511
Net income                                                                    $5,255               $5,256               $5,416               $5,475          $4,986
Net income available to common shareholders                                   $5,209               $5,243               $5,416               $5,471          $4,981

Per common share information
Earnings                                                                       $1.18                 $1.17                $1.20                $1.21           $1.08
Diluted earnings                                                               $1.16                 $1.16                $1.18                $1.19           $1.07
Dividends paid                                                                 $0.56                 $0.56                $0.56                $0.50           $0.50
Average common shares issued and outstanding                              4,432,664             4,464,110            4,499,704             4,534,627       4,609,481
Average diluted common shares issued and outstanding                      4,497,028             4,536,696            4,570,558             4,601,169       4,666,405


Certain prior period amounts have been reclassified to conform to current period presentation.


                                    This information is preliminary and based on company data available at the time of the presentation.                                  4
Bank of America Corporation
Consolidated Balance Sheet
(Dollars in millions)
                                                                                                                                               March 31       December 31    March 31
                                                                                                                                                2007             2006         2006
Assets
Cash and cash equivalents                                                                                                                         $31,549        $36,429      $32,575
Time deposits placed and other short-term investments                                                                                              12,037         13,952       11,157
Federal funds sold and securities purchased under agreements to resell                                                                            138,646        135,478      137,081
Trading account assets                                                                                                                            174,218        153,052      117,181
Derivative assets                                                                                                                                  25,279         23,439       23,291
Debt securities:
  Available-for-sale                                                                                                                              180,961        192,806      237,987
  Held-to-maturity, at cost                                                                                                                           925             40           86
    Total debt securities                                                                                                                         181,886        192,846      238,073
Loans and leases                                                                                                                                  723,633        706,490      619,525
Allowance for loan and lease losses                                                                                                                (8,732)        (9,016)      (9,067)
    Loans and leases, net of allowance                                                                                                            714,901        697,474      610,458
Premises and equipment, net                                                                                                                         9,271          9,255        9,267
Mortgage servicing rights (includes $2,963; $2,869 and $2,925 measured at fair value
 at March 31, 2007, December 31, 2006 and March 31, 2006)                                                                                          3,141           3,045         3,070
Goodwill                                                                                                                                          65,696          65,662        66,271
Intangible assets                                                                                                                                  9,217           9,422        10,681
Other assets                                                                                                                                     136,316         119,683       115,975
      Total assets                                                                                                                            $1,502,157      $1,459,737    $1,375,080

Liabilities
Deposits in domestic offices:
 Noninterest-bearing                                                                                                                            $174,082        $180,231     $179,358
 Interest-bearing                                                                                                                                425,197         418,100      415,769
Deposits in foreign offices:
 Noninterest-bearing                                                                                                                                3,346          4,577        6,874
 Interest-bearing                                                                                                                                  90,176         90,589       80,448
    Total deposits                                                                                                                                692,801        693,497      682,449
Federal funds purchased and securities sold under agreements to repurchase                                                                        234,413        217,527      236,919
Trading account liabilities                                                                                                                        77,289         67,670       51,100
Derivative liabilities                                                                                                                             17,946         16,339       15,541
Commercial paper and other short-term borrowings                                                                                                  156,844        141,300       99,389
Accrued expenses and other liabilities (includes $374, $397, and $395 of reserve for
 unfunded lending commitments)                                                                                                                     35,446         42,132        37,078
Long-term debt                                                                                                                                    152,562        146,000       123,178
    Total liabilities                                                                                                                           1,367,301      1,324,465     1,245,654
Shareholders' equity
Preferred stock, $0.01 par value; authorized - 100,000,000 shares; issued and
 outstanding - 121,739; 121,739 and 1,090,189 shares                                                                                                  2,851        2,851          271
Common stock and additional paid-in capital, $0.01 par value; authorized - 7,500,000,000 shares;
 issued and outstanding - 4,439,069,837; 4,458,151,391 and 4,581,317,964 shares                                                                     60,536        61,574       68,705
Retained earnings (1)                                                                                                                               79,996        79,024       70,204
Accumulated other comprehensive income (loss) (2)                                                                                                 (7,660)         (7,711)       (8,981)
Other                                                                                                                                               (867)           (466)         (773)
    Total shareholders' equity                                                                                                                   134,856         135,272       129,426
      Total liabilities and shareholders' equity                                                                                              $1,502,157      $1,459,737    $1,375,080

(1) Effective January 1, 2007, the Corporation adopted Financial Accounting Standards Board (FASB) Staff Position No. FAS 13-2, “Accounting for a Change or Projected Change in
    the Timing of Cash Flows Relating to Income Taxes Generated by a Leveraged Lease Transaction” (FSP 13-2). The adoption of FSP 13-2 reduced the beginning balance of retained
    earnings by approximately $1.4 billion, net of tax, with a corresponding offset decreasing the net investment in leveraged leases. Effective January 1, 2007, the Corporation
    adopted Statement of Financial Accounting Standards (SFAS) No. 157, quot;Fair Value Measurementsquot; and SFAS No. 159, “The Fair Value Option for Financial Assets and Financial
    Liabilities” (SFAS 159) which reduced the beginning balance of retained earnings by $208 million, net of tax. In addition, the Corporation adopted FASB Interpretation No. 48,
    “Accounting for Uncertainty in Income Taxes, an interpretation of FASB Statement No. 109” (FIN 48). The adoption of FIN 48 reduced the beginning balance of retained earnings
    by $146 million.
(2) Effective December 31, 2006, the Corporation adopted SFAS No. 158, “Employers’ Accounting for Defined Benefit Pension and Other Postretirement Plans, an amendment
    of FASB Statements No. 87, 88, 106, and 132(R)”, which reduced accumulated Other Comprehensive Income (Loss) by approximately $1.3 billion, net of tax.

Certain prior period amounts have been reclassified to conform to current period presentation.


                                                      This information is preliminary and based on company data available at the time of the presentation.                                5
Bank of America Corporation
Capital Management
(Dollars in millions)

                                                                           First                          Fourth                         Third              Second               First
                                                                          Quarter                         Quarter                       Quarter             Quarter             Quarter
                                                                          2007 (1)                          2006                          2006               2006                2006
Risk-based capital:
Tier 1 capital                                                               $91,005                        $91,064                        $88,085           $84,978             $83,174
Total capital                                                                126,850                        125,226                        119,074           114,738             111,422
Risk-weighted assets                                                       1,062,020                     1,054,533                      1,039,283           1,019,828            984,190
Tier 1 capital ratio                                                              8.57 %                         8.64 %                         8.48 %           8.33 %              8.45 %
Total capital ratio                                                              11.94                         11.88                          11.46            11.25               11.32
                        (2)
Tangible equity ratio                                                             4.20                           4.35                           4.22             3.76                4.04
Tier 1 leverage ratio                                                             6.24                           6.36                           6.16             6.13                6.18


(1) Preliminary data on risk-based capital
(2) Tangible equity ratio equals shareholders' equity less goodwill and intangible assets divided by total assets less goodwill and intangible assets.


Share Repurchase Program

48.0 million common shares were repurchased in the first quarter of 2007 as a part of an ongoing share repurchase program.


215.1 million shares remain outstanding under the 2006 and 2007 authorized programs.


28.9 million shares were issued in the first quarter of 2007.


                                                                               Capital Management
       5,000                                                                                                                                                                            9.00%


                               4,581
                                                            4,528                                   4,498
                                                                                                                                             4,458                      4,439
       4,500
                                                                                                                                            8.64%
                                                                                                                                                                      8.57%

                                                                                                    8.48%
       4,000                  8.45%                                                                                                                                                     8.50%

                                                            8.33%


       3,500


       3,000                                                                                                                                                                            8.00%
                              Mar-06                      Jun-06                                   Sep-06                                   Dec-06                    Mar-07*

                                           Shares outstanding at period end                                              Tier 1 capital ratio


*Preliminary data on risk-based capital


                                                     This information is preliminary and based on company data available at the time of the presentation.                                       6
Bank of America Corporation
Core Net Interest Income - Managed Basis
(Dollars in millions)

                                                                             First                 Fourth                  Third                Second            First
                                                                            Quarter                Quarter                Quarter               Quarter          Quarter
                                                                              2007                   2006                  2006                  2006             2006
Net interest income
As reported (1)                                                                 $8,597                $8,955                $8,894                $8,926           $9,040
                                           (2)
Impact of market-based net interest income                                        (484)                 (488)                 (376)                 (380)            (412)
 Core net interest income                                                        8,113                 8,467                 8,518                 8,546            8,628
Impact of securitizations                                                        1,859                 1,850                 1,760                 1,710            1,725
 Core net interest income - managed basis                                       $9,972               $10,317               $10,278               $10,256          $10,353

Average earning assets
As reported                                                                $1,321,946            $1,299,461             $1,302,366             $1,253,895       $1,219,611
Impact of market-based earning assets (2)                                    (408,113)             (405,811)              (376,010)             (357,617)        (336,606)
 Core average earning assets                                                  913,833               893,650                926,356               896,278          883,005
Impact of securitizations                                                     102,529               100,786                 98,722                96,776           96,268
 Core average earning assets - managed basis                               $1,016,362              $994,436             $1,025,078              $993,054         $979,273

Net interest yield contribution
As reported (1)                                                                    2.61 %                2.75     %             2.73    %            2.85   %         2.98   %
Impact of market-based activities                                                  0.95                  1.03                   0.94                 0.97             0.95
 Core net interest yield on earning assets                                         3.56                  3.78                   3.67                 3.82             3.93
Impact of securitizations                                                          0.38                  0.36                   0.33                 0.31             0.32
 Core net interest yield on earning assets - managed basis                         3.94 %                4.14     %             4.00    %            4.13   %         4.25   %


(1) Fully taxable-equivalent basis
(2) Represents amounts from the Capital Markets and Advisory Services business within Global Corporate and Investment Banking.


Certain prior period amounts have been reclassified to conform to current period presentation.


                                        This information is preliminary and based on company data available at the time of the presentation.                                     7
Bank of America Corporation
Quarterly Average Balances and Interest Rates - Fully Taxable-equivalent Basis
(Dollars in millions)
                                                                               First Quarter 2007                                Fourth Quarter 2006                            First Quarter 2006
                                                                                       Interest                                           Interest                                       Interest
                                                                          Average      Income/    Yield/                    Average       Income/    Yield/               Average        Income/     Yield/
                                                                          Balance      Expense    Rate                      Balance       Expense    Rate                 Balance       Expense      Rate
Earning assets
Time deposits placed and other short-term investments                         $15,023          $169         4.57 %              $15,760          $166            4.19 %      $14,347        $139       3.92 %
Federal funds sold and securities purchased under
  agreements to resell                                                        166,195          1,979        4.79                174,167          2,068           4.73        174,711       1,709       3.94
Trading account assets                                                        175,249          2,357        5.41                167,163          2,289           5.46        133,361       1,623       4.89
Debt securities (1)                                                           186,498          2,451        5.27                193,601          2,504           5.17        234,606       3,043       5.19
Loans and leases (2):
    Residential mortgage                                                      246,618         3,504         5.69                225,985         3,202            5.66        184,796       2,524       5.48
    Credit card - domestic                                                     57,720         1,887        13.26                 59,802         2,101           13.94         68,169       2,180      12.97
    Credit card - foreign                                                      11,133           317        11.55                 10,375           305           11.66          8,403         287      13.86
    Home equity (3)                                                            89,561         1,679         7.60                 84,907         1,626            7.60         72,422       1,247       6.98
    Direct/Indirect consumer                                                   60,155         1,221         8.23                 53,478         1,101            8.17         46,801         851       7.32
    Other consumer (4)                                                          8,809           204         9.36                 10,597           225            8.47         10,357         272      10.59
       Total consumer                                                         473,996         8,812         7.50                445,144         8,560            7.65        390,948       7,361       7.60
    Commercial - domestic                                                     163,620         2,934         7.27                158,604         2,907            7.27        144,693       2,490       6.97
    Commercial real estate (5)                                                 36,117           672         7.55                 36,851           704            7.58         36,676         632       6.99
    Commercial lease financing                                                 19,651           175         3.55                 21,159           254            4.80         20,512         247       4.82
    Commercial - foreign                                                       20,658           330         6.48                 21,840           337            6.12         23,139         427       7.48
       Total commercial                                                       240,046         4,111         6.94                238,454         4,202            7.00        225,020       3,796       6.83
       Total loans and leases                                                 714,042        12,923         7.31                683,598        12,762            7.42        615,968      11,157       7.32
Other earning assets                                                           64,939         1,010         6.28                 65,172         1,058            6.46         46,618         718       6.22
       Total earning assets (6)                                            1,321,946         20,889         6.37             1,299,461         20,847            6.39      1,219,611      18,389       6.08
Cash and cash equivalents                                                     33,623                                            32,816                                        34,857
Other assets, less allowance for loan and lease losses                       165,849                                           162,873                                       161,905
       Total assets                                                       $1,521,418                                        $1,495,150                                    $1,416,373

Interest-bearing liabilities
Domestic interest-bearing deposits:
    Savings                                                                   $32,773            $41        0.50 %              $32,965            $48           0.58 %      $35,550         $76       0.87 %
    NOW and money market deposit accounts                                     212,249            936        1.79                211,055            966           1.81        227,606         908       1.62
    Consumer CDs and IRAs                                                     159,505          1,832        4.66                154,621          1,794           4.60        135,068       1,177       3.53
    Negotiable CDs, public funds and other time deposits                       13,376            136        4.12                 13,052            140           4.30          8,551          70       3.30
        Total domestic interest-bearing deposits                              417,903          2,945        2.86                411,693          2,948           2.84        406,775       2,231       2.22
Foreign interest-bearing deposits :
    Banks located in foreign countries                                         40,372            531        5.34                 38,648            507           5.21         30,116         424       5.71
    Governments and official institutions                                      14,482            178        4.98                 14,220            168           4.70         10,200         107       4.25
    Time, savings and other                                                    39,534            380        3.90                 41,328            366           3.50         35,136         245       2.83
        Total foreign interest-bearing deposits                                94,388          1,089        4.68                 94,196          1,041           4.38         75,452         776       4.17
        Total interest-bearing deposits                                       512,291          4,034        3.19                505,889          3,989           3.13        482,227       3,007       2.53
Federal funds purchased, securities sold under agreements
  to repurchase and other short-term borrowings                               414,104          5,318        5.20                405,748          5,222           5.11        399,896       4,309       4.37
Trading account liabilities                                                    77,635            892        4.66                 75,261            800           4.21         52,466         517       3.99
Long-term debt                                                                148,627          2,048        5.51                140,756          1,881           5.34        117,018       1,516       5.18
        Total interest-bearing liabilities (6)                             1,152,657         12,292         4.31             1,127,654         11,892            4.19      1,051,607       9,349       3.60
Noninterest-bearing sources:
    Noninterest-bearing deposits                                             174,413                                           174,356                                       177,594
    Other liabilities                                                         60,760                                            59,093                                        56,019
    Shareholders' equity                                                     133,588                                           134,047                                       131,153
        Total liabilities and shareholders' equity                        $1,521,418                                        $1,495,150                                    $1,416,373
Net interest spread                                                                                         2.06 %                                               2.20 %                                2.48 %
Impact of noninterest-bearing sources                                                                       0.55                                                 0.55                                  0.50
        Net interest income/yield on earning assets                                          $8,597         2.61 %                             $8,955            2.75 %                   $9,040       2.98 %


(1) Yields on AFS debt securities are calculated based on fair value rather than historical cost balances. The use of fair value does not have a material impact on net interest yield.
(2) Nonperforming loans are included in the respective average loan balances. Income on these nonperforming loans is recognized on a cash basis.
(3) Includes home equity loans of $13.5 billion in the first quarter of 2007, and $11.7 billion and $8.2 billion in the fourth and first quarters of 2006.
(4) Includes consumer finance loans of $3.0 billion in the first quarter of 2007, and $2.8 billion and $3.0 billion in the fourth and first quarters of 2006; and foreign consumer
   loans of $5.8 billion in the first quarter of 2007, and $7.8 billion and $7.3 billion in the fourth and first quarters of 2006.
(5) Includes domestic commercial real estate loans of $35.5 billion in the first quarter of 2007, and $36.1 billion and $36.0 billion in the fourth and first quarters of 2006.
(6) Interest income includes the impact of interest rate risk management contracts, which increased (decreased) interest income on the underlying assets $(121) million in the
    first quarter of 2007, and $(198) million and $8 million in the fourth and first quarters of 2006. Interest expense includes the impact of interest rate risk management contracts,
   which increased (decreased) interest expense on the underlying liabilities $179 million in the first quarter of 2007, and $(69) million and $136 million in the fourth and first
   quarters of 2006.

Certain prior period amounts have been reclassified to conform to current period presentation.


                                                         This information is preliminary and based on company data available at the time of the presentation.                                                   8
Bank of America Corporation
Quarterly Average Balances and Interest Rates - Fully Taxable-equivalent Basis - Isolating Hedge Income/Expense (1)
(Dollars in millions)
                                                                                             First Quarter 2007                                Fourth Quarter 2006                    First Quarter 2006
                                                                                                     Interest                                           Interest                               Interest
                                                                                      Average        Income/    Yield/                   Average        Income/    Yield/        Average       Income/     Yield/
                                                                                      Balance         Expense    Rate                    Balance         Expense    Rate         Balance        Expense     Rate
Earning assets
Time deposits placed and other short-term investments (2)                                 $15,023          $196          5.29 %              $15,760           $199     5.01 %     $14,347        $142       4.01 %
Federal funds sold and securities purchased under
  agreements to resell (2)                                                                166,195          2,085         5.04                174,167          2,223     5.09       174,711       1,800       4.15
Trading account assets                                                                    175,249          2,357         5.41                167,163          2,289     5.46       133,361       1,623       4.89
Debt securities (2)                                                                       186,498          2,455         5.27                193,601          2,509     5.18       234,606       3,043       5.19
Loans and leases:
    Residential mortgage                                                                  246,618         3,504          5.69                225,985         3,202      5.66       184,796       2,524      5.48
    Credit card - domestic                                                                 57,720         1,887         13.26                 59,802         2,101     13.94        68,169       2,180     12.97
    Credit card - foreign                                                                  11,133           317         11.55                 10,375           305     11.66         8,403         287     13.86
    Home equity                                                                            89,561         1,679          7.60                 84,907         1,626      7.60        72,422       1,247      6.98
    Direct/Indirect consumer                                                               60,155         1,221          8.23                 53,478         1,101      8.17        46,801         851      7.32
    Other consumer                                                                          8,809           204          9.36                 10,597           225      8.47        10,357         272     10.59
       Total consumer                                                                     473,996         8,812          7.50                445,144         8,560      7.65       390,948       7,361      7.60
    Commercial - domestic (2)                                                             163,620         2,933          7.27                158,604         2,918      7.30       144,693       2,379      6.66
    Commercial real estate                                                                 36,117           672          7.55                 36,851           704      7.58        36,676         632      6.99
    Commercial lease financing                                                             19,651           175          3.55                 21,159           254      4.80        20,512         247      4.82
    Commercial - foreign (2)                                                               20,658           312          6.12                 21,840           332      6.02        23,139         426      7.46
       Total commercial                                                                   240,046         4,092          6.91                238,454         4,208      7.01       225,020       3,684      6.63
       Total loans and leases                                                             714,042        12,904          7.30                683,598        12,768      7.42       615,968      11,045      7.24
Other earning assets (2)                                                                   64,939          1,013         6.29                 65,172          1,057     6.46        46,618         728       6.31
        Total earning assets - excluding hedge impact                                   1,321,946        21,010          6.41              1,299,461        21,045      6.45      1,219,611     18,381       6.07
Net derivative income (expense) on assets                                                                   (121)                                              (198)                                 8
       Total earning assets - including hedge impact                                   1,321,946         20,889          6.37             1,299,461         20,847      6.39      1,219,611     18,389       6.08
Cash and cash equivalents                                                                 33,623                                             32,816                                  34,857
Other assets, less allowance for loan and lease losses                                   165,849                                            162,873                                 161,905
       Total assets                                                                   $1,521,418                                         $1,495,150                              $1,416,373

Interest-bearing liabilities
Domestic interest-bearing deposits:
    Savings                                                                               $32,773            $41         0.50 %              $32,965            $48     0.58 %     $35,550         $76       0.87 %
                                                  (2)
    NOW and money market deposit accounts                                                 212,249            931         1.78                211,055            962     1.81       227,606         906       1.61
    Consumer CDs and IRAs (2)                                                             159,505          1,638         4.16                154,621          1,598     4.10       135,068       1,022       3.07
                                                            (2)
    Negotiable CDs, public funds and other time deposits                                   13,376            134         4.05                 13,052            138     4.24         8,551          68       3.21
        Total domestic interest-bearing deposits                                          417,903          2,744         2.66                411,693          2,746     2.65       406,775       2,072       2.07
Foreign interest-bearing deposits:
                                          (2)
    Banks located in foreign countries                                                     40,372            529         5.32                 38,648            515     5.30        30,116         403       5.43
    Governments and official institutions                                                  14,482            178         4.98                 14,220            168     4.70        10,200         107       4.25
    Time, savings and other                                                                39,534            380         3.90                 41,328            366     3.50        35,136         245       2.83
        Total foreign interest-bearing deposits                                            94,388          1,087         4.67                 94,196          1,049     4.42        75,452         755       4.06
        Total interest-bearing deposits                                                   512,291          3,831         3.03                505,889          3,795     2.98       482,227       2,827       2.38
Federal funds purchased, securities sold under agreements
                                                      (2)
  to repurchase and other short-term borrowings                                           414,104         5,466          5.35                405,748         5,522      5.40        399,896      4,375       4.43
Trading account liabilities                                                                77,635           892          4.66                 75,261           800      4.21         52,466        517       3.99
                 (2)
Long-term debt                                                                            148,627         1,924          5.18                140,756         1,844      5.24        117,018      1,494       5.11
        Total interest-bearing liabilities - excluding hedge impact                     1,152,657        12,113          4.25              1,127,654        11,961      4.21      1,051,607      9,213       3.54
Net derivative (income) expense on liabilities                                                               179                                                (69)                               136
        Total interest-bearing liabilities - including hedge impact                     1,152,657        12,292          4.31              1,127,654        11,892      4.19      1,051,607      9,349       3.60
Noninterest-bearing sources:
   Noninterest-bearing deposits                                                          174,413                                            174,356                                 177,594
   Other liabilities                                                                      60,760                                             59,093                                  56,019
   Shareholders' equity                                                                  133,588                                            134,047                                 131,153
        Total liabilities and shareholders' equity                                    $1,521,418                                         $1,495,150                              $1,416,373
Net interest spread                                                                                                      2.16                                           2.24                                 2.53
Impact of noninterest-bearing sources                                                                                    0.54                                           0.55                                 0.49
       Net interest income/yield on earning assets - excluding hedge impact                              $8,897          2.70 %                             $9,084      2.79 %                  $9,168       3.02 %
Net impact of derivative hedge income (expense)                                                            (300)        (0.09)                                (129)    (0.04)                     (128)     (0.04)
      Net interest income/yield on earning assets                                                        $8,597          2.61 %                             $8,955      2.75 %                  $9,040       2.98 %


(1) This table presents a non-GAAP financial measure. The impact of interest rate risk management derivatives is shown separately. Interest income and interest expense amounts, and
   the yields and rates have been adjusted. Management believes this presentation is useful to investors because it adjusts for the impact of our hedging decisions and provides a better
   understanding of our hedging activities. The impact of interest rate risk management derivatives is not material to the average balances presented above.
(2) Interest income excludes the impact of interest rate risk management contracts, which increased (decreased) interest income on time deposits placed and other short-term investments
   $(27) million, federal funds sold and securities purchased under agreements to resell $(106) million, debt securities $(4) million, commercial - domestic $1 million, commercial - foreign
   $18 million, and other earning assets $(3) million in the first quarter of 2007. Interest expense excludes the impact of interest rate risk management contracts, which increased
   (decreased) interest expense on NOW and money market deposit accounts $5 million, consumer CDs and IRAs $194 million, negotiable CDs, public funds and other time deposits
   $2 million, banks located in foreign countries $2 million, federal funds purchased, securities sold under agreements to repurchase and other short-term borrowings $(148) million,
   and long-term debt $124 million in the first quarter of 2007. Interest income excludes the impact of interest rate risk management contracts, which increased (decreased) interest
   income on time deposits placed and other short-term investments $(33) million, federal funds sold and securities purchased under agreements to resell $(155) million, debt securities
   $(5) million, commercial - domestic $(11) million, commercial - foreign $5 million, and other earning assets $1 million in the fourth quarter of 2006. Interest expense excludes the
   impact of interest rate risk management contracts, which increased (decreased) interest expense on NOW and money market deposit accounts $4 million, consumer CDs and IRAs
   $196 million, negotiable CDs, public funds and other time deposits $2 million, banks located in foreign countries $(8) million, federal funds purchased, securities sold under
   agreements to repurchase and other short-term borrowings $(300) million, and long-term debt $37 million in the fourth quarter of 2006. Interest income excludes the impact
   of interest rate risk management contracts, which increased (decreased) interest income on time deposits placed and other short-term investments $(3) million, federal funds sold and
   securities purchased under agreements to resell $(91) million, commercial - domestic $111 million, commercial - foreign $1 million, and other earning assets $(10) million in the
    first quarter of 2006. Interest expense excludes the impact of interest rate risk management contracts, which increased (decreased) interest expense on NOW and money market
   deposit accounts $2 million, consumer CDs and IRAs $155 million, negotiable CDs, public funds and other time deposits $2 million, banks located in foreign countries $21 million,
   federal funds purchased, securities sold under agreements to repurchase and other short-term borrowings $(66) million and long-term debt $22 million in the first quarter of 2006.


Certain prior period amounts have been reclassified to conform to current period presentation.


                                                               This information is preliminary and based on company data available at the time of the presentation.                                                   9
Bank of America Corporation
Business Segment View
                                                                                     Net Income
                                                                                  First Quarter 2007


              Global Consumer and Small Business                                                                                                                    Global Corporate and Investment
                          Banking                                                                                                                                              Banking
                            51%                                                                                                                                                  28%


                                                                                                                                                    Global Wealth and Investment
                                                                                                                                                            Management
                                                                                                                                                                10%
                                                                        All Other
                                                                          11%


                                                                                               Revenue                (1,2)


                                                                                           First Quarter 2007

                                                                                                                                                                   Global Corporate and Investment
                                                                                                                                                                              Banking
                                                                                                                                                                                29%


                                                                                                                                                                         Global Wealth and Investment
                                                                                                                                                                                 Management
                                                                                                                                                                                    10%


                            Global Consumer and Small Business
                                        Banking
                                          62%                                                                                            All Other
                                                                                                                                           (1)%


   (1) Fully taxable-equivalent basis
  (2) Global Consumer and Small Business Banking is presented on a managed view, specifically Card Services, with a corresponding offset to All Other.


                                                           This information is preliminary and based on company data available at the time of the presentation.                                         10
Bank of America Corporation
Global Consumer and Small Business Banking Segment Results (1, 2)
(Dollars in millions; except as noted)


                                                             First                  Fourth                   Third                 Second            First
                                                            Quarter                 Quarter                 Quarter                Quarter          Quarter
                                                             2007                    2006                    2006                   2006             2006
                           (3)
Net interest income                                             $7,028                  $7,157                 $7,027                  $6,968         $7,092
Noninterest income
Card income                                                       2,451                  2,707                   2,446                  2,528          2,107
Service charges                                                   1,377                  1,394                   1,410                  1,349          1,190
Mortgage banking income                                             302                    247                     215                    210            205
All other income                                                    264                    255                     383                    323            248
  Total noninterest income                                        4,394                  4,603                   4,454                  4,410          3,750
Total revenue (3)                                               11,422                  11,760                 11,481                  11,378         10,842

Managed credit impact                                             2,411                  2,777                   2,049                  1,807          1,901
Gains (losses) on sales of debt securities                           (1)                    (1)                      -                      -             (1)
Noninterest expense                                               4,728                  4,852                   4,710                  4,509          4,612
Income before income taxes (3)                                   4,282                   4,130                  4,722                   5,062          4,328
Income tax expense                                               1,586                   1,524                  1,736                   1,858          1,604
Net income                                                      $2,696                  $2,606                 $2,986                  $3,204         $2,724

Shareholder value added                                         $1,346                  $1,256                 $1,622                  $1,834         $1,311
                     (3)
Net interest yield                                                 8.25 %                 8.39     %              8.27     %             8.15   %       8.35    %
Return on average equity                                          17.58                  16.63                   18.85                  20.14          16.73
Efficiency ratio (3)                                              41.40                  41.27                   41.02                  39.63          42.54


Balance sheet (2)
Average
Total loans and leases                                       $308,105                $299,615               $291,195                $282,554        $279,382
Total earning assets (4)                                       345,511                338,541                 337,022                343,086         344,423
Total assets (4)                                               400,576                393,383                 392,979                396,046         396,821
Total deposits                                                 326,552                327,962                 332,578                336,105         332,702
Allocated equity                                                62,194                 62,179                  62,862                 63,810          66,034

Period end
Total loans and leases                                       $309,992                $307,687               $294,207                $286,059        $278,197
Total earning assets (4)                                       349,694                339,578                 340,112                337,130         351,772
               (4)
Total assets                                                   407,654                398,286                 398,206                396,142         406,032
Total deposits                                                 334,968                329,245                 332,844                338,827         342,521

Period end (in billions)
Mortgage servicing portfolio                                    $345.1                  $333.0                 $323.3                  $313.0         $302.4


(1) Global Consumer and Small Business Banking has three primary businesses: Deposits, Card Services and Consumer Real Estate. In addition,
     ALM/Other includes the results of ALM activities and other consumer-related businesses (e.g., insurance). Effective January 1, 2007,
     Global Consumer and Small Business Banking combined the former Mortgage and Home Equity businesses into Consumer Real Estate.
(2) Presented on a managed view, specifically Card Services. (See Exhibit A: Non-GAAP Reconciliations - Global Consumer and Small
     Business Banking - Reconciliation - Managed to GAAP on page 33.)
(3) Fully taxable-equivalent basis
(4) Total earning assets and total assets include asset allocations to match liabilities (i.e., deposits).

Certain prior period amounts have been reclassified among the segments to conform to the current period presentation.


                                     This information is preliminary and based on company data available at the time of the presentation.                       11
Bank of America Corporation
Global Consumer and Small Business Banking Business Results
(Dollars in millions)

                                                                                                    Three Months Ended March 31, 2007
                                                                                                                  Card          Consumer                           ALM/
                                                                         (1)                             (2)            (1)               (3)
                                                                 Total                          Deposits       Services       Real Estate                          Other

Net interest income (4)                                              $7,028                           $2,367                     $3,990                  $524         $147
Noninterest income
Card income                                                            2,451                              500                      1,951                    -               -
Service charges                                                        1,377                            1,376                          -                    1               -
Mortgage banking income                                                  302                                -                          -                  302               -
All other income                                                         264                                -                        189                   13              62
  Total noninterest income                                             4,394                            1,876                      2,140                  316              62
               (4)
Total revenue                                                        11,422                             4,243                      6,130                  840          209

Managed credit impact                                                  2,411                               39                      2,299                   29           44
Gains (losses) on sales of debt securities                                (1)                               -                          -                    -           (1)
Noninterest expense                                                    4,728                            2,157                      2,000                  450          121
                                     (4)
Income before income taxes                                            4,282                            2,047                      1,831                   361           43
Income tax expense                                                    1,586                              759                        678                   134           15
Net income                                                           $2,696                           $1,288                     $1,153                  $227          $28

Shareholder value added                                              $1,346                              $955                      $227                  $130          $34
                   (4)
Net interest yield                                                      8.25 %                           2.86      %                8.02 %                2.13 %       n/m
Return on average equity                                               17.58                            35.00                      10.64                 25.82         n/m
                 (4)
Efficiency ratio                                                     41.40                            50.82                     32.63                    53.53         n/m
Average - total loans and leases                                  $308,105                              n/m                  $201,166                  $95,631         n/m
Average - total deposits                                           326,552                         $320,945                       n/m                      n/m         n/m
                          (5)
Period end - total assets                                           407,654                          344,143                   234,601                 105,959         n/m


                                                                                                    Three Months Ended March 31, 2006
                                                                                                                  Card          Consumer                           ALM/
                                                                         (1)                             (2)            (1)
                                                                 Total                          Deposits       Services       Real Estate (3)                      Other

Net interest income (4)                                              $7,092                           $2,288                     $4,139                  $478         $187
Noninterest income
Card income                                                            2,107                              430                      1,677                    -               -
Service charges                                                        1,190                            1,189                          -                    1               -
Mortgage banking income                                                  205                                -                          -                  205               -
All other income                                                         248                                -                        184                   13              51
  Total noninterest income                                             3,750                            1,619                      1,861                  219              51
               (4)
Total revenue                                                        10,842                             3,907                      6,000                  697          238

Managed credit impact                                                  1,901                               28                      1,809                   14              50
Gains (losses) on sales of debt securities                                (1)                               -                          -                    -              (1)
Noninterest expense                                                    4,612                            2,166                      1,945                  411              90
                                     (4)
Income before income taxes                                            4,328                            1,713                      2,246                   272           97
Income tax expense                                                    1,604                              634                        833                   101           36
Net income                                                           $2,724                           $1,079                     $1,413                  $171          $61

Shareholder value added                                              $1,311                              $770                      $477                   $92         $(28)
                   (4)
Net interest yield                                                      8.35 %                           2.72      %                8.93 %                2.22 %       n/m
Return on average equity                                               16.73                            30.10                      12.68                 23.79         n/m
                    (4)
Efficiency ratio                                                     42.54                            55.47                     32.41                    59.07         n/m
Average - total loans and leases                                  $279,382                              n/m                  $186,686                  $81,413         n/m
Average - total deposits                                           332,702                         $327,198                       n/m                      n/m         n/m
                          (5)
Period end - total assets                                           406,032                          351,937                   215,333                  91,030         n/m


(1) Presented on a managed view, specifically Card Services.
(2) For the three months ended March 31, 2007 and 2006, a total of $3.6 billion and $3.2 billion of deposits were migrated from Global Consumer and Small Business
    Banking to Global Wealth and Investment Management.
(3) Effective January 1, 2007, Global Consumer and Small Business Banking combined the former Mortgage and Home Equity businesses into Consumer Real Estate.
(4) Fully taxable-equivalent basis
(5) Total assets include asset allocations to match liabilities (i.e., deposits).
 n/m = not meaningful

Certain prior period amounts have been reclassified among the segments to conform to the current period presentation.


                                                This information is preliminary and based on company data available at the time of the presentation.                             12
Bank of America Corporation
Global Consumer and Small Business Banking Business Results: Customer Relationship View (1)
(Dollars in millions)


                                                                               Three Months Ended March 31, 2007                                                                       Three Months Ended March 31, 2006

                                                                                                                            Mass Market and                                                                          Mass Market and
                                                                                                                            Small Business                                                                           Small Business
                                                                  Total                          Consumer                      Banking                                 Total                      Consumer              Banking

                         (2)
Net interest income                                                    $7,028                            $6,152                             $876                             $7,092                     $6,345                 $747
Noninterest income                                                      4,394                             3,839                              555                              3,750                      3,259                  491
Total revenue (2)                                                      11,422                              9,991                            1,431                            10,842                      9,604                 1,238

Managed credit impact                                                   2,411                             2,128                              283                              1,901                      1,756                  145
Gains (losses) on sales of debt securities                                 (1)                               (1)                               -                                 (1)                        (1)                   -
Noninterest expense                                                     4,728                             4,286                              442                              4,612                      4,172                  440
                             (2)
Income before income taxes                                              4,282                             3,576                              706                              4,328                      3,675                  653
Income tax expense                                                      1,586                             1,326                              260                              1,604                      1,363                  241
Net income                                                             $2,696                            $2,250                             $446                             $2,724                     $2,312                 $412


(1) Presented on a managed view, specifically Card Services.
(2) Fully taxable-equivalent basis


Certain prior period amounts have been reclassified among the segments to conform to the current period presentation.


                                                                                    This information is preliminary and based on company data available at the time of the presentation.                                               13
Bank of America Corporation
Global Consumer and Small Business Banking - Key Indicators
(Dollars in millions; except as noted)


                                                                  First                    Fourth                   Third                   Second                First
                                                                 Quarter                   Quarter                 Quarter                  Quarter              Quarter
                                                                  2007                      2006                    2006                     2006                 2006

Deposits Key Indicators
Average Deposit Balances
 Checking                                                          $125,127                $124,441                 $125,809                    $128,737         $127,362
 Savings                                                             29,732                  29,889                   31,058                      32,303           31,954
 MMS                                                                 64,159                  66,066                   69,049                      72,242           75,635
 CD's & IRA's                                                        99,563                  99,165                   97,514                      93,803           89,713
 Foreign and other                                                    2,364                   2,330                    2,600                       2,817            2,534
   Total                                                           $320,945                $321,891                 $326,030                    $329,902         $327,198

  Total balances migrated to
   Premier Banking and Investments                                    $3,551                  $3,667                   $1,671                     $2,111           $3,238

Deposit Spreads (excludes noninterest costs)
 Checking                                                                 4.24 %                  4.23 %                   4.19 %                   4.18 %            4.17 %
 Savings                                                                  3.77                    3.70                     3.45                     3.40              3.38
 MMS                                                                      3.42                    3.25                     2.87                     2.76              2.53
 CD's & IRA's                                                             1.13                    1.11                     1.21                     1.24              1.24
 Foreign and other                                                        4.41                    4.27                     4.23                     4.25              4.27
  Total                                                                   3.05                    3.00                     2.93                     2.94              2.90

Net new retail checking (units in thousands)                            487                      363                     744                         701              603
Debit purchase volumes                                              $43,569                  $45,121                 $42,790                     $42,596          $38,519

Online Banking (end of period)
 Active accounts (units in thousands)                                 21,813                  21,250                   20,576                     19,806           19,643
 Active billpay accounts (units in thousands)                         11,285                  11,101                   10,838                     10,410           10,088


Card Services Key Indicators
Managed Card - US Consumer and Business Card
 Gross interest yield                                                  12.85 %                  12.98 %                  12.85 %                   12.52 %          12.54 %
                            (1)
 Risk adjusted margin                                                  7.82                    8.74                     8.84                        9.50            10.39
 Loss rates                                                            4.81                    4.57                     4.18                        3.55             3.07
 Average outstandings                                              $147,980                $146,939                 $145,518                    $143,443         $144,665
 Ending outstandings                                                146,013                 150,731                  145,891                     144,142          142,409
 New account growth (in thousands)                                    2,134                   2,488                    2,516                       2,328            2,157
 Purchase volumes                                                   $55,517                 $62,073                  $60,662                     $59,817          $53,507
 Delinquencies
  30 Day                                                                  5.44 %                  5.49 %                   5.14 %                   4.73 %            4.48 %
  90 Day                                                                  2.88                    2.66                     2.38                     2.30              2.04
Merchant Acquiring Business
 Processing volume                                                  $82,828                  $95,173                 $97,044                     $97,229          $88,324
 Total transactions (units in thousands)                              1,912                    2,102                   2,101                       2,069            1,887

Consumer Real Estate
 Mortgage servicing rights
   period end balance                                                 $2,963                  $2,869                   $2,932                     $3,083           $2,925
 Capitalized mortgage servicing rights
    (% of loans serviced)                                                127     bps              125     bps              127    bps               139    bps        132   bps
 Mortgage loans serviced for investors (in
      billions)                                                         $234                     $230                    $230                      $221              $221
Global Consumer and Small Business Banking
 Mortgage originations                                              $20,646                  $21,370                 $19,095                     $20,968          $15,480
 Home equity originations                                            15,966                   17,004                  16,984                      16,915           14,701
Total Corporation
 Mortgage originations                                                23,449                  23,701                   21,222                     23,372           17,212
 Home equity originations                                             19,653                  20,425                   20,681                     21,141           18,562


(1) Reflects margin and noninterest revenue, adjusted for loss rates.

Certain prior period amounts have been reclassified among the segments to conform to the current period presentation.


                                         This information is preliminary and based on company data available at the time of the presentation.                                     14
Supplemental Q1 2007 Financial Data

More Related Content

What's hot

citi July 16, 2001 - Second Quarter Financial Supplement
citi July 16, 2001 - Second Quarter Financial Supplementciti July 16, 2001 - Second Quarter Financial Supplement
citi July 16, 2001 - Second Quarter Financial SupplementQuarterlyEarningsReports
 
citigroup October 20, 2003 - Third Quarter Financial Supplement
citigroup October 20, 2003 - Third Quarter Financial Supplementcitigroup October 20, 2003 - Third Quarter Financial Supplement
citigroup October 20, 2003 - Third Quarter Financial SupplementQuarterlyEarningsReports
 
citigroup July 14, 2003 - Second Quarter Financial Supplement
citigroup July 14, 2003 - Second Quarter Financial Supplementcitigroup July 14, 2003 - Second Quarter Financial Supplement
citigroup July 14, 2003 - Second Quarter Financial SupplementQuarterlyEarningsReports
 
lincoln national lncstat 3q 08
lincoln national lncstat 3q 08lincoln national lncstat 3q 08
lincoln national lncstat 3q 08finance25
 
citi group January 21, 2003 - Fourth Quarter Press Release
citi group January 21, 2003 - Fourth Quarter Press Releaseciti group January 21, 2003 - Fourth Quarter Press Release
citi group January 21, 2003 - Fourth Quarter Press ReleaseQuarterlyEarningsReports
 
citigroup July 19, 2000 - Second Quarter Financial Supplement
citigroup July 19, 2000 - Second Quarter Financial Supplementcitigroup July 19, 2000 - Second Quarter Financial Supplement
citigroup July 19, 2000 - Second Quarter Financial SupplementQuarterlyEarningsReports
 
citigroup April 17, 2000 - First Quarter Financial Supplement
citigroup April 17, 2000 - First Quarter Financial Supplementcitigroup April 17, 2000 - First Quarter Financial Supplement
citigroup April 17, 2000 - First Quarter Financial SupplementQuarterlyEarningsReports
 
lincoln national lncstat2q 08
lincoln national lncstat2q 08lincoln national lncstat2q 08
lincoln national lncstat2q 08finance25
 
citigroup October 16, 2008 - Third Quarter Press Release
citigroup October 16, 2008 - Third Quarter Press Releasecitigroup October 16, 2008 - Third Quarter Press Release
citigroup October 16, 2008 - Third Quarter Press ReleaseQuarterlyEarningsReports
 
citigroup January 17, 2002 - Fourth Quarter Financial Supplement
citigroup January 17, 2002 - Fourth Quarter  Financial Supplementcitigroup January 17, 2002 - Fourth Quarter  Financial Supplement
citigroup January 17, 2002 - Fourth Quarter Financial SupplementQuarterlyEarningsReports
 

What's hot (16)

citigroup July 20, 2007 - Second Quarter
citigroup July 20, 2007 - Second Quartercitigroup July 20, 2007 - Second Quarter
citigroup July 20, 2007 - Second Quarter
 
citigroup Financial Supplement
citigroup Financial Supplementcitigroup Financial Supplement
citigroup Financial Supplement
 
citigroup Financial Supplement
citigroup Financial Supplementcitigroup Financial Supplement
citigroup Financial Supplement
 
citi July 16, 2001 - Second Quarter Financial Supplement
citi July 16, 2001 - Second Quarter Financial Supplementciti July 16, 2001 - Second Quarter Financial Supplement
citi July 16, 2001 - Second Quarter Financial Supplement
 
citigroup October 20, 2003 - Third Quarter Financial Supplement
citigroup October 20, 2003 - Third Quarter Financial Supplementcitigroup October 20, 2003 - Third Quarter Financial Supplement
citigroup October 20, 2003 - Third Quarter Financial Supplement
 
citigroup July 14, 2003 - Second Quarter Financial Supplement
citigroup July 14, 2003 - Second Quarter Financial Supplementcitigroup July 14, 2003 - Second Quarter Financial Supplement
citigroup July 14, 2003 - Second Quarter Financial Supplement
 
lincoln national lncstat 3q 08
lincoln national lncstat 3q 08lincoln national lncstat 3q 08
lincoln national lncstat 3q 08
 
citi group January 21, 2003 - Fourth Quarter Press Release
citi group January 21, 2003 - Fourth Quarter Press Releaseciti group January 21, 2003 - Fourth Quarter Press Release
citi group January 21, 2003 - Fourth Quarter Press Release
 
credit suisse Financial Statements
credit suisse Financial Statements credit suisse Financial Statements
credit suisse Financial Statements
 
citigroup July 19, 2000 - Second Quarter Financial Supplement
citigroup July 19, 2000 - Second Quarter Financial Supplementcitigroup July 19, 2000 - Second Quarter Financial Supplement
citigroup July 19, 2000 - Second Quarter Financial Supplement
 
citigroup April 17, 2000 - First Quarter Financial Supplement
citigroup April 17, 2000 - First Quarter Financial Supplementcitigroup April 17, 2000 - First Quarter Financial Supplement
citigroup April 17, 2000 - First Quarter Financial Supplement
 
lincoln national lncstat2q 08
lincoln national lncstat2q 08lincoln national lncstat2q 08
lincoln national lncstat2q 08
 
citigroup October 15, 2007 - Third Quarte
citigroup October 15, 2007 - Third Quartecitigroup October 15, 2007 - Third Quarte
citigroup October 15, 2007 - Third Quarte
 
citigroup October 16, 2008 - Third Quarter Press Release
citigroup October 16, 2008 - Third Quarter Press Releasecitigroup October 16, 2008 - Third Quarter Press Release
citigroup October 16, 2008 - Third Quarter Press Release
 
citigroup January 17, 2002 - Fourth Quarter Financial Supplement
citigroup January 17, 2002 - Fourth Quarter  Financial Supplementcitigroup January 17, 2002 - Fourth Quarter  Financial Supplement
citigroup January 17, 2002 - Fourth Quarter Financial Supplement
 
citigroup Financial Supplement
citigroup Financial Supplementcitigroup Financial Supplement
citigroup Financial Supplement
 

Viewers also liked

Supplemental Fourth Quarter 2006 Financial Information
	Supplemental Fourth Quarter 2006 Financial Information	Supplemental Fourth Quarter 2006 Financial Information
Supplemental Fourth Quarter 2006 Financial InformationQuarterlyEarningsReports3
 
BANK OF AMERICA 2005 Summary Annual Report and Form 10-K
BANK OF AMERICA 2005 Summary Annual Report and Form 10-KBANK OF AMERICA 2005 Summary Annual Report and Form 10-K
BANK OF AMERICA 2005 Summary Annual Report and Form 10-KQuarterlyEarningsReports3
 
Lehman Brothers 5th Annual Financial Services Conference
Lehman Brothers 5th Annual Financial Services ConferenceLehman Brothers 5th Annual Financial Services Conference
Lehman Brothers 5th Annual Financial Services ConferenceQuarterlyEarningsReports3
 

Viewers also liked (6)

BANK OF AMERICA 1998 Annual Report
BANK OF AMERICA 1998 Annual ReportBANK OF AMERICA 1998 Annual Report
BANK OF AMERICA 1998 Annual Report
 
Supplemental Fourth Quarter 2006 Financial Information
	Supplemental Fourth Quarter 2006 Financial Information	Supplemental Fourth Quarter 2006 Financial Information
Supplemental Fourth Quarter 2006 Financial Information
 
BANK OF AMERICA 2005 Summary Annual Report and Form 10-K
BANK OF AMERICA 2005 Summary Annual Report and Form 10-KBANK OF AMERICA 2005 Summary Annual Report and Form 10-K
BANK OF AMERICA 2005 Summary Annual Report and Form 10-K
 
Fourth Quarter 2005 Earnings Presentation
Fourth Quarter 2005 Earnings PresentationFourth Quarter 2005 Earnings Presentation
Fourth Quarter 2005 Earnings Presentation
 
Welcome Remarks and Strategic Overview
	Welcome Remarks and Strategic Overview	Welcome Remarks and Strategic Overview
Welcome Remarks and Strategic Overview
 
Lehman Brothers 5th Annual Financial Services Conference
Lehman Brothers 5th Annual Financial Services ConferenceLehman Brothers 5th Annual Financial Services Conference
Lehman Brothers 5th Annual Financial Services Conference
 

Similar to Supplemental Q1 2007 Financial Data

citigroup January 20, 2004 - Fourth Quarter Financial Supplement
citigroup January 20, 2004 - Fourth Quarter Financial Supplementcitigroup January 20, 2004 - Fourth Quarter Financial Supplement
citigroup January 20, 2004 - Fourth Quarter Financial SupplementQuarterlyEarningsReports
 
lincoln national stat1q08_rev
lincoln national stat1q08_revlincoln national stat1q08_rev
lincoln national stat1q08_revfinance25
 
citigroup Financial Supplement July 18, 2008 - Second Quarter
citigroup Financial Supplement July 18, 2008 - Second Quartercitigroup Financial Supplement July 18, 2008 - Second Quarter
citigroup Financial Supplement July 18, 2008 - Second QuarterQuarterlyEarningsReports
 
citigroup April 16, 2001 - First Quarter Financial Supplement
citigroup April 16, 2001 - First Quarter  Financial Supplementcitigroup April 16, 2001 - First Quarter  Financial Supplement
citigroup April 16, 2001 - First Quarter Financial SupplementQuarterlyEarningsReports
 
lincoln national stat3q08
lincoln national stat3q08lincoln national stat3q08
lincoln national stat3q08finance25
 
unum group _10/17/05
unum group _10/17/05unum group _10/17/05
unum group _10/17/05finance26
 
unum group _10/17/05
unum group _10/17/05unum group _10/17/05
unum group _10/17/05finance26
 
Q1 2009 Earning Report of WESCO International, Inc.
Q1 2009 Earning Report of WESCO International, Inc.Q1 2009 Earning Report of WESCO International, Inc.
Q1 2009 Earning Report of WESCO International, Inc.earningreport earningreport
 
unum group 4Q 08_Statistical_Supplement
unum group   4Q 08_Statistical_Supplementunum group   4Q 08_Statistical_Supplement
unum group 4Q 08_Statistical_Supplementfinance26
 
lincoln national stat2q08
lincoln national stat2q08lincoln national stat2q08
lincoln national stat2q08finance25
 

Similar to Supplemental Q1 2007 Financial Data (16)

citigroup January 20, 2004 - Fourth Quarter Financial Supplement
citigroup January 20, 2004 - Fourth Quarter Financial Supplementcitigroup January 20, 2004 - Fourth Quarter Financial Supplement
citigroup January 20, 2004 - Fourth Quarter Financial Supplement
 
lincoln national stat1q08_rev
lincoln national stat1q08_revlincoln national stat1q08_rev
lincoln national stat1q08_rev
 
citigroup Financial Supplement July 18, 2008 - Second Quarter
citigroup Financial Supplement July 18, 2008 - Second Quartercitigroup Financial Supplement July 18, 2008 - Second Quarter
citigroup Financial Supplement July 18, 2008 - Second Quarter
 
standardchartered Final Results 2004
standardchartered  	Final Results 2004standardchartered  	Final Results 2004
standardchartered Final Results 2004
 
citigroup April 16, 2001 - First Quarter Financial Supplement
citigroup April 16, 2001 - First Quarter  Financial Supplementcitigroup April 16, 2001 - First Quarter  Financial Supplement
citigroup April 16, 2001 - First Quarter Financial Supplement
 
citigroup Qer084s
citigroup Qer084scitigroup Qer084s
citigroup Qer084s
 
citigroup Financial Supplement
citigroup Financial Supplementcitigroup Financial Supplement
citigroup Financial Supplement
 
credit suisse financialstatements
credit suisse financialstatementscredit suisse financialstatements
credit suisse financialstatements
 
lincoln national stat3q08
lincoln national stat3q08lincoln national stat3q08
lincoln national stat3q08
 
citigroup Qer084s
citigroup Qer084scitigroup Qer084s
citigroup Qer084s
 
unum group _10/17/05
unum group _10/17/05unum group _10/17/05
unum group _10/17/05
 
unum group _10/17/05
unum group _10/17/05unum group _10/17/05
unum group _10/17/05
 
Q1 2009 Earning Report of WESCO International, Inc.
Q1 2009 Earning Report of WESCO International, Inc.Q1 2009 Earning Report of WESCO International, Inc.
Q1 2009 Earning Report of WESCO International, Inc.
 
unum group 4Q 08_Statistical_Supplement
unum group   4Q 08_Statistical_Supplementunum group   4Q 08_Statistical_Supplement
unum group 4Q 08_Statistical_Supplement
 
citigroup Financial Supplement
citigroup Financial Supplementcitigroup Financial Supplement
citigroup Financial Supplement
 
lincoln national stat2q08
lincoln national stat2q08lincoln national stat2q08
lincoln national stat2q08
 

More from QuarterlyEarningsReports3

Innovating Through Recession by Andrew Razeghi of Kellog School of Management
Innovating Through Recession by Andrew Razeghi of Kellog School of ManagementInnovating Through Recession by Andrew Razeghi of Kellog School of Management
Innovating Through Recession by Andrew Razeghi of Kellog School of ManagementQuarterlyEarningsReports3
 
Skive Magazine Quarterly - Issue 10, December 2008
Skive Magazine Quarterly - Issue 10, December 2008Skive Magazine Quarterly - Issue 10, December 2008
Skive Magazine Quarterly - Issue 10, December 2008QuarterlyEarningsReports3
 

More from QuarterlyEarningsReports3 (20)

Heavenly Dishes cookbook
Heavenly Dishes cookbookHeavenly Dishes cookbook
Heavenly Dishes cookbook
 
Innovating Through Recession by Andrew Razeghi of Kellog School of Management
Innovating Through Recession by Andrew Razeghi of Kellog School of ManagementInnovating Through Recession by Andrew Razeghi of Kellog School of Management
Innovating Through Recession by Andrew Razeghi of Kellog School of Management
 
Lehman Brothers Annual Report 2007
Lehman Brothers Annual Report 2007Lehman Brothers Annual Report 2007
Lehman Brothers Annual Report 2007
 
Bear Stearns Annual Report 2006
Bear Stearns Annual Report 2006Bear Stearns Annual Report 2006
Bear Stearns Annual Report 2006
 
AIG Annual Report 2007
AIG Annual Report 2007AIG Annual Report 2007
AIG Annual Report 2007
 
Financial Development Report 2008
Financial Development Report 2008Financial Development Report 2008
Financial Development Report 2008
 
Milken Institute - Mortgage Crisis Overview
Milken Institute - Mortgage Crisis OverviewMilken Institute - Mortgage Crisis Overview
Milken Institute - Mortgage Crisis Overview
 
U.S. Financial Crisis
U.S. Financial CrisisU.S. Financial Crisis
U.S. Financial Crisis
 
Fannie Mae Annual Report 2007
Fannie Mae Annual Report 2007Fannie Mae Annual Report 2007
Fannie Mae Annual Report 2007
 
Freddie Mac Annual Report 2007
Freddie Mac Annual Report 2007Freddie Mac Annual Report 2007
Freddie Mac Annual Report 2007
 
Merrill Lynch Annual Report 2007
Merrill Lynch Annual Report 2007Merrill Lynch Annual Report 2007
Merrill Lynch Annual Report 2007
 
Financial Development Report 2008
Financial Development Report 2008Financial Development Report 2008
Financial Development Report 2008
 
Fannie Mae Annual Report 2007
Fannie Mae Annual Report 2007Fannie Mae Annual Report 2007
Fannie Mae Annual Report 2007
 
Skive Magazine Quarterly - Issue 10, December 2008
Skive Magazine Quarterly - Issue 10, December 2008Skive Magazine Quarterly - Issue 10, December 2008
Skive Magazine Quarterly - Issue 10, December 2008
 
Global Risks Report 2009
Global Risks Report 2009Global Risks Report 2009
Global Risks Report 2009
 
Moneytree Analyst Call Q408
Moneytree Analyst Call Q408Moneytree Analyst Call Q408
Moneytree Analyst Call Q408
 
hp 2002 Transcript
hp 2002 Transcripthp 2002 Transcript
hp 2002 Transcript
 
hp 2005 Presentation
hp 2005  Presentationhp 2005  Presentation
hp 2005 Presentation
 
hp 2006 Presentation
hp 2006 Presentationhp 2006 Presentation
hp 2006 Presentation
 
hp 2004 /2003Financial Overview
hp 2004 /2003Financial Overviewhp 2004 /2003Financial Overview
hp 2004 /2003Financial Overview
 

Recently uploaded

Independent Call Girl Number in Kurla Mumbai📲 Pooja Nehwal 9892124323 💞 Full ...
Independent Call Girl Number in Kurla Mumbai📲 Pooja Nehwal 9892124323 💞 Full ...Independent Call Girl Number in Kurla Mumbai📲 Pooja Nehwal 9892124323 💞 Full ...
Independent Call Girl Number in Kurla Mumbai📲 Pooja Nehwal 9892124323 💞 Full ...Pooja Nehwal
 
Andheri Call Girls In 9825968104 Mumbai Hot Models
Andheri Call Girls In 9825968104 Mumbai Hot ModelsAndheri Call Girls In 9825968104 Mumbai Hot Models
Andheri Call Girls In 9825968104 Mumbai Hot Modelshematsharma006
 
Solution Manual for Financial Accounting, 11th Edition by Robert Libby, Patri...
Solution Manual for Financial Accounting, 11th Edition by Robert Libby, Patri...Solution Manual for Financial Accounting, 11th Edition by Robert Libby, Patri...
Solution Manual for Financial Accounting, 11th Edition by Robert Libby, Patri...ssifa0344
 
VIP Kolkata Call Girl Serampore 👉 8250192130 Available With Room
VIP Kolkata Call Girl Serampore 👉 8250192130  Available With RoomVIP Kolkata Call Girl Serampore 👉 8250192130  Available With Room
VIP Kolkata Call Girl Serampore 👉 8250192130 Available With Roomdivyansh0kumar0
 
(DIYA) Bhumkar Chowk Call Girls Just Call 7001035870 [ Cash on Delivery ] Pun...
(DIYA) Bhumkar Chowk Call Girls Just Call 7001035870 [ Cash on Delivery ] Pun...(DIYA) Bhumkar Chowk Call Girls Just Call 7001035870 [ Cash on Delivery ] Pun...
(DIYA) Bhumkar Chowk Call Girls Just Call 7001035870 [ Cash on Delivery ] Pun...ranjana rawat
 
20240417-Calibre-April-2024-Investor-Presentation.pdf
20240417-Calibre-April-2024-Investor-Presentation.pdf20240417-Calibre-April-2024-Investor-Presentation.pdf
20240417-Calibre-April-2024-Investor-Presentation.pdfAdnet Communications
 
VVIP Pune Call Girls Katraj (7001035870) Pune Escorts Nearby with Complete Sa...
VVIP Pune Call Girls Katraj (7001035870) Pune Escorts Nearby with Complete Sa...VVIP Pune Call Girls Katraj (7001035870) Pune Escorts Nearby with Complete Sa...
VVIP Pune Call Girls Katraj (7001035870) Pune Escorts Nearby with Complete Sa...Call Girls in Nagpur High Profile
 
Lundin Gold April 2024 Corporate Presentation v4.pdf
Lundin Gold April 2024 Corporate Presentation v4.pdfLundin Gold April 2024 Corporate Presentation v4.pdf
Lundin Gold April 2024 Corporate Presentation v4.pdfAdnet Communications
 
Interimreport1 January–31 March2024 Elo Mutual Pension Insurance Company
Interimreport1 January–31 March2024 Elo Mutual Pension Insurance CompanyInterimreport1 January–31 March2024 Elo Mutual Pension Insurance Company
Interimreport1 January–31 March2024 Elo Mutual Pension Insurance CompanyTyöeläkeyhtiö Elo
 
Stock Market Brief Deck for 4/24/24 .pdf
Stock Market Brief Deck for 4/24/24 .pdfStock Market Brief Deck for 4/24/24 .pdf
Stock Market Brief Deck for 4/24/24 .pdfMichael Silva
 
05_Annelore Lenoir_Docbyte_MeetupDora&Cybersecurity.pptx
05_Annelore Lenoir_Docbyte_MeetupDora&Cybersecurity.pptx05_Annelore Lenoir_Docbyte_MeetupDora&Cybersecurity.pptx
05_Annelore Lenoir_Docbyte_MeetupDora&Cybersecurity.pptxFinTech Belgium
 
03_Emmanuel Ndiaye_Degroof Petercam.pptx
03_Emmanuel Ndiaye_Degroof Petercam.pptx03_Emmanuel Ndiaye_Degroof Petercam.pptx
03_Emmanuel Ndiaye_Degroof Petercam.pptxFinTech Belgium
 
Bladex Earnings Call Presentation 1Q2024
Bladex Earnings Call Presentation 1Q2024Bladex Earnings Call Presentation 1Q2024
Bladex Earnings Call Presentation 1Q2024Bladex
 
Instant Issue Debit Cards - School Designs
Instant Issue Debit Cards - School DesignsInstant Issue Debit Cards - School Designs
Instant Issue Debit Cards - School Designsegoetzinger
 
Monthly Market Risk Update: April 2024 [SlideShare]
Monthly Market Risk Update: April 2024 [SlideShare]Monthly Market Risk Update: April 2024 [SlideShare]
Monthly Market Risk Update: April 2024 [SlideShare]Commonwealth
 
Instant Issue Debit Cards - High School Spirit
Instant Issue Debit Cards - High School SpiritInstant Issue Debit Cards - High School Spirit
Instant Issue Debit Cards - High School Spiritegoetzinger
 
Malad Call Girl in Services 9892124323 | ₹,4500 With Room Free Delivery
Malad Call Girl in Services  9892124323 | ₹,4500 With Room Free DeliveryMalad Call Girl in Services  9892124323 | ₹,4500 With Room Free Delivery
Malad Call Girl in Services 9892124323 | ₹,4500 With Room Free DeliveryPooja Nehwal
 
The Economic History of the U.S. Lecture 18.pdf
The Economic History of the U.S. Lecture 18.pdfThe Economic History of the U.S. Lecture 18.pdf
The Economic History of the U.S. Lecture 18.pdfGale Pooley
 
The Economic History of the U.S. Lecture 19.pdf
The Economic History of the U.S. Lecture 19.pdfThe Economic History of the U.S. Lecture 19.pdf
The Economic History of the U.S. Lecture 19.pdfGale Pooley
 
call girls in Nand Nagri (DELHI) 🔝 >༒9953330565🔝 genuine Escort Service 🔝✔️✔️
call girls in  Nand Nagri (DELHI) 🔝 >༒9953330565🔝 genuine Escort Service 🔝✔️✔️call girls in  Nand Nagri (DELHI) 🔝 >༒9953330565🔝 genuine Escort Service 🔝✔️✔️
call girls in Nand Nagri (DELHI) 🔝 >༒9953330565🔝 genuine Escort Service 🔝✔️✔️9953056974 Low Rate Call Girls In Saket, Delhi NCR
 

Recently uploaded (20)

Independent Call Girl Number in Kurla Mumbai📲 Pooja Nehwal 9892124323 💞 Full ...
Independent Call Girl Number in Kurla Mumbai📲 Pooja Nehwal 9892124323 💞 Full ...Independent Call Girl Number in Kurla Mumbai📲 Pooja Nehwal 9892124323 💞 Full ...
Independent Call Girl Number in Kurla Mumbai📲 Pooja Nehwal 9892124323 💞 Full ...
 
Andheri Call Girls In 9825968104 Mumbai Hot Models
Andheri Call Girls In 9825968104 Mumbai Hot ModelsAndheri Call Girls In 9825968104 Mumbai Hot Models
Andheri Call Girls In 9825968104 Mumbai Hot Models
 
Solution Manual for Financial Accounting, 11th Edition by Robert Libby, Patri...
Solution Manual for Financial Accounting, 11th Edition by Robert Libby, Patri...Solution Manual for Financial Accounting, 11th Edition by Robert Libby, Patri...
Solution Manual for Financial Accounting, 11th Edition by Robert Libby, Patri...
 
VIP Kolkata Call Girl Serampore 👉 8250192130 Available With Room
VIP Kolkata Call Girl Serampore 👉 8250192130  Available With RoomVIP Kolkata Call Girl Serampore 👉 8250192130  Available With Room
VIP Kolkata Call Girl Serampore 👉 8250192130 Available With Room
 
(DIYA) Bhumkar Chowk Call Girls Just Call 7001035870 [ Cash on Delivery ] Pun...
(DIYA) Bhumkar Chowk Call Girls Just Call 7001035870 [ Cash on Delivery ] Pun...(DIYA) Bhumkar Chowk Call Girls Just Call 7001035870 [ Cash on Delivery ] Pun...
(DIYA) Bhumkar Chowk Call Girls Just Call 7001035870 [ Cash on Delivery ] Pun...
 
20240417-Calibre-April-2024-Investor-Presentation.pdf
20240417-Calibre-April-2024-Investor-Presentation.pdf20240417-Calibre-April-2024-Investor-Presentation.pdf
20240417-Calibre-April-2024-Investor-Presentation.pdf
 
VVIP Pune Call Girls Katraj (7001035870) Pune Escorts Nearby with Complete Sa...
VVIP Pune Call Girls Katraj (7001035870) Pune Escorts Nearby with Complete Sa...VVIP Pune Call Girls Katraj (7001035870) Pune Escorts Nearby with Complete Sa...
VVIP Pune Call Girls Katraj (7001035870) Pune Escorts Nearby with Complete Sa...
 
Lundin Gold April 2024 Corporate Presentation v4.pdf
Lundin Gold April 2024 Corporate Presentation v4.pdfLundin Gold April 2024 Corporate Presentation v4.pdf
Lundin Gold April 2024 Corporate Presentation v4.pdf
 
Interimreport1 January–31 March2024 Elo Mutual Pension Insurance Company
Interimreport1 January–31 March2024 Elo Mutual Pension Insurance CompanyInterimreport1 January–31 March2024 Elo Mutual Pension Insurance Company
Interimreport1 January–31 March2024 Elo Mutual Pension Insurance Company
 
Stock Market Brief Deck for 4/24/24 .pdf
Stock Market Brief Deck for 4/24/24 .pdfStock Market Brief Deck for 4/24/24 .pdf
Stock Market Brief Deck for 4/24/24 .pdf
 
05_Annelore Lenoir_Docbyte_MeetupDora&Cybersecurity.pptx
05_Annelore Lenoir_Docbyte_MeetupDora&Cybersecurity.pptx05_Annelore Lenoir_Docbyte_MeetupDora&Cybersecurity.pptx
05_Annelore Lenoir_Docbyte_MeetupDora&Cybersecurity.pptx
 
03_Emmanuel Ndiaye_Degroof Petercam.pptx
03_Emmanuel Ndiaye_Degroof Petercam.pptx03_Emmanuel Ndiaye_Degroof Petercam.pptx
03_Emmanuel Ndiaye_Degroof Petercam.pptx
 
Bladex Earnings Call Presentation 1Q2024
Bladex Earnings Call Presentation 1Q2024Bladex Earnings Call Presentation 1Q2024
Bladex Earnings Call Presentation 1Q2024
 
Instant Issue Debit Cards - School Designs
Instant Issue Debit Cards - School DesignsInstant Issue Debit Cards - School Designs
Instant Issue Debit Cards - School Designs
 
Monthly Market Risk Update: April 2024 [SlideShare]
Monthly Market Risk Update: April 2024 [SlideShare]Monthly Market Risk Update: April 2024 [SlideShare]
Monthly Market Risk Update: April 2024 [SlideShare]
 
Instant Issue Debit Cards - High School Spirit
Instant Issue Debit Cards - High School SpiritInstant Issue Debit Cards - High School Spirit
Instant Issue Debit Cards - High School Spirit
 
Malad Call Girl in Services 9892124323 | ₹,4500 With Room Free Delivery
Malad Call Girl in Services  9892124323 | ₹,4500 With Room Free DeliveryMalad Call Girl in Services  9892124323 | ₹,4500 With Room Free Delivery
Malad Call Girl in Services 9892124323 | ₹,4500 With Room Free Delivery
 
The Economic History of the U.S. Lecture 18.pdf
The Economic History of the U.S. Lecture 18.pdfThe Economic History of the U.S. Lecture 18.pdf
The Economic History of the U.S. Lecture 18.pdf
 
The Economic History of the U.S. Lecture 19.pdf
The Economic History of the U.S. Lecture 19.pdfThe Economic History of the U.S. Lecture 19.pdf
The Economic History of the U.S. Lecture 19.pdf
 
call girls in Nand Nagri (DELHI) 🔝 >༒9953330565🔝 genuine Escort Service 🔝✔️✔️
call girls in  Nand Nagri (DELHI) 🔝 >༒9953330565🔝 genuine Escort Service 🔝✔️✔️call girls in  Nand Nagri (DELHI) 🔝 >༒9953330565🔝 genuine Escort Service 🔝✔️✔️
call girls in Nand Nagri (DELHI) 🔝 >༒9953330565🔝 genuine Escort Service 🔝✔️✔️
 

Supplemental Q1 2007 Financial Data

  • 1. Supplemental Information First Quarter 2007 This information is preliminary and based on company data available at the time of the presentation. It speaks only as of the particular date or dates included in the accompanying pages. Bank of America does not undertake an obligation to, and disclaims any duty to, correct or update any of the information provided. Any forward-looking statements in this information are subject to the forward-looking language contained in Bank of America's reports filed with the SEC pursuant to the Securities Exchange Act of 1934, which are available at the SEC's website (www.sec.gov) or at Bank of America's website (www.bankofamerica.com). Bank of America's future financial performance is subject to risks and uncertainties as described in its SEC filings.
  • 2. Bank of America Corporation Table of Contents Page Consolidated Financial Highlights 2 Supplemental Financial Data 3 Consolidated Statement of Income 4 Consolidated Balance Sheet 5 Capital Management 6 Core Net Interest Income - Managed Basis 7 Quarterly Average Balances and Interest Rates 8 Quarterly Average Balances and Interest Rates - Isolating Hedge Income/Expense 9 Business Segment View Graphs 10 Global Consumer and Small Business Banking Total Segment Results 11 Quarter-to-Date Business Results 12 Customer Relationship View 13 Key Indicators 14 E-commerce & BankofAmerica.com 15 Credit Card Only 16 Global Corporate and Investment Banking Total Segment Results 17 Quarter-to-Date Business Results 18 Customer Relationship View 19 Business Lending Key Indicators 20 Capital Markets and Advisory Services Key Indicators 21 Securities Market Share and Industry Ranking Graph 22 Global Wealth and Investment Management Total Segment Results 23 Quarter-to-Date Business Results 24 Key Indicators 25 All Other Total Segment Results 26 Outstanding Loans & Leases 27 Commercial Credit Exposure by Industry 28 Net Credit Default Protection by Maturity Profile and Credit Exposure Debt Rating 29 Selected Emerging Markets 30 Nonperforming Assets 31 Quarterly Net Charge-offs and Net Charge-offs Ratios 32 Exhibit A: Non - GAAP Reconciliations Global Consumer and Small Business Banking - Reconciliation - Managed to GAAP 33 All Other - Reconciliation - Reported Basis to As Adjusted 34 Reconciliation of Net Charge-offs and Net Charge-off Ratios to Net Charge-offs and Net Charge-off Ratios Excluding the Impact of SOP 03-3 35 1
  • 3. Bank of America Corporation Consolidated Financial Highlights (Dollars in millions, except per share information; shares in thousands) First Fourth Third Second First Quarter Quarter Quarter Quarter Quarter 2007 2006 2006 2006 2006 Income statement Net interest income $8,268 $8,599 $8,586 $8,630 $8,776 Noninterest income 9,825 9,866 10,067 9,598 8,901 Total revenue 18,093 18,465 18,653 18,228 17,677 Provision for credit losses 1,235 1,570 1,165 1,005 1,270 Gains (losses) on sales of debt securities 62 21 (469) (9) 14 Noninterest expense 9,097 9,093 8,863 8,717 8,924 Income tax expense 2,568 2,567 2,740 3,022 2,511 Net income 5,255 5,256 5,416 5,475 4,986 Diluted earnings per common share 1.16 1.16 1.18 1.19 1.07 Average diluted common shares issued and outstanding 4,497,028 4,536,696 4,570,558 4,601,169 4,666,405 Dividends paid per common share $0.56 $0.56 $0.56 $0.50 $0.50 Performance ratios Return on average assets 1.40 % 1.39 % 1.43 % 1.51 % 1.43 % Return on average common shareholders' equity 16.16 15.76 16.64 17.26 15.44 At period end Book value per share of common stock $29.74 $29.70 $29.52 $28.17 $28.19 Market price per share of common stock: Closing price $51.02 $53.39 $53.57 $48.10 $45.54 High closing price for the period 54.05 54.90 53.57 50.47 47.08 Low closing price for the period 49.46 51.66 47.98 45.48 43.09 Market capitalization 226,481 238,021 240,966 217,794 208,633 Number of banking centers - domestic 5,737 5,747 5,722 5,779 5,786 Number of branded ATMs - domestic 17,117 17,079 16,846 16,984 16,716 Full-time equivalent employees 199,429 203,425 200,220 201,898 202,503 Certain prior period amounts have been reclassified to conform to current period presentation. This information is preliminary and based on company data available at the time of the presentation. 2
  • 4. Bank of America Corporation Supplemental Financial Data (Dollars in millions) Fully taxable-equivalent basis data First Fourth Third Second First Quarter Quarter Quarter Quarter Quarter 2007 2006 2006 2006 2006 Net interest income $8,597 $8,955 $8,894 $8,926 $9,040 Total revenue 18,422 18,821 18,961 18,524 17,941 Net interest yield 2.61 % 2.75 % 2.73 % 2.85 % 2.98 % Efficiency ratio 49.38 48.31 46.75 47.06 49.74 Reconciliation to GAAP financial measures Supplemental financial data presented on an operating basis is a basis of presentation not defined by accounting principles generally accepted in the United States (GAAP) that excludes merger and restructuring charges. We believe that the exclusion of merger and restructuring charges, which represent events outside our normal operations, provides a meaningful period-to-period comparison and is more reflective of normalized operations. Shareholder value added (SVA) is a key measure of performance not defined by GAAP that is used in managing our growth strategy orientation and strengthening our focus on generating long-term growth and shareholder value. SVA is used to evaluate the Corporation's use of equity (i.e., capital) at the individual unit level and is an integral component in the analytics for resource allocation. Using SVA as a performance measure places specific focus on whether incremental investments generate returns in excess of the costs of capital associated with those investments. Each business segment has a goal for growth in SVA reflecting the individual segment's business and customer strategy. Other companies may define or calculate supplemental financial data differently. See the tables below for supplemental financial data and corresponding reconciliations to GAAP financial measures for the quarters ended March 31, 2007, December 31, 2006, September 30, 2006, June 30, 2006, and March 31, 2006. Reconciliation of net income to operating earnings First Fourth Third Second First Quarter Quarter Quarter Quarter Quarter 2007 2006 2006 2006 2006 Net income $5,255 $5,256 $5,416 $5,475 $4,986 Merger and restructuring charges 111 244 269 194 98 Related income tax benefit (41) (90) (100) (71) (37) Operating earnings $5,325 $5,410 $5,585 $5,598 $5,047 Reconciliation of average shareholders' equity to average tangible shareholders' equity Average shareholders' equity $133,588 $134,047 $129,262 $127,373 $131,153 Average goodwill (65,703) (65,766) (66,077) (66,226) (66,094) Average tangible shareholders' equity $67,885 $68,281 $63,185 $61,147 $65,059 Operating basis Diluted earnings per common share $1.17 $1.19 $1.22 $1.22 $1.08 Return on average assets 1.42 % 1.44 % 1.48 % 1.54 % 1.45 % Return on average common shareholders' equity 16.38 16.22 17.16 17.65 15.63 Return on average tangible shareholders' equity 31.81 31.44 35.07 36.72 31.46 Efficiency ratio (1) 48.78 47.02 45.33 46.01 49.19 Reconciliation of net income to shareholder value added Net income $5,255 $5,256 $5,416 $5,475 $4,986 Amortization of intangibles 389 433 441 441 440 Merger and restructuring charges, net of tax benefit 70 154 169 123 61 Capital charge (3,546) (3,659) (3,580) (3,485) (3,550) Shareholder value added $2,168 $2,184 $2,446 $2,554 $1,937 (1) Fully taxable-equivalent basis Certain prior period amounts have been reclassified to conform to current period presentation. This information is preliminary and based on company data available at the time of the presentation. 3
  • 5. Bank of America Corporation Consolidated Statement of Income (Dollars in millions, except per share information; shares in thousands) First Fourth Third Second First Quarter Quarter Quarter Quarter Quarter 2007 2006 2006 2006 2006 Interest income Interest and fees on loans and leases $12,884 $12,705 $12,638 $11,804 $11,127 Interest and dividends on debt securities 2,380 2,440 3,080 3,121 3,014 Federal funds sold and securities purchased under agreements to resell 1,979 2,068 2,146 1,900 1,709 Trading account assets 2,273 2,201 1,856 1,627 1,548 Other interest income 1,044 1,077 952 845 727 Total interest income 20,560 20,491 20,672 19,297 18,125 Interest expense Deposits 4,034 3,989 3,976 3,508 3,007 Short-term borrowings 5,318 5,222 5,467 4,842 4,309 Trading account liabilities 892 800 727 596 517 Long-term debt 2,048 1,881 1,916 1,721 1,516 Total interest expense 12,292 11,892 12,086 10,667 9,349 Net interest income 8,268 8,599 8,586 8,630 8,776 Noninterest income Card income 3,333 3,719 3,473 3,664 3,434 Service charges 2,072 2,099 2,147 2,077 1,901 Investment and brokerage services 1,149 1,122 1,085 1,146 1,103 Investment banking income 638 694 510 612 501 Equity investment gains 1,014 1,067 705 699 718 Trading account profits 872 460 731 915 1,060 Mortgage banking income 213 126 189 89 137 Other income 534 579 1,227 396 47 Total noninterest income 9,825 9,866 10,067 9,598 8,901 Total revenue 18,093 18,465 18,653 18,228 17,677 Provision for credit losses 1,235 1,570 1,165 1,005 1,270 Gains (losses) on sales of debt securities 62 21 (469) (9) 14 Noninterest expense Personnel 5,025 4,444 4,474 4,480 4,813 Occupancy 713 726 696 703 701 Equipment 350 351 318 316 344 Marketing 555 623 587 551 575 Professional fees 229 368 259 233 218 Amortization of intangibles 389 433 441 441 440 Data processing 437 487 426 409 410 Telecommunications 251 260 237 228 220 Other general operating 1,037 1,157 1,156 1,162 1,105 Merger and restructuring charges 111 244 269 194 98 Total noninterest expense 9,097 9,093 8,863 8,717 8,924 Income before income taxes 7,823 7,823 8,156 8,497 7,497 Income tax expense 2,568 2,567 2,740 3,022 2,511 Net income $5,255 $5,256 $5,416 $5,475 $4,986 Net income available to common shareholders $5,209 $5,243 $5,416 $5,471 $4,981 Per common share information Earnings $1.18 $1.17 $1.20 $1.21 $1.08 Diluted earnings $1.16 $1.16 $1.18 $1.19 $1.07 Dividends paid $0.56 $0.56 $0.56 $0.50 $0.50 Average common shares issued and outstanding 4,432,664 4,464,110 4,499,704 4,534,627 4,609,481 Average diluted common shares issued and outstanding 4,497,028 4,536,696 4,570,558 4,601,169 4,666,405 Certain prior period amounts have been reclassified to conform to current period presentation. This information is preliminary and based on company data available at the time of the presentation. 4
  • 6. Bank of America Corporation Consolidated Balance Sheet (Dollars in millions) March 31 December 31 March 31 2007 2006 2006 Assets Cash and cash equivalents $31,549 $36,429 $32,575 Time deposits placed and other short-term investments 12,037 13,952 11,157 Federal funds sold and securities purchased under agreements to resell 138,646 135,478 137,081 Trading account assets 174,218 153,052 117,181 Derivative assets 25,279 23,439 23,291 Debt securities: Available-for-sale 180,961 192,806 237,987 Held-to-maturity, at cost 925 40 86 Total debt securities 181,886 192,846 238,073 Loans and leases 723,633 706,490 619,525 Allowance for loan and lease losses (8,732) (9,016) (9,067) Loans and leases, net of allowance 714,901 697,474 610,458 Premises and equipment, net 9,271 9,255 9,267 Mortgage servicing rights (includes $2,963; $2,869 and $2,925 measured at fair value at March 31, 2007, December 31, 2006 and March 31, 2006) 3,141 3,045 3,070 Goodwill 65,696 65,662 66,271 Intangible assets 9,217 9,422 10,681 Other assets 136,316 119,683 115,975 Total assets $1,502,157 $1,459,737 $1,375,080 Liabilities Deposits in domestic offices: Noninterest-bearing $174,082 $180,231 $179,358 Interest-bearing 425,197 418,100 415,769 Deposits in foreign offices: Noninterest-bearing 3,346 4,577 6,874 Interest-bearing 90,176 90,589 80,448 Total deposits 692,801 693,497 682,449 Federal funds purchased and securities sold under agreements to repurchase 234,413 217,527 236,919 Trading account liabilities 77,289 67,670 51,100 Derivative liabilities 17,946 16,339 15,541 Commercial paper and other short-term borrowings 156,844 141,300 99,389 Accrued expenses and other liabilities (includes $374, $397, and $395 of reserve for unfunded lending commitments) 35,446 42,132 37,078 Long-term debt 152,562 146,000 123,178 Total liabilities 1,367,301 1,324,465 1,245,654 Shareholders' equity Preferred stock, $0.01 par value; authorized - 100,000,000 shares; issued and outstanding - 121,739; 121,739 and 1,090,189 shares 2,851 2,851 271 Common stock and additional paid-in capital, $0.01 par value; authorized - 7,500,000,000 shares; issued and outstanding - 4,439,069,837; 4,458,151,391 and 4,581,317,964 shares 60,536 61,574 68,705 Retained earnings (1) 79,996 79,024 70,204 Accumulated other comprehensive income (loss) (2) (7,660) (7,711) (8,981) Other (867) (466) (773) Total shareholders' equity 134,856 135,272 129,426 Total liabilities and shareholders' equity $1,502,157 $1,459,737 $1,375,080 (1) Effective January 1, 2007, the Corporation adopted Financial Accounting Standards Board (FASB) Staff Position No. FAS 13-2, “Accounting for a Change or Projected Change in the Timing of Cash Flows Relating to Income Taxes Generated by a Leveraged Lease Transaction” (FSP 13-2). The adoption of FSP 13-2 reduced the beginning balance of retained earnings by approximately $1.4 billion, net of tax, with a corresponding offset decreasing the net investment in leveraged leases. Effective January 1, 2007, the Corporation adopted Statement of Financial Accounting Standards (SFAS) No. 157, quot;Fair Value Measurementsquot; and SFAS No. 159, “The Fair Value Option for Financial Assets and Financial Liabilities” (SFAS 159) which reduced the beginning balance of retained earnings by $208 million, net of tax. In addition, the Corporation adopted FASB Interpretation No. 48, “Accounting for Uncertainty in Income Taxes, an interpretation of FASB Statement No. 109” (FIN 48). The adoption of FIN 48 reduced the beginning balance of retained earnings by $146 million. (2) Effective December 31, 2006, the Corporation adopted SFAS No. 158, “Employers’ Accounting for Defined Benefit Pension and Other Postretirement Plans, an amendment of FASB Statements No. 87, 88, 106, and 132(R)”, which reduced accumulated Other Comprehensive Income (Loss) by approximately $1.3 billion, net of tax. Certain prior period amounts have been reclassified to conform to current period presentation. This information is preliminary and based on company data available at the time of the presentation. 5
  • 7. Bank of America Corporation Capital Management (Dollars in millions) First Fourth Third Second First Quarter Quarter Quarter Quarter Quarter 2007 (1) 2006 2006 2006 2006 Risk-based capital: Tier 1 capital $91,005 $91,064 $88,085 $84,978 $83,174 Total capital 126,850 125,226 119,074 114,738 111,422 Risk-weighted assets 1,062,020 1,054,533 1,039,283 1,019,828 984,190 Tier 1 capital ratio 8.57 % 8.64 % 8.48 % 8.33 % 8.45 % Total capital ratio 11.94 11.88 11.46 11.25 11.32 (2) Tangible equity ratio 4.20 4.35 4.22 3.76 4.04 Tier 1 leverage ratio 6.24 6.36 6.16 6.13 6.18 (1) Preliminary data on risk-based capital (2) Tangible equity ratio equals shareholders' equity less goodwill and intangible assets divided by total assets less goodwill and intangible assets. Share Repurchase Program 48.0 million common shares were repurchased in the first quarter of 2007 as a part of an ongoing share repurchase program. 215.1 million shares remain outstanding under the 2006 and 2007 authorized programs. 28.9 million shares were issued in the first quarter of 2007. Capital Management 5,000 9.00% 4,581 4,528 4,498 4,458 4,439 4,500 8.64% 8.57% 8.48% 4,000 8.45% 8.50% 8.33% 3,500 3,000 8.00% Mar-06 Jun-06 Sep-06 Dec-06 Mar-07* Shares outstanding at period end Tier 1 capital ratio *Preliminary data on risk-based capital This information is preliminary and based on company data available at the time of the presentation. 6
  • 8. Bank of America Corporation Core Net Interest Income - Managed Basis (Dollars in millions) First Fourth Third Second First Quarter Quarter Quarter Quarter Quarter 2007 2006 2006 2006 2006 Net interest income As reported (1) $8,597 $8,955 $8,894 $8,926 $9,040 (2) Impact of market-based net interest income (484) (488) (376) (380) (412) Core net interest income 8,113 8,467 8,518 8,546 8,628 Impact of securitizations 1,859 1,850 1,760 1,710 1,725 Core net interest income - managed basis $9,972 $10,317 $10,278 $10,256 $10,353 Average earning assets As reported $1,321,946 $1,299,461 $1,302,366 $1,253,895 $1,219,611 Impact of market-based earning assets (2) (408,113) (405,811) (376,010) (357,617) (336,606) Core average earning assets 913,833 893,650 926,356 896,278 883,005 Impact of securitizations 102,529 100,786 98,722 96,776 96,268 Core average earning assets - managed basis $1,016,362 $994,436 $1,025,078 $993,054 $979,273 Net interest yield contribution As reported (1) 2.61 % 2.75 % 2.73 % 2.85 % 2.98 % Impact of market-based activities 0.95 1.03 0.94 0.97 0.95 Core net interest yield on earning assets 3.56 3.78 3.67 3.82 3.93 Impact of securitizations 0.38 0.36 0.33 0.31 0.32 Core net interest yield on earning assets - managed basis 3.94 % 4.14 % 4.00 % 4.13 % 4.25 % (1) Fully taxable-equivalent basis (2) Represents amounts from the Capital Markets and Advisory Services business within Global Corporate and Investment Banking. Certain prior period amounts have been reclassified to conform to current period presentation. This information is preliminary and based on company data available at the time of the presentation. 7
  • 9. Bank of America Corporation Quarterly Average Balances and Interest Rates - Fully Taxable-equivalent Basis (Dollars in millions) First Quarter 2007 Fourth Quarter 2006 First Quarter 2006 Interest Interest Interest Average Income/ Yield/ Average Income/ Yield/ Average Income/ Yield/ Balance Expense Rate Balance Expense Rate Balance Expense Rate Earning assets Time deposits placed and other short-term investments $15,023 $169 4.57 % $15,760 $166 4.19 % $14,347 $139 3.92 % Federal funds sold and securities purchased under agreements to resell 166,195 1,979 4.79 174,167 2,068 4.73 174,711 1,709 3.94 Trading account assets 175,249 2,357 5.41 167,163 2,289 5.46 133,361 1,623 4.89 Debt securities (1) 186,498 2,451 5.27 193,601 2,504 5.17 234,606 3,043 5.19 Loans and leases (2): Residential mortgage 246,618 3,504 5.69 225,985 3,202 5.66 184,796 2,524 5.48 Credit card - domestic 57,720 1,887 13.26 59,802 2,101 13.94 68,169 2,180 12.97 Credit card - foreign 11,133 317 11.55 10,375 305 11.66 8,403 287 13.86 Home equity (3) 89,561 1,679 7.60 84,907 1,626 7.60 72,422 1,247 6.98 Direct/Indirect consumer 60,155 1,221 8.23 53,478 1,101 8.17 46,801 851 7.32 Other consumer (4) 8,809 204 9.36 10,597 225 8.47 10,357 272 10.59 Total consumer 473,996 8,812 7.50 445,144 8,560 7.65 390,948 7,361 7.60 Commercial - domestic 163,620 2,934 7.27 158,604 2,907 7.27 144,693 2,490 6.97 Commercial real estate (5) 36,117 672 7.55 36,851 704 7.58 36,676 632 6.99 Commercial lease financing 19,651 175 3.55 21,159 254 4.80 20,512 247 4.82 Commercial - foreign 20,658 330 6.48 21,840 337 6.12 23,139 427 7.48 Total commercial 240,046 4,111 6.94 238,454 4,202 7.00 225,020 3,796 6.83 Total loans and leases 714,042 12,923 7.31 683,598 12,762 7.42 615,968 11,157 7.32 Other earning assets 64,939 1,010 6.28 65,172 1,058 6.46 46,618 718 6.22 Total earning assets (6) 1,321,946 20,889 6.37 1,299,461 20,847 6.39 1,219,611 18,389 6.08 Cash and cash equivalents 33,623 32,816 34,857 Other assets, less allowance for loan and lease losses 165,849 162,873 161,905 Total assets $1,521,418 $1,495,150 $1,416,373 Interest-bearing liabilities Domestic interest-bearing deposits: Savings $32,773 $41 0.50 % $32,965 $48 0.58 % $35,550 $76 0.87 % NOW and money market deposit accounts 212,249 936 1.79 211,055 966 1.81 227,606 908 1.62 Consumer CDs and IRAs 159,505 1,832 4.66 154,621 1,794 4.60 135,068 1,177 3.53 Negotiable CDs, public funds and other time deposits 13,376 136 4.12 13,052 140 4.30 8,551 70 3.30 Total domestic interest-bearing deposits 417,903 2,945 2.86 411,693 2,948 2.84 406,775 2,231 2.22 Foreign interest-bearing deposits : Banks located in foreign countries 40,372 531 5.34 38,648 507 5.21 30,116 424 5.71 Governments and official institutions 14,482 178 4.98 14,220 168 4.70 10,200 107 4.25 Time, savings and other 39,534 380 3.90 41,328 366 3.50 35,136 245 2.83 Total foreign interest-bearing deposits 94,388 1,089 4.68 94,196 1,041 4.38 75,452 776 4.17 Total interest-bearing deposits 512,291 4,034 3.19 505,889 3,989 3.13 482,227 3,007 2.53 Federal funds purchased, securities sold under agreements to repurchase and other short-term borrowings 414,104 5,318 5.20 405,748 5,222 5.11 399,896 4,309 4.37 Trading account liabilities 77,635 892 4.66 75,261 800 4.21 52,466 517 3.99 Long-term debt 148,627 2,048 5.51 140,756 1,881 5.34 117,018 1,516 5.18 Total interest-bearing liabilities (6) 1,152,657 12,292 4.31 1,127,654 11,892 4.19 1,051,607 9,349 3.60 Noninterest-bearing sources: Noninterest-bearing deposits 174,413 174,356 177,594 Other liabilities 60,760 59,093 56,019 Shareholders' equity 133,588 134,047 131,153 Total liabilities and shareholders' equity $1,521,418 $1,495,150 $1,416,373 Net interest spread 2.06 % 2.20 % 2.48 % Impact of noninterest-bearing sources 0.55 0.55 0.50 Net interest income/yield on earning assets $8,597 2.61 % $8,955 2.75 % $9,040 2.98 % (1) Yields on AFS debt securities are calculated based on fair value rather than historical cost balances. The use of fair value does not have a material impact on net interest yield. (2) Nonperforming loans are included in the respective average loan balances. Income on these nonperforming loans is recognized on a cash basis. (3) Includes home equity loans of $13.5 billion in the first quarter of 2007, and $11.7 billion and $8.2 billion in the fourth and first quarters of 2006. (4) Includes consumer finance loans of $3.0 billion in the first quarter of 2007, and $2.8 billion and $3.0 billion in the fourth and first quarters of 2006; and foreign consumer loans of $5.8 billion in the first quarter of 2007, and $7.8 billion and $7.3 billion in the fourth and first quarters of 2006. (5) Includes domestic commercial real estate loans of $35.5 billion in the first quarter of 2007, and $36.1 billion and $36.0 billion in the fourth and first quarters of 2006. (6) Interest income includes the impact of interest rate risk management contracts, which increased (decreased) interest income on the underlying assets $(121) million in the first quarter of 2007, and $(198) million and $8 million in the fourth and first quarters of 2006. Interest expense includes the impact of interest rate risk management contracts, which increased (decreased) interest expense on the underlying liabilities $179 million in the first quarter of 2007, and $(69) million and $136 million in the fourth and first quarters of 2006. Certain prior period amounts have been reclassified to conform to current period presentation. This information is preliminary and based on company data available at the time of the presentation. 8
  • 10. Bank of America Corporation Quarterly Average Balances and Interest Rates - Fully Taxable-equivalent Basis - Isolating Hedge Income/Expense (1) (Dollars in millions) First Quarter 2007 Fourth Quarter 2006 First Quarter 2006 Interest Interest Interest Average Income/ Yield/ Average Income/ Yield/ Average Income/ Yield/ Balance Expense Rate Balance Expense Rate Balance Expense Rate Earning assets Time deposits placed and other short-term investments (2) $15,023 $196 5.29 % $15,760 $199 5.01 % $14,347 $142 4.01 % Federal funds sold and securities purchased under agreements to resell (2) 166,195 2,085 5.04 174,167 2,223 5.09 174,711 1,800 4.15 Trading account assets 175,249 2,357 5.41 167,163 2,289 5.46 133,361 1,623 4.89 Debt securities (2) 186,498 2,455 5.27 193,601 2,509 5.18 234,606 3,043 5.19 Loans and leases: Residential mortgage 246,618 3,504 5.69 225,985 3,202 5.66 184,796 2,524 5.48 Credit card - domestic 57,720 1,887 13.26 59,802 2,101 13.94 68,169 2,180 12.97 Credit card - foreign 11,133 317 11.55 10,375 305 11.66 8,403 287 13.86 Home equity 89,561 1,679 7.60 84,907 1,626 7.60 72,422 1,247 6.98 Direct/Indirect consumer 60,155 1,221 8.23 53,478 1,101 8.17 46,801 851 7.32 Other consumer 8,809 204 9.36 10,597 225 8.47 10,357 272 10.59 Total consumer 473,996 8,812 7.50 445,144 8,560 7.65 390,948 7,361 7.60 Commercial - domestic (2) 163,620 2,933 7.27 158,604 2,918 7.30 144,693 2,379 6.66 Commercial real estate 36,117 672 7.55 36,851 704 7.58 36,676 632 6.99 Commercial lease financing 19,651 175 3.55 21,159 254 4.80 20,512 247 4.82 Commercial - foreign (2) 20,658 312 6.12 21,840 332 6.02 23,139 426 7.46 Total commercial 240,046 4,092 6.91 238,454 4,208 7.01 225,020 3,684 6.63 Total loans and leases 714,042 12,904 7.30 683,598 12,768 7.42 615,968 11,045 7.24 Other earning assets (2) 64,939 1,013 6.29 65,172 1,057 6.46 46,618 728 6.31 Total earning assets - excluding hedge impact 1,321,946 21,010 6.41 1,299,461 21,045 6.45 1,219,611 18,381 6.07 Net derivative income (expense) on assets (121) (198) 8 Total earning assets - including hedge impact 1,321,946 20,889 6.37 1,299,461 20,847 6.39 1,219,611 18,389 6.08 Cash and cash equivalents 33,623 32,816 34,857 Other assets, less allowance for loan and lease losses 165,849 162,873 161,905 Total assets $1,521,418 $1,495,150 $1,416,373 Interest-bearing liabilities Domestic interest-bearing deposits: Savings $32,773 $41 0.50 % $32,965 $48 0.58 % $35,550 $76 0.87 % (2) NOW and money market deposit accounts 212,249 931 1.78 211,055 962 1.81 227,606 906 1.61 Consumer CDs and IRAs (2) 159,505 1,638 4.16 154,621 1,598 4.10 135,068 1,022 3.07 (2) Negotiable CDs, public funds and other time deposits 13,376 134 4.05 13,052 138 4.24 8,551 68 3.21 Total domestic interest-bearing deposits 417,903 2,744 2.66 411,693 2,746 2.65 406,775 2,072 2.07 Foreign interest-bearing deposits: (2) Banks located in foreign countries 40,372 529 5.32 38,648 515 5.30 30,116 403 5.43 Governments and official institutions 14,482 178 4.98 14,220 168 4.70 10,200 107 4.25 Time, savings and other 39,534 380 3.90 41,328 366 3.50 35,136 245 2.83 Total foreign interest-bearing deposits 94,388 1,087 4.67 94,196 1,049 4.42 75,452 755 4.06 Total interest-bearing deposits 512,291 3,831 3.03 505,889 3,795 2.98 482,227 2,827 2.38 Federal funds purchased, securities sold under agreements (2) to repurchase and other short-term borrowings 414,104 5,466 5.35 405,748 5,522 5.40 399,896 4,375 4.43 Trading account liabilities 77,635 892 4.66 75,261 800 4.21 52,466 517 3.99 (2) Long-term debt 148,627 1,924 5.18 140,756 1,844 5.24 117,018 1,494 5.11 Total interest-bearing liabilities - excluding hedge impact 1,152,657 12,113 4.25 1,127,654 11,961 4.21 1,051,607 9,213 3.54 Net derivative (income) expense on liabilities 179 (69) 136 Total interest-bearing liabilities - including hedge impact 1,152,657 12,292 4.31 1,127,654 11,892 4.19 1,051,607 9,349 3.60 Noninterest-bearing sources: Noninterest-bearing deposits 174,413 174,356 177,594 Other liabilities 60,760 59,093 56,019 Shareholders' equity 133,588 134,047 131,153 Total liabilities and shareholders' equity $1,521,418 $1,495,150 $1,416,373 Net interest spread 2.16 2.24 2.53 Impact of noninterest-bearing sources 0.54 0.55 0.49 Net interest income/yield on earning assets - excluding hedge impact $8,897 2.70 % $9,084 2.79 % $9,168 3.02 % Net impact of derivative hedge income (expense) (300) (0.09) (129) (0.04) (128) (0.04) Net interest income/yield on earning assets $8,597 2.61 % $8,955 2.75 % $9,040 2.98 % (1) This table presents a non-GAAP financial measure. The impact of interest rate risk management derivatives is shown separately. Interest income and interest expense amounts, and the yields and rates have been adjusted. Management believes this presentation is useful to investors because it adjusts for the impact of our hedging decisions and provides a better understanding of our hedging activities. The impact of interest rate risk management derivatives is not material to the average balances presented above. (2) Interest income excludes the impact of interest rate risk management contracts, which increased (decreased) interest income on time deposits placed and other short-term investments $(27) million, federal funds sold and securities purchased under agreements to resell $(106) million, debt securities $(4) million, commercial - domestic $1 million, commercial - foreign $18 million, and other earning assets $(3) million in the first quarter of 2007. Interest expense excludes the impact of interest rate risk management contracts, which increased (decreased) interest expense on NOW and money market deposit accounts $5 million, consumer CDs and IRAs $194 million, negotiable CDs, public funds and other time deposits $2 million, banks located in foreign countries $2 million, federal funds purchased, securities sold under agreements to repurchase and other short-term borrowings $(148) million, and long-term debt $124 million in the first quarter of 2007. Interest income excludes the impact of interest rate risk management contracts, which increased (decreased) interest income on time deposits placed and other short-term investments $(33) million, federal funds sold and securities purchased under agreements to resell $(155) million, debt securities $(5) million, commercial - domestic $(11) million, commercial - foreign $5 million, and other earning assets $1 million in the fourth quarter of 2006. Interest expense excludes the impact of interest rate risk management contracts, which increased (decreased) interest expense on NOW and money market deposit accounts $4 million, consumer CDs and IRAs $196 million, negotiable CDs, public funds and other time deposits $2 million, banks located in foreign countries $(8) million, federal funds purchased, securities sold under agreements to repurchase and other short-term borrowings $(300) million, and long-term debt $37 million in the fourth quarter of 2006. Interest income excludes the impact of interest rate risk management contracts, which increased (decreased) interest income on time deposits placed and other short-term investments $(3) million, federal funds sold and securities purchased under agreements to resell $(91) million, commercial - domestic $111 million, commercial - foreign $1 million, and other earning assets $(10) million in the first quarter of 2006. Interest expense excludes the impact of interest rate risk management contracts, which increased (decreased) interest expense on NOW and money market deposit accounts $2 million, consumer CDs and IRAs $155 million, negotiable CDs, public funds and other time deposits $2 million, banks located in foreign countries $21 million, federal funds purchased, securities sold under agreements to repurchase and other short-term borrowings $(66) million and long-term debt $22 million in the first quarter of 2006. Certain prior period amounts have been reclassified to conform to current period presentation. This information is preliminary and based on company data available at the time of the presentation. 9
  • 11. Bank of America Corporation Business Segment View Net Income First Quarter 2007 Global Consumer and Small Business Global Corporate and Investment Banking Banking 51% 28% Global Wealth and Investment Management 10% All Other 11% Revenue (1,2) First Quarter 2007 Global Corporate and Investment Banking 29% Global Wealth and Investment Management 10% Global Consumer and Small Business Banking 62% All Other (1)% (1) Fully taxable-equivalent basis (2) Global Consumer and Small Business Banking is presented on a managed view, specifically Card Services, with a corresponding offset to All Other. This information is preliminary and based on company data available at the time of the presentation. 10
  • 12. Bank of America Corporation Global Consumer and Small Business Banking Segment Results (1, 2) (Dollars in millions; except as noted) First Fourth Third Second First Quarter Quarter Quarter Quarter Quarter 2007 2006 2006 2006 2006 (3) Net interest income $7,028 $7,157 $7,027 $6,968 $7,092 Noninterest income Card income 2,451 2,707 2,446 2,528 2,107 Service charges 1,377 1,394 1,410 1,349 1,190 Mortgage banking income 302 247 215 210 205 All other income 264 255 383 323 248 Total noninterest income 4,394 4,603 4,454 4,410 3,750 Total revenue (3) 11,422 11,760 11,481 11,378 10,842 Managed credit impact 2,411 2,777 2,049 1,807 1,901 Gains (losses) on sales of debt securities (1) (1) - - (1) Noninterest expense 4,728 4,852 4,710 4,509 4,612 Income before income taxes (3) 4,282 4,130 4,722 5,062 4,328 Income tax expense 1,586 1,524 1,736 1,858 1,604 Net income $2,696 $2,606 $2,986 $3,204 $2,724 Shareholder value added $1,346 $1,256 $1,622 $1,834 $1,311 (3) Net interest yield 8.25 % 8.39 % 8.27 % 8.15 % 8.35 % Return on average equity 17.58 16.63 18.85 20.14 16.73 Efficiency ratio (3) 41.40 41.27 41.02 39.63 42.54 Balance sheet (2) Average Total loans and leases $308,105 $299,615 $291,195 $282,554 $279,382 Total earning assets (4) 345,511 338,541 337,022 343,086 344,423 Total assets (4) 400,576 393,383 392,979 396,046 396,821 Total deposits 326,552 327,962 332,578 336,105 332,702 Allocated equity 62,194 62,179 62,862 63,810 66,034 Period end Total loans and leases $309,992 $307,687 $294,207 $286,059 $278,197 Total earning assets (4) 349,694 339,578 340,112 337,130 351,772 (4) Total assets 407,654 398,286 398,206 396,142 406,032 Total deposits 334,968 329,245 332,844 338,827 342,521 Period end (in billions) Mortgage servicing portfolio $345.1 $333.0 $323.3 $313.0 $302.4 (1) Global Consumer and Small Business Banking has three primary businesses: Deposits, Card Services and Consumer Real Estate. In addition, ALM/Other includes the results of ALM activities and other consumer-related businesses (e.g., insurance). Effective January 1, 2007, Global Consumer and Small Business Banking combined the former Mortgage and Home Equity businesses into Consumer Real Estate. (2) Presented on a managed view, specifically Card Services. (See Exhibit A: Non-GAAP Reconciliations - Global Consumer and Small Business Banking - Reconciliation - Managed to GAAP on page 33.) (3) Fully taxable-equivalent basis (4) Total earning assets and total assets include asset allocations to match liabilities (i.e., deposits). Certain prior period amounts have been reclassified among the segments to conform to the current period presentation. This information is preliminary and based on company data available at the time of the presentation. 11
  • 13. Bank of America Corporation Global Consumer and Small Business Banking Business Results (Dollars in millions) Three Months Ended March 31, 2007 Card Consumer ALM/ (1) (2) (1) (3) Total Deposits Services Real Estate Other Net interest income (4) $7,028 $2,367 $3,990 $524 $147 Noninterest income Card income 2,451 500 1,951 - - Service charges 1,377 1,376 - 1 - Mortgage banking income 302 - - 302 - All other income 264 - 189 13 62 Total noninterest income 4,394 1,876 2,140 316 62 (4) Total revenue 11,422 4,243 6,130 840 209 Managed credit impact 2,411 39 2,299 29 44 Gains (losses) on sales of debt securities (1) - - - (1) Noninterest expense 4,728 2,157 2,000 450 121 (4) Income before income taxes 4,282 2,047 1,831 361 43 Income tax expense 1,586 759 678 134 15 Net income $2,696 $1,288 $1,153 $227 $28 Shareholder value added $1,346 $955 $227 $130 $34 (4) Net interest yield 8.25 % 2.86 % 8.02 % 2.13 % n/m Return on average equity 17.58 35.00 10.64 25.82 n/m (4) Efficiency ratio 41.40 50.82 32.63 53.53 n/m Average - total loans and leases $308,105 n/m $201,166 $95,631 n/m Average - total deposits 326,552 $320,945 n/m n/m n/m (5) Period end - total assets 407,654 344,143 234,601 105,959 n/m Three Months Ended March 31, 2006 Card Consumer ALM/ (1) (2) (1) Total Deposits Services Real Estate (3) Other Net interest income (4) $7,092 $2,288 $4,139 $478 $187 Noninterest income Card income 2,107 430 1,677 - - Service charges 1,190 1,189 - 1 - Mortgage banking income 205 - - 205 - All other income 248 - 184 13 51 Total noninterest income 3,750 1,619 1,861 219 51 (4) Total revenue 10,842 3,907 6,000 697 238 Managed credit impact 1,901 28 1,809 14 50 Gains (losses) on sales of debt securities (1) - - - (1) Noninterest expense 4,612 2,166 1,945 411 90 (4) Income before income taxes 4,328 1,713 2,246 272 97 Income tax expense 1,604 634 833 101 36 Net income $2,724 $1,079 $1,413 $171 $61 Shareholder value added $1,311 $770 $477 $92 $(28) (4) Net interest yield 8.35 % 2.72 % 8.93 % 2.22 % n/m Return on average equity 16.73 30.10 12.68 23.79 n/m (4) Efficiency ratio 42.54 55.47 32.41 59.07 n/m Average - total loans and leases $279,382 n/m $186,686 $81,413 n/m Average - total deposits 332,702 $327,198 n/m n/m n/m (5) Period end - total assets 406,032 351,937 215,333 91,030 n/m (1) Presented on a managed view, specifically Card Services. (2) For the three months ended March 31, 2007 and 2006, a total of $3.6 billion and $3.2 billion of deposits were migrated from Global Consumer and Small Business Banking to Global Wealth and Investment Management. (3) Effective January 1, 2007, Global Consumer and Small Business Banking combined the former Mortgage and Home Equity businesses into Consumer Real Estate. (4) Fully taxable-equivalent basis (5) Total assets include asset allocations to match liabilities (i.e., deposits). n/m = not meaningful Certain prior period amounts have been reclassified among the segments to conform to the current period presentation. This information is preliminary and based on company data available at the time of the presentation. 12
  • 14. Bank of America Corporation Global Consumer and Small Business Banking Business Results: Customer Relationship View (1) (Dollars in millions) Three Months Ended March 31, 2007 Three Months Ended March 31, 2006 Mass Market and Mass Market and Small Business Small Business Total Consumer Banking Total Consumer Banking (2) Net interest income $7,028 $6,152 $876 $7,092 $6,345 $747 Noninterest income 4,394 3,839 555 3,750 3,259 491 Total revenue (2) 11,422 9,991 1,431 10,842 9,604 1,238 Managed credit impact 2,411 2,128 283 1,901 1,756 145 Gains (losses) on sales of debt securities (1) (1) - (1) (1) - Noninterest expense 4,728 4,286 442 4,612 4,172 440 (2) Income before income taxes 4,282 3,576 706 4,328 3,675 653 Income tax expense 1,586 1,326 260 1,604 1,363 241 Net income $2,696 $2,250 $446 $2,724 $2,312 $412 (1) Presented on a managed view, specifically Card Services. (2) Fully taxable-equivalent basis Certain prior period amounts have been reclassified among the segments to conform to the current period presentation. This information is preliminary and based on company data available at the time of the presentation. 13
  • 15. Bank of America Corporation Global Consumer and Small Business Banking - Key Indicators (Dollars in millions; except as noted) First Fourth Third Second First Quarter Quarter Quarter Quarter Quarter 2007 2006 2006 2006 2006 Deposits Key Indicators Average Deposit Balances Checking $125,127 $124,441 $125,809 $128,737 $127,362 Savings 29,732 29,889 31,058 32,303 31,954 MMS 64,159 66,066 69,049 72,242 75,635 CD's & IRA's 99,563 99,165 97,514 93,803 89,713 Foreign and other 2,364 2,330 2,600 2,817 2,534 Total $320,945 $321,891 $326,030 $329,902 $327,198 Total balances migrated to Premier Banking and Investments $3,551 $3,667 $1,671 $2,111 $3,238 Deposit Spreads (excludes noninterest costs) Checking 4.24 % 4.23 % 4.19 % 4.18 % 4.17 % Savings 3.77 3.70 3.45 3.40 3.38 MMS 3.42 3.25 2.87 2.76 2.53 CD's & IRA's 1.13 1.11 1.21 1.24 1.24 Foreign and other 4.41 4.27 4.23 4.25 4.27 Total 3.05 3.00 2.93 2.94 2.90 Net new retail checking (units in thousands) 487 363 744 701 603 Debit purchase volumes $43,569 $45,121 $42,790 $42,596 $38,519 Online Banking (end of period) Active accounts (units in thousands) 21,813 21,250 20,576 19,806 19,643 Active billpay accounts (units in thousands) 11,285 11,101 10,838 10,410 10,088 Card Services Key Indicators Managed Card - US Consumer and Business Card Gross interest yield 12.85 % 12.98 % 12.85 % 12.52 % 12.54 % (1) Risk adjusted margin 7.82 8.74 8.84 9.50 10.39 Loss rates 4.81 4.57 4.18 3.55 3.07 Average outstandings $147,980 $146,939 $145,518 $143,443 $144,665 Ending outstandings 146,013 150,731 145,891 144,142 142,409 New account growth (in thousands) 2,134 2,488 2,516 2,328 2,157 Purchase volumes $55,517 $62,073 $60,662 $59,817 $53,507 Delinquencies 30 Day 5.44 % 5.49 % 5.14 % 4.73 % 4.48 % 90 Day 2.88 2.66 2.38 2.30 2.04 Merchant Acquiring Business Processing volume $82,828 $95,173 $97,044 $97,229 $88,324 Total transactions (units in thousands) 1,912 2,102 2,101 2,069 1,887 Consumer Real Estate Mortgage servicing rights period end balance $2,963 $2,869 $2,932 $3,083 $2,925 Capitalized mortgage servicing rights (% of loans serviced) 127 bps 125 bps 127 bps 139 bps 132 bps Mortgage loans serviced for investors (in billions) $234 $230 $230 $221 $221 Global Consumer and Small Business Banking Mortgage originations $20,646 $21,370 $19,095 $20,968 $15,480 Home equity originations 15,966 17,004 16,984 16,915 14,701 Total Corporation Mortgage originations 23,449 23,701 21,222 23,372 17,212 Home equity originations 19,653 20,425 20,681 21,141 18,562 (1) Reflects margin and noninterest revenue, adjusted for loss rates. Certain prior period amounts have been reclassified among the segments to conform to the current period presentation. This information is preliminary and based on company data available at the time of the presentation. 14