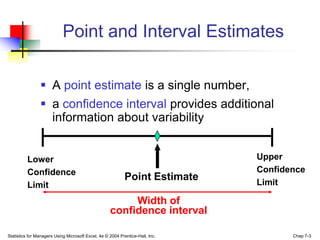
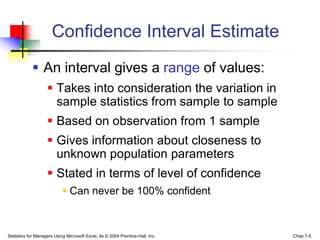
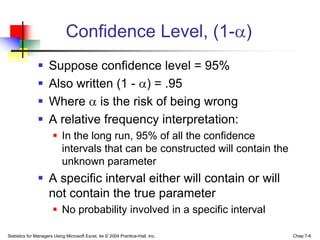
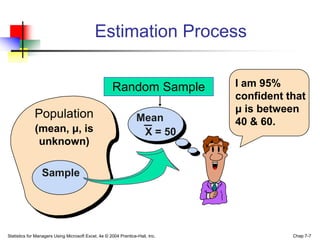
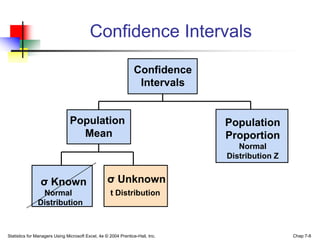
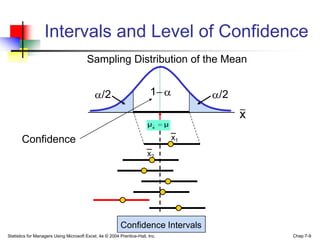
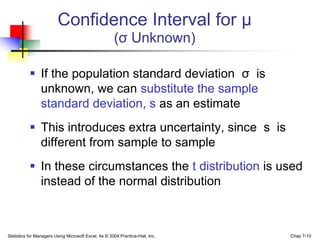
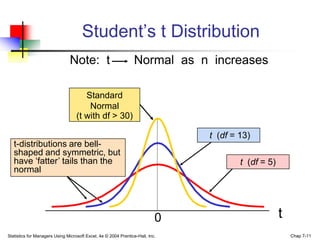
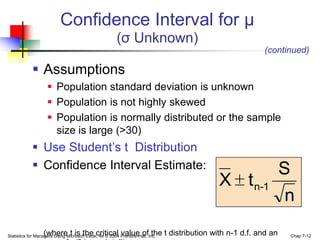
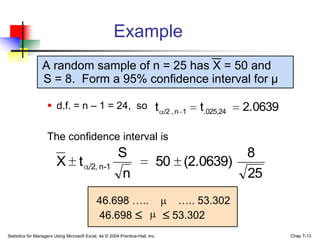
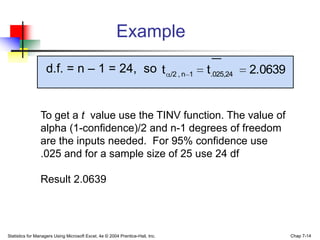
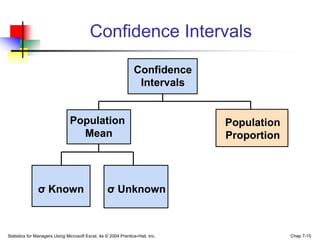
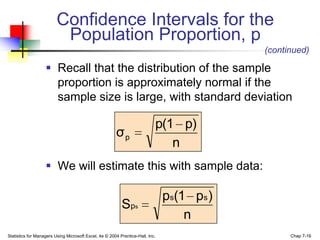
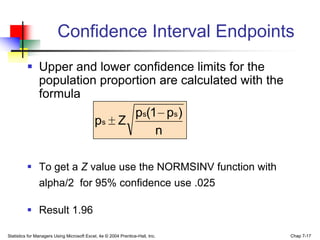
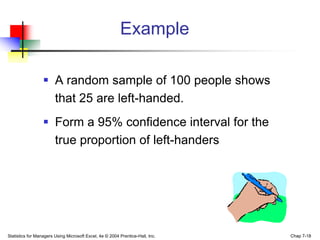
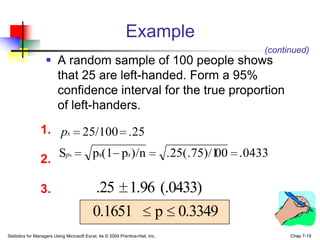
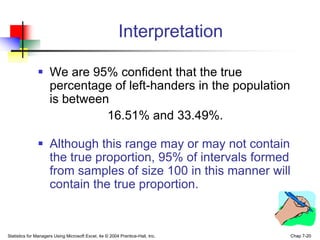
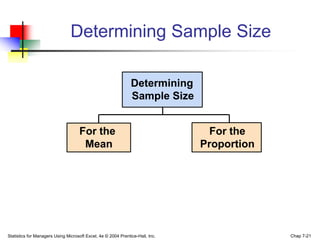
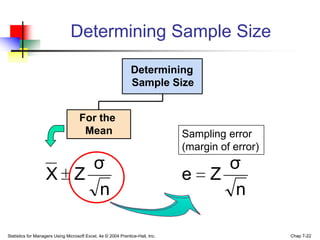
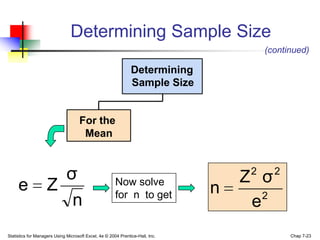
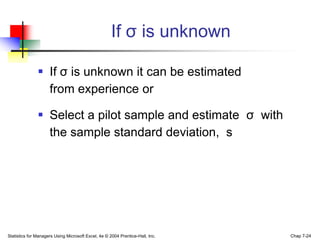
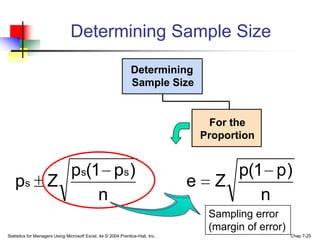
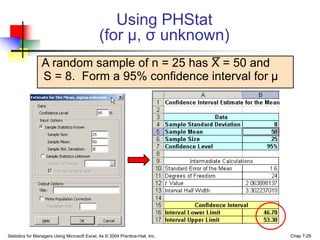
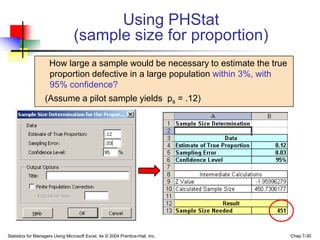
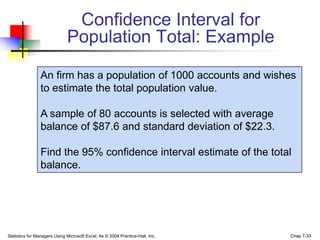
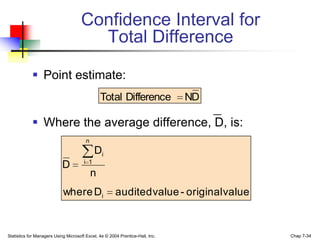
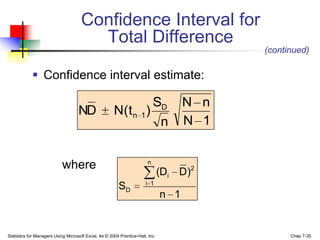
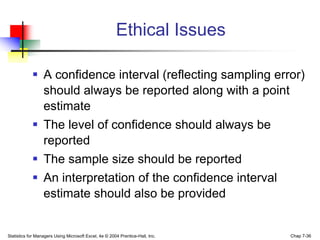
Statistics for Managers
                                      Using Microsoft® Excel
                                                                  4th Edition


                                                               Chapter 7

                           Confidence Interval Estimation


Statistics for Managers Using Microsoft Excel, 4e © 2004 Prentice-Hall, Inc.    Chap 7-1
Chapter Goals

     After completing this chapter, you should be able to:
      Distinguish between a point estimate and an interval
       estimate
      Construct and interpret a confidence interval estimate for a
       population mean using the t distribution
      Form and interpret a confidence interval estimate for a
       population proportion using the Z distribution
      Determine the required sample size to estimate a mean or
       proportion within a specified margin of error


Statistics for Managers Using Microsoft Excel, 4e © 2004 Prentice-Hall, Inc.   Chap 7-2
Point and Interval Estimates

                 A point estimate is a single number,
                 a confidence interval provides additional
                  information about variability


          Lower                                                                Upper
          Confidence                                                           Confidence
                                                            Point Estimate     Limit
          Limit
                                                         Width of
                                                    confidence interval

Statistics for Managers Using Microsoft Excel, 4e © 2004 Prentice-Hall, Inc.          Chap 7-3
Point Estimates


                    We can estimate a                                            with a Sample
                  Population Parameter …                                            Statistic
                                                                               (a Point Estimate)

                      Mean                                        μ                  X
               Proportion                                         p                  ps


Statistics for Managers Using Microsoft Excel, 4e © 2004 Prentice-Hall, Inc.                        Chap 7-4
Confidence Interval Estimate
             An interval gives a range of values:
                     Takes into consideration the variation in
                      sample statistics from sample to sample
                     Based on observation from 1 sample
                     Gives information about closeness to
                      unknown population parameters
                     Stated in terms of level of confidence
                             Can never be 100% confident


Statistics for Managers Using Microsoft Excel, 4e © 2004 Prentice-Hall, Inc.   Chap 7-5
Confidence Level, (1- )
                    Suppose confidence level = 95%
                    Also written (1 - ) = .95
                    Where is the risk of being wrong
                    A relative frequency interpretation:
                        In the long run, 95% of all the confidence
                         intervals that can be constructed will contain the
                         unknown parameter
                A specific interval either will contain or will
                 not contain the true parameter
                        No probability involved in a specific interval

Statistics for Managers Using Microsoft Excel, 4e © 2004 Prentice-Hall, Inc.   Chap 7-6
Estimation Process


                                                     Random Sample             I am 95%
                                                                               confident that
                                                                               μ is between
             Population                                           Mean         40 & 60.
             (mean, μ, is                                          X = 50
              unknown)

                 Sample


Statistics for Managers Using Microsoft Excel, 4e © 2004 Prentice-Hall, Inc.              Chap 7-7
Confidence Intervals

                                                                Confidence
                                                                 Intervals


                               Population                                      Population
                                 Mean                                          Proportion
                                                                                  Normal
                                                                               Distribution Z


                σ Known                            σ Unknown
                Normal                              t Distribution
               Distribution


Statistics for Managers Using Microsoft Excel, 4e © 2004 Prentice-Hall, Inc.                    Chap 7-8
Intervals and Level of Confidence
                                        Sampling Distribution of the Mean


                                                /2                       1              /2
                                                                                             x
                                                                       μx      μ

       Confidence                                                                  x1
                                                                       x2


                                                         Confidence Intervals
Statistics for Managers Using Microsoft Excel, 4e © 2004 Prentice-Hall, Inc.                     Chap 7-9
Confidence Interval for μ
                                                      (σ Unknown)

            If the population standard deviation σ is
             unknown, we can substitute the sample
             standard deviation, s as an estimate
            This introduces extra uncertainty, since s is
             different from sample to sample
            In these circumstances the t distribution is used
             instead of the normal distribution


Statistics for Managers Using Microsoft Excel, 4e © 2004 Prentice-Hall, Inc.   Chap 7-10
Student’s t Distribution
                               Note: t                          Normal as n increases

                                      Standard
                                       Normal
                                   (t with df > 30)

                                                                               t (df = 13)
   t-distributions are bell-
   shaped and symmetric, but
   have ‘fatter’ tails than the                                                        t (df = 5)
   normal


                                                                           0                        t
Statistics for Managers Using Microsoft Excel, 4e © 2004 Prentice-Hall, Inc.                            Chap 7-11
Confidence Interval for μ
                                                       (σ Unknown)
                                                                                      (continued)

             Assumptions
                     Population standard deviation is unknown
                     Population is not highly skewed
                     Population is normally distributed or the sample
                      size is large (>30)
             Use Student’s t Distribution
             Confidence Interval Estimate:                                                   S
                                                                               X t n-1
                                                                                               n
                  (where t is the critical value of the t distribution with n-1 d.f. and an
Statistics for Managers Using Microsoft Excel, 4e © 2004 Prentice-Hall, Inc.                   Chap 7-12
Example
                 A random sample of n = 25 has X = 50 and
                 S = 8. Form a 95% confidence interval for μ

                     d.f. = n – 1 = 24, so t                                   /2 , n 1   t.025,24   2.0639

                    The confidence interval is
                                                        S                                             8
                         X t             /2, n-1                               50 (2.0639)
                                                         n                                            25
                                             46.698 …..                            ….. 53.302
                                             46.698                               53.302
Statistics for Managers Using Microsoft Excel, 4e © 2004 Prentice-Hall, Inc.                                   Chap 7-13
Example
                   d.f. = n – 1 = 24, so t                                     /2 , n 1   t.025,24   2.0639


                To get a t value use the TINV function. The value of
                alpha (1-confidence)/2 and n-1 degrees of freedom
                are the inputs needed. For 95% confidence use
                .025 and for a sample size of 25 use 24 df

                Result 2.0639


Statistics for Managers Using Microsoft Excel, 4e © 2004 Prentice-Hall, Inc.                                  Chap 7-14
Confidence Intervals

                                                                Confidence
                                                                 Intervals


                               Population                                      Population
                                 Mean                                          Proportion


               σ Known                             σ Unknown


Statistics for Managers Using Microsoft Excel, 4e © 2004 Prentice-Hall, Inc.                Chap 7-15
Confidence Intervals for the
                          Population Proportion, p
                                                                                           (continued)

                    Recall that the distribution of the sample
                     proportion is approximately normal if the
                     sample size is large, with standard deviation

                                                                           p(1 p)
                                                       σp
                                                                              n
                    We will estimate this with sample data:

                                                                               ps(1 ps )
                                                          S ps
                                                                                   n
Statistics for Managers Using Microsoft Excel, 4e © 2004 Prentice-Hall, Inc.                     Chap 7-16
Confidence Interval Endpoints
          Upper and lower confidence limits for the
           population proportion are calculated with the
           formula
                                                          ps(1 ps )
                                            ps          Z
                                                              n

          To get a Z value use the NORMSINV function with
           alpha/2 for 95% confidence use .025

          Result 1.96

Statistics for Managers Using Microsoft Excel, 4e © 2004 Prentice-Hall, Inc.   Chap 7-17
Example

                   A random sample of 100 people shows
                    that 25 are left-handed.
                   Form a 95% confidence interval for the
                    true proportion of left-handers


Statistics for Managers Using Microsoft Excel, 4e © 2004 Prentice-Hall, Inc.   Chap 7-18
Example
                                                                                               (continued)
                    A random sample of 100 people shows
                     that 25 are left-handed. Form a 95%
                     confidence interval for the true proportion
                     of left-handers.
                1. ps 25/100 .25
                          Sps              ps(1 ps )/n                         .25(.75)/1
                                                                                        00 .0433
                2.

                3.                           .25 1.96 (.0433)
                                           0.1651                          p 0.3349
Statistics for Managers Using Microsoft Excel, 4e © 2004 Prentice-Hall, Inc.                         Chap 7-19
Interpretation

                We are 95% confident that the true
                 percentage of left-handers in the population
                 is between
                           16.51% and 33.49%.

                Although this range may or may not contain
                 the true proportion, 95% of intervals formed
                 from samples of size 100 in this manner will
                 contain the true proportion.


Statistics for Managers Using Microsoft Excel, 4e © 2004 Prentice-Hall, Inc.   Chap 7-20
Determining Sample Size

                                                               Determining
                                                               Sample Size


                                    For the                                      For the
                                     Mean                                      Proportion


Statistics for Managers Using Microsoft Excel, 4e © 2004 Prentice-Hall, Inc.                Chap 7-21
Determining Sample Size

                                                               Determining
                                                               Sample Size


                                    For the
                                     Mean                                      Sampling error
                                                                               (margin of error)
                       σ                                                               σ
                   X Z                                                         e     Z
                        n                                                               n

Statistics for Managers Using Microsoft Excel, 4e © 2004 Prentice-Hall, Inc.                       Chap 7-22
Determining Sample Size
                                                                                        (continued)

                                                               Determining
                                                               Sample Size


                                    For the
                                     Mean


                      σ                                Now solve                   Z σ
                                                                                    2     2
     e              Z                                  for n to get            n      2
                       n                                                            e
Statistics for Managers Using Microsoft Excel, 4e © 2004 Prentice-Hall, Inc.                  Chap 7-23
If σ is unknown

                If σ is unknown it can be estimated
                 from experience or

                Select a pilot sample and estimate σ with
                 the sample standard deviation, s


Statistics for Managers Using Microsoft Excel, 4e © 2004 Prentice-Hall, Inc.   Chap 7-24
Determining Sample Size

                                                               Determining
                                                               Sample Size


                                                                                     For the
                                                                                   Proportion


                      ps(1 ps )                                                        p(1 p )
   ps               Z                                                          e     Z
                          n                                                               n
                                                                                    Sampling error
                                                                                    (margin of error)
Statistics for Managers Using Microsoft Excel, 4e © 2004 Prentice-Hall, Inc.                            Chap 7-25
Determining Sample Size
                                                                                            (continued)

                                                               Determining
                                                               Sample Size


                                                                                 For the
                                                                               Proportion


             p(1 p )                                     Now solve                  Z 2 p (1 p)
e          Z                                             for n to get           n          2
                n                                                                        e

Statistics for Managers Using Microsoft Excel, 4e © 2004 Prentice-Hall, Inc.                      Chap 7-26
PHStat Interval Options


                                                                               options


Statistics for Managers Using Microsoft Excel, 4e © 2004 Prentice-Hall, Inc.        Chap 7-27
PHStat Sample Size Options


Statistics for Managers Using Microsoft Excel, 4e © 2004 Prentice-Hall, Inc.   Chap 7-28
Using PHStat
                                               (for μ, σ unknown)
                 A random sample of n = 25 has X = 50 and
                 S = 8. Form a 95% confidence interval for μ


Statistics for Managers Using Microsoft Excel, 4e © 2004 Prentice-Hall, Inc.   Chap 7-29
Using PHStat
                                 (sample size for proportion)
                     How large a sample would be necessary to estimate the true
                     proportion defective in a large population within 3%, with
                     95% confidence?
                   (Assume a pilot sample yields ps = .12)


Statistics for Managers Using Microsoft Excel, 4e © 2004 Prentice-Hall, Inc.      Chap 7-30
Applications in Auditing
             Advantages of statistical sampling in auditing
                     Sample result is objective and defensible
                     Sample size estimation is done in advance on an
                      objective basis
                     Provides an estimate of the sampling error
                     Can provide more accurate conclusions than a
                      census of the population
                     Samples can be combined and evaluated by different
                      auditors


Statistics for Managers Using Microsoft Excel, 4e © 2004 Prentice-Hall, Inc.   Chap 7-31
Confidence Interval for
                                 Population Total Amount

             Point estimate:
                                         Population total                      NX

             Confidence interval estimate:
                                                                    S           N n
                                    NX                   N( t n 1 )
                                                                     n          N 1

           (This is sampling without replacement, so use the finite population
           correction in the confidence interval formula)

Statistics for Managers Using Microsoft Excel, 4e © 2004 Prentice-Hall, Inc.          Chap 7-32
Confidence Interval for
                              Population Total: Example

                An firm has a population of 1000 accounts and wishes
                to estimate the total population value.

                A sample of 80 accounts is selected with average
                balance of $87.6 and standard deviation of $22.3.

                Find the 95% confidence interval estimate of the total
                balance.


Statistics for Managers Using Microsoft Excel, 4e © 2004 Prentice-Hall, Inc.   Chap 7-33
Confidence Interval for
                                       Total Difference

             Point estimate:
                                                Total Difference               ND

             Where the average difference, D, is:
                                        n
                                             Di
                                       i 1
                            D
                                            n
                            where Di                   audited value - original value


Statistics for Managers Using Microsoft Excel, 4e © 2004 Prentice-Hall, Inc.            Chap 7-34
Confidence Interval for
                                       Total Difference
                                                                                           (continued)

             Confidence interval estimate:

                                                                 SD                  N n
                                    ND                N( t n 1 )
                                                                  n                  N 1


                            where                                      n
                                                                               (Di D)2
                                                                      i 1
                                                         SD
                                                                               n 1


Statistics for Managers Using Microsoft Excel, 4e © 2004 Prentice-Hall, Inc.                     Chap 7-35
Ethical Issues

             A confidence interval (reflecting sampling error)
              should always be reported along with a point
              estimate
             The level of confidence should always be
              reported
             The sample size should be reported
             An interpretation of the confidence interval
              estimate should also be provided


Statistics for Managers Using Microsoft Excel, 4e © 2004 Prentice-Hall, Inc.   Chap 7-36
Chapter Summary

                 Introduced the concept of confidence intervals
                 Discussed point estimates
                 Developed confidence interval estimates
                 Determined confidence interval estimates for the
                  mean (σ unknown)
                 Created confidence interval estimates for the
                  proportion
                 Determined required sample size for mean and
                  proportion estimation samples


Statistics for Managers Using Microsoft Excel, 4e © 2004 Prentice-Hall, Inc.   Chap 7-37
Chapter Summary
                                                                               (continued)

                 Developed applications of confidence interval
                  estimation in auditing
                    Confidence interval estimation for population total
                    Confidence interval estimation for total difference
                     in the population
                 Addressed confidence interval estimation and ethical
                  issues


Statistics for Managers Using Microsoft Excel, 4e © 2004 Prentice-Hall, Inc.        Chap 7-38

Sampling Excel

  • 1.
    Statistics for Managers Using Microsoft® Excel 4th Edition Chapter 7 Confidence Interval Estimation Statistics for Managers Using Microsoft Excel, 4e © 2004 Prentice-Hall, Inc. Chap 7-1
  • 2.
    Chapter Goals After completing this chapter, you should be able to:  Distinguish between a point estimate and an interval estimate  Construct and interpret a confidence interval estimate for a population mean using the t distribution  Form and interpret a confidence interval estimate for a population proportion using the Z distribution  Determine the required sample size to estimate a mean or proportion within a specified margin of error Statistics for Managers Using Microsoft Excel, 4e © 2004 Prentice-Hall, Inc. Chap 7-2
  • 3.
    Point and IntervalEstimates  A point estimate is a single number,  a confidence interval provides additional information about variability Lower Upper Confidence Confidence Point Estimate Limit Limit Width of confidence interval Statistics for Managers Using Microsoft Excel, 4e © 2004 Prentice-Hall, Inc. Chap 7-3
  • 4.
    Point Estimates We can estimate a with a Sample Population Parameter … Statistic (a Point Estimate) Mean μ X Proportion p ps Statistics for Managers Using Microsoft Excel, 4e © 2004 Prentice-Hall, Inc. Chap 7-4
  • 5.
    Confidence Interval Estimate  An interval gives a range of values:  Takes into consideration the variation in sample statistics from sample to sample  Based on observation from 1 sample  Gives information about closeness to unknown population parameters  Stated in terms of level of confidence  Can never be 100% confident Statistics for Managers Using Microsoft Excel, 4e © 2004 Prentice-Hall, Inc. Chap 7-5
  • 6.
    Confidence Level, (1-)  Suppose confidence level = 95%  Also written (1 - ) = .95  Where is the risk of being wrong  A relative frequency interpretation:  In the long run, 95% of all the confidence intervals that can be constructed will contain the unknown parameter  A specific interval either will contain or will not contain the true parameter  No probability involved in a specific interval Statistics for Managers Using Microsoft Excel, 4e © 2004 Prentice-Hall, Inc. Chap 7-6
  • 7.
    Estimation Process Random Sample I am 95% confident that μ is between Population Mean 40 & 60. (mean, μ, is X = 50 unknown) Sample Statistics for Managers Using Microsoft Excel, 4e © 2004 Prentice-Hall, Inc. Chap 7-7
  • 8.
    Confidence Intervals Confidence Intervals Population Population Mean Proportion Normal Distribution Z σ Known σ Unknown Normal t Distribution Distribution Statistics for Managers Using Microsoft Excel, 4e © 2004 Prentice-Hall, Inc. Chap 7-8
  • 9.
    Intervals and Levelof Confidence Sampling Distribution of the Mean /2 1 /2 x μx μ Confidence x1 x2 Confidence Intervals Statistics for Managers Using Microsoft Excel, 4e © 2004 Prentice-Hall, Inc. Chap 7-9
  • 10.
    Confidence Interval forμ (σ Unknown)  If the population standard deviation σ is unknown, we can substitute the sample standard deviation, s as an estimate  This introduces extra uncertainty, since s is different from sample to sample  In these circumstances the t distribution is used instead of the normal distribution Statistics for Managers Using Microsoft Excel, 4e © 2004 Prentice-Hall, Inc. Chap 7-10
  • 11.
    Student’s t Distribution Note: t Normal as n increases Standard Normal (t with df > 30) t (df = 13) t-distributions are bell- shaped and symmetric, but have ‘fatter’ tails than the t (df = 5) normal 0 t Statistics for Managers Using Microsoft Excel, 4e © 2004 Prentice-Hall, Inc. Chap 7-11
  • 12.
    Confidence Interval forμ (σ Unknown) (continued)  Assumptions  Population standard deviation is unknown  Population is not highly skewed  Population is normally distributed or the sample size is large (>30)  Use Student’s t Distribution  Confidence Interval Estimate: S X t n-1 n (where t is the critical value of the t distribution with n-1 d.f. and an Statistics for Managers Using Microsoft Excel, 4e © 2004 Prentice-Hall, Inc. Chap 7-12
  • 13.
    Example A random sample of n = 25 has X = 50 and S = 8. Form a 95% confidence interval for μ  d.f. = n – 1 = 24, so t /2 , n 1 t.025,24 2.0639 The confidence interval is S 8 X t /2, n-1 50 (2.0639) n 25 46.698 ….. ….. 53.302 46.698 53.302 Statistics for Managers Using Microsoft Excel, 4e © 2004 Prentice-Hall, Inc. Chap 7-13
  • 14.
    Example d.f. = n – 1 = 24, so t /2 , n 1 t.025,24 2.0639 To get a t value use the TINV function. The value of alpha (1-confidence)/2 and n-1 degrees of freedom are the inputs needed. For 95% confidence use .025 and for a sample size of 25 use 24 df Result 2.0639 Statistics for Managers Using Microsoft Excel, 4e © 2004 Prentice-Hall, Inc. Chap 7-14
  • 15.
    Confidence Intervals Confidence Intervals Population Population Mean Proportion σ Known σ Unknown Statistics for Managers Using Microsoft Excel, 4e © 2004 Prentice-Hall, Inc. Chap 7-15
  • 16.
    Confidence Intervals forthe Population Proportion, p (continued)  Recall that the distribution of the sample proportion is approximately normal if the sample size is large, with standard deviation p(1 p) σp n  We will estimate this with sample data: ps(1 ps ) S ps n Statistics for Managers Using Microsoft Excel, 4e © 2004 Prentice-Hall, Inc. Chap 7-16
  • 17.
    Confidence Interval Endpoints  Upper and lower confidence limits for the population proportion are calculated with the formula ps(1 ps ) ps Z n  To get a Z value use the NORMSINV function with alpha/2 for 95% confidence use .025  Result 1.96 Statistics for Managers Using Microsoft Excel, 4e © 2004 Prentice-Hall, Inc. Chap 7-17
  • 18.
    Example  A random sample of 100 people shows that 25 are left-handed.  Form a 95% confidence interval for the true proportion of left-handers Statistics for Managers Using Microsoft Excel, 4e © 2004 Prentice-Hall, Inc. Chap 7-18
  • 19.
    Example (continued)  A random sample of 100 people shows that 25 are left-handed. Form a 95% confidence interval for the true proportion of left-handers. 1. ps 25/100 .25 Sps ps(1 ps )/n .25(.75)/1 00 .0433 2. 3. .25 1.96 (.0433) 0.1651 p 0.3349 Statistics for Managers Using Microsoft Excel, 4e © 2004 Prentice-Hall, Inc. Chap 7-19
  • 20.
    Interpretation  We are 95% confident that the true percentage of left-handers in the population is between 16.51% and 33.49%.  Although this range may or may not contain the true proportion, 95% of intervals formed from samples of size 100 in this manner will contain the true proportion. Statistics for Managers Using Microsoft Excel, 4e © 2004 Prentice-Hall, Inc. Chap 7-20
  • 21.
    Determining Sample Size Determining Sample Size For the For the Mean Proportion Statistics for Managers Using Microsoft Excel, 4e © 2004 Prentice-Hall, Inc. Chap 7-21
  • 22.
    Determining Sample Size Determining Sample Size For the Mean Sampling error (margin of error) σ σ X Z e Z n n Statistics for Managers Using Microsoft Excel, 4e © 2004 Prentice-Hall, Inc. Chap 7-22
  • 23.
    Determining Sample Size (continued) Determining Sample Size For the Mean σ Now solve Z σ 2 2 e Z for n to get n 2 n e Statistics for Managers Using Microsoft Excel, 4e © 2004 Prentice-Hall, Inc. Chap 7-23
  • 24.
    If σ isunknown  If σ is unknown it can be estimated from experience or  Select a pilot sample and estimate σ with the sample standard deviation, s Statistics for Managers Using Microsoft Excel, 4e © 2004 Prentice-Hall, Inc. Chap 7-24
  • 25.
    Determining Sample Size Determining Sample Size For the Proportion ps(1 ps ) p(1 p ) ps Z e Z n n Sampling error (margin of error) Statistics for Managers Using Microsoft Excel, 4e © 2004 Prentice-Hall, Inc. Chap 7-25
  • 26.
    Determining Sample Size (continued) Determining Sample Size For the Proportion p(1 p ) Now solve Z 2 p (1 p) e Z for n to get n 2 n e Statistics for Managers Using Microsoft Excel, 4e © 2004 Prentice-Hall, Inc. Chap 7-26
  • 27.
    PHStat Interval Options options Statistics for Managers Using Microsoft Excel, 4e © 2004 Prentice-Hall, Inc. Chap 7-27
  • 28.
    PHStat Sample SizeOptions Statistics for Managers Using Microsoft Excel, 4e © 2004 Prentice-Hall, Inc. Chap 7-28
  • 29.
    Using PHStat (for μ, σ unknown) A random sample of n = 25 has X = 50 and S = 8. Form a 95% confidence interval for μ Statistics for Managers Using Microsoft Excel, 4e © 2004 Prentice-Hall, Inc. Chap 7-29
  • 30.
    Using PHStat (sample size for proportion) How large a sample would be necessary to estimate the true proportion defective in a large population within 3%, with 95% confidence? (Assume a pilot sample yields ps = .12) Statistics for Managers Using Microsoft Excel, 4e © 2004 Prentice-Hall, Inc. Chap 7-30
  • 31.
    Applications in Auditing  Advantages of statistical sampling in auditing  Sample result is objective and defensible  Sample size estimation is done in advance on an objective basis  Provides an estimate of the sampling error  Can provide more accurate conclusions than a census of the population  Samples can be combined and evaluated by different auditors Statistics for Managers Using Microsoft Excel, 4e © 2004 Prentice-Hall, Inc. Chap 7-31
  • 32.
    Confidence Interval for Population Total Amount  Point estimate: Population total NX  Confidence interval estimate: S N n NX N( t n 1 ) n N 1 (This is sampling without replacement, so use the finite population correction in the confidence interval formula) Statistics for Managers Using Microsoft Excel, 4e © 2004 Prentice-Hall, Inc. Chap 7-32
  • 33.
    Confidence Interval for Population Total: Example An firm has a population of 1000 accounts and wishes to estimate the total population value. A sample of 80 accounts is selected with average balance of $87.6 and standard deviation of $22.3. Find the 95% confidence interval estimate of the total balance. Statistics for Managers Using Microsoft Excel, 4e © 2004 Prentice-Hall, Inc. Chap 7-33
  • 34.
    Confidence Interval for Total Difference  Point estimate: Total Difference ND  Where the average difference, D, is: n Di i 1 D n where Di audited value - original value Statistics for Managers Using Microsoft Excel, 4e © 2004 Prentice-Hall, Inc. Chap 7-34
  • 35.
    Confidence Interval for Total Difference (continued)  Confidence interval estimate: SD N n ND N( t n 1 ) n N 1 where n (Di D)2 i 1 SD n 1 Statistics for Managers Using Microsoft Excel, 4e © 2004 Prentice-Hall, Inc. Chap 7-35
  • 36.
    Ethical Issues  A confidence interval (reflecting sampling error) should always be reported along with a point estimate  The level of confidence should always be reported  The sample size should be reported  An interpretation of the confidence interval estimate should also be provided Statistics for Managers Using Microsoft Excel, 4e © 2004 Prentice-Hall, Inc. Chap 7-36
  • 37.
    Chapter Summary  Introduced the concept of confidence intervals  Discussed point estimates  Developed confidence interval estimates  Determined confidence interval estimates for the mean (σ unknown)  Created confidence interval estimates for the proportion  Determined required sample size for mean and proportion estimation samples Statistics for Managers Using Microsoft Excel, 4e © 2004 Prentice-Hall, Inc. Chap 7-37
  • 38.
    Chapter Summary (continued)  Developed applications of confidence interval estimation in auditing  Confidence interval estimation for population total  Confidence interval estimation for total difference in the population  Addressed confidence interval estimation and ethical issues Statistics for Managers Using Microsoft Excel, 4e © 2004 Prentice-Hall, Inc. Chap 7-38