Downloaded 459 times
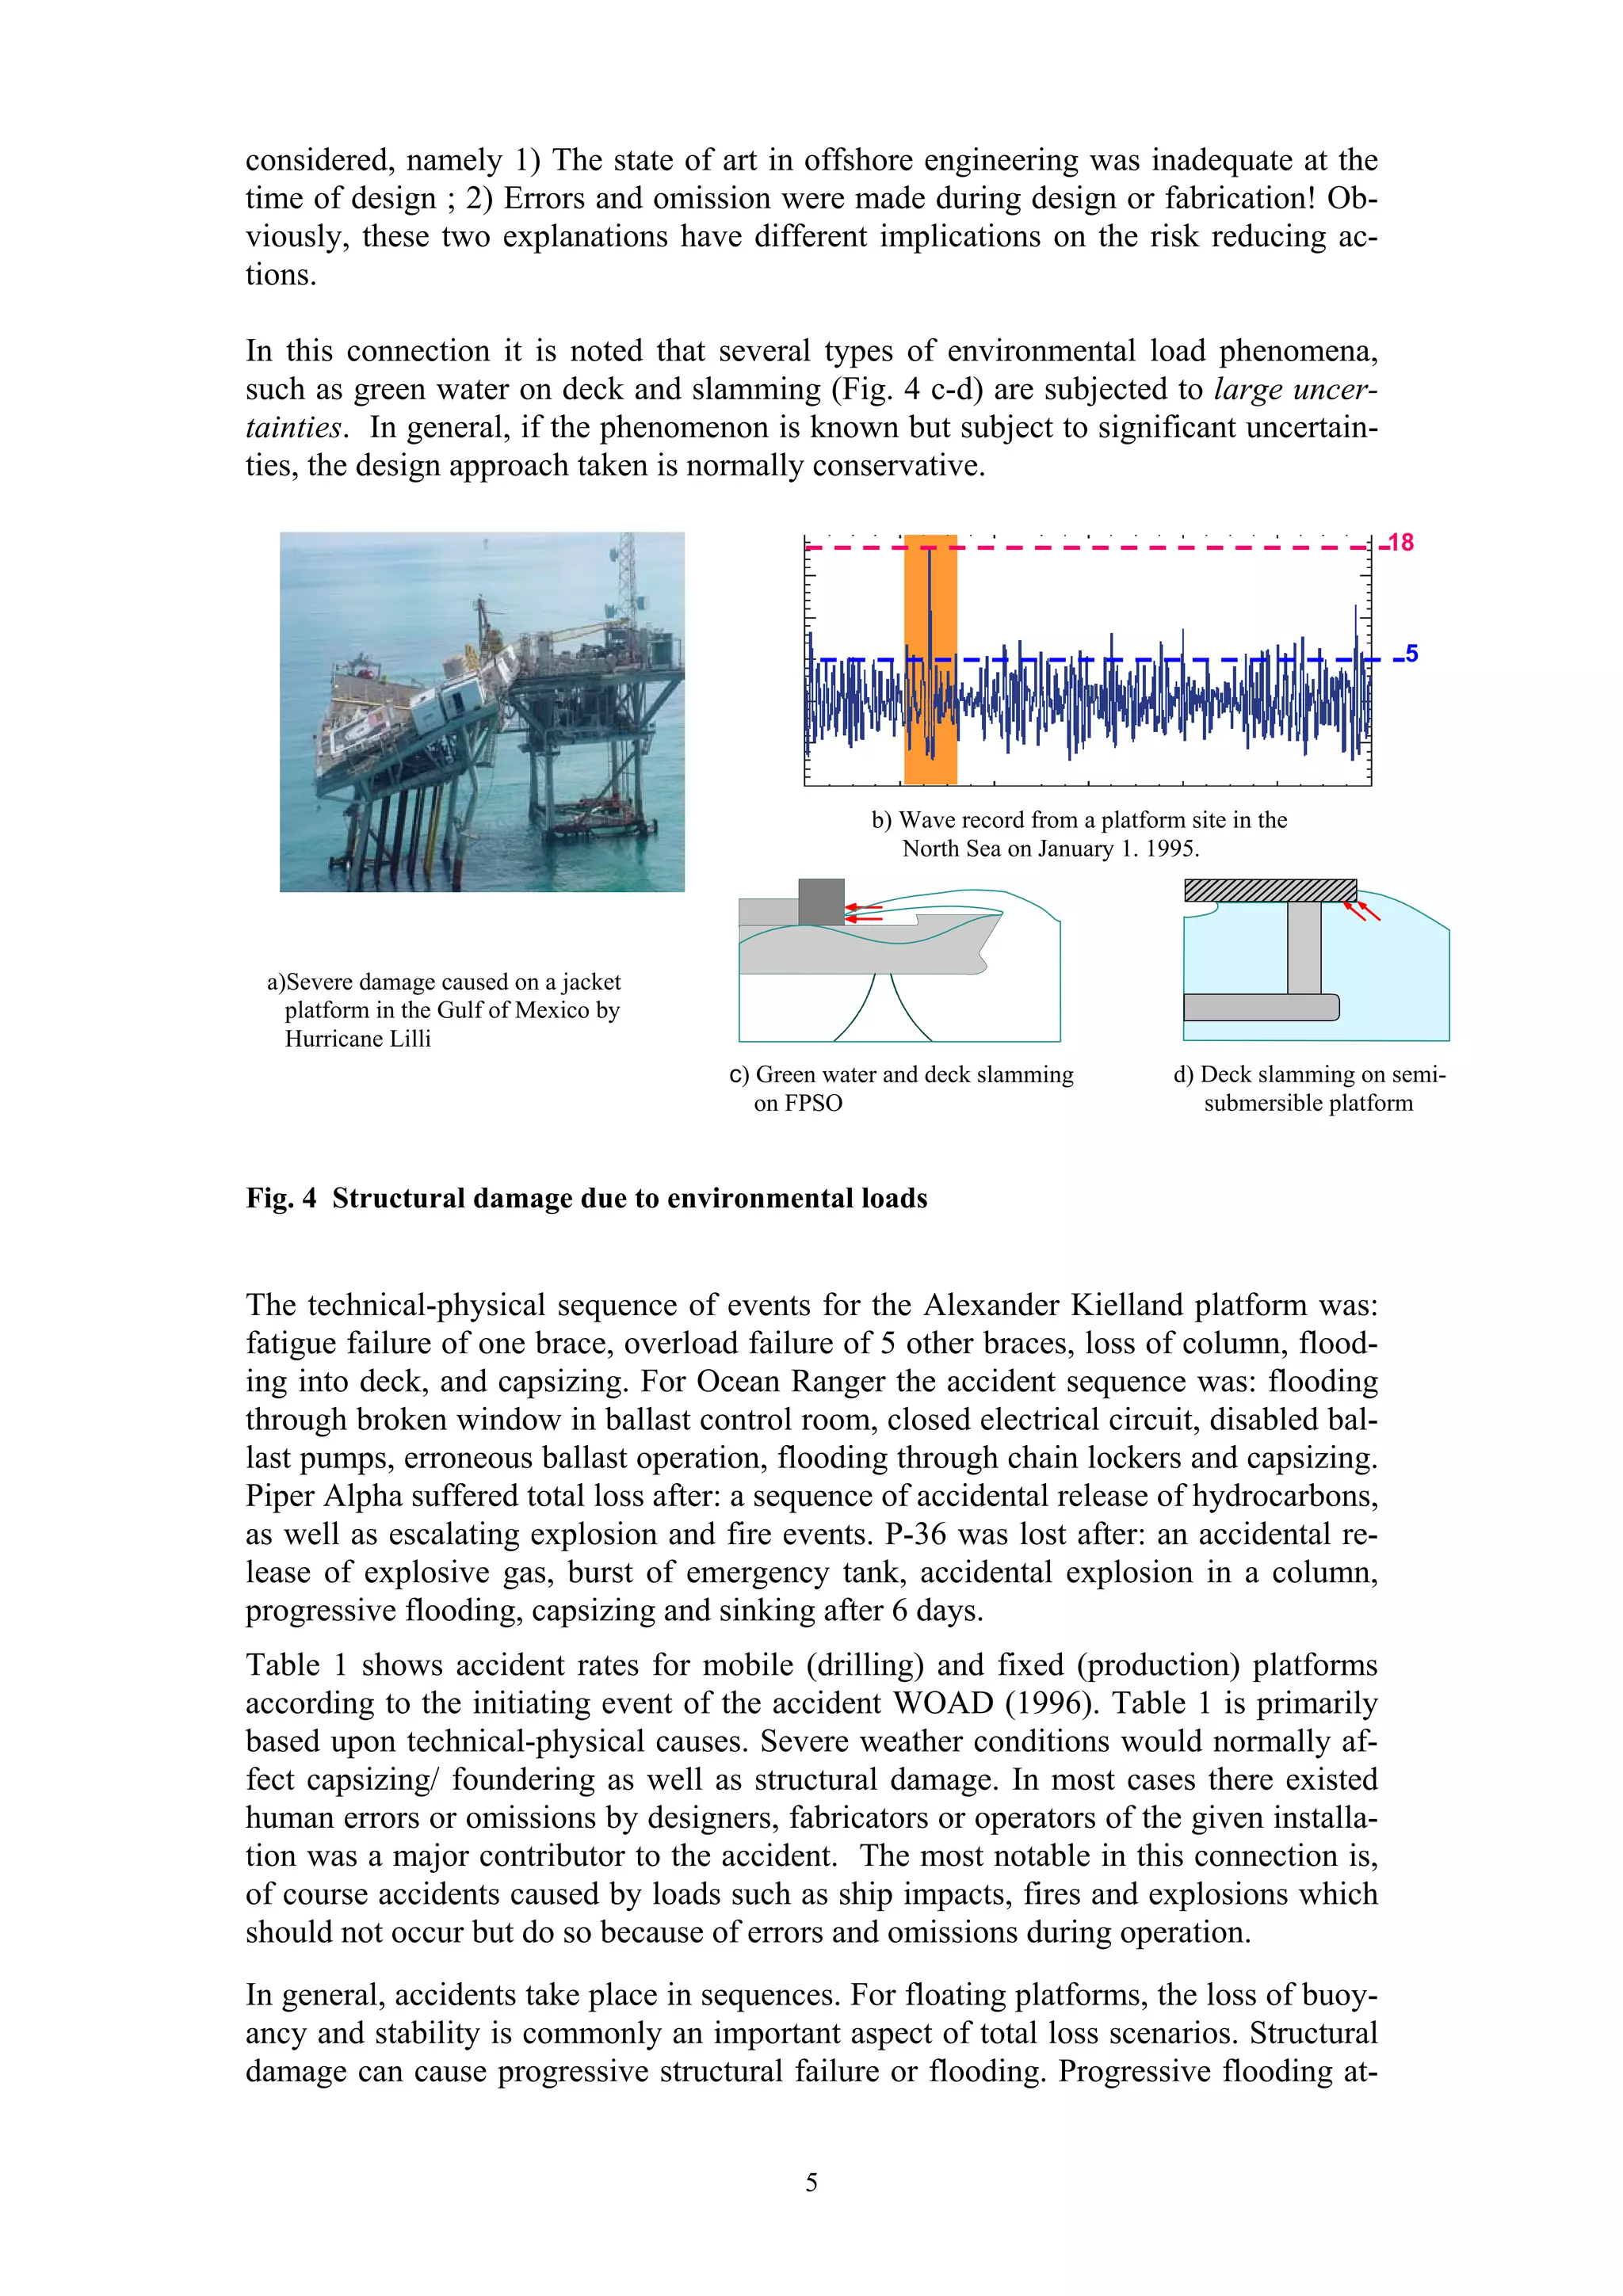
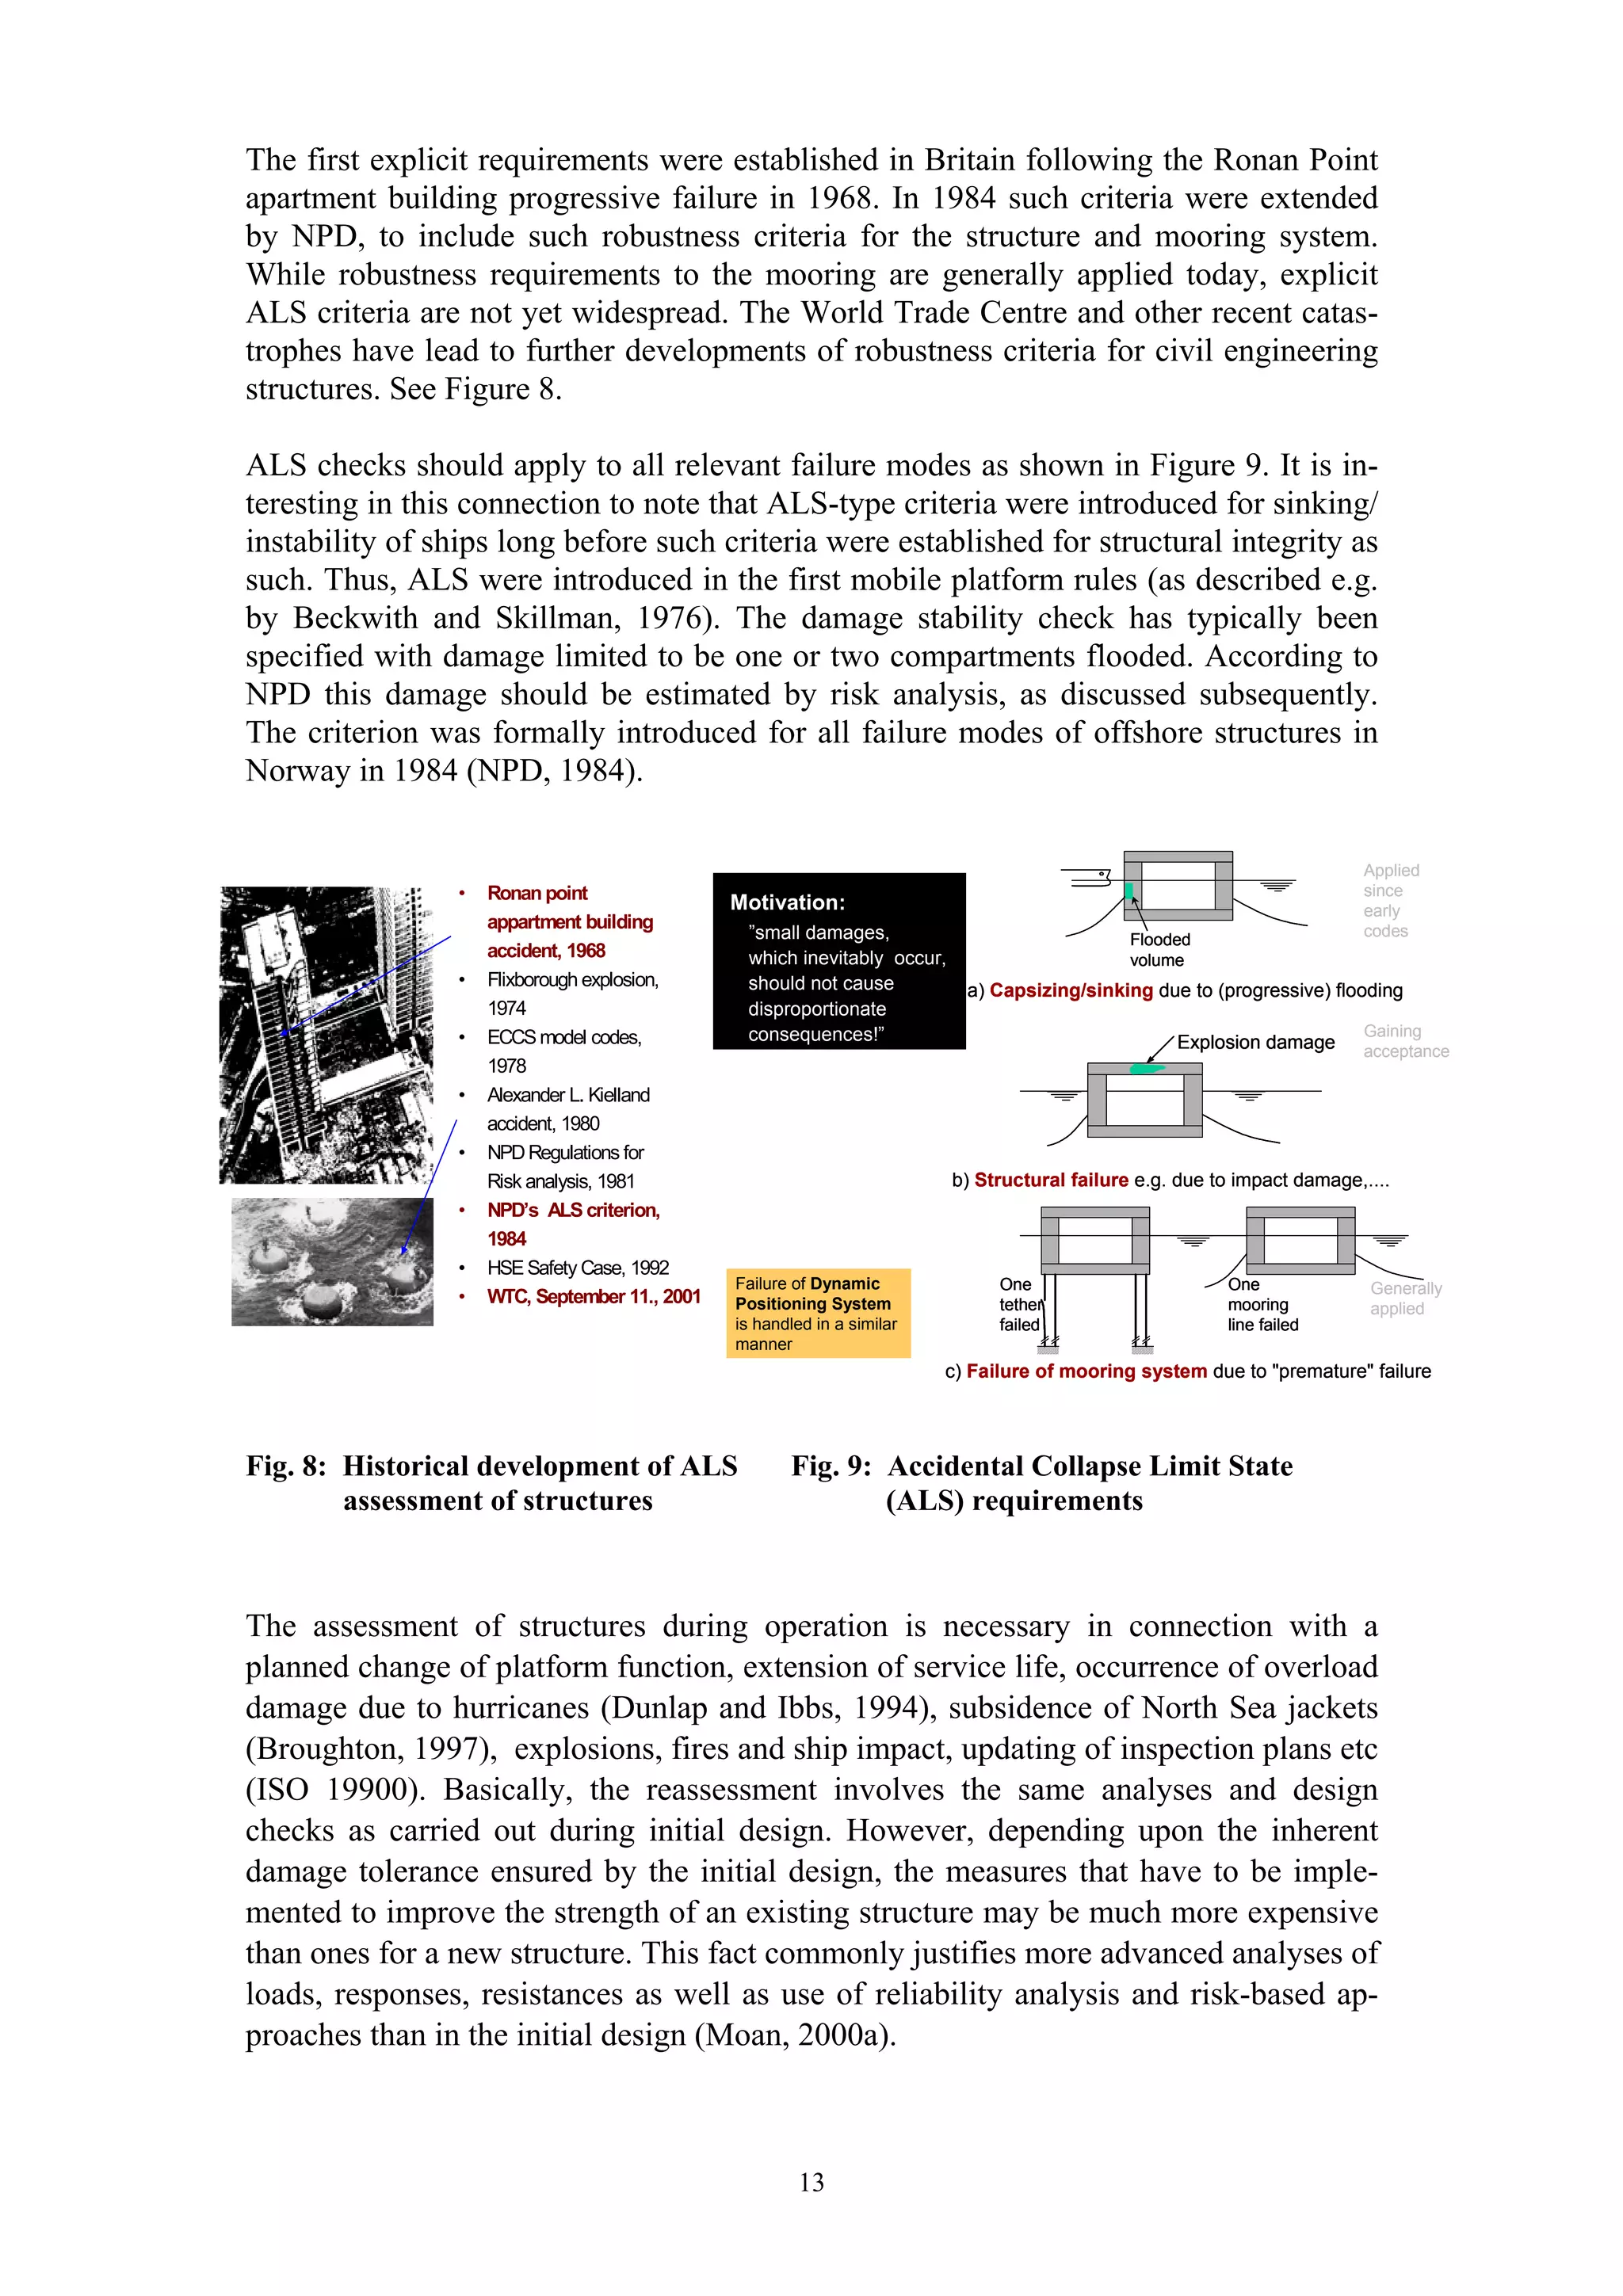
![proved inspection method or increased frequency of inspections. The following sec-
tion briefly describes how fatigue design and inspection plans (based on an assumed
inspection method) can be established by reliability analysis to ensure an acceptable
safety level.
3.4 Quantitative Measures of Safety
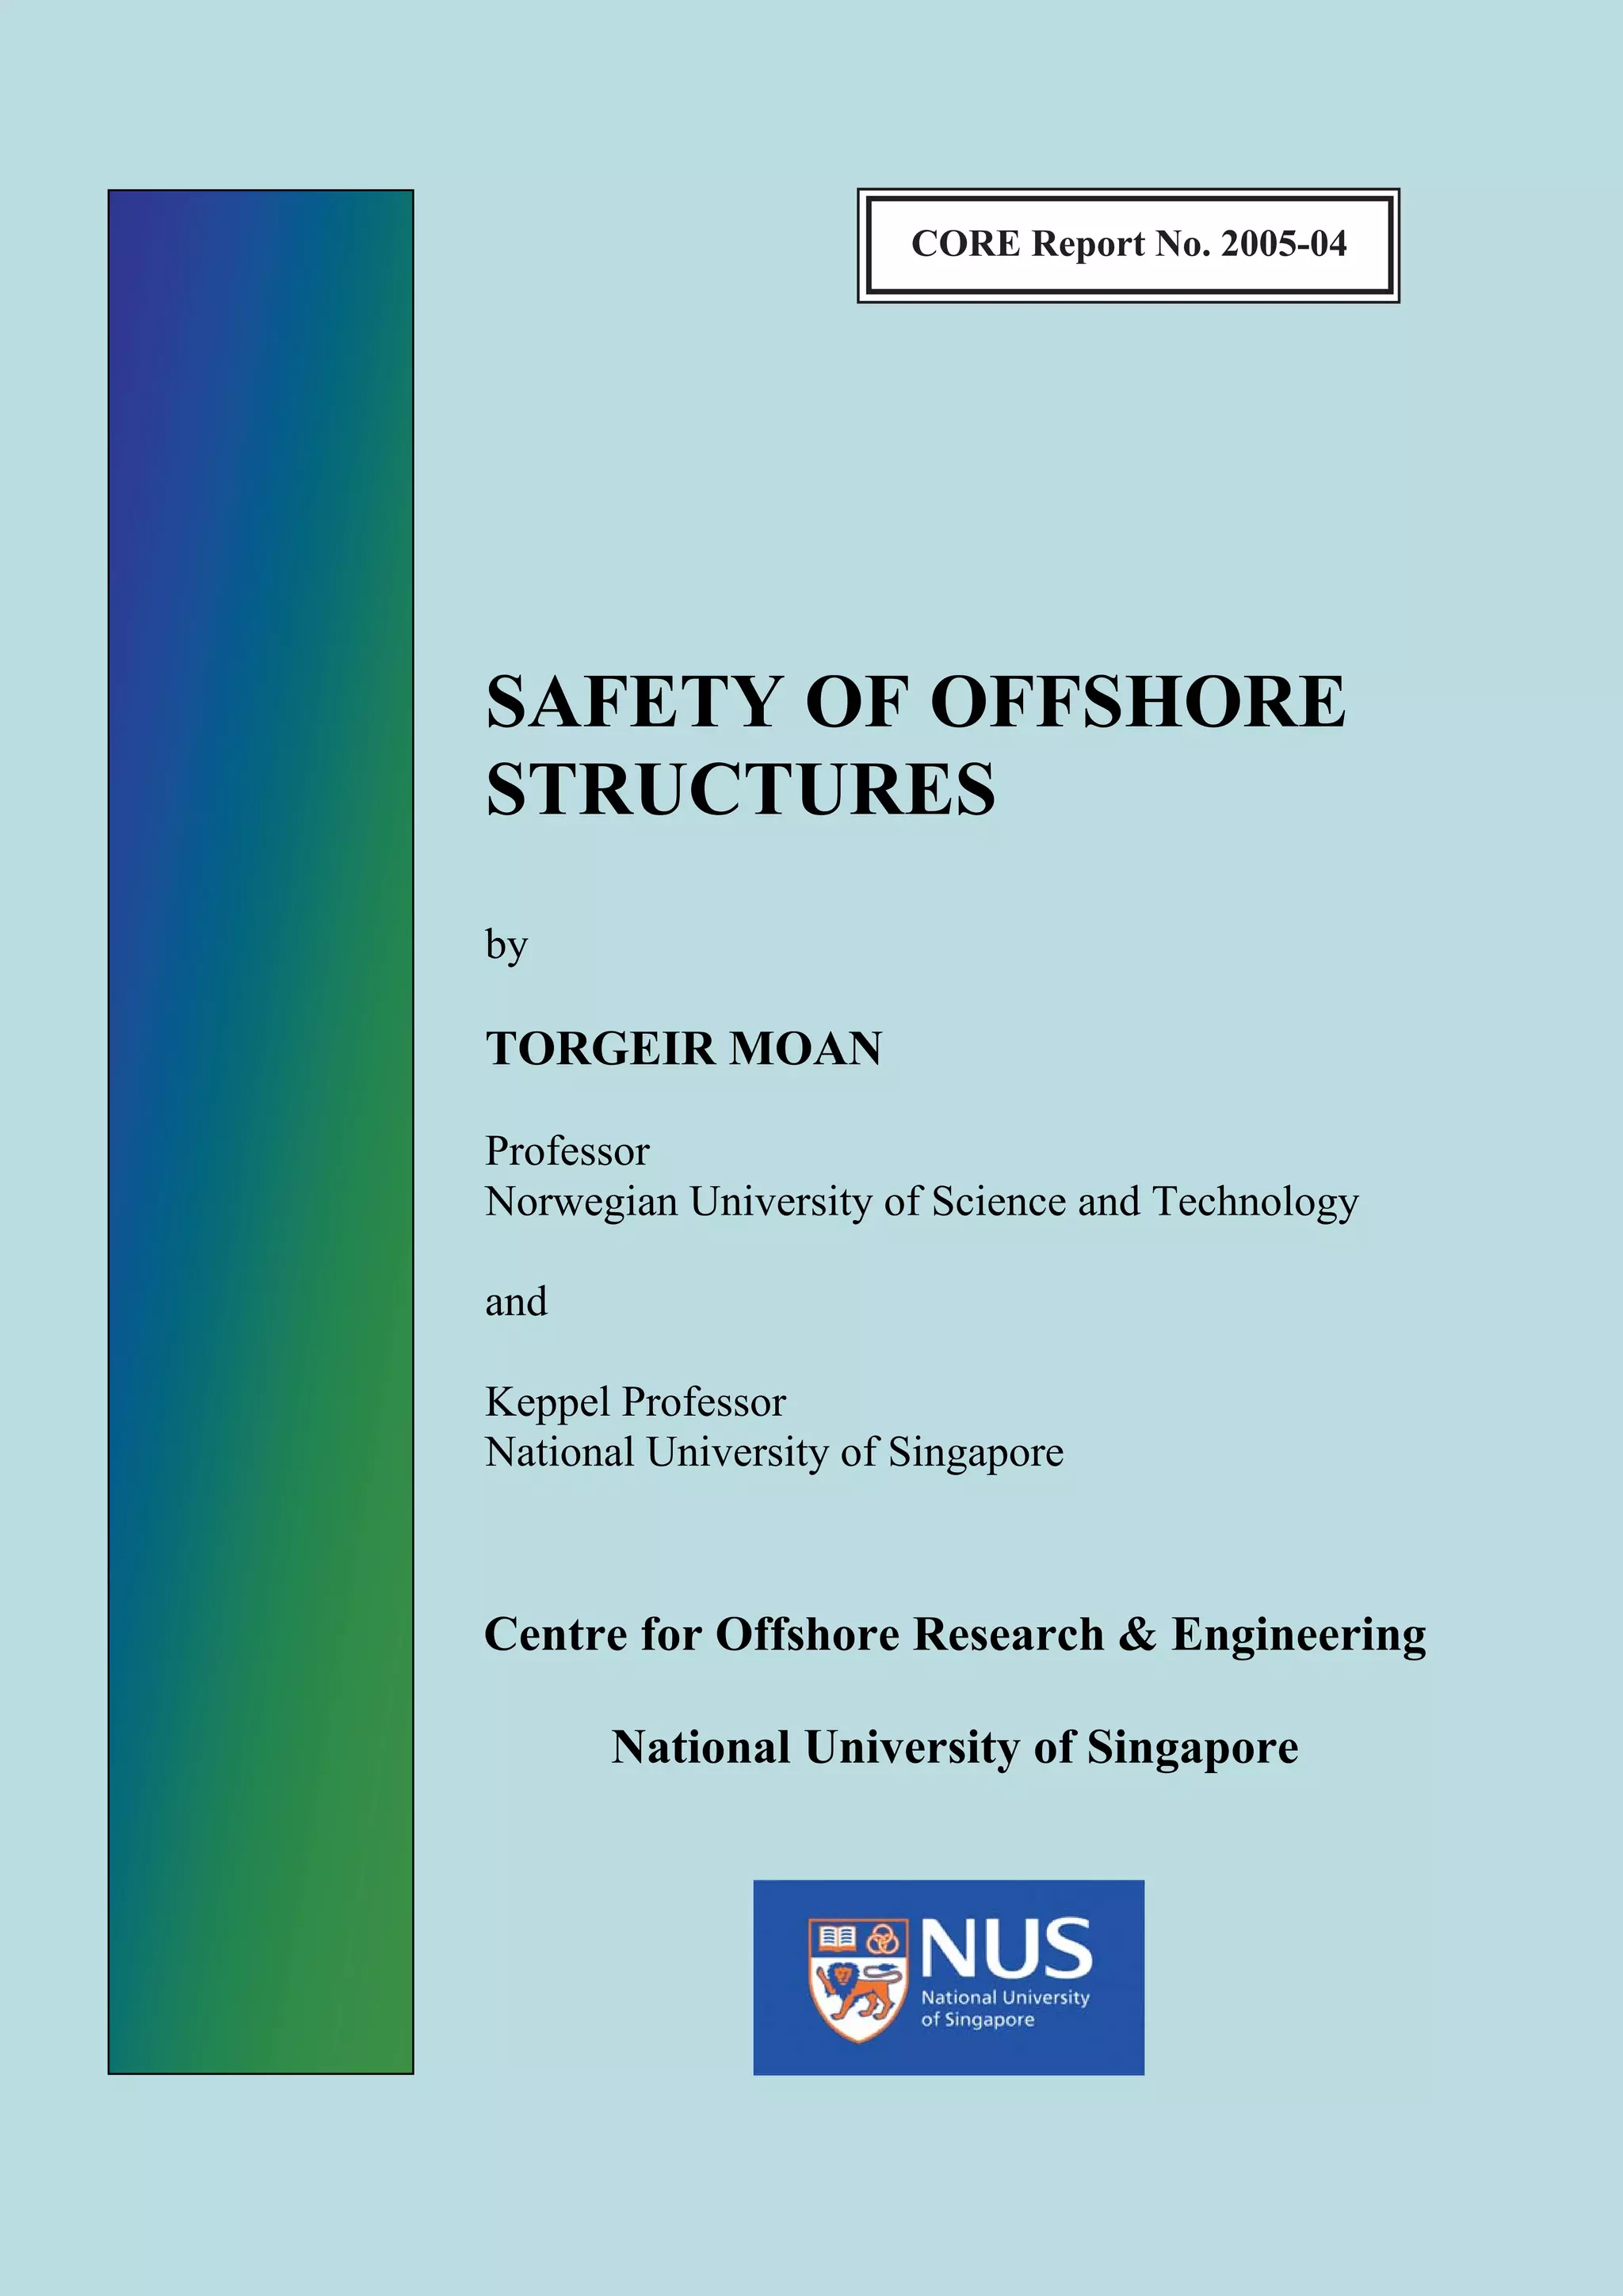
Ideally the structural safety should be measured in a quantitative manner. Structural
reliability methods are applied to determine the failure probability, Pf which is asso-
ciated with normal uncertainties and variability in loads and resistance. Quantitative
risk assessment can be used to deal with the probability of undesirable events and
their consequences in general terms. This includes events induced by errors and omis-
sions, see Fig. 10.
Structural reliability analysis
Deck
Column
Prob. density function
Load effect
fS(s)
R,S Wave
pressure
Resistance fR(r)
PF=P[R≤S]
Uncertainty in R and S can be
r,s modelled by probability density
Quantitative risk analysis
End
events
Critical
event
Fault
tree Event
tree
Consequences
Fig. 10: Methods for quantifying the risk or safety level
The quantitative safety approach is based on estimating the implied failure probability
and comparing it with an acceptance level. This target safety level should depend
upon the following factors (e.g. Moan, 1998):
- type of initiating events (hazards) such as environmental loads, various accidental
loads, .. which may lead to different consequences
- type of SRA method or structural risk analysis, especially which uncertainties are
included
- failure cause and mode
- the possible consequences of failure in terms of risk to life, injury, economic losses
and the level of social inconvenience.
- the expense and effort required to reduce the risk.
In principle a target level which reflects all hazards (e.g. loads) and failure modes
(collapse, fatigue, ... ) as well as the different phases (in-place operation and tempo-
rary phases associated with fabrication, installation and repair) is defined with respect
to each of the three categories of ultimate consequences. The most severe of them
governs the decisions to be made. If all consequences are measured in economic
terms, then a single target safety level could be established. However, in practice it is
convenient to treat different hazards, failure modes, and phases separately, with sepa-
rate target levels. This may be reasonable because it is rare that all hazard scenarios
15](https://image.slidesharecdn.com/safetyforoffshorestructure-120611222506-phpapp01/75/Safety-for-offshore-structure-19-2048.jpg)
![and failure modes contribute equally to the total failure probability. The principle of
establishing target levels for each hazard separately was adopted by NPD for acciden-
tal loads; see e.g. Moan et al. (1993b). It was also advocated by Cornell (1995). In
general it is recommended to calibrate the target level to correspond to that inherent in
structures which are considered to have an acceptable safety.
3.5 Structural reliability analysis
General
Structural reliability methods for calculating the failure probability are readily avail-
able. If the uncertainty in the resistance R and load effect S are described by probabil-
ity density functions. The failure probability can be calculated as P (R<S). It is impor-
tant to recognize that there are different types of uncertainties used to determine the
resultant uncertainties associated with loads and resistances. One type of uncertainty
(Type 1) is natural or inherent; this type of uncertainty is ‘information insensitive’ and
random. A second type of uncertainty (Type 2) is associated with modelling, paramet-
ric, and state uncertainties; this type of uncertainty is ‘information sensitive’ and sys-
tematic. Type 2 model uncertainties may be defined as the ratio of the actual or true
value of the variable to the predicted or nominal (design) value of the variable. A va-
riety of methods can be used to characterize the model uncertainty, including field test
data, laboratory test data, numerical data, and ‘expert’ judgment. Often it is not possi-
ble to develop explicit separations of Type 1 and Type 2 uncertainties and it is impor-
tant not to include them twice.
SRA is applied to determine the failure probability considering fundamental
variability, as well as uncertainties due to the lack of knowledge in loads, load effects
and resistance. The state of the art methods for calculating the failure probability are
the numerical First Order and Second Order Reliability as well as Monte Carlo
simulation methods (e.g. Melchers, 1999). However, analytical solutions exists for a
few cases, for instance, when failure is expressed by g( ) =R – S ≤ 0 and both the
resistance R and the load effect S are lognormal random variables.
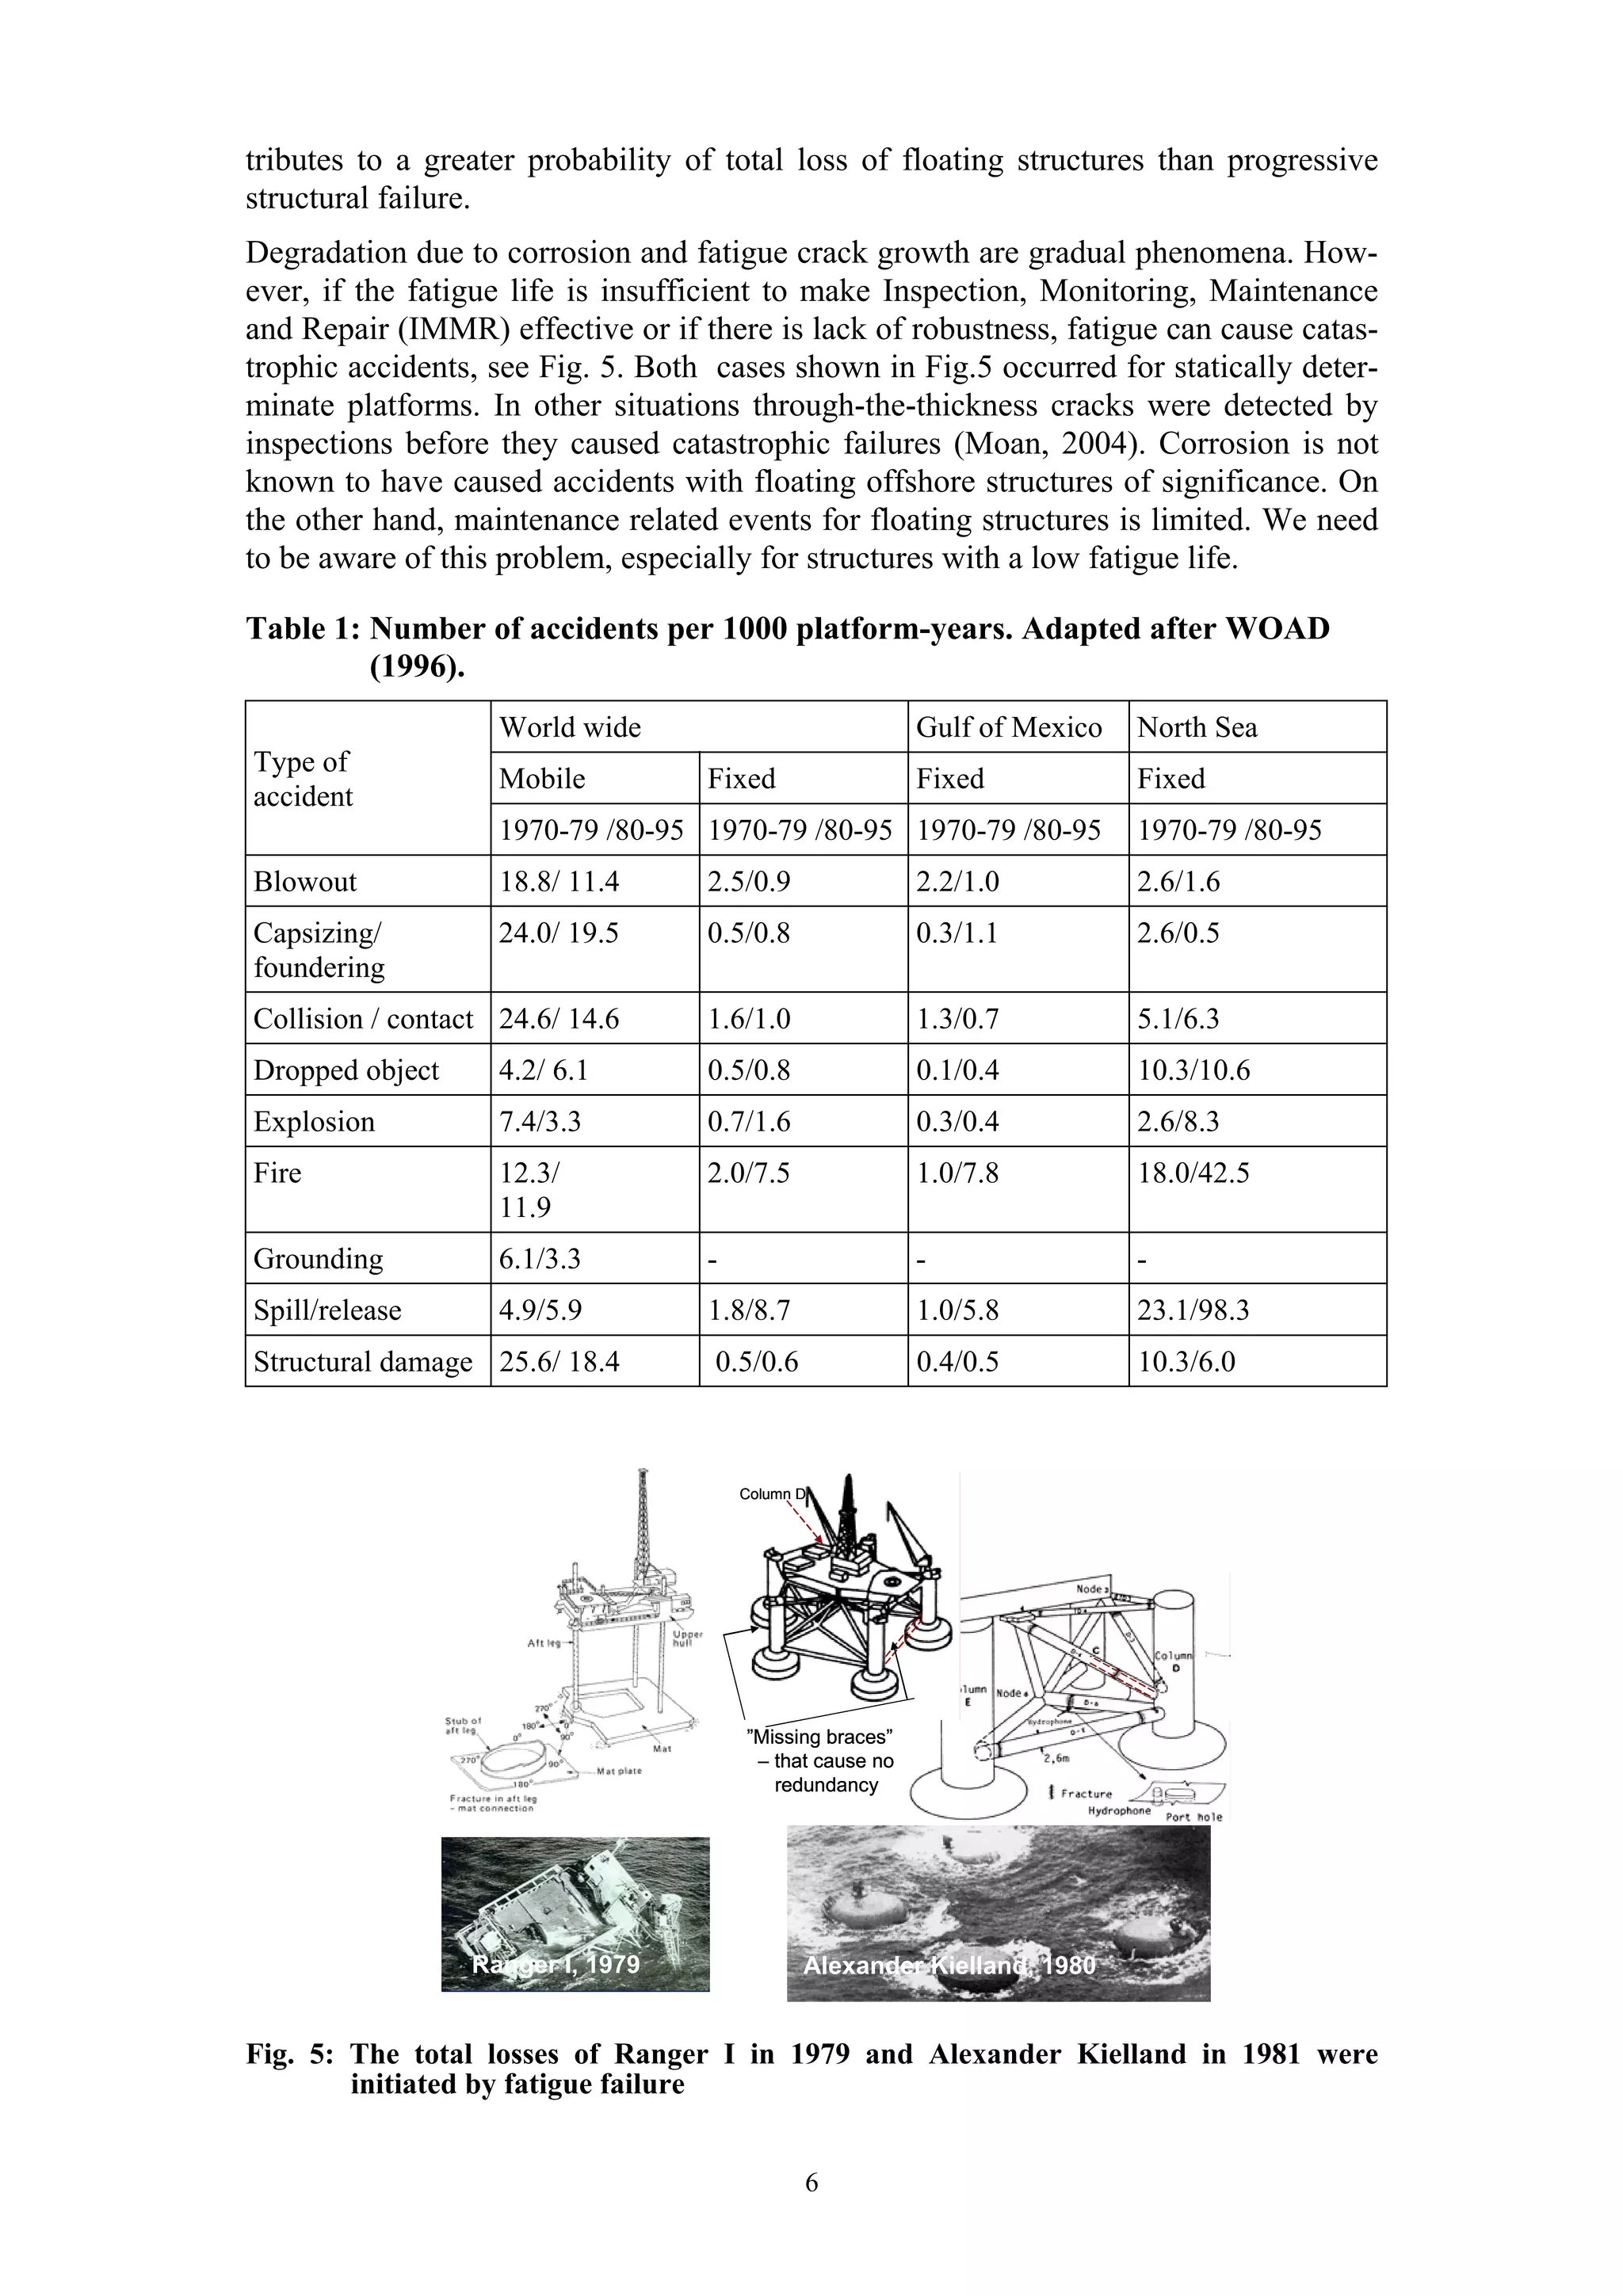
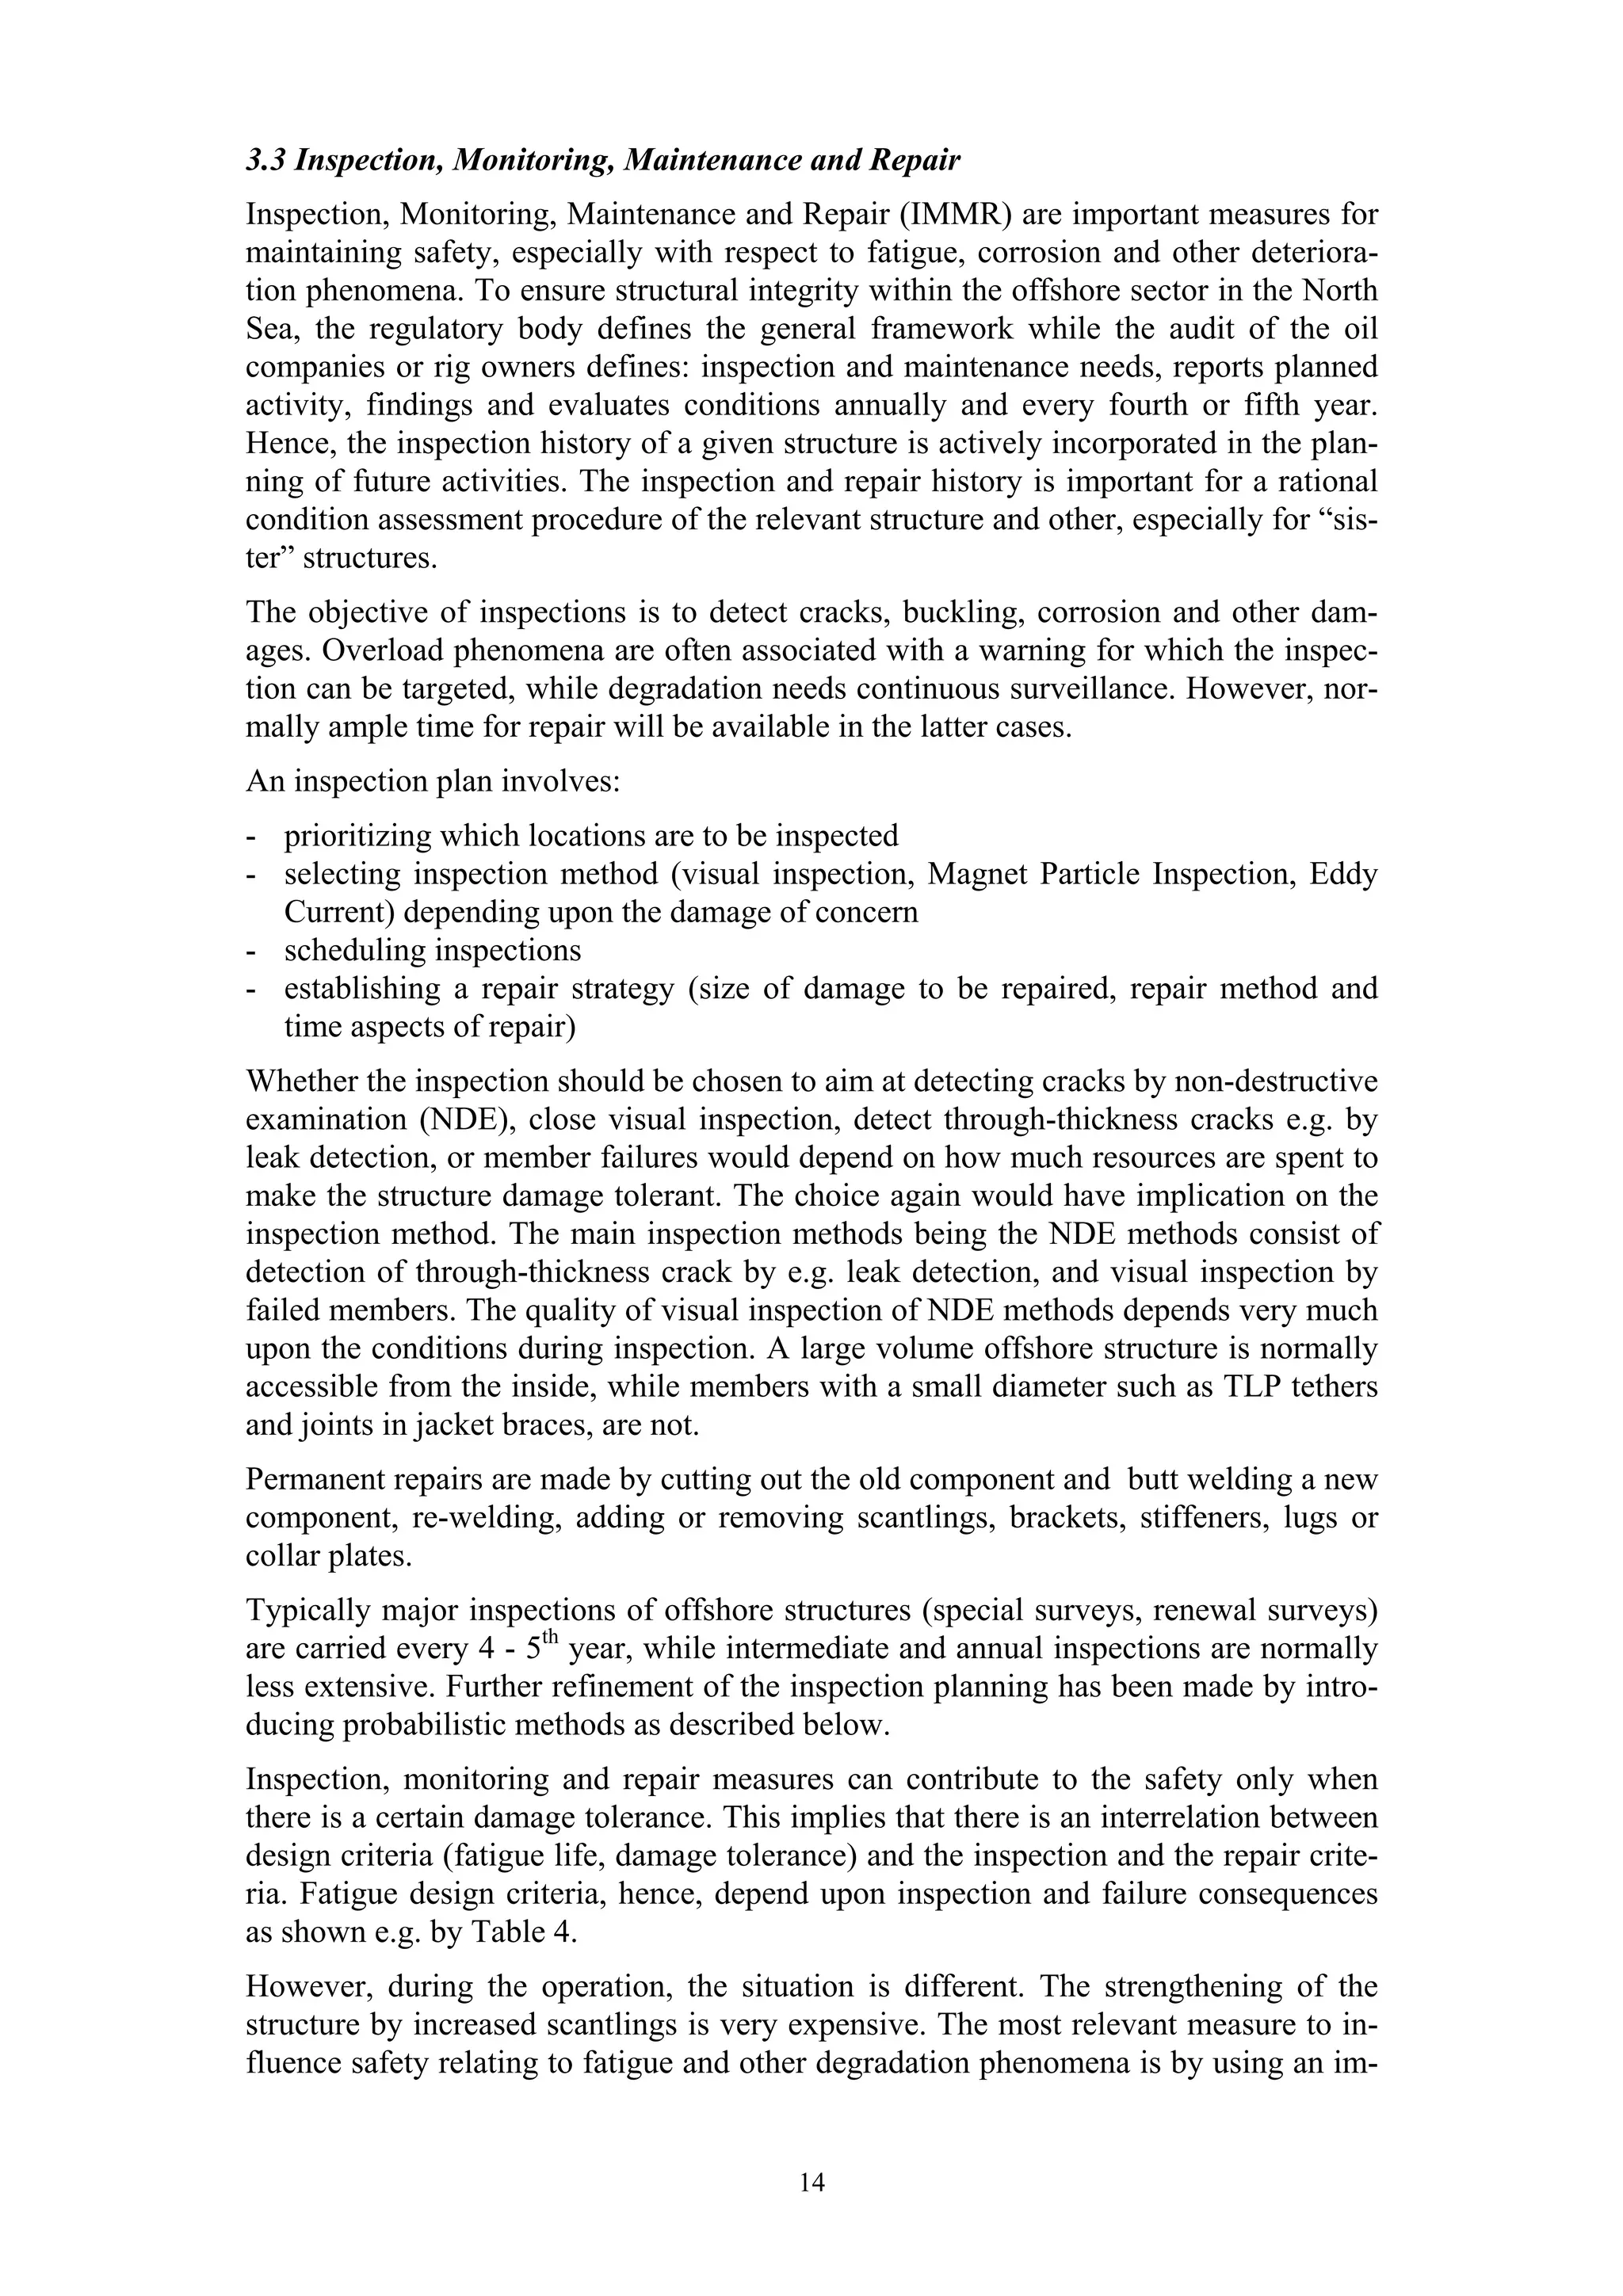
The failure probability is expressed by:
Pf = P( g () ≤ 0) = Φ ( −β) or β = −Φ −1 ( Pf ) (1)
where Φ(-β) is the standard cumulative normal distribution, with numerical values as
shown in Table 5, and the reliability index, β = βLN can be exactly written as follows,
see e.g. Melchers (1999):
⎡µ 1+V 2 ⎤
ln ⎢ R S⎥
⎢ µS 1+V 2 ⎥
⎣ R⎦ ln ( µR /µS )
β LN = ≈ = β' LN (2)
2 )(1 + 2 )]
ln[(1 + V R VS V 2 +V 2
R S
This simple expression has turned out to be useful and was applied in the API reliabil-
ity based code calibration (Moses, 1987). The analytical formulation can also conven-
iently be used to express the relationship between Pf and safety factors.
16](https://image.slidesharecdn.com/safetyforoffshorestructure-120611222506-phpapp01/75/Safety-for-offshore-structure-20-2048.jpg)
![Reliability estimates by account of inspection
The effect of the inspection on the reliability level can be illustrated by representing
the crack depth using a random variable, A(t) which is a function of time t. The qual-
ity of the inspection in terms of the detectable crack size is also represented by a ran-
dom variable, Ad. The distribution of Ad corresponds to the Probability of Detection
(POD) curve for the inspection method in question.
The failure probability at the time, t (N-cycles) can be formulated
Pf ( t ) = P(a f - a N ≤ 0 ) = P [ F ( 0, t )] (5)
where af and aN are the crack size at failure and after N cycles, respectively.
The outcomes of inspections are assumed to be no crack detection (ND) or crack de-
tection (D) at time t after N cycles, which are described by:
I ND ( t ) : a N -a d ≤ 0 (6a)
I D ( t ):a N -a d ≥ 0 (6b)
In general, it is difficult to determine the distribution of the crack size (A) explicitly
when taking into account all uncertainties that affect the distribution as well as the
effect of inspections. Based on the Paris’ crack propagation law, Eqs. (5-6) can be
recasted into a convenient form for analysis as shown e.g. by Madsen and Sørensen
(1990).
The effect of inspection may be viewed in two different ways depending upon
whether it is assessed before inspections are done, e. g. during the design phase, or
afterwards during operation. If the effect of inspections is estimated before they are
carried out, two outcomes: D and ND are possible. The exact outcome is not known
but the probability of the outcomes can be estimated based on the reliability method.
At the design stage, the outcomes (e.g., crack detection or no detection) are not
known. When a single inspection is assumed to be made at time tI and possible cracks
detected are repaired, the failure probability in the period t ≥ tI can be determined by:
Pf (t) = P [ F(0, t I )] + P [S(0, t I ) and F(t I , t) | ID (t I )] ⋅ P [ ID (t I )] + P [S(0, t I )and F(t1 , t) | I ND (t I )]⋅ P [ I ND (t I )] (7)
where F(t1,t2) and S(t1,t2) are, respectively, mean failure and survival in time period
(t1,t2). Equation (7) can be generalised to cover cases with several inspections with
two alternative outcomes. Moan et al. (1993a) showed, based on reliability analysis,
how the allowable cumulative damage (D) at the design stage can be relaxed when
inspections are carried out. Such analyses served as basis for Table 4.
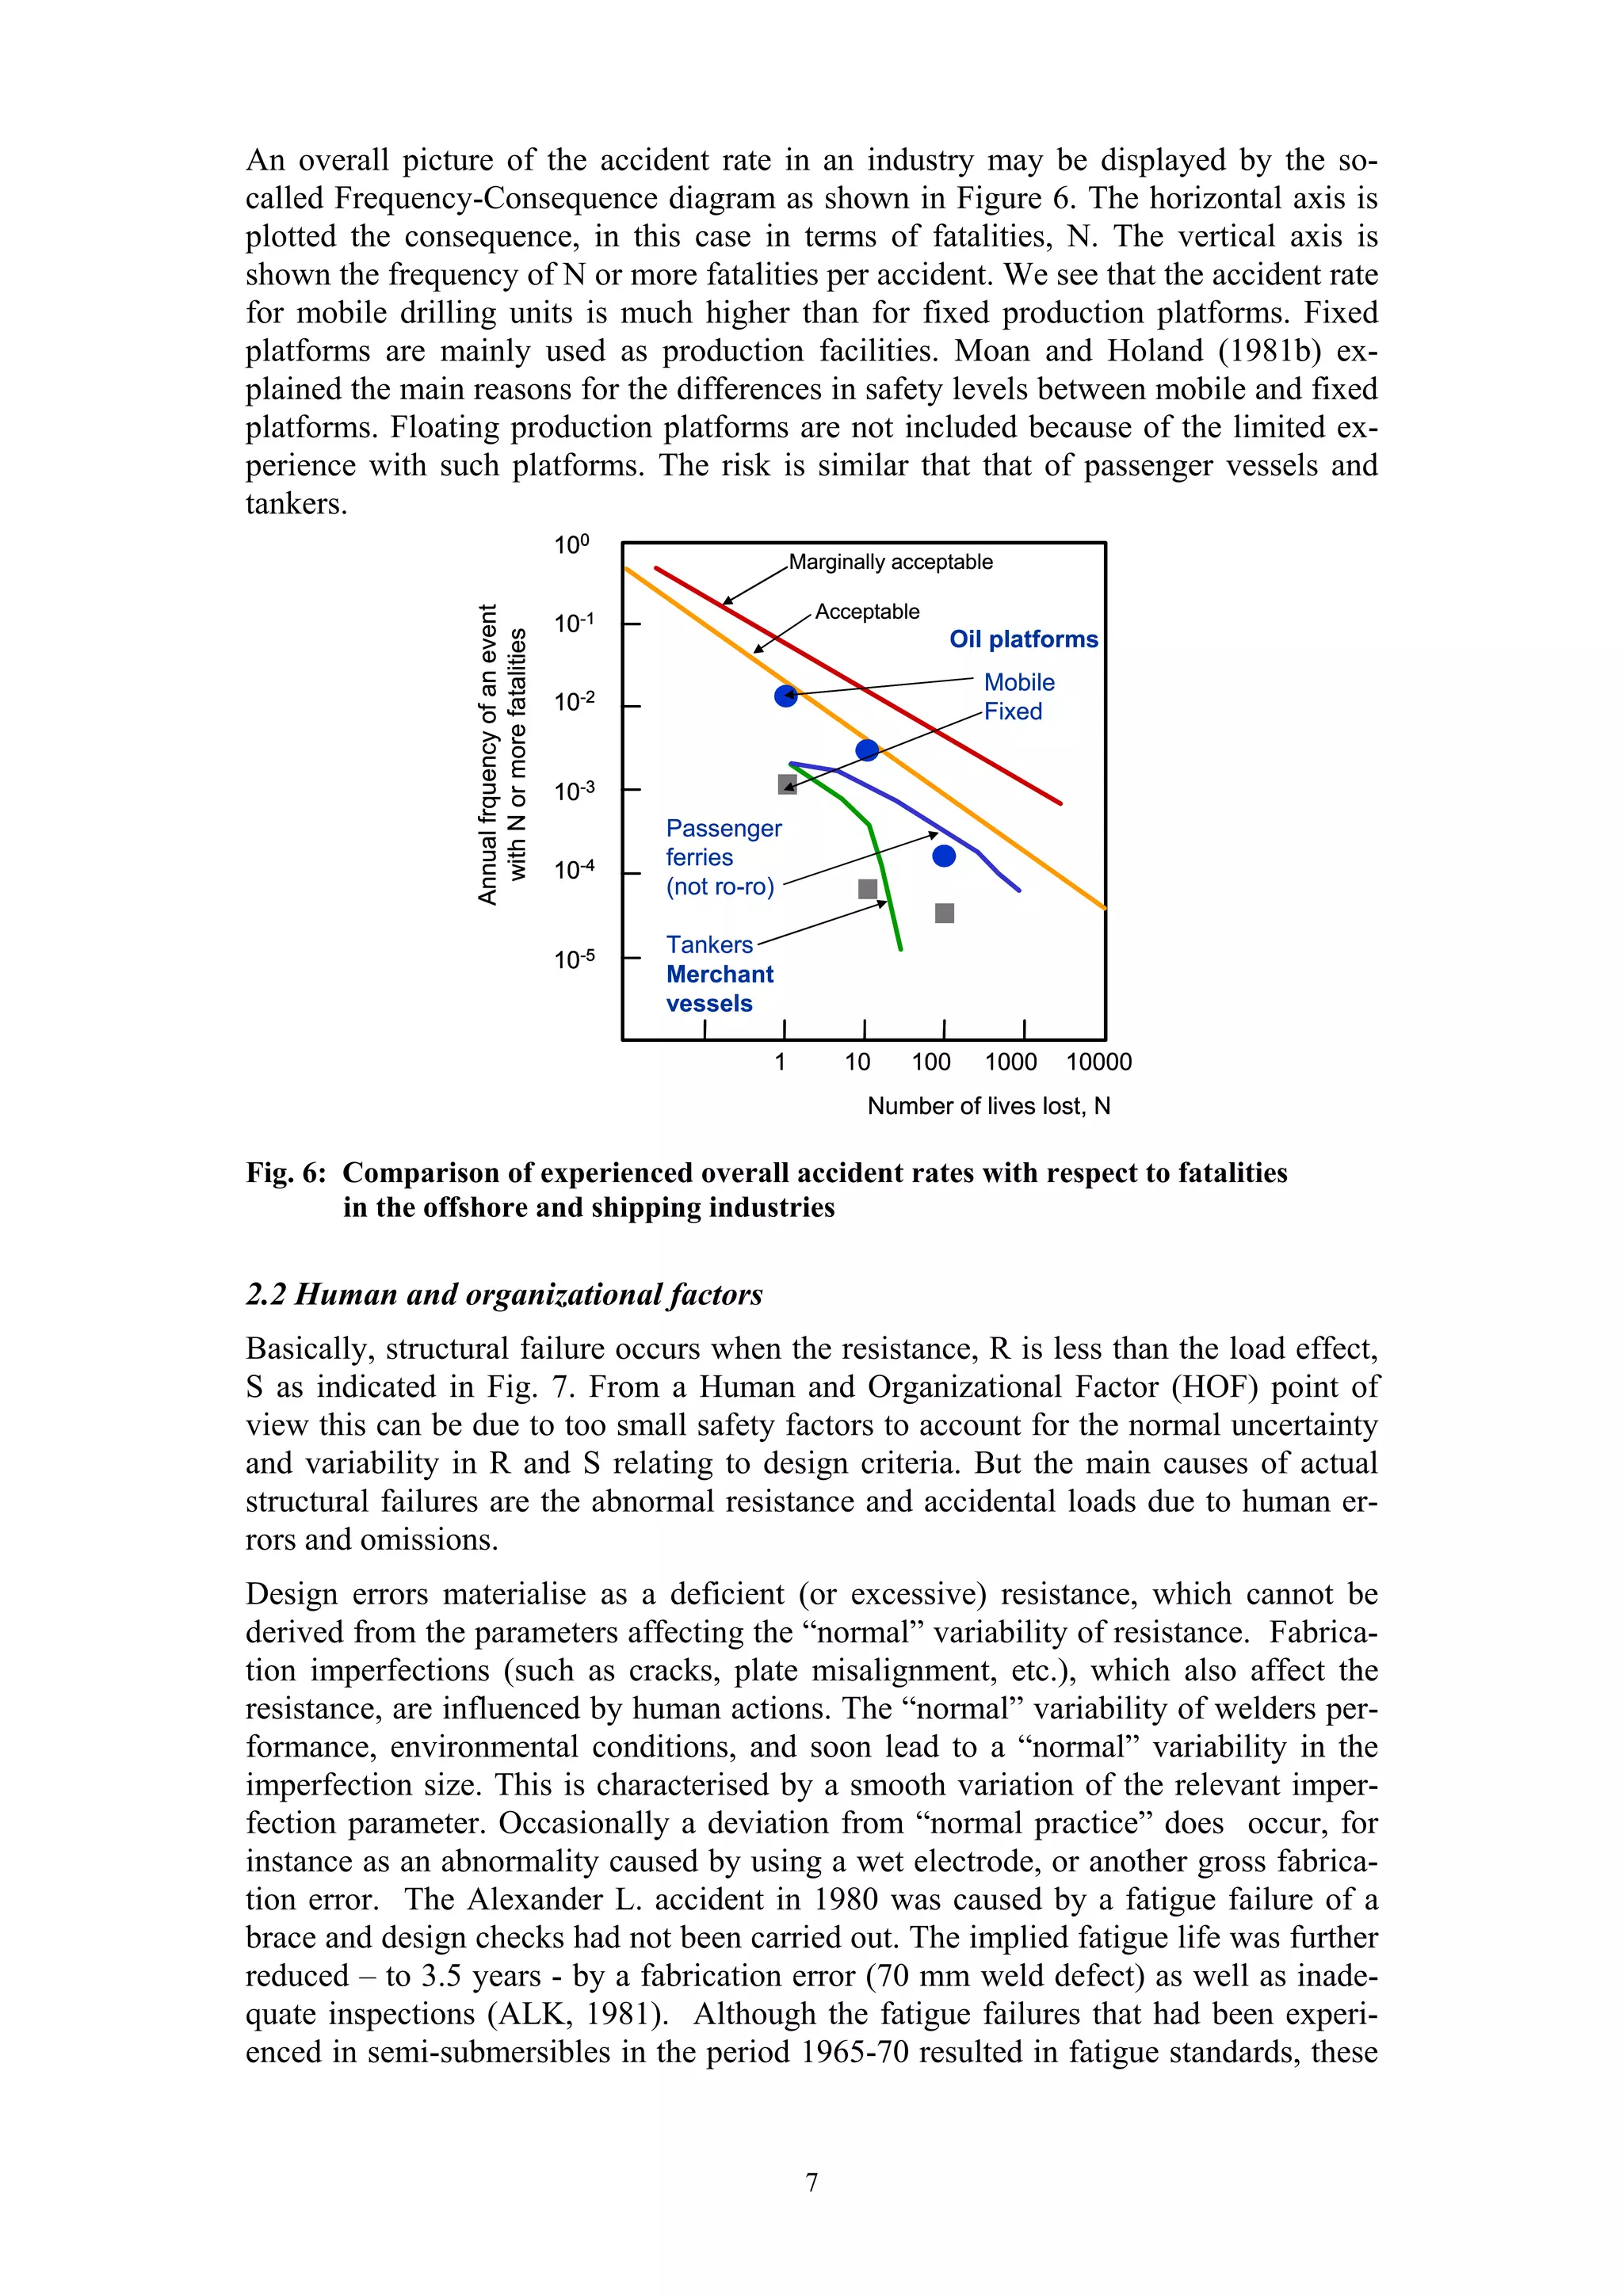
On the other hand if no failure has occurred before time tI and it is known that no
crack is detected at time tI, then the failure probability in the period t ≥ tI is
Pf (t) = P [ F(t I , t) | I ND (t I )] (8)
The knowledge of survival up to time tI and no crack detection at time tI reduces the
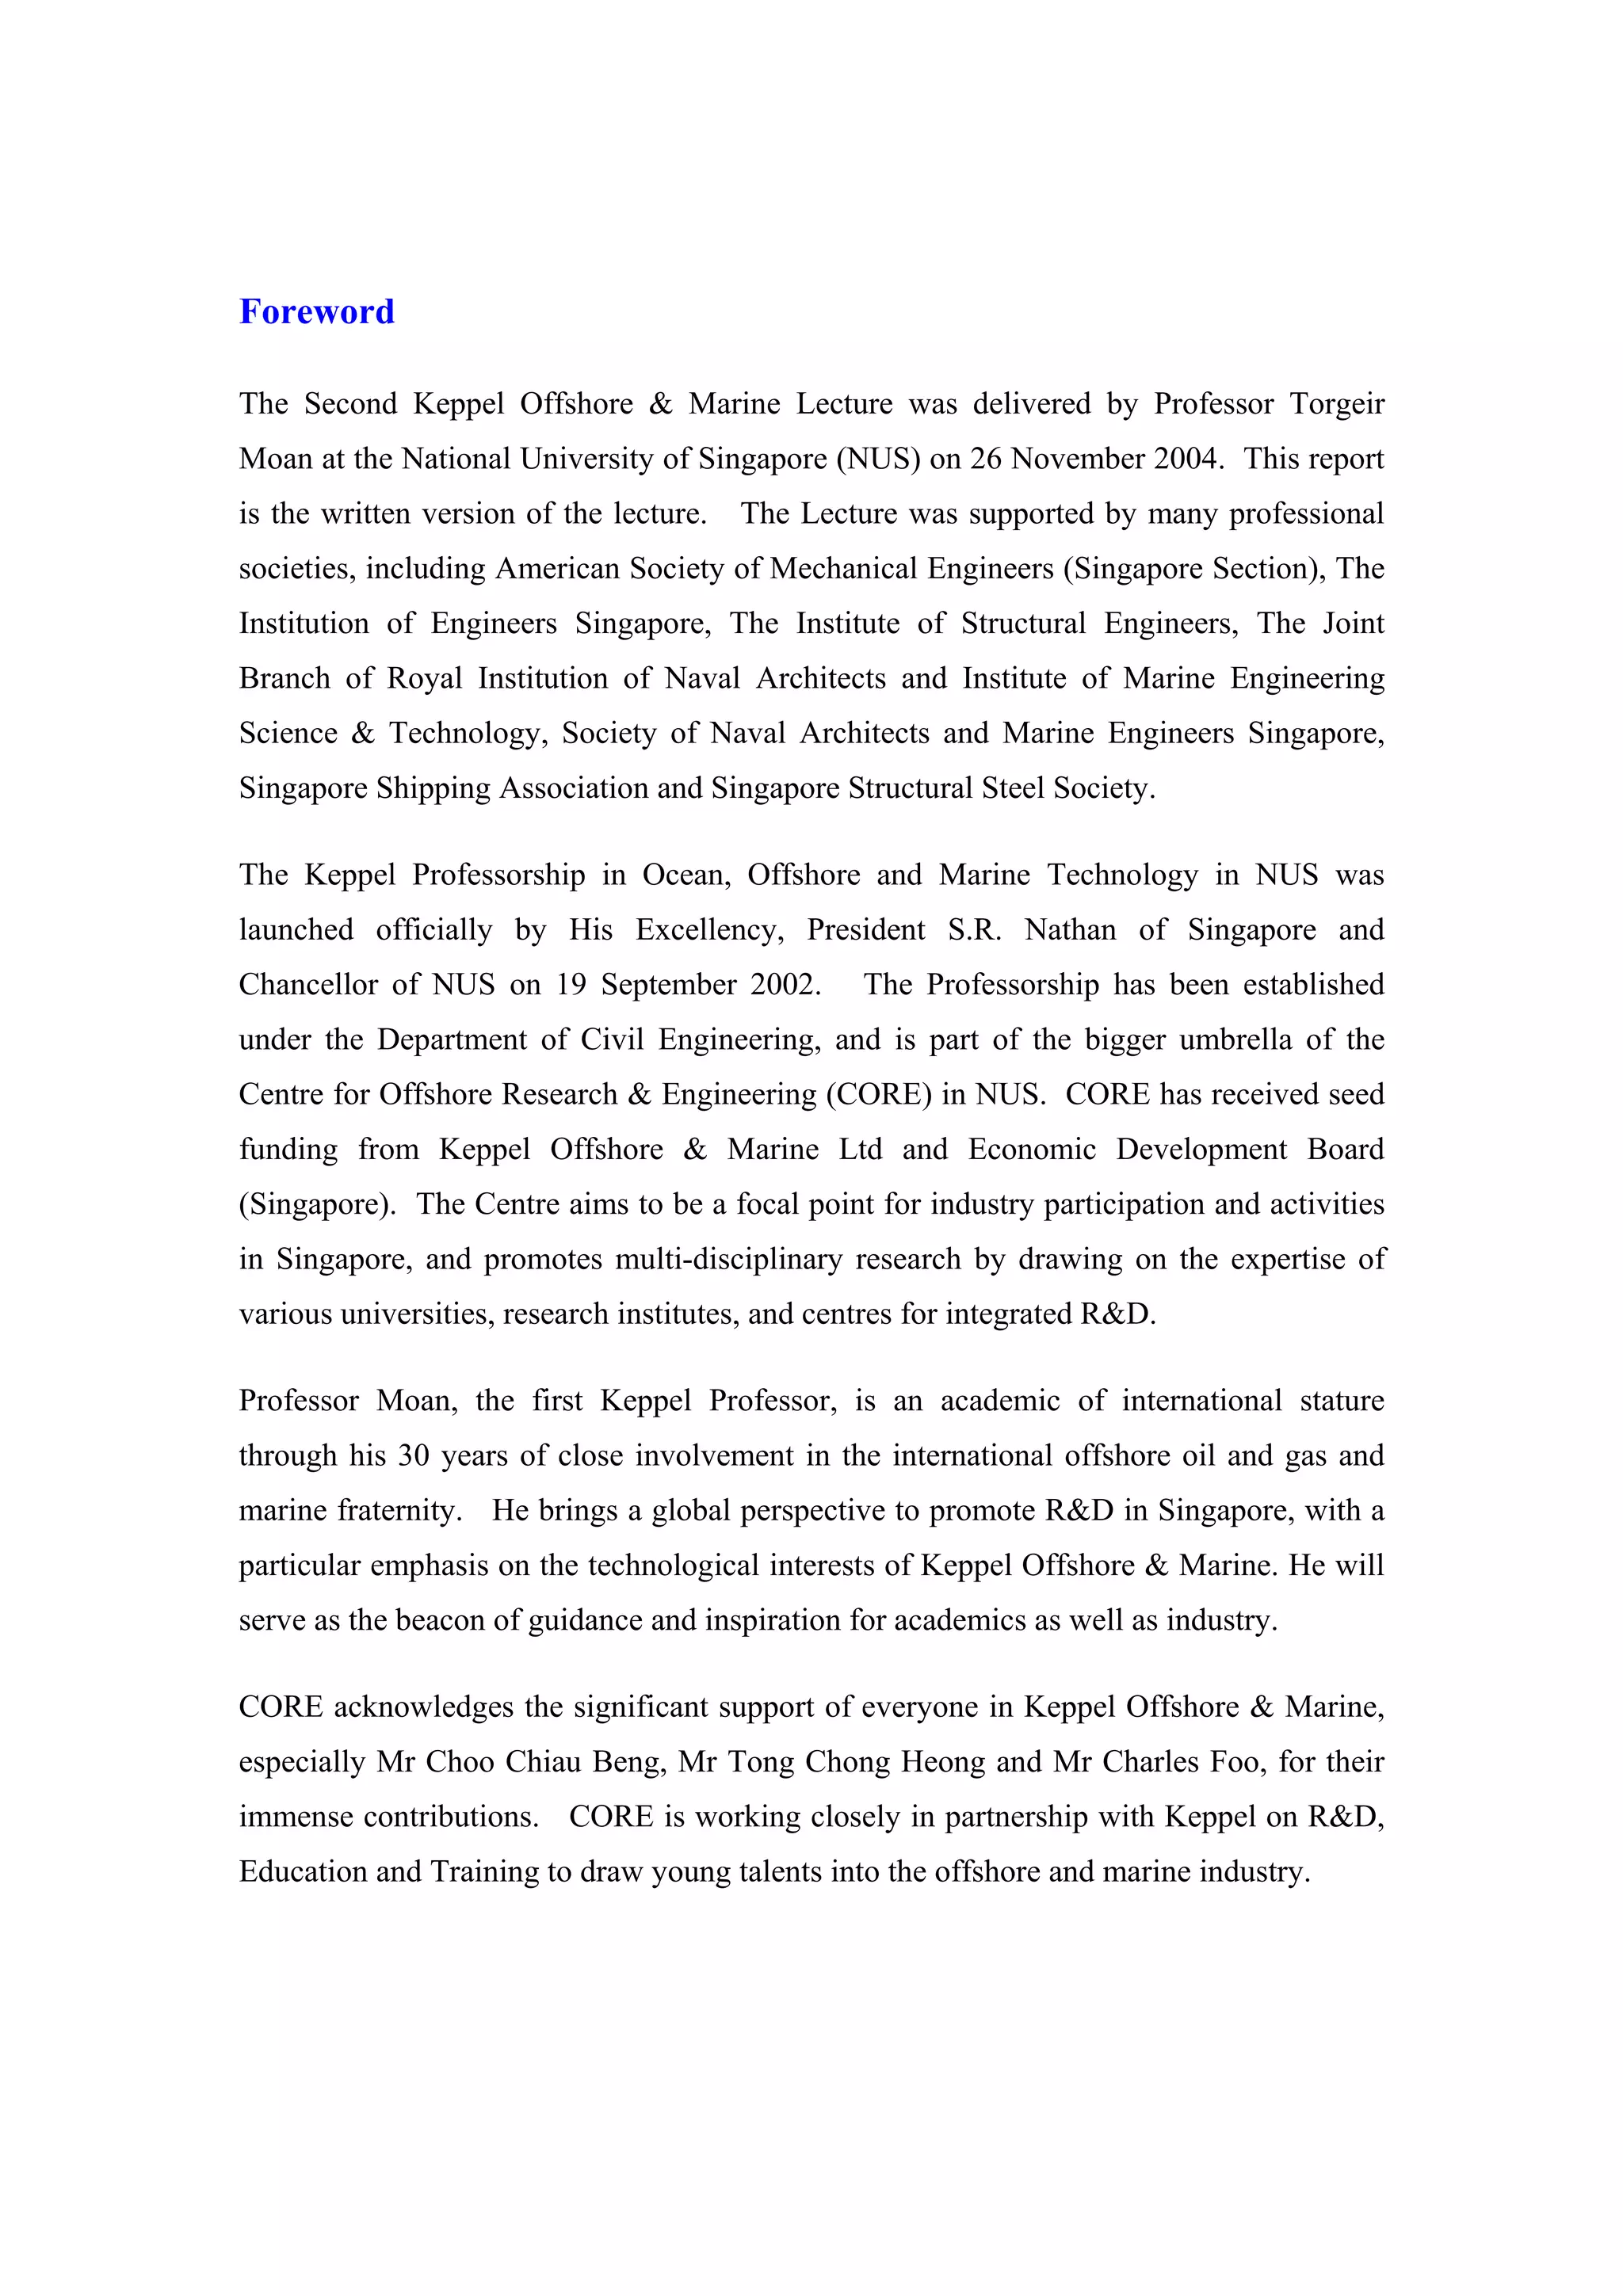
uncertainty and makes the failure probability drop. The reliability index β increases at
the time of inspection as illustrated by the example shown in Fig. 13.
19](https://image.slidesharecdn.com/safetyforoffshorestructure-120611222506-phpapp01/75/Safety-for-offshore-structure-23-2048.jpg)
![7
Event tree analysis
Basic case, No inspection
6 Upd, full inspection history
Upd, ONLY last inspection
5
Inspection
during
Reliability Index
operation with
4 No crack detection
3
No inspection 10-3
3×10⁻³
2
Effect of Inspection 3.5×10⁻²
predicted at design stage
1 Pf
0 5 10 15 20
Time (years)
Fig. 13: Reliability index as a function of time and inspection strategy. Inspection
Event Tree analysis is based on predictions at the design stage. The other
curves are based on inspections with known outcome during the service
life (Ayala-Uraga and Moan, 2002)
The updating methodology is useful in connection with extension of service life for
structures with joints governed by the fatigue criterion (Vårdal et al, 2000). In such
cases, the design fatigue life is in principle exhausted at the end of the planned service
life. Nevertheless, if no cracks have been detected during inspections, then a remain-
ing fatigue life can be demonstrated. However, it is not possible to bring the structure
back to its initial condition by inspection only. This is because the mean detectable
crack depth by NDE methods typically is 1.0 – 2.0 mm, while the initial crack depth
is 0.1 – 0.4 mm.
The calculation of the system failure probability after inspection may be approxi-
mated by independent system failure modes (Moan et al., 1999, 2002, 2004)
n
PFSYS|up = P [ FSYS | I]≈P [ FSYS(U)] + ∑ P ⎡ Fj | I ⎤ ⋅ P ⎡ FSYS(U) | Fj ⎤ +....
⎣ ⎦ ⎣
j=1
⎦ (9)
.
This formulation is based on modeling the ultimate failure of the system by a single
mode. Moreover, the formulation is limited to failure modes initiated by a single fa-
tigue failure and followed by ultimate global failure. The failure probability in Eq. (9)
is applicable when the inspection event I aims at detecting cracks before the failure of
individual members, (i.e. before they have caused rupture of the member). Another
inspection strategy would be to apply visual inspection to detect members failure and
repair failed members after the winter season in which those particular members
failed. In this case the Eq. (9) will have to be modified as follows: the individual fa-
tigue failures of components (Fj ) does not depend on the inspection event, and, rather
such an inspection and repair strategy will have implication on the time period, for
which the failure probability P[FSYS(U)|Fj] should be calculated.
A further simplification is to update the failure probability of each joint based on the
inspection result for that joint. This is conservative if no cracks are detected, but non-
conservative if cracks are detected.
Inspections may be prioritized by using Eq. (9) for each joint separately by allowing a
20](https://image.slidesharecdn.com/safetyforoffshorestructure-120611222506-phpapp01/75/Safety-for-offshore-structure-24-2048.jpg)
![certain target probability level, PfSYS(T) to each term in the sum of Eq. (9). The target
fatigue failure probability for joint i, PFfT(i) is then obtained from
PfSYS(i) = P[FSYS | Fi ] ⋅ PFfT(i) ≤ PfSYS(T) (10)
where the system failure probability, PfSYS(i) is associated with a fatigue failure of
member (i) followed by an ultimate system failure. PfSYS(T) is obtained by generalizing
the acceptance criteria implied by Table 4. This approach has been implemented for
template-space frame structures (Moan et al., 1999).
Given the target level for a given joint, inspections and repairs by grinding or other
modifications are scheduled to maintain the reliability level at the target level as
shown in Fig. 14. Reliability level, β
No Inspection at time t=8
inspection with no crack detection
Target level
for a given joint
0 4 8 12 16 20 Time (years)
1st inspection 2nd inspection
Fig. 14: Scheduling of inspections to achieve a target safety level of PFfT(i).
This methodology is used to calibrate fatigue design requirements. It is then found
that the criteria in Table 4 are slightly “non-conservative”.
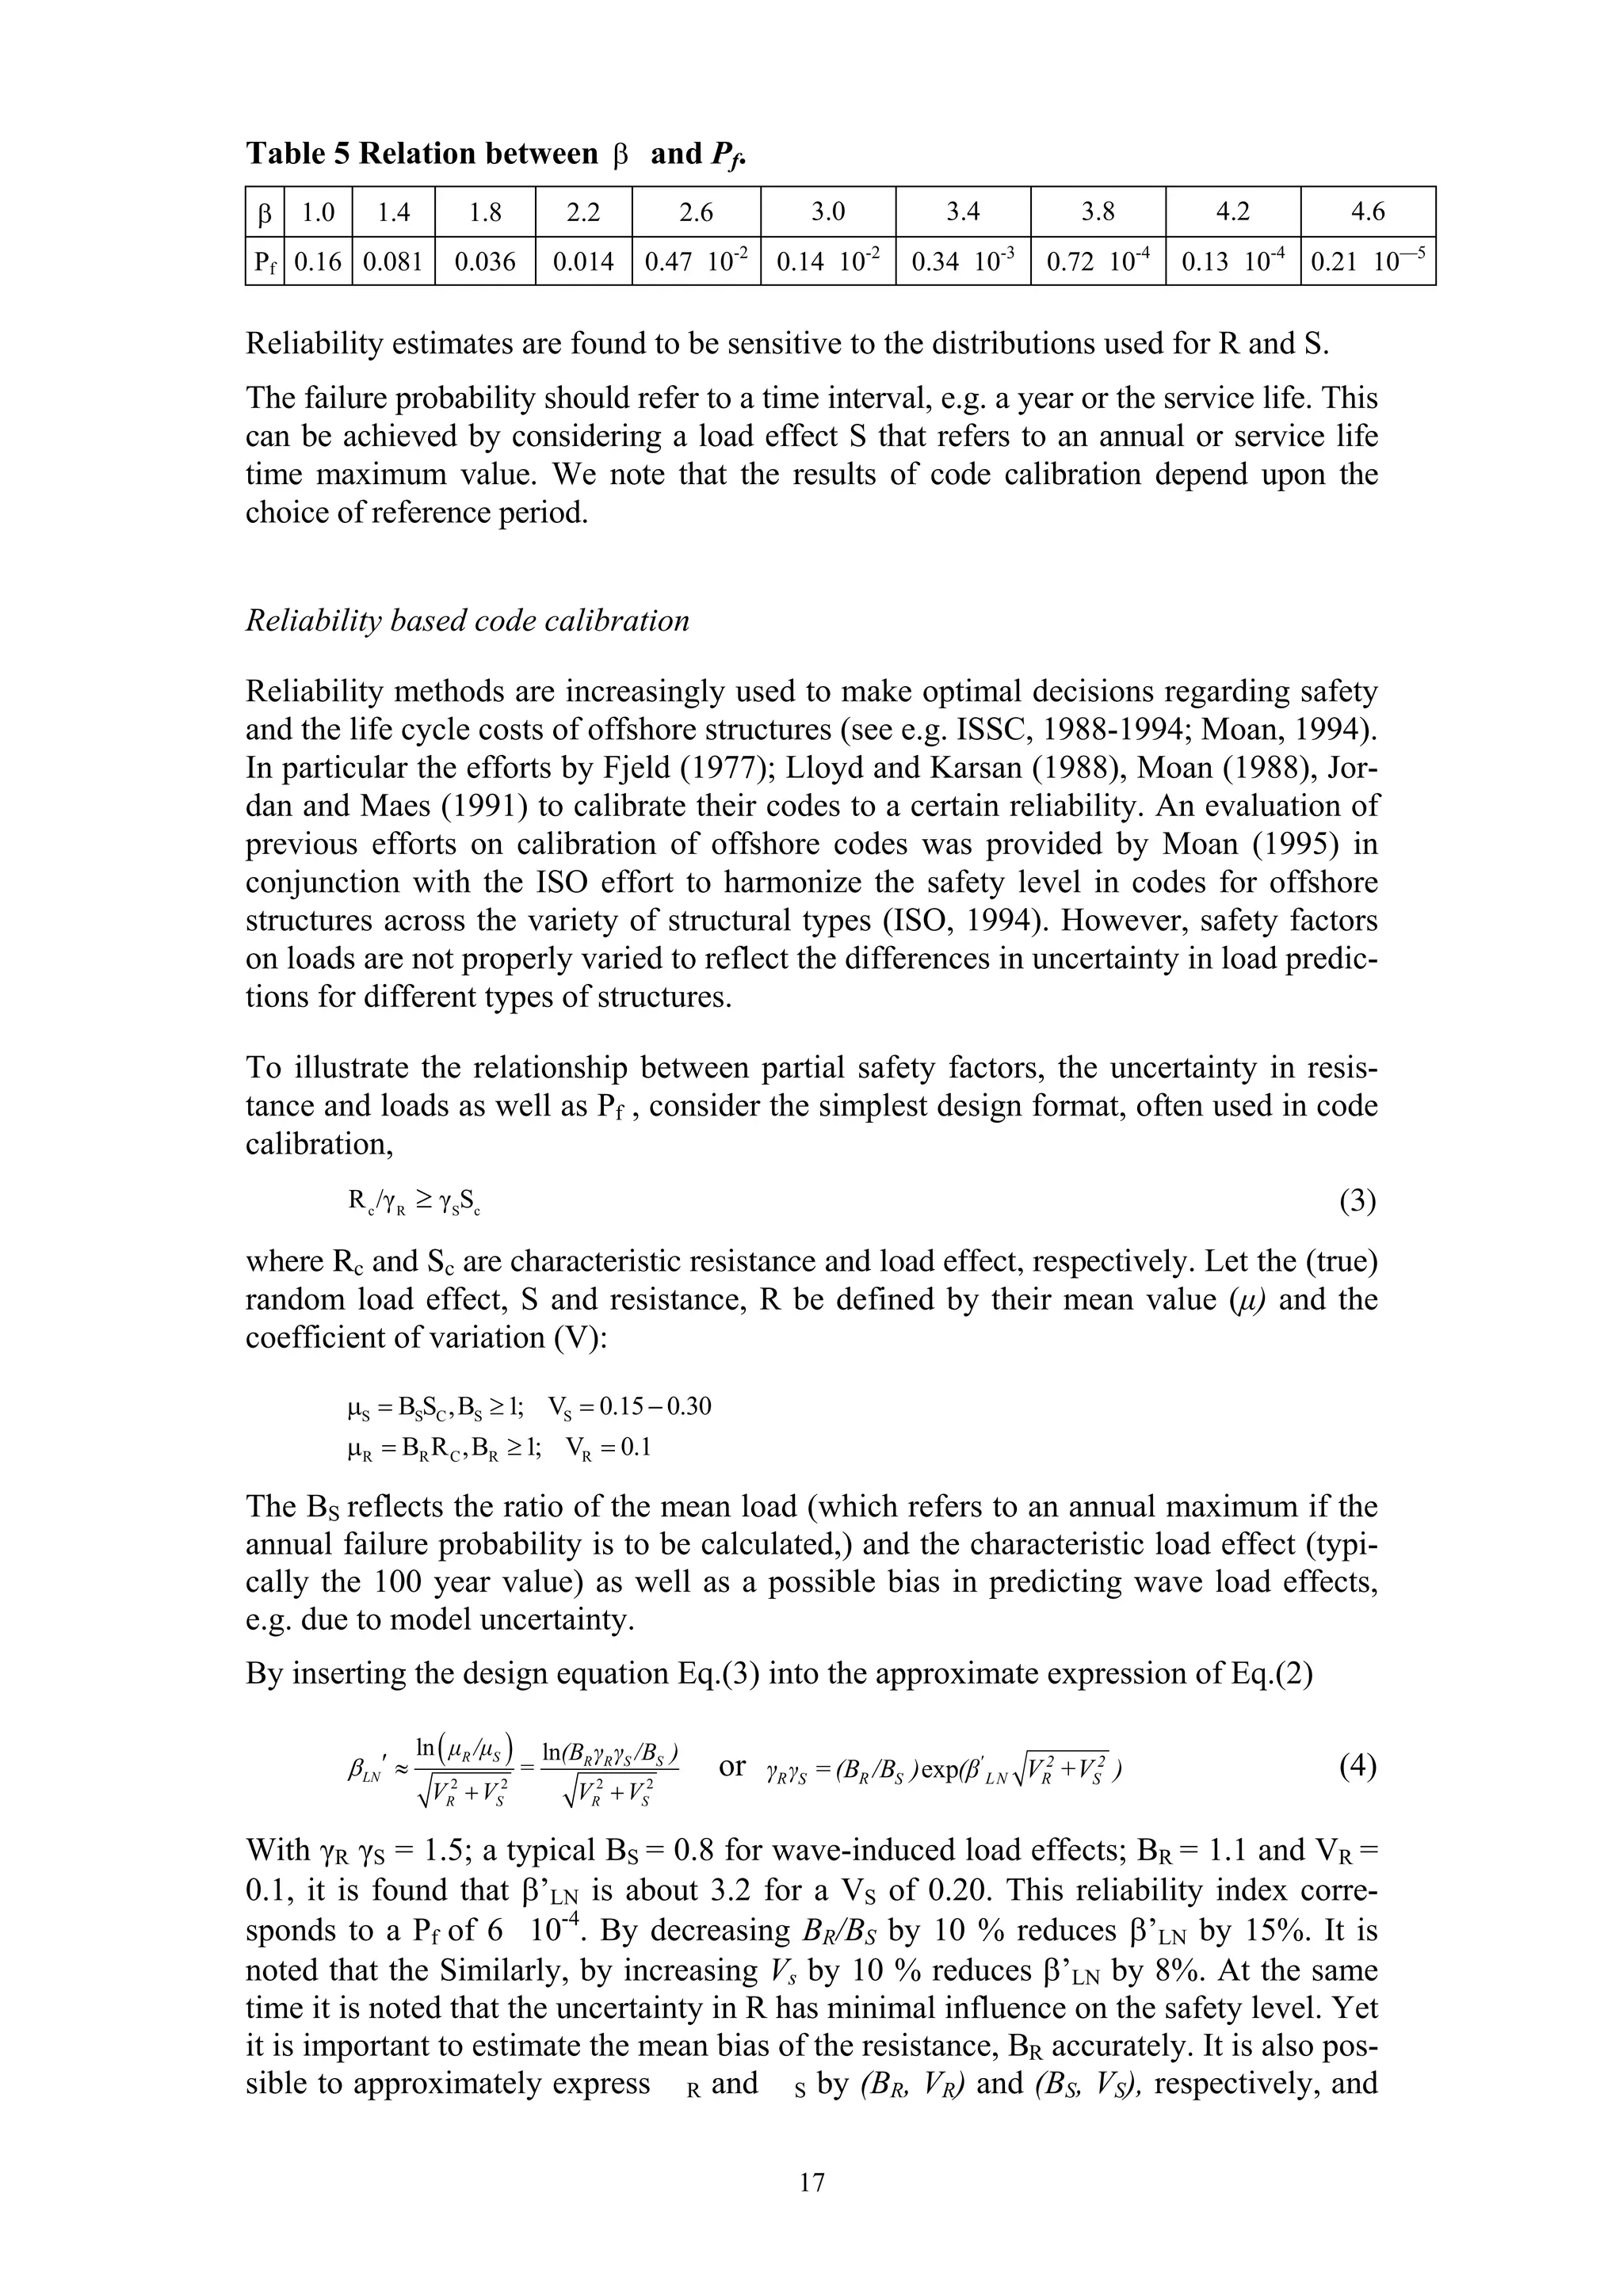
3.6 Safety implications of Ultimate and Fatigue Limit State criteria and Inspection,
Monitoring, Maintenace and Repair
The failure probability estimated by structural reliability analysis (SRA) normally
does not represent the experienced Pf for structures. This is because the safety factors
or margins normally applied to ensure safety are so large that Pf calculated by SRA
becomes much smaller than that related to other causes. For instance when proper
fatigue design checks and inspections have not been carried out, the likelihood of fa-
tigue failures (through-thickness cracks) for platforms (e.g. in the North Sea), is large
and cracks have occurred. However, with the exception of the Ranger I (1979) and
Alexander Kielland failure (1980) such cracks have been detected before they caused
total losses. As discussed above, errors and omissions in design, fabrication and op-
eration represent the main causes of the accidents experienced.
On the other hand, frequent occurrences of cracks provide a basis for correlating ac-
tual crack occurrences with state of art predictions for various offshore structures.
Hence, the current predictions for jackets are found to be conservative (Vårdal and
Moan, 1997), while for semi-submersibles and ships, the predictions seem to be rea-
sonable, as summarized by Moan (2004). This agreement is achieved when the SN
approach (or a calibrated fracture mechanics approach) is applied to predict the occur-
rence of fatigue failure (e.g. through thickness crack). Yet, if ULS and FLS design
checks are properly carried out, Pf will be “negligible” within the current safety re-
gime. This reserve capacity, implied by ULS and FLS requirements, provides some
21](https://image.slidesharecdn.com/safetyforoffshorestructure-120611222506-phpapp01/75/Safety-for-offshore-structure-25-2048.jpg)
![10.0
Ratio of predicted and measured Impulse 1.0
0.1
Experiment No
Fig. 20: Comparison of predicted and measured pressure impulse for “deterministic”
explosion scenarios, obtained by the computer code FLACS.
The typical overpressures for topsides of North Sea platforms are in the range 0.2-0.6
barg, with duration of 0.1-0.5s., while an explosion in open air at the drill floor typi-
cally implies 0.1 barg with duration of 0.2s. The explosion pressure in a totally en-
closed compartment might be 4 barg.
The damage due to explosions may be determined by simple and conservative single-
degree-of freedom models (NORSOK N-004). In several cases where simplified
methods have not been calibrated, nonlinear time domain analyses based on numerical
methods like the finite element method should be applied. A recent overview of such
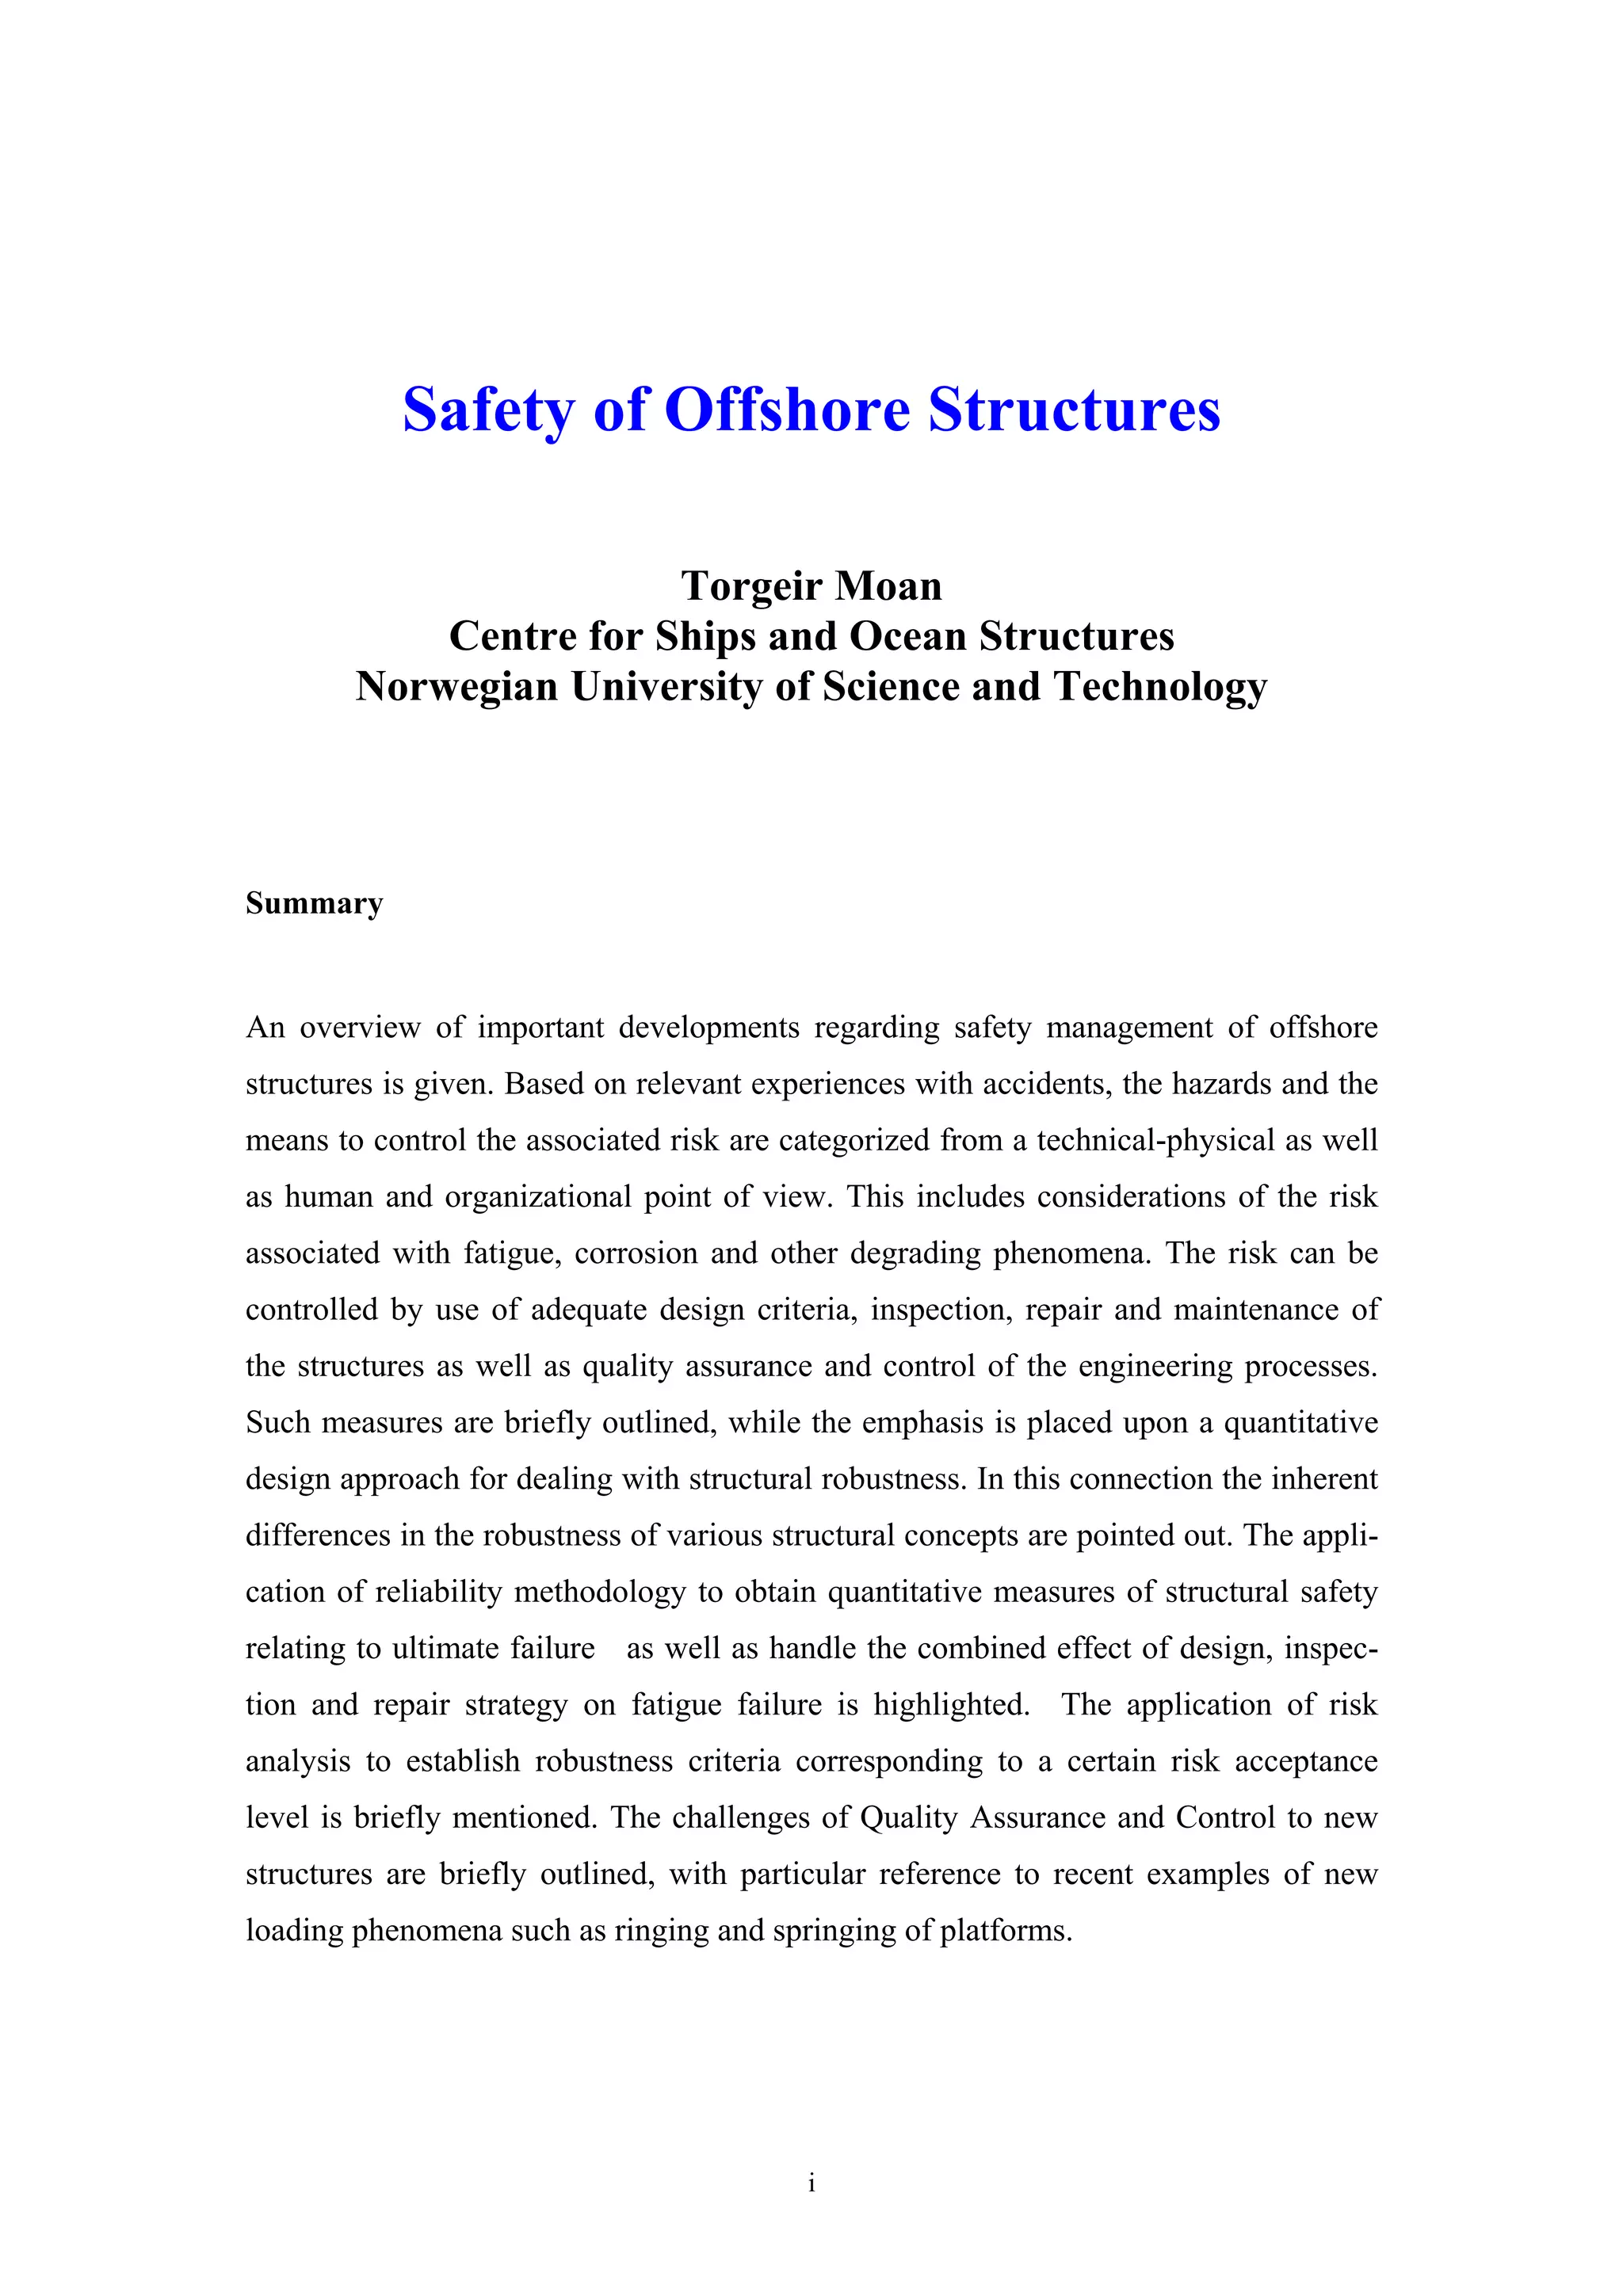
methods may be found in Czujko (2001). Fig. 21 shows an explosion panel with de-
formations as determined by an experiment and finite element analysis. The calcu-
lated and measured deflections of the specimen are compared in Figure 21c.
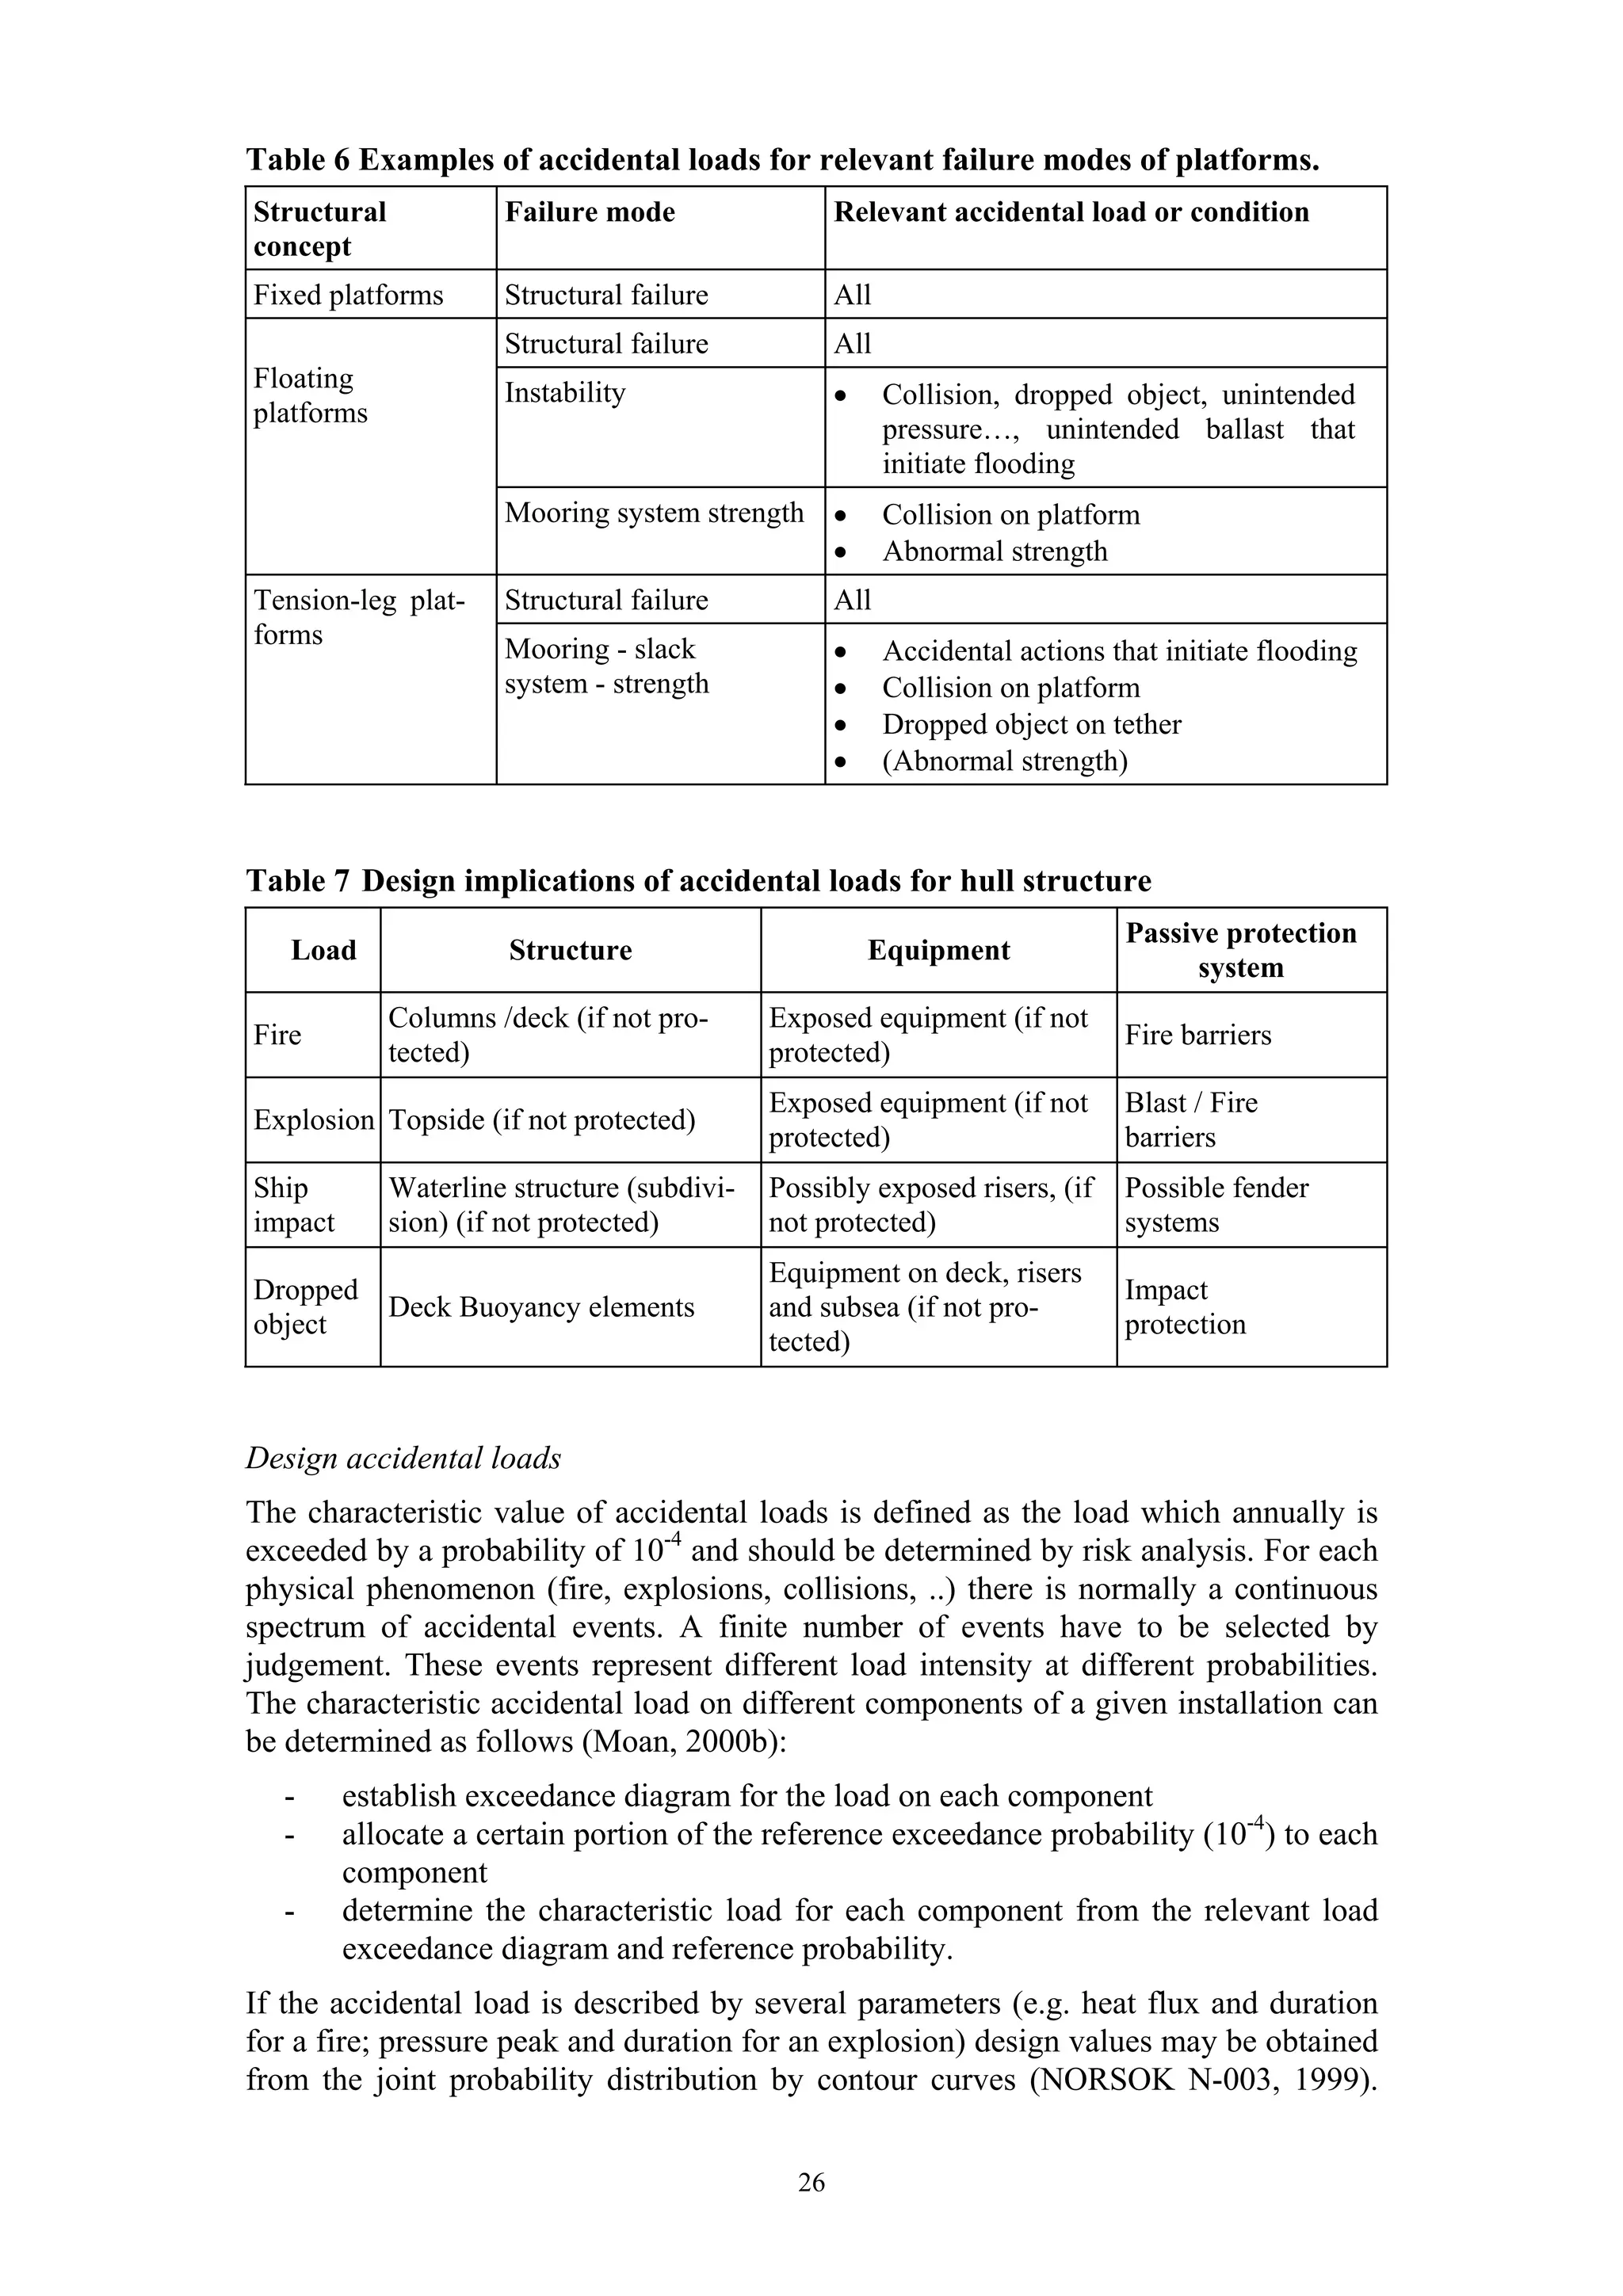
Fire and explosion events that result from the same scenario of released combustibles
and ignition should be assumed to occur at the same time, i.e. to be fully dependent.
The fire and blast analyses should be performed by taking into account the effects of
one on the other. The damage done to the fire protection by an explosion preceding
the fire should be considered.
0.7
0.6
0.5
0.4
0.3
PRESSURE [N/
0.2
0.1 Experiment Analysis
0
0 20 40 60 80 100
2]
DISPLACEMENT [mm]
a) Experiment b) FE analysis c) Load–response histories
Fig. 21: Explosion response of an explosion wall (Czujko, 2001).
29](https://image.slidesharecdn.com/safetyforoffshorestructure-120611222506-phpapp01/75/Safety-for-offshore-structure-33-2048.jpg)

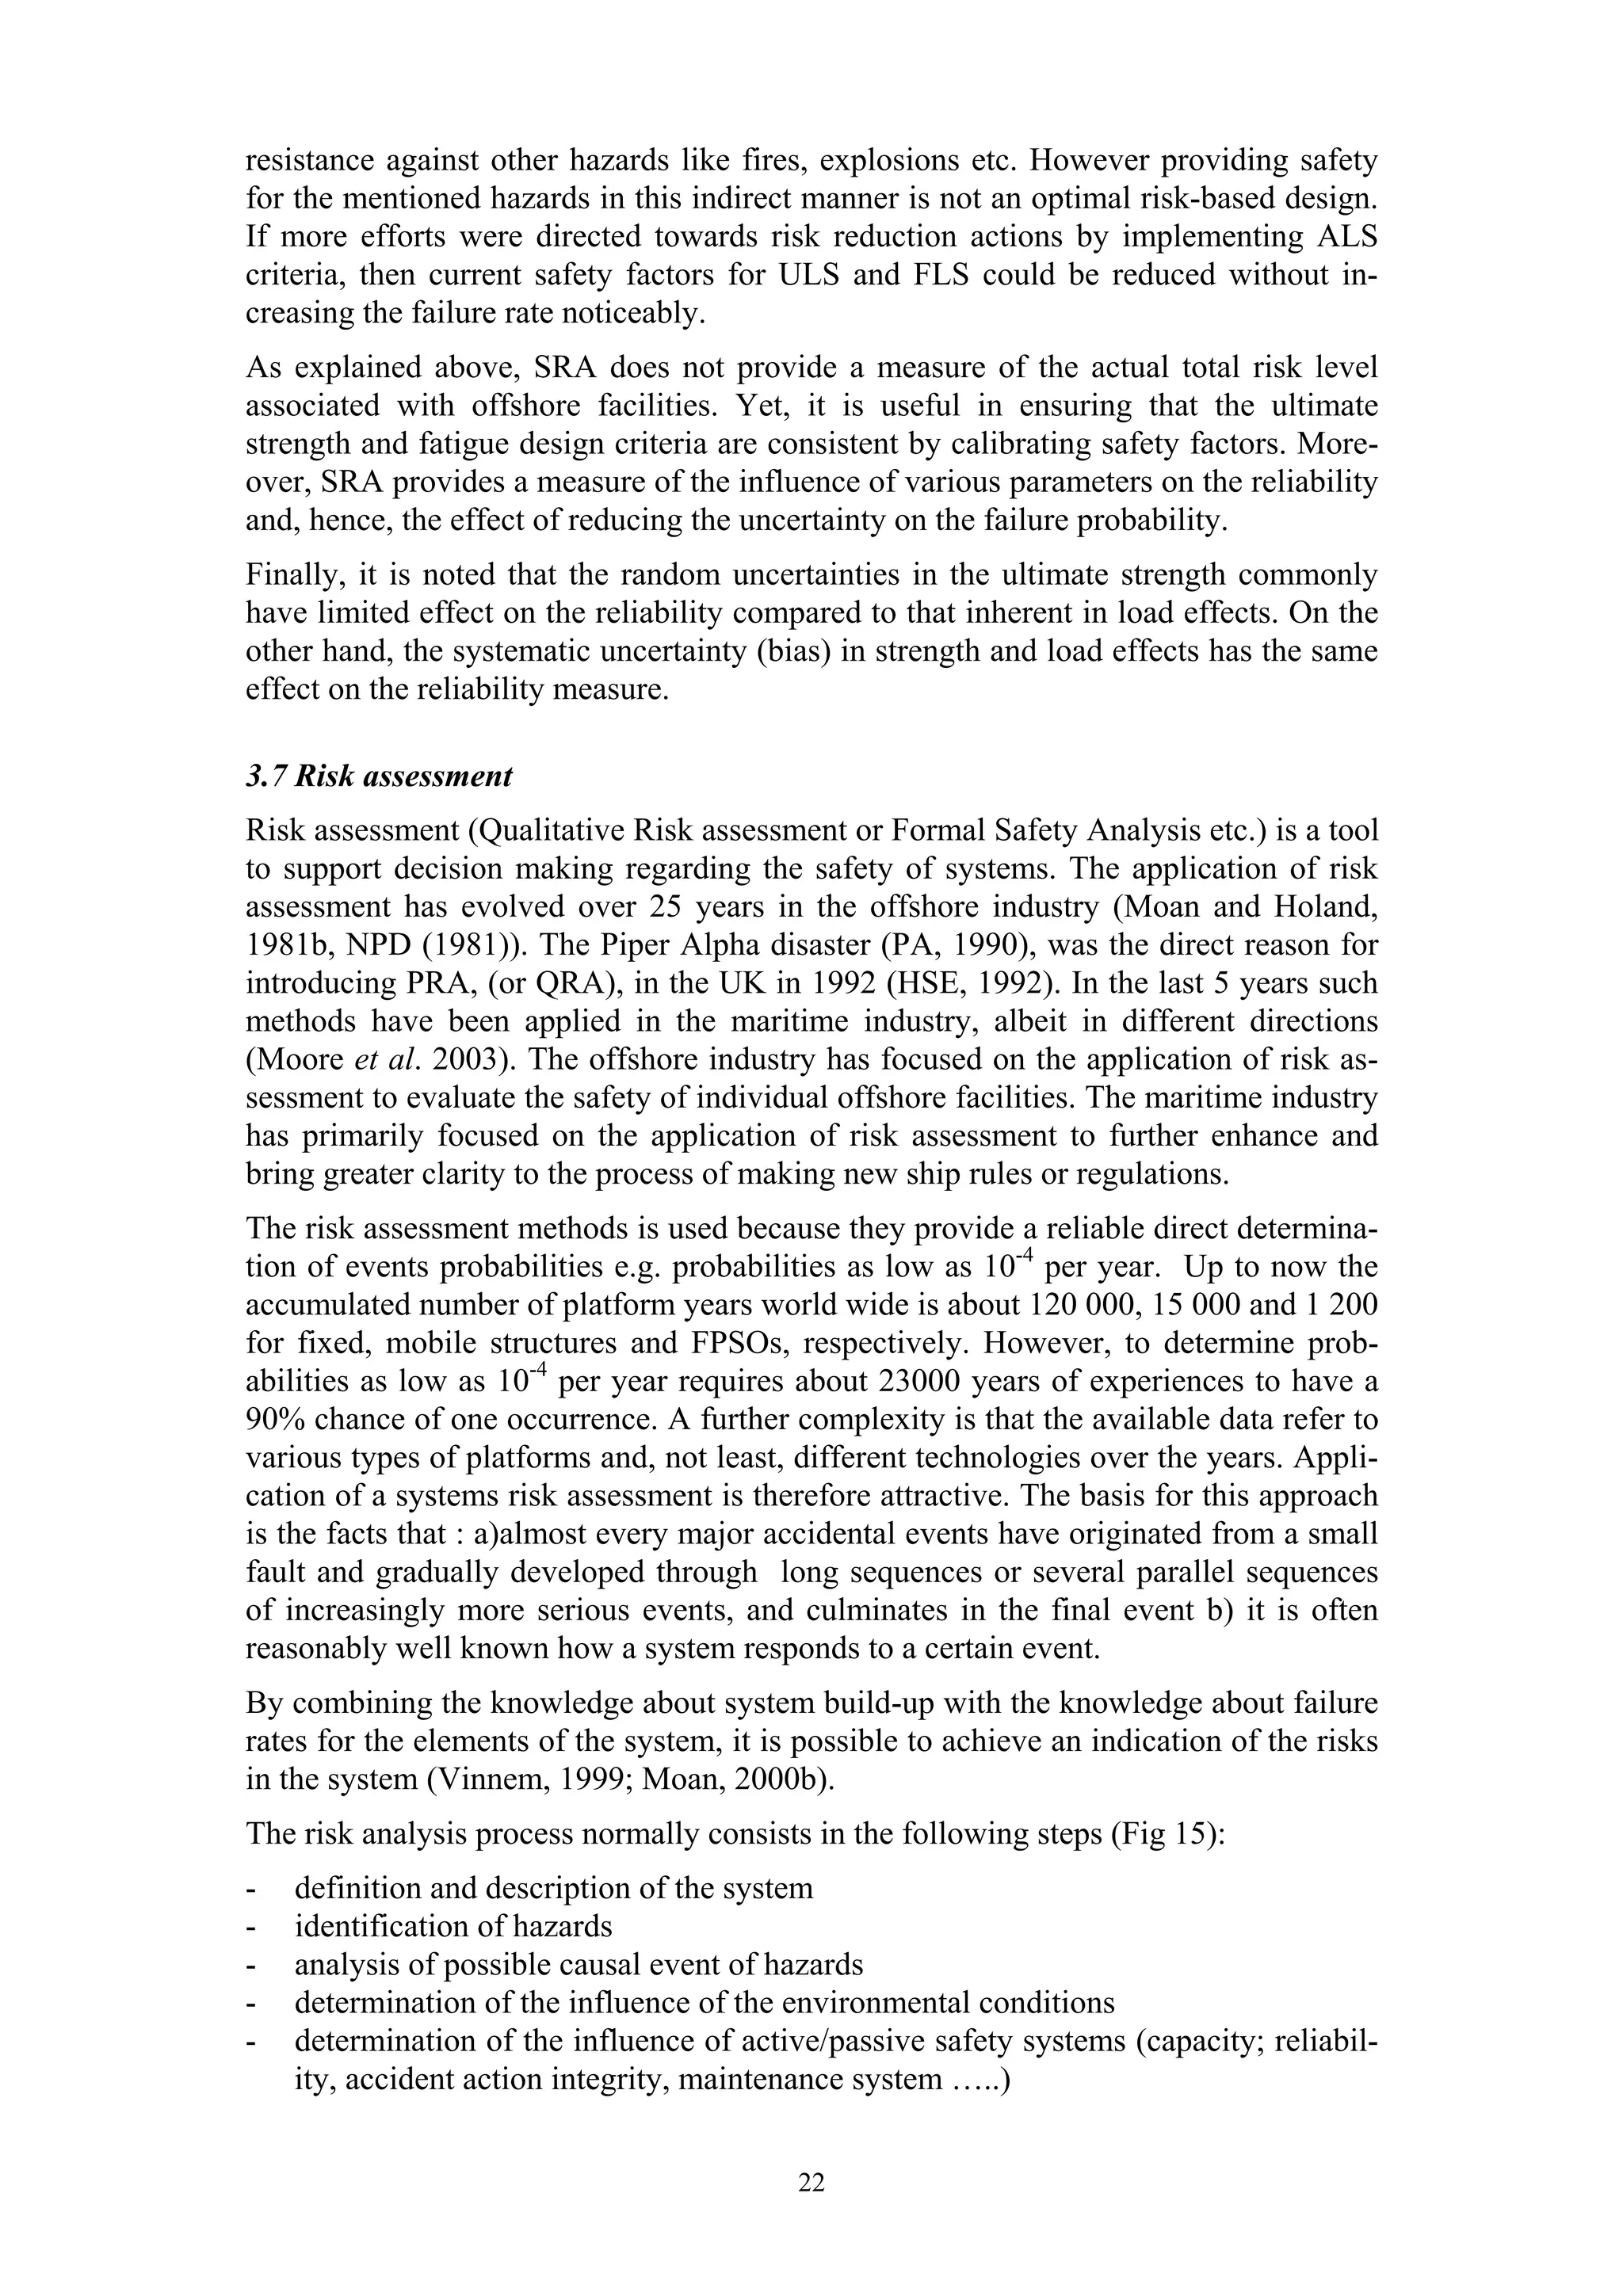
This document provides an overview of safety management for offshore structures. It discusses accident experiences that revealed hazards and risks. Risk can be controlled through adequate design, inspection, repair, maintenance, and quality assurance of engineering processes. Structural robustness is important and can be ensured using accidental collapse limit state criteria for fires, explosions, and other accidental loads. Reliability methodology is useful for obtaining quantitative safety measures regarding ultimate failure and fatigue failure under inspection and repair strategies. Overall, the document emphasizes a risk-based, probabilistic approach to safety management of offshore structures.


![Offshore Operations Maintenance[2]](https://cdn.slidesharecdn.com/ss_thumbnails/offshoreoperationsmaintenance2-13469182903461-phpapp01-120906025852-phpapp01-thumbnail.jpg?width=640&height=640&fit=bounds)


