This document presents a safety management plan for offshore structures, emphasizing the importance of safety requirements during their life cycle, particularly in the oil and gas industry. It outlines the risks associated with offshore operations and stresses the necessity for rigorous design and regulatory standards to prevent accidents, which are often exacerbated by human and organizational factors. Historical accident analyses underscore the need for effective safety management and inspections to mitigate potential failures and enhance structural robustness.


![The fire and blast analyses should be performed by taking into account the effects of
one on the other. The damage done to the fire protection by an explosion preceding the
fire should be considered.
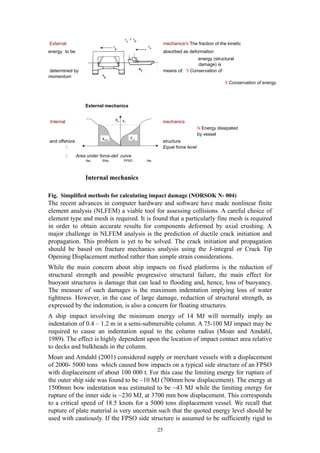
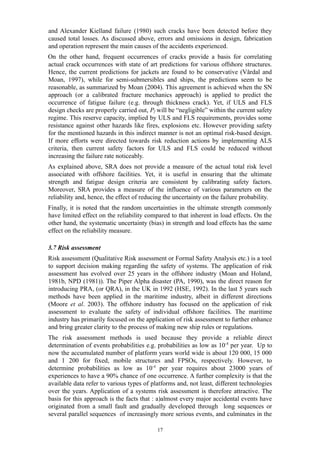
a) Experiment b) FE analysis c) Load–response histories
Fig. Explosion response of an explosion wall (Czujko, 2001).
Fig. “Survival analysis” of a deck suffering explosion damage (Amdahl, 2003).
Deformations in the lower figure are not to scale.
Fig. shows results from an analysis of a deck structure in a floating platform
(Amdahl, 2003). The upper left figure in this slide illustrates the deck structure of a
floating production platform. The design pressure on the East Wall is also indicated. In
this case it is assumed that the panels are badly damaged that they can be removed.
The lower figure shows the deformation pattern of the damaged deck.
23
Experiment Analysis
PRESSURE[N/2]
DISPLACEMENT [mm]
0.7
0.6
0.5
0.4
0.3
0.2
0.1
0
100
80
60
20
0 40
5bar
>
max
P](https://image.slidesharecdn.com/offshoreregulationstandardproject-250118105453-8066853a/85/Offshore_Regulation_Standard_project-docx-23-320.jpg)