This document lists Windows commands that can be run to access various tools and utilities in Windows, including system tools, games, accessibility options, and software installed like Adobe or Microsoft products. It provides the command to open each tool in 3 words or less like "access.cpl" for Accessibility Controls or "control printers" to open Printers and Faxes. Over 70 different commands are listed.
This document contains a list of commands that can be run to access various programs and utilities in Windows. It includes commands to access programs like Control Panel, Calculator, Notepad, as well as system tools like Disk Management, Event Viewer, Task Manager, and IP Configuration utilities.
The Run command allows users to launch programs, services, and system tools by typing or pasting their names. It provides a simple way to access many common Windows programs and utilities without navigating folders or menus. Some examples provided are launching Control Panel, Calculator, Command Prompt, Device Manager, Internet Explorer, Notepad, Task Manager, and more.
The document lists over 100 Windows run commands in alphabetical order, along with a brief description of each command. It includes commands for launching built-in Windows programs and utilities, as well as some third-party applications. The document also provides instructions for using some IP configuration commands and the System File Checker utility. It encourages bookmarking the site for future reference to this run commands list.
This document provides a list of 174 programs and commands that can be run in Windows along with the corresponding "Run Command" to launch each program or command. It includes common programs like Control Panel, Calculator, Notepad, as well as commands like ipconfig, taskmgr and regedit. The document also provides a brief profile of the author "Mui'ed" with details like their name, date of birth, education history and contact information.
This document lists many Windows commands and utilities that can be accessed from the Run dialog box or command prompt, along with their associated executable files or commands. It includes commands for system configuration, networking, security, hardware management, games, and other Windows tools and administrative features.
This document provides a list of program run commands for various Windows programs and utilities. It includes commands to access programs like Control Panel, Calculator, Notepad, as well as commands to run system tools like Disk Cleanup, Device Manager, Event Viewer and more. The list contains over 100 different commands organized alphabetically to launch programs and access system functions through the Run dialog box or command prompt.
This document contains a list of over 100 run commands for the Windows operating system. It provides the command name and a brief description for common commands like control panel apps, disk and file management tools, networking tools, and games. The document is dedicated to sharing this information to help users better utilize their Windows system.
The drd command provides a command line interface for managing inactive system images on HP-UX systems. It has nine main modes of operation for activating, cloning, deactivating, mounting, rehosting, running commands, checking status, synchronizing, and unmounting inactive images. Options allow specifying devices, files, and verbosity level.
Building a turn-based game prototype using ECS - Unite Copenhagen 2019Unity Technologies
Get a high-level overview of the Entity Component System (ECS) and turn-based game loops, and see a proof of concept built using ECS. These slides will cover some of the pitfalls and also show concepts of ECS in a slightly exotic context.
Speaker:
Florian Uhde - Three Eyed Games
Watch the session on YouTube: https://youtu.be/mL4qrt-15TE
This document lists Windows XP run commands and their associated programs or functions. It includes over 100 entries for commands like control panel apps, games, networking tools, system utilities and more. Common commands provide access to accessories like calculator, notepad, paint and control panel items, while others launch backup, firewall, disk management and other system tools.
Kernel Recipes 2016 - Understanding a Real-Time System (more than just a kernel)Anne Nicolas
The PREEMPT_RT patch turns Linux into a hard Real-Time designed operating system. But it takes more than just a kernel to make sure you can meet all your requirements. This talk explains all aspects of the system that is being used for a mission critical project that must be considered. Creating a Real-Time environment is difficult and there is no simple solution to make sure that your system is capable to fulfill its needs. One must be vigilant with all aspects of the system to make sure there are no surprises. This talk will discuss most of the “gotchas” that come with putting together a Real-Time system.
You don’t need to be a developer to enjoy this talk. If you are curious to know how your computer is an unpredictable mess you should definitely come to this talk.
Steven Rostedt - Red Hat
Introduction of unit test on android kernelJohnson Chou
This document provides an introduction and overview of the OMAP DDT (Device Driver Test) framework for testing device drivers on the OMAP Linux kernel. It discusses compiling and installing OMAP DDT, running tests, customizing tests, and various utilities included in OMAP DDT. Key points include that OMAP DDT provides a framework for testing device drivers on OMAP Linux, it can be compiled and installed on an Android device, tests are run via scripts and an automation tool is available, and the framework includes various utilities and helpers to customize and extend testing.
Kernel Recipes 2015: Introduction to Kernel Power ManagementAnne Nicolas
The document introduces kernel power management concepts in Linux, including static and dynamic power management, idle power management for CPUs and devices, and the evolving driver model. It covers key frameworks like CPU frequency scaling, regulators, runtime power management, and power domains. Documentation files are referenced throughout for further reading.
Not all gameplay needs to happen immediately. In fact, there are many cases in which deferring commands may offer a better outcome – improved user experience, performance, etc. These slides explore thinking about where deferred commands are needed and provides examples on how to take full advantage of the Entity Command Buffer.
Speaker: Elora Krzanich – Unity
Watch the session on YouTube: https://youtu.be/SecJibpoTYw
Cross-scene references: A shock to the system - Unite Copenhagen 2019Unity Technologies
Discover the GUID Based reference workflow, with a focus on Multi-Scene workflows, save game, and how these all came together in System Shock 3. You'll learn about the reason for wanting a stable instance Id, why Unity doesn't have one out of the box, what this implementation does, and how you can use it in your own projects. System Shock 3 is a great example of this tool's power, but demonstrates how it can be tricky too.
Speaker:
William Armstrong - Unity
Kernel Recipes 2017 - Understanding the Linux kernel via ftrace - Steven RostedtAnne Nicolas
Ftrace is the official tracer of the Linux kernel. It has been apart of Linux since 2.6.31, and has grown tremendously ever since. Ftrace’s name comes from its most powerful feature: function tracing. But the ftrace infrastructure is much more than that. It also encompasses the trace events that are used by perf, as well as kprobes that can dynamically add trace events that the user defines.
This talk will focus on learning how the kernel works by using the ftrace infrastructure. It will show how to see what happens within the kernel during a system call; learn how interrupts work; see how ones processes are being scheduled, and more. A quick introduction to some tools like trace-cmd and KernelShark will also be demonstrated.
Steven Rostedt, VMware
This document provides shortcuts and commands for various Windows tools and programs that can be accessed through the Control Panel or command line. It includes shortcuts for configuring display settings, users accounts, networking, updating, administrative tools, device management, security policies, and more. Commonly used tools like Windows Explorer, Registry Editor, Task Manager, and calculators are also listed. The document concludes with IP configuration commands and options for the System File Checker utility.
Kernel Recipes 2015 - Porting Linux to a new processor architectureAnne Nicolas
Getting the Linux kernel running on a new processor architecture is a difficult process. Worse still, there is not much documentation available describing the porting process.
After spending countless hours becoming almost fluent in many of the supported architectures, I discovered that a well-defined skeleton shared by the majority of ports exists. Such a skeleton can logically be split into two parts that intersect a great deal.
The first part is the boot code, meaning the architecture-specific code that is executed from the moment the kernel takes over from the bootloader until init is finally executed. The second part concerns the architecture-specific code that is regularly executed once the booting phase has been completed and the kernel is running normally. This second part includes starting new threads, dealing with hardware interrupts or software exceptions, copying data from/to user applications, serving system calls, and so on.
In this talk I will provide an overview of the procedure, or at least one possible procedure, that can be followed when porting the Linux kernel to a new processor architecture.
Joël Porquet – Joël was a post-doc at Pierre and Marie Curie University (UPMC) where he ported Linux to TSAR, an academic processor. He is now looking for new adventures.
This slide will show you how to use SOFA to do performance analysis of CPU/GPU cooperative programs, especially programs running with deep software stacks like TensorFlow, PyTorch, etc.
source code at:
https://github.com/cyliustack/sofa
This document summarizes a presentation on flame graphs for profiling CPU and memory performance on FreeBSD. It introduces flame graphs as a way to visualize stack profiles to easily compare performance across systems. Examples are given profiling MySQL workload CPU usage on two hosts to identify a 30% performance difference. Commands are provided to generate flame graphs from DTrace profiles of CPU stack sampling and page faults.
Kernel Recipes 2017: Performance Analysis with BPFBrendan Gregg
Talk by Brendan Gregg at Kernel Recipes 2017 (Paris): "The in-kernel Berkeley Packet Filter (BPF) has been enhanced in recent kernels to do much more than just filtering packets. It can now run user-defined programs on events, such as on tracepoints, kprobes, uprobes, and perf_events, allowing advanced performance analysis tools to be created. These can be used in production as the BPF virtual machine is sandboxed and will reject unsafe code, and are already in use at Netflix.
Beginning with the bpf() syscall in 3.18, enhancements have been added in many kernel versions since, with major features for BPF analysis landing in Linux 4.1, 4.4, 4.7, and 4.9. Specific capabilities these provide include custom in-kernel summaries of metrics, custom latency measurements, and frequency counting kernel and user stack traces on events. One interesting case involves saving stack traces on wake up events, and associating them with the blocked stack trace: so that we can see the blocking stack trace and the waker together, merged in kernel by a BPF program (that particular example is in the kernel as samples/bpf/offwaketime).
This talk will discuss the new BPF capabilities for performance analysis and debugging, and demonstrate the new open source tools that have been developed to use it, many of which are in the Linux Foundation iovisor bcc (BPF Compiler Collection) project. These include tools to analyze the CPU scheduler, TCP performance, file system performance, block I/O, and more."
OSSNA 2017 Performance Analysis Superpowers with Linux BPFBrendan Gregg
Talk by Brendan Gregg for OSSNA 2017. "Advanced performance observability and debugging have arrived built into the Linux 4.x series, thanks to enhancements to Berkeley Packet Filter (BPF, or eBPF) and the repurposing of its sandboxed virtual machine to provide programmatic capabilities to system tracing. Netflix has been investigating its use for new observability tools, monitoring, security uses, and more. This talk will be a dive deep on these new tracing, observability, and debugging capabilities, which sooner or later will be available to everyone who uses Linux. Whether you’re doing analysis over an ssh session, or via a monitoring GUI, BPF can be used to provide an efficient, custom, and deep level of detail into system and application performance.
This talk will also demonstrate the new open source tools that have been developed, which make use of kernel- and user-level dynamic tracing (kprobes and uprobes), and kernel- and user-level static tracing (tracepoints). These tools provide new insights for file system and storage performance, CPU scheduler performance, TCP performance, and a whole lot more. This is a major turning point for Linux systems engineering, as custom advanced performance instrumentation can be used safely in production environments, powering a new generation of tools and visualizations."
Talk for Facebook Systems@Scale 2021 by Brendan Gregg: "BPF (eBPF) tracing is the superpower that can analyze everything, helping you find performance wins, troubleshoot software, and more. But with many different front-ends and languages, and years of evolution, finding the right starting point can be hard. This talk will make it easy, showing how to install and run selected BPF tools in the bcc and bpftrace open source projects for some quick wins. Think like a sysadmin, not like a programmer."
EuroBSDcon 2017 System Performance Analysis MethodologiesBrendan Gregg
keynote by Brendan Gregg. "Traditional performance monitoring makes do with vendor-supplied metrics, often involving interpretation and inference, and with numerous blind spots. Much in the field of systems performance is still living in the past: documentation, procedures, and analysis GUIs built upon the same old metrics. Modern BSD has advanced tracers and PMC tools, providing virtually endless metrics to aid performance analysis. It's time we really used them, but the problem becomes which metrics to use, and how to navigate them quickly to locate the root cause of problems.
There's a new way to approach performance analysis that can guide you through the metrics. Instead of starting with traditional metrics and figuring out their use, you start with the questions you want answered then look for metrics to answer them. Methodologies can provide these questions, as well as a starting point for analysis and guidance for locating the root cause. They also pose questions that the existing metrics may not yet answer, which may be critical in solving the toughest problems. System methodologies include the USE method, workload characterization, drill-down analysis, off-CPU analysis, chain graphs, and more.
This talk will discuss various system performance issues, and the methodologies, tools, and processes used to solve them. Many methodologies will be discussed, from the production proven to the cutting edge, along with recommendations for their implementation on BSD systems. In general, you will learn to think differently about analyzing your systems, and make better use of the modern tools that BSD provides."
Servers and Processes: Behavior and Analysisdreamwidth
This document provides an overview of servers, processes, and system administration. It discusses servers as machines made up of components like RAM, CPU, and I/O. It then covers these components and their capacities, as well as processes and how they interact with servers through system calls. Hands-on examples are provided to demonstrate monitoring servers and investigating processes using tools like top, lsof, strace, and vmstat.
A split screen-viable UI event system - Unite Copenhagen 2019Unity Technologies
Learn about the implementation of a 2-player split-screen user interface (UI) in Battle Planet Judgement Day. In Unity, the Event System allows only one element to be currently selected, which can be a problem when designing split screen UI. In this session, you'll discover how this issue was addressed in Battle Planet Judgement Day, the ups and downs of the implementation, insights on pitfalls to avoid and best practices learned during the time of development. We hope this will help you learn how to implement your own solution.
Speaker: Kevin Hagen - Threaks
Session available here: https://youtu.be/aR5UXatawmE
This document provides instructions for making various configuration changes and restrictions in the Windows registry related to system, networking, and application settings. It includes over 50 entries organized by topic that describe how to modify registry keys and values to disable features, restrict access, and modify default behaviors. Examples include disabling the right click context menu, hiding drives, locking file associations, and restricting changes to the start menu and control panel options.
This document lists and describes 138 MS-DOS commands, including commands to manage directories and files (DIR, COPY, DEL), view and modify system settings (DATE, TIME, MODE), run diagnostic utilities (CHKDSK, SCANDISK), manage hardware (FDISK, FORMAT), and connect to networks (FTP, TELNET).
The document provides descriptions of various MS-DOS and Windows commands that can be used for hacking or computer diagnostics. Some of the commands listed include netstat to view network stats, ipconfig to view IP addresses, erase to delete program files, nbtstat to get computer information, and tree to check for keyloggers. The document also mentions using telnet for remote control, bootcfg to modify boot settings, and netsh for hacking network configurations.
1. Computers were originally developed for calculations but now with their help, work in almost all fields like science, physical, academic, business and various designs can be done.
2. A computer is an electronic machine that processes data according to a set of instructions. It has input devices to accept data, processing is done by the CPU, and output devices display the results.
3. A computer is an electronic device that can perform mathematical calculations and logical decisions. It processes data or targets according to a set of control instructions and generates information.
E-commerce refers to electronic transactions over the internet, including buying and selling of goods and services as well as the transfer of funds and information. The main goals of e-commerce are to reduce costs, lower product cycle times, provide faster customer response, and improve service quality. There are several types of e-commerce models including business-to-business, business-to-consumer, consumer-to-consumer, and business-to-government. Setting up the infrastructure for an e-commerce business involves key decisions around marketing, facilities, customer service, information technology, and fulfillment.
Full form of hardware and networking devices and terminologyRavi Kodoli
This document provides the full forms and definitions of many common hardware, networking, and technology abbreviations and acronyms. It includes over 100 entries with the abbreviated term and the corresponding full form, such as AC for alternating current, AGP for accelerated graphics port, AMD for advanced micro devices, and so on. The full forms cover a wide range of topics related to computers, hardware, operating systems, networking, and telecommunications.
Excel shortcut and function keys hindi notesSirajRock
The document discusses various features and functions of Microsoft Excel. It describes that an Excel file contains workbooks which have worksheets. By default, Excel has 3 worksheets but this can be increased. Each worksheet can have a maximum of 16,384 columns and over 1 million rows. Cells are referenced by their column and row address. Formulas in Excel use cell references. Excel contains various mathematical, statistical, text and logical functions to perform calculations on data. Date and time functions are also available to work with dates and times. Excel can also import and export data from databases and other file formats.
This document provides over 150 run commands that can be used to access various programs, utilities, and system tools in Windows. It lists the command name alongside the program or tool that it accesses, such as "control" to open the Control Panel or "msconfig" to open the System Configuration Utility. The run commands cover a wide range of default Windows programs as well as some third-party applications.
This document provides Windows XP and Vista command line commands to launch various system tools and utilities. It lists over 70 commands for launching things like Administrative Tools, Add/Remove Programs, Calculator, Character Map, Command Prompt, Device Manager, Disk Management, Event Viewer, Fonts, Games, IP Configuration, Keyboard Properties, Local Users and Groups, Mouse Properties, Network Connections, Printers and Faxes, Registry Editor, Security Center, System Properties, Task Manager, and Windows Update.
This document lists the names and executable files for many common Windows control panel applets, configuration tools, and system utilities. It includes items for managing hardware, software, networking, security, system performance, games, and other core Windows functions. The tools listed provide access to settings and information for various components of the Windows operating system.
The document lists over 100 useful Windows Run commands and their functions. Some key commands include:
- Windows Key + R to open the Run dialog box
- control.exe admintools to open Administrative Tools
- control.exe desktop to open Display Properties
- eventvwr.msc to open the Event Viewer
- control.exe printers to open Printers and Faxes
- taskmgr to open the Task Manager
- regedit to open the Registry Editor
The document also provides instructions on how to earn money through completing paid online surveys at a website called AWSurveys.com, with a joining bonus of $6 and $4 per completed survey, and a minimum cashout of $75
This document contains a list of over 100 run commands for various programs and utilities in Windows 7, along with a brief name for each program or tool. The run commands can be used to launch programs and administrative tools from the Run dialog or command prompt. Some examples include winver to open the About Windows dialog, control to open the Control Panel, taskmgr to open Task Manager, and explorer to open Windows Explorer.
we are sharing the complete list of run commands in windows 7, windows 8 and windows XP, vista. These run commands allow to very quick access features, applications and programs to customize operating system. for more visit http://alltipsfinder.com/list-of-run-commands/
This document lists 109 Windows commands and their functions. It includes commands to access common tools like Control Panel, Calculator, Notepad, as well as system tools to check disks, manage devices, view events, and configure networking, users, and regional settings. The document encourages visiting alltipsfinder.com for more computer and technology tips.
This document lists 115 Windows commands that can be run from the Run dialog box or command prompt to access Windows tools and programs. Some of the commands listed include control to open the Control Panel, explorer to open Windows Explorer, taskmgr to open Task Manager, and regedit to open the Registry Editor.
This document lists and describes common run commands in Windows, including commands to access Certificates, Component Services, Computer Management, Device Manager, Disk Management, Event Viewer, Local Users and Groups, Remote Desktop Connection, Services, System Information, and more. It was prepared by Subarno Saha and contains the command names and short descriptions.
This paper aims to make students become familiar with the UNIX environment, developing programming skills in C, to increase their exposure to a shell functionality and put into practice concepts of management processes.
Windowing systems provide device independence, resource sharing, and application management. Toolkits like Java AWT provide interaction objects like buttons and menus. There are two main event paradigms - read-evaluation loops and notification-based approaches. Painting can be controlled internally or externally. Conceptual architectures like Seeheim separate the presentation, dialogue control, and application functionality layers, while frameworks like MVC and PAC define component architectures.
The document provides a comprehensive list of keyboard shortcuts and commands for navigating and managing the Windows operating system more efficiently. It includes shortcuts for Windows key combinations, switching between applications and windows, accessing system properties and administrative tools, and opening common Windows folders and accessories. The list covers shortcuts and commands available on Windows 7, Windows Server 2008 and earlier versions.
A brief talk on systems performance for the July 2013 meetup "A Midsummer Night's System", video: http://www.youtube.com/watch?v=P3SGzykDE4Q. This summarizes how systems performance has changed from the 1990's to today. This was the reason for writing a new book on systems performance, to provide a reference that is up to date, covering new tools, technologies, and methodologies.
This document provides an introduction and overview of batch file programming in Microsoft Windows. It discusses how batch files work, the different modes (interactive and batch), and how to create a basic "Hello World" batch file. It also covers internal and external commands, common run line commands, operators used in batch files like arithmetic, logical, and redirection operators. The document aims to provide novice to advanced programmers an understanding of batch file programming concepts.
Basic solaris 10 system administration commandsBui Van Cuong
This document provides a list of Solaris 10 system administration commands organized alphabetically from A to Z. It includes brief one-line descriptions of each command's purpose, such as configuring network interfaces (ifconfig), checking and repairing file systems (fsck), and starting and stopping network services (inetd).
Linux uses /proc/iomem as a "Rosetta Stone" to establish relationships between software and hardware. /proc/iomem maps physical memory addresses to devices, similar to how the Rosetta Stone helped map Egyptian hieroglyphs to Greek and decode ancient Egyptian texts. This virtual file allows the kernel to interface with devices by providing address translations between physical and virtual memory spaces.
1. The document discusses various types of information and communication technologies including data, information, knowledge, primary data, secondary data, information technology, telecommunications media, communication networks, and ICT.
2. Key components of ICT are described such as sensing technology, communication technology, analyzing technology, and display technology.
3. Applications of ICT are outlined including CAI (computer-assisted instruction), multimedia, web-based instruction, video servers, and the World Wide Web.
The document discusses various types of information and communication technologies. It defines data, information, knowledge, and wisdom. It also discusses different types of technologies used to capture, process, store, communicate, display, and manage information. These include sensing, communication, analyzing, and display technologies. Some examples provided include image scanners, barcodes, LANs, software, video servers, and the World Wide Web.
DTrace and SystemTap are dynamic tracing frameworks available for Solaris and Linux respectively. This session will give an overview of the static DTrace probes available in both Drizzle and MySQL and show numerous examples of scripts that utilize these probes. Mixing dynamic and static probes will also be discussed.
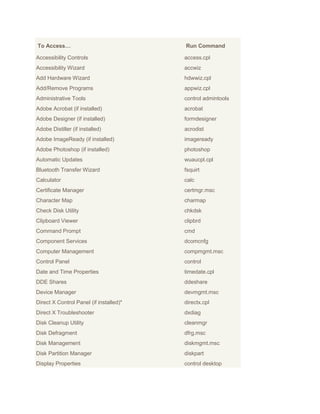
1. To Access… Run Command
Accessibility Controls access.cpl
Accessibility Wizard accwiz
Add Hardware Wizard hdwwiz.cpl
Add/Remove Programs appwiz.cpl
Administrative Tools control admintools
Adobe Acrobat (if installed) acrobat
Adobe Designer (if installed) formdesigner
Adobe Distiller (if installed) acrodist
Adobe ImageReady (if installed) imageready
Adobe Photoshop (if installed) photoshop
Automatic Updates wuaucpl.cpl
Bluetooth Transfer Wizard fsquirt
Calculator calc
Certificate Manager certmgr.msc
Character Map charmap
Check Disk Utility chkdsk
Clipboard Viewer clipbrd
Command Prompt cmd
Component Services dcomcnfg
Computer Management compmgmt.msc
Control Panel control
Date and Time Properties timedate.cpl
DDE Shares ddeshare
Device Manager devmgmt.msc
Direct X Control Panel (if installed)* directx.cpl
Direct X Troubleshooter dxdiag
Disk Cleanup Utility cleanmgr
Disk Defragment dfrg.msc
Disk Management diskmgmt.msc
Disk Partition Manager diskpart
Display Properties control desktop
2. Display Properties desk.cpl
Display Properties (w/Appearance Tab Preselected) control color
Dr. Watson System Troubleshooting Utility drwtsn32
Driver Verifier Utility verifier
Event Viewer eventvwr.msc
Files and Settings Transfer Tool migwiz
File Signature Verification Tool sigverif
Findfast findfast.cpl
Firefox (if installed) firefox
Folders Properties folders
Fonts control fonts
Fonts Folder fonts
Free Cell Card Game freecell
Game Controllers joy.cpl
Group Policy Editor (XP Prof) gpedit.msc
Hearts Card Game mshearts
Help and Support helpctr
HyperTerminal hypertrm
Iexpress Wizard iexpress
Indexing Service ciadv.msc
Internet Connection Wizard icwconn1
Internet Explorer iexplore
Internet Properties inetcpl.cpl
Internet Setup Wizard inetwiz
IP Configuration (Display Connection Configuration) ipconfig /all
IP Configuration (Display DNS Cache Contents) ipconfig /displaydns
IP Configuration (Delete DNS Cache Contents) ipconfig /flushdns
IP Configuration (Release All Connections) ipconfig /release
IP Configuration (Renew All Connections) ipconfig /renew
IP Configuration (Refreshes DHCP & Re-Registers DNS) ipconfig /registerdns
IP Configuration (Display DHCP Class ID) ipconfig /showclassid
IP Configuration (Modifies DHCP Class ID) ipconfig /setclassid
Java Control Panel (if installed) jpicpl32.cpl
3. Java Control Panel (if installed) javaws
Keyboard Properties control keyboard
Local Security Settings secpol.msc
Local Users and Groups lusrmgr.msc
Logs You Out Of Windows logoff
Malicious Software Removal Tool mrt
Microsoft Access (if installed) msaccess
Microsoft Chat winchat
Microsoft Excel (if installed) excel
Microsoft Frontpage (if installed) frontpg
Microsoft Movie Maker moviemk
Microsoft Paint mspaint
Microsoft Powerpoint (if installed) powerpnt
Microsoft Word (if installed) winword
Microsoft Syncronization Tool mobsync
Minesweeper Game winmine
Mouse Properties control mouse
Mouse Properties main.cpl
Nero (if installed) nero
Netmeeting conf
Network Connections control netconnections
Network Connections ncpa.cpl
Network Setup Wizard netsetup.cpl
Notepad notepad
Nview Desktop Manager (if installed) nvtuicpl.cpl
Object Packager packager
ODBC Data Source Administrator odbccp32.cpl
On Screen Keyboard osk
Opens AC3 Filter (if installed) ac3filter.cpl
Outlook Express msimn
Paint pbrush
Password Properties password.cpl
Performance Monitor perfmon.msc
4. Performance Monitor perfmon
Phone and Modem Options telephon.cpl
Phone Dialer dialer
Pinball Game pinball
Power Configuration powercfg.cpl
Printers and Faxes control printers
Printers Folder printers
Private Character Editor eudcedit
Quicktime (If Installed) QuickTime.cpl
Quicktime Player (if installed) quicktimeplayer
Real Player (if installed) realplay
Regional Settings intl.cpl
Registry Editor regedit
Registry Editor regedit32
Remote Access Phonebook rasphone
Remote Desktop mstsc
Removable Storage ntmsmgr.msc
Removable Storage Operator Requests ntmsoprq.msc
Resultant Set of Policy (XP Prof) rsop.msc
Scanners and Cameras sticpl.cpl
Scheduled Tasks control schedtasks
Security Center wscui.cpl
Services services.msc
Shared Folders fsmgmt.msc
Shuts Down Windows shutdown
Sounds and Audio mmsys.cpl
Spider Solitare Card Game spider
SQL Client Configuration cliconfg
System Configuration Editor sysedit
System Configuration Utility msconfig
System File Checker Utility (Scan Immediately) sfc /scannow
System File Checker Utility (Scan Once At The Next Boot) sfc /scanonce
System File Checker Utility (Scan On Every Boot) sfc /scanboot
5. System File Checker Utility (Return Scan Setting To Default) sfc /revert
System File Checker Utility (Purge File Cache) sfc /purgecache
System File Checker Utility (Sets Cache Size to size x) sfc /cachesize=x
System Information msinfo32
System Properties sysdm.cpl
Task Manager taskmgr
TCP Tester tcptest
Telnet Client telnet
Tweak UI (if installed) tweakui
User Account Management nusrmgr.cpl
Utility Manager utilman
Windows Address Book wab
Windows Address Book Import Utility wabmig
Windows Backup Utility (if installed) ntbackup
Windows Explorer explorer
Windows Firewall firewall.cpl
Windows Magnifier magnify
Windows Management Infrastructure wmimgmt.msc
Windows Media Player wmplayer
Windows Messenger msmsgs
Windows Picture Import Wizard (need camera connected) wiaacmgr
Windows System Security Tool syskey
Windows Update Launches wupdmgr
Windows Version (to show which version of windows) winver
Windows XP Tour Wizard tourstart
Wordpad write