Cash Payment 9602870969 Escort Service in Udaipur Call Girls
Rhodia Sa
1. CreditRiskMonitor Report for Rhodia SA Page 1 of 26
Print Now Close This Window
Rhodia SA
Immeuble Coeur Defense
Tour A, 110
Phone: (1) 535-66464 Courbevoie 92400 France Ticker: RHA
Latest Financial Statements as of 3/31/2009
Business Summary
Rhodia is engaged in the development and production of specialty chemicals. It provides solutions to automotive,
electronics, flavors and fragrances, health, personal and home care, consumer, goods, and industrial, through its
global enterprises. The Company’s operating activities were organized into six global enterprises: Polyamide,
Novecare, Silcea, Energy Services, Acetow, and Eco Services. On February 27, 2009, Rhodia completed the
acquisition of McIntyre Group Ltd. In 2008, the Company discontinued its Organics segment.
Employees: 14,353 (as of 12/31/2008)
Credit Scores Auditor Information
FRISK2 Score 5 6/4/2009 Last Audit: 12/31/2008
Auditors: PricewaterhouseCoopers
Probability of default range: 3.7% - 7.4%
LLP
Z" Score -0.96 (Fiscal danger) 3/31/2009 Opinion: Unqualified with
Explanation
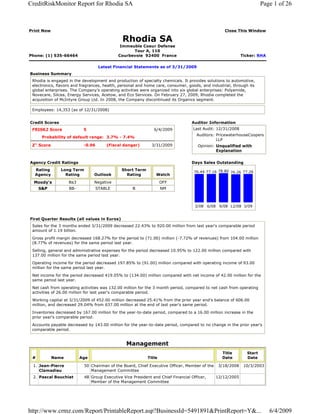
Agency Credit Ratings Days Sales Outstanding
Rating Long Term Short Term
76.44 77.16 78.80 76.26 77.26
Agency Rating Outlook Rating Watch
Moody's Ba3 Negative OFF
S&P BB- STABLE B NM
3/08 6/08 9/08 12/08 3/09
First Quarter Results (all values in Euros)
Sales for the 3 months ended 3/31/2009 decreased 22.43% to 920.00 million from last year's comparable period
amount of 1.19 billion.
Gross profit margin decreased 168.27% for the period to (71.00) million (-7.72% of revenues) from 104.00 million
(8.77% of revenues) for the same period last year.
Selling, general and administrative expenses for the period decreased 10.95% to 122.00 million compared with
137.00 million for the same period last year.
Operating income for the period decreased 197.85% to (91.00) million compared with operating income of 93.00
million for the same period last year.
Net income for the period decreased 419.05% to (134.00) million compared with net income of 42.00 million for the
same period last year.
Net cash from operating activities was 132.00 million for the 3 month period, compared to net cash from operating
activities of 26.00 million for last year's comparable period.
Working capital at 3/31/2009 of 452.00 million decreased 25.41% from the prior year end's balance of 606.00
million, and decreased 29.04% from 637.00 million at the end of last year's same period.
Inventories decreased by 167.00 million for the year-to-date period, compared to a 16.00 million increase in the
prior year's comparable period.
Accounts payable decreased by 143.00 million for the year-to-date period, compared to no change in the prior year's
comparable period.
Management
Title Start
# Name Age Title Date Date
1. Jean-Pierre 50 Chairman of the Board, Chief Executive Officer, Member of the 3/18/2008 10/3/2003
Clamadieu Management Committee
2. Pascal Bouchiat 48 Group Executive Vice President and Chief Financial Officer, 12/12/2005
Member of the Management Committee
http://www.crmz.com/Report/PrintableReport.asp?BusinessId=5491891&PrintReport=Y&... 6/4/2009
2. CreditRiskMonitor Report for Rhodia SA Page 2 of 26
3. Gilles Auffret 62 Chief Operating Officer, Member of the Management 1/1/2001
Committee
4. Jean-Pierre 46 Group Executive Vice President, General Counsel, Secretary, 9/1/2004 9/1/2004
Labroue Member of the Management Committeer
5. Yolene Coppin 51 Group Executive Vice President - Human Resources, Member 4/1/2008 4/1/2008
of the Management Committee
6. Bernard 61 Group Executive Vice President - Communications, Public 4/1/2008
Chambon Affairs, Security, Sustainable Development,
7. Marc Chollet 44 Group Executive Vice President - Strategy; Member of the 2/11/2008 2/11/2008
Management Committee
8. Yves-Rene 72 Director 3/17/2008 10/25/2002
Nanot
9. Jacques Kheliff 55 Director - Representative of employee shareholders 6/23/2005 6/23/2005
10. Henri Poupart- 40 Director 5/5/2009 5/5/2009
Lafarge
11. Patrick Buffet 55 Director 5/20/2009 5/20/2009
12. Pierre Levi 54 Independent Director 10/25/1999
Industries
Type Code Description
Sector BASICM Basic Materials
Industry CHMMFG Chemical Manufacturing
SIC 2819 Industrial Inorganic Chemicals, Not Elsewhere Classified
NAICS 325131 Inorganic Dye and Pigment Manufacturing
325998 All Other Miscellaneous Chemical Product and Preparation Manufacturing
325132 Synthetic Organic Dye and Pigment Manufacturing
http://www.crmz.com/Report/PrintableReport.asp?BusinessId=5491891&PrintReport=Y&... 6/4/2009
3. CreditRiskMonitor Report for Rhodia SA Page 3 of 26
Credit Ratings
Moody's Ratings
Long Term Short Term Date
Issuer Name Rating Outlook Rating Watchlist Updated
RHODIA S.A. Ba3 Negative OFF 5/11/2009
Note: Moody's ratings are continuously monitored by Moody's. Thus, a rating with no change going back in time only
reflects that, after review, Moody's has not changed the rating since that date. It does not mean there have been no
reviews since that date.
Standard & Poor's Ratings
S&P Long Term Short Term Credit Date
Entity Name Rating Outlook Rating Watch Issued
Rhodia S.A. BB- STABLE B NM 4/30/2009
Note: All S&P ratings are continuously monitored by S&P. Thus, a rating with no change going back in time only
reflects that, after review, S&P has not changed the rating since that date. It does not mean there have been no S&P
reviews since that date.
Z" Score
(0.40) (0.64) (0.47) (0.43) (0.44) (0.08) (0.19) (0.06) (0.26) (0.96)
LEGEND:
Financially sound: 2.60 or higher
Neutral: 1.10 to 2.60
Fiscal danger: less than 1.10
12/06 3/07 6/07 9/07 12/07 3/08 6/08 9/08 12/08 3/09
Altman's Z"-Score The Z"-Score was developed by Dr. Edward I. Altman of New York University in the early-1990's. This
model is applicable to firms in the manufacturing, merchandising and service sectors. The Z"-Score calculates and combines 4
financial ratios, assigning each a different weighting.
Although the numbers that go into calculating the Z"-Score (and a company's financial soundness) are sometimes influenced by
external factors, it provides a good tool for analyzing the ups and downs of a company's financial stability over time. The score is
computed as follows:
Total Working Retained
EBIT Equity Capital Earnings
Z" = -------- * 6.72 + ------------- * 1.05 + --------- * 6.56 + ---------- * 3.26
Total Total Total Total
Assets Liabilities Assets Assets
http://www.crmz.com/Report/PrintableReport.asp?BusinessId=5491891&PrintReport=Y&... 6/4/2009
4. CreditRiskMonitor Report for Rhodia SA Page 4 of 26
Likelihood of failure
Financially sound: 2.6 or higher
Neutral: 1.1 to 2.6
Fiscal danger: less than 1.1
Note that the Z"-Score is different than the original Z-score, developed by Altman in the 1960's. The original Z-Score has as one
of its variables the asset turnover ratio. As this variable is industry sensitive, the Z"-model, which omitted this variable, was
developed.
CreditRiskMonitor computes the Z"-score on a quarterly basis, provided the variables required by the scoring model are reported.
Previously, we used the company's quarterly EBIT in this calculation. Now we use the company's EBIT for the twelve trailing
months, as this provides a result that is less seasonal and less volatile.
One of the 4 variables used to compute Altman's Z"-Score is the ratio of working capital to total assets. As many of the
companies in the energy sector are highly leveraged, they generally have low working capital. Thus, we have found that their Z"-
Scores are adversely impacted and an abnormally high percentage of companies in this sector are in the neutral and fiscal danger
ranges.
Calculation of most recent Z"-Scores
(Financial data in thousands)
Component/Date 3/31/2008 6/30/2008 9/30/2008 12/31/2008 3/31/2009
EBIT(trailing-12 months) 174,000 202,000 180,000 134,000 (57,000)
TotalAssets 4,569,000 4,584,000 4,626,000 4,324,000 4,206,000
EBIT/TotalAssets 0.0381 0.0441 0.0389 0.031 -0.0136
(EBIT/TotalAssets)*6.72 0.2559 0.2961 0.2615 0.2083 -0.0911
TotalEquity (304,000) (339,000) (264,000) (375,000) (525,000)
TotalLiabilities 4,873,000 4,923,000 4,890,000 4,699,000 4,731,000
TotalEquity/TotalLiabilities -0.0624 -0.0689 -0.054 -0.0798 -0.111
(TotalEquity/TotalLiabilities)*1.05 -0.0655 -0.0723 -0.0567 -0.0838 -0.1165
WorkingCapital 637,000 548,000 614,000 606,000 452,000
TotalAssets 4,569,000 4,584,000 4,626,000 4,324,000 4,206,000
WorkingCapital/TotalAssets 0.1394 0.1195 0.1327 0.1401 0.1075
(WorkingCapital/TotalAssets)*6.56 0.9146 0.7842 0.8707 0.9194 0.705
RetainedEarnings (1,655,000) (1,690,000) (1,615,000) (1,726,000) (1,876,000)
TotalAssets 4,569,000 4,584,000 4,626,000 4,324,000 4,206,000
RetainedEarnings/TotalAssets -0.3622 -0.3687 -0.3491 -0.3992 -0.446
(RetainedEarnings/TotalAssets)*3.26 -1.1808 -1.2019 -1.1381 -1.3013 -1.4541
Z"-Score -0.08 -0.19 -0.06 -0.26 -0.96
* Gray shaded area(s) highlight missing Z"-Score component(s)
http://www.crmz.com/Report/PrintableReport.asp?BusinessId=5491891&PrintReport=Y&... 6/4/2009
5. CreditRiskMonitor Report for Rhodia SA Page 5 of 26
FRISK Score - A score indicating the probability of default for a company over a 12 month horizon, based on new daily
information in the CRMZ database, as calculated by a proprietary statistical model created by Dr. Camilo Gomez, and
back-tested on 10,000 companies. (see Financial Risk (FRISK) Score). Historical FRISK scores shown above may
have been updated, based on new information or improvements to the model, more recently than the dates shown.
The FRISK score is reported on a 1 to 10 scale:
Probability of default within 12 months
FRISK
From To
Best 10 0% 0.3%
9 0.3% 0.4%
8 0.4% 0.9%
7 0.9% 1.9%
6 1.9% 3.7%
5 3.7% 7.4%
4 7.4% 10.1%
3 10.1% 14.1%
2 14.1% 21.0%
Worst 1 21.0% 50.0%
http://www.crmz.com/Report/PrintableReport.asp?BusinessId=5491891&PrintReport=Y&... 6/4/2009
6. CreditRiskMonitor Report for Rhodia SA Page 6 of 26
Annual Financial Statements
Performance Ratios - Annual
(Thousands of Euros)
12 mos 12 mos 12 mos 12 mos 12 mos
Period Ended
12/31/2008 12/31/2007 12/31/2006 12/31/2005 12/31/2004
Net Sales € €4,763,000 €4,781,000 €4,810,000 €4,521,000 €4,184,000
% change -0.38% -0.60% 6.39% 8.05% -23.27%
Gross Margin € €381,000 €613,000 €549,000 €382,000 €243,000
% change -37.85% 11.66% 43.72% 57.20% -80.32%
% of sales 8.00% 12.82% 11.41% 8.45% 5.81%
change as % of incremental sales n/m n/m 57.79% 41.25% n/m
SG&A € €482,000 €506,000 €518,000 €523,000 €455,000
% change -4.74% -2.32% -0.96% 14.95% -25.65%
% of sales 10.12% 10.58% 10.77% 11.57% 10.87%
change as % of incremental sales n/m n/m -1.73% 20.18% n/m
Operating margin € €309,000 €422,000 €359,000 €66,000 (€135,000)
% change -26.78% 17.55% 443.94% 148.89% 82.26%
% of sales 6.49% 8.83% 7.46% 1.46% -3.23%
change as % of incremental sales n/m n/m 101.38% 59.64% n/m
EBITDA € €568,000 €580,000 €550,000 €366,000 €418,000
% change -2.07% 5.45% 50.27% -12.44% 200.72%
% of sales 11.93% 12.13% 11.43% 8.10% 9.99%
change as % of incremental sales n/m n/m 63.67% -15.43% n/m
Pre-tax income € €130,000 €130,000 €54,000 (€366,000) (€392,000)
% change 0.00% 140.74% 114.75% 6.63% 64.65%
% of sales 2.73% 2.72% 1.12% -8.10% -9.37%
change as % of incremental sales n/m n/m 145.33% 7.72% n/m
Net income (loss) € €105,000 €129,000 €62,000 (€616,000) (€641,000)
% change -18.60% 108.06% 110.06% 3.90% 52.55%
% of sales 2.20% 2.70% 1.29% -13.63% -15.32%
change as % of incremental sales n/m n/m 234.60% 7.42% n/m
Tax expense € €55,000 €83,000 (€57,000) €53,000 €98,000
Effective tax rate 42.31% 63.85% -105.56% -14.48% -25.00%
Depreciation expense € €245,000 €256,000 €298,000 €348,000 €422,000
% of sales 5.14% 5.35% 6.20% 7.70% 10.09%
% of capital expenses 86.88% 79.01% 95.82% 121.68% 170.16%
% of PP&E, net (annualized) 15.77% 14.90% 15.36% 16.08% 18.16%
Capital expenditures € €282,000 €324,000 €311,000 €286,000 €248,000
% change -12.96% 4.18% 8.74% 15.32% -9.82%
% of PP&E, net (annualized) 18.15% 18.85% 16.03% 13.22% 10.67%
% of working capital (annualized) 48.74% 70.01% 88.91% 123.28% 75.27%
Interest coverage ratio 4.09 3.74 2.00 1.44 1.76
% change 9.20% 87.10% 38.80% -18.30% 133.48%
Free cash flow € €37,000 €89,000 (€209,000) (€148,000) (€241,000)
% change -58.43% 142.58% -41.22% 38.59% 8.71%
ARS ARS ARS ARS ARS
Source:
3/25/2009 3/25/2009 4/2/2008 4/2/2007 4/2/2007
NOTE: This is a French company whose reported financial statements are denominated in Euros and whose current financial
statements are reported under International Financial Reporting Standards.
http://www.crmz.com/Report/PrintableReport.asp?BusinessId=5491891&PrintReport=Y&... 6/4/2009
7. CreditRiskMonitor Report for Rhodia SA Page 7 of 26
Liquidity Ratios - Annual
(Thousands of Euros)
12 mos 12 mos 12 mos 12 mos 12 mos
Period Ended
12/31/2008 12/31/2007 12/31/2006 12/31/2005 12/31/2004
Current assets € €2,169,000 €2,115,000 €2,682,000 €2,862,000 €2,628,000
% change 2.55% -21.14% -6.29% 8.90% 2.62%
% of short-term debt 634.21% 680.06% 600.00% 271.79% 341.30%
Current liabilities € €1,563,000 €1,627,000 €2,151,000 €2,691,000 €2,477,000
% change -3.93% -24.36% -20.07% 8.64% -26.13%
Working capital € €606,000 €488,000 €531,000 €171,000 €151,000
% change 24.18% -8.10% 210.53% 13.25% 119.07%
% of sales (annualized) 12.72% 10.21% 11.04% 3.78% 3.61%
Cash € €668,000 €530,000 €520,000 €967,000 €653,000
% change 26.04% 1.92% -46.23% 48.09% -14.75%
% of short-term debt 195.32% 170.42% 116.33% 91.83% 84.81%
Cash ratio 0.43 0.33 0.24 0.36 0.26
% change 31.18% 34.80% -32.73% 36.31% 15.36%
Quick assets € €1,259,000 €1,236,000 €1,269,000 €1,805,000 €1,500,000
% change 1.86% -2.60% -29.70% 20.33% 39.28%
% of short-term debt 368.13% 397.43% 283.89% 171.42% 194.81%
Quick ratio 0.81 0.76 0.59 0.67 0.61
% change 6.03% 28.76% -12.05% 10.77% 88.54%
Current ratio 1.39 1.30 1.25 1.06 1.06
% change 6.75% 4.25% 17.24% 0.24% 38.91%
ARS ARS ARS ARS ARS
Source:
3/25/2009 3/25/2009 4/2/2008 4/2/2007 4/2/2007
NOTE: This is a French company whose reported financial statements are denominated in Euros and whose current financial
statements are reported under International Financial Reporting Standards.
http://www.crmz.com/Report/PrintableReport.asp?BusinessId=5491891&PrintReport=Y&... 6/4/2009
8. CreditRiskMonitor Report for Rhodia SA Page 8 of 26
Efficiency Ratios - Annual
(Thousands of Euros)
12 mos 12 mos 12 mos 12 mos 12 mos
Period Ended
12/31/2008 12/31/2007 12/31/2006 12/31/2005 12/31/2004
Accounts receivable € €591,000 €706,000 €749,000 €838,000 €847,000
% change -16.29% -5.74% -10.62% -1.06% 172.35%
% of sales 12.41% 14.77% 15.57% 18.54% 20.24%
change as % of incremental sales n/m n/m -30.80% -2.67% n/m
Accounts receivable turnover
4.84 4.86 4.93 5.37 6.45
(annualized)
% change -0.50% -1.29% -8.25% -16.78% n/a
Days sales outstanding 75.44 75.06 74.09 67.98 56.57
% change 0.50% 1.31% 8.99% 20.16% n/a
Inventory € €666,000 €583,000 €619,000 €630,000 €701,000
% change 14.24% -5.82% -1.75% -10.13% -3.44%
% of sales 13.98% 12.19% 12.87% 13.94% 16.75%
change as % of incremental sales n/m n/m -3.81% -21.07% n/m
% inventory financed by
145.95% 125.73% 121.81% 133.81% 119.12%
vendors
% change 16.08% 3.22% -8.97% 12.34% 10.30%
Inventory turnover (annualized) 6.82 6.88 6.76 5.99 5.61
% change -0.79% 1.79% 12.81% 6.85% n/a
No. of days sales in inventory 53.49 53.07 54.02 60.94 65.11
% change 0.80% -1.76% -11.35% -6.41% n/a
Inventory to working capital
1.10 1.19 1.17 3.68 4.64
ratio
% change -8.01% 2.49% -68.36% -20.64% 606.43%
Accounts payable € €972,000 €733,000 €754,000 €843,000 €835,000
% change 32.61% -2.79% -10.56% 0.96% 6.51%
% of sales 20.41% 15.33% 15.68% 18.65% 19.96%
change as % of incremental sales n/m n/m -30.80% 2.37% n/m
Accounts payable turnover
4.14 3.90 4.02 5.04 4.86
(annualized)
% change 6.37% -3.06% -20.24% 3.75% n/a
ARS ARS ARS ARS ARS
Source:
3/25/2009 3/25/2009 4/2/2008 4/2/2007 4/2/2007
NOTE: This is a French company whose reported financial statements are denominated in Euros and whose current financial
statements are reported under International Financial Reporting Standards.
http://www.crmz.com/Report/PrintableReport.asp?BusinessId=5491891&PrintReport=Y&... 6/4/2009
9. CreditRiskMonitor Report for Rhodia SA Page 9 of 26
Leverage Ratios - Annual
(Thousands of Euros)
12 mos 12 mos 12 mos 12 mos 12 mos
Period Ended
12/31/2008 12/31/2007 12/31/2006 12/31/2005 12/31/2004
Total debt € €1,954,000 €1,986,000 €2,469,000 €3,028,000 €3,020,000
% change -1.61% -19.56% -18.46% 0.26% -9.39%
Stockholders' equity € (€375,000) (€389,000) (€653,000) (€692,000) (€546,000)
% change 3.60% 40.43% 5.64% -26.74% -316.67%
Tangible net worth € (€753,000) (€779,000) (€1,056,000) (€1,090,000) (€911,000)
% change 3.34% 26.23% 3.12% -19.65% -187.38%
Total assets € €4,324,000 €4,478,000 €5,153,000 €5,646,000 €5,566,000
% change -3.44% -13.10% -8.73% 1.44% -14.75%
Total debt to assets ratio 0.45 0.44 0.48 0.54 0.54
% change 1.89% -7.43% -10.67% -1.16% 6.29%
Net tangible assets € €3,946,000 €4,088,000 €4,750,000 €5,248,000 €5,201,000
% change -3.47% -13.94% -9.49% 0.90% -12.73%
Short-term debt € €342,000 €311,000 €447,000 €1,053,000 €770,000
% change 9.97% -30.43% -57.55% 36.75% -46.79%
Short-term debt % of total debt 17.50% 15.66% 18.10% 34.78% 25.50%
% change 11.77% -13.50% -47.94% 36.39% -41.27%
Short-term debt % of working
56.44% 63.73% 84.18% 615.79% 509.93%
capital
% change -11.45% -24.29% -86.33% 20.76% 379.11%
Total liabilities € €4,699,000 €4,867,000 €5,806,000 €6,338,000 €6,112,000
% change -3.45% -16.17% -8.39% 3.70% -2.63%
ARS ARS ARS ARS ARS
Source:
3/25/2009 3/25/2009 4/2/2008 4/2/2007 4/2/2007
NOTE: This is a French company whose reported financial statements are denominated in Euros and whose current financial
statements are reported under International Financial Reporting Standards.
http://www.crmz.com/Report/PrintableReport.asp?BusinessId=5491891&PrintReport=Y&... 6/4/2009
10. CreditRiskMonitor Report for Rhodia SA Page 10 of 26
Long Term Obligations - Annual
(Thousands of Euros)
12 mos 12 mos 12 mos 12 mos 12 mos
Period Ended
12/31/2008 12/31/2007 12/31/2006 12/31/2005 12/31/2004
Long Term Obligations:
Maturing within 1 year 215,000 240,000 400,000 1,039,000 721,000
% of free cash flow 581.08% 269.66% n/m n/m n/m
Maturing within 2 years 13,000 57,000 14,000 27,000 460,000
% of free cash flow 35.14% 64.04% n/m n/m n/m
Maturing within 3 years 25,000 22,000 34,000 13,000 34,000
% of free cash flow 67.57% 24.72% n/m n/m n/m
Maturing within 4 years 7,000 9,000 409,000 2,000 1,000
Maturing within 5 years 1,049,000 2,000 464,000 1,321,000 1,000
Remaining Long Term Debt 510,000 1,575,000 1,091,000 499,000 1,547,000
Total Long Term Debt 1,819,000 1,905,000 2,412,000 2,901,000 2,764,000
Capital lease obligations:
Maturing within 1 year 4,000 3,000 13,000 n/a n/a
% of free cash flow 10.81% 3.37% n/m n/a n/a
Maturing within 2 year 1,000 5,000 3,000 18,000 73,000
% of free cash flow 2.70% 5.62% n/m n/m n/m
Maturing within 3 year 0 1,000 4,000 8,000 35,000
% of free cash flow 0.00% 1.12% n/m n/m n/m
Maturing within 4 year 1,000 0 1,000 64,000 32,000
Maturing within 5 year 1,000 1,000 1,000 4,000 67,000
Remaining Capital Leases 1,000 3,000 1,000 19,000 0
Total Capital Leases 8,000 13,000 23,000 113,000 207,000
Operating Lease Obligations:
Maturing within 1 year 36,000 40,000 25,000 n/a n/a
% of free cash flow 97.30% 44.94% n/m n/a n/a
Maturing within 5 years 78,000 86,000 83,000 n/a n/a
Remaining Operating Leases 38,000 47,000 60,000 n/a n/a
Total Operating Leases 152,000 173,000 168,000 n/a n/a
Cumulative Obligations due within 3 years:
Total Obligations Maturing
294,000 368,000 493,000 1,105,000 1,323,000
within 3 years
% of free cash flow 794.59% 413.48% n/m n/m n/m
ARS ARS ARS ARS ARS
Source:
3/25/2009 3/25/2009 4/2/2008 4/2/2007 4/2/2007
NOTE: This is a French company whose reported financial statements are denominated in Euros and whose current financial
statements are reported under International Financial Reporting Standards.
NOTE: Long-term obligations information is extracted from the Management Discussion and Analysis (MD&A) section of a
company's annual SEC filing. This information is only disclosed on an annual basis. For more information, see 'What are
"Obligations?"' in our FAQ.
http://www.crmz.com/Report/PrintableReport.asp?BusinessId=5491891&PrintReport=Y&... 6/4/2009
11. CreditRiskMonitor Report for Rhodia SA Page 11 of 26
Rates of Return - Annual
(Thousands of Euros)
12 mos 12 mos 12 mos 12 mos 12 mos
Period Ended
12/31/2008 12/31/2007 12/31/2006 12/31/2005 12/31/2004
Return on equity n/a n/a n/a n/a -254.37%
% change n/a n/a n/a n/a -249.26%
Return on total assets 2.33% 2.76% 1.19% -11.08% -10.78%
% change -15.89% 131.97% 110.75% -2.77% n/a
Return on net tangible assets 2.55% 3.02% 1.29% -11.94% -11.65%
% change -15.60% 133.60% 110.83% -2.51% n/a
ARS ARS ARS ARS ARS
Source:
3/25/2009 3/25/2009 4/2/2008 4/2/2007 4/2/2007
NOTE: This is a French company whose reported financial statements are denominated in Euros and whose current financial
statements are reported under International Financial Reporting Standards.
http://www.crmz.com/Report/PrintableReport.asp?BusinessId=5491891&PrintReport=Y&... 6/4/2009
12. CreditRiskMonitor Report for Rhodia SA Page 12 of 26
Balance Sheet - Annual - Standardized
(Thousands of Euros)
As of 12/31/2008 12/31/2007 12/31/2006 12/31/2005 12/31/2004
Restated
12/31/2005
Current Assets:
Cash and short term
€668,000 €530,000 €520,000 €967,000 €653,000
investments
Accounts receivable
591,000 706,000 749,000 838,000 847,000
(trade), net
Other receivables 230,000 259,000 334,000 350,000 413,000
Total inventory 666,000 583,000 619,000 630,000 701,000
Other current assets,
14,000 37,000 460,000 77,000 14,000
total
Total current assets 2,169,000 2,115,000 2,682,000 2,862,000 2,628,000
Non-Current Assets:
Property/plant/equip.,
1,501,000 1,686,000 1,760,000 2,135,000 2,245,000
net
Goodwill, net 197,000 207,000 225,000 244,000 226,000
Intangibles, net 181,000 183,000 178,000 154,000 139,000
Long term investments 105,000 126,000 125,000 168,000 229,000
Other long term assets,
171,000 161,000 183,000 83,000 99,000
total
Total assets €4,324,000 €4,478,000 €5,153,000 €5,646,000 €5,566,000
Current Liabilities:
Accounts payable €972,000 €733,000 €754,000 €843,000 €835,000
Notes payable/short
123,000 68,000 34,000 14,000 49,000
term debt
Current port. LT
219,000 243,000 413,000 1,039,000 721,000
debt/capital leases
Other current liabilities,
249,000 583,000 950,000 795,000 872,000
total
Total current
1,563,000 1,627,000 2,151,000 2,691,000 2,477,000
liabilities
Non-Current Liabilities:
Long term debt 1,608,000 1,665,000 2,012,000 1,862,000 2,043,000
Capital lease obligations 4,000 10,000 10,000 113,000 207,000
Deferred income tax 38,000 43,000 32,000 34,000 55,000
Minority interest 19,000 21,000 25,000 26,000 25,000
Other liabilities, total 1,467,000 1,501,000 1,576,000 1,612,000 1,305,000
Total liabilities 4,699,000 4,867,000 5,806,000 6,338,000 6,112,000
Shareholders' Equity:
Common stock 1,213,000 1,204,000 1,204,000 1,177,000 628,000
Additional paid-in
138,000 147,000 23,000 570,000 807,000
capital
Retained
(1,726,000) (1,740,000) (1,880,000) (2,439,000) (1,981,000)
earnings/accum. deficit
Total equity (375,000) (389,000) (653,000) (692,000) (546,000)
Total liabilities &
€4,324,000 €4,478,000 €5,153,000 €5,646,000 €5,566,000
shareholders' equity
Supplemental Information:
Total common shares
99,295 100,368 100,345 98,056 39,299
outstanding
Pricewaterhouse Pricewaterhouse Pricewaterhouse Pricewaterhouse Pricewaterhouse
Auditor/Opinion: Coopers LLP Coopers LLP Coopers LLP Coopers LLP Coopers LLP
Unqualified Unqualified Unqualified Unqualified Unqualified
with
http://www.crmz.com/Report/PrintableReport.asp?BusinessId=5491891&PrintReport=Y&... 6/4/2009
13. CreditRiskMonitor Report for Rhodia SA Page 13 of 26
Explanation
ARS ARS ARS ARS ARS
Source:
3/25/2009 4/2/2008 4/2/2007 3/30/2006 3/30/2006
NOTE: This is a French company whose reported financial statements are denominated in Euros and whose current financial
statements are reported under International Financial Reporting Standards.
http://www.crmz.com/Report/PrintableReport.asp?BusinessId=5491891&PrintReport=Y&... 6/4/2009
14. CreditRiskMonitor Report for Rhodia SA Page 14 of 26
Income Statement - Annual - Standardized
(Thousands of Euros)
12 mos 12 mos 12 mos 12 mos 12 mos
Period Ended
12/31/2008 12/31/2007 12/31/2006 12/31/2005 12/31/2004
Restated Reclassified Restated Restated
12/31/2008 12/31/2007 12/31/2006 12/31/2006
Revenue:
Revenue €4,763,000 €4,781,000 €4,810,000 €4,521,000 €4,184,000
Other revenue, total 550,000 463,000 451,000 435,000 424,000
Total revenue 5,313,000 5,244,000 5,261,000 4,956,000 4,608,000
Operating Expense:
Cost of revenue, total 4,382,000 4,168,000 4,261,000 4,139,000 3,941,000
SG&A expenses, total 482,000 506,000 518,000 523,000 455,000
Research & development 73,000 93,000 103,000 104,000 116,000
Depreciation/amortization n/a n/a 0 0 16,000
Unusual income/expense 40,000 55,000 21,000 82,000 168,000
Other operating expenses,
27,000 0 (1,000) 42,000 47,000
total
Total expense 5,004,000 4,822,000 4,902,000 4,890,000 4,743,000
Operating income 309,000 422,000 359,000 66,000 (135,000)
Non-Operating Expense/Income:
Interest expense, net non-
(135,000) (154,000) (275,000) (254,000) (237,000)
operating
Interest/investment
(4,000) (1,000) 118,000 40,000 177,000
income, non-operating
Gain/loss on sale of assets n/a n/a (2,000) n/a n/a
Other, net (40,000) (137,000) (146,000) (218,000) (197,000)
Income before tax 130,000 130,000 54,000 (366,000) (392,000)
Income tax - total 55,000 83,000 (57,000) 53,000 98,000
Income after tax 75,000 47,000 111,000 (419,000) (490,000)
Minority interest (2,000) (2,000) (4,000) (1,000) (9,000)
Extraordinary Items:
Total extraordinary items 32,000 84,000 (45,000) (196,000) (142,000)
Net income €105,000 €129,000 €62,000 (€616,000) (€641,000)
Supplemental and Per Share Items:
Basic/primary EPS incl.
€1.04 €1.29 €0.62 (€11.45) (€16.31)
extra. items
Diluted EPS incl. extra.
€1.03 €1.27 €0.62 (€11.45) (€16.31)
items
Interest expense,
€135,000 €154,000 €275,000 €254,000 €237,000
supplemental
Depreciation/amortization,
€245,000 €256,000 €298,000 €348,000 €422,000
supplemental
Pricewaterhouse Pricewaterhouse
Coopers LLP Coopers LLP Pricewaterhouse Pricewaterhouse Pricewaterhouse
Auditor/Opinion: Unqualified Unqualified Coopers LLP Coopers LLP Coopers LLP
with with Unqualified Unqualified Unqualified
Explanation Explanation
ARS ARS ARS ARS ARS
Source:
3/25/2009 3/25/2009 4/2/2008 4/2/2007 4/2/2007
NOTE: This is a French company whose reported financial statements are denominated in Euros and whose current financial
statements are reported under International Financial Reporting Standards.
http://www.crmz.com/Report/PrintableReport.asp?BusinessId=5491891&PrintReport=Y&... 6/4/2009
15. CreditRiskMonitor Report for Rhodia SA Page 15 of 26
Statement of Cash Flows - Annual - Standardized
(Thousands of Euros)
12 mos 12 mos 12 mos 12 mos 12 mos
Period Ended
12/31/2008 12/31/2007 12/31/2006 12/31/2005 12/31/2004
Reclassified
12/31/2005
Cash Flows from Operating Activities:
Net income €105,000 €129,000 €62,000 (€616,000) (€641,000)
Depreciation/depletion 299,000 295,000 339,000 518,000 750,000
Non-cash Items (33,000) (36,000) (60,000) 288,000 (64,000)
Changes in working
(52,000) 25,000 (239,000) (52,000) (38,000)
capital
Total cash from
319,000 413,000 102,000 138,000 7,000
operating activities
Cash Flows from Investing Activities:
Capital expenditures (282,000) (324,000) (311,000) (286,000) (248,000)
Other investing cash
200,000 272,000 141,000 75,000 545,000
flow items, total
Total cash from
(82,000) (52,000) (170,000) (211,000) 297,000
investing activities
Cash Flows from Financing Activities:
Total cash dividends
(27,000) (3,000) (2,000) n/a n/a
paid
Issuance/retirement of
(14,000) (2,000) 36,000 576,000 447,000
stock, net
Issuance/retirement of
(88,000) (407,000) (410,000) (233,000) (933,000)
debt, net
Total cash from
(129,000) (412,000) (376,000) 343,000 (486,000)
financing activities
Foreign exchange
(31,000) (1,000) (9,000) 38,000 (4,000)
effects
Net change in cash 77,000 (52,000) (453,000) 308,000 (186,000)
Net cash-beginning
415,000 467,000 920,000 612,000 798,000
balance
Net cash-ending
€492,000 €415,000 €467,000 €920,000 €612,000
balance
Pricewaterhouse
Coopers LLP Pricewaterhouse Pricewaterhouse Pricewaterhouse Pricewaterhouse
Auditor/Opinion: Unqualified Coopers LLP Coopers LLP Coopers LLP Coopers LLP
with Unqualified Unqualified Unqualified Unqualified
Explanation
ARS ARS ARS ARS ARS
Source:
3/25/2009 4/2/2008 4/2/2007 3/30/2006 3/30/2006
NOTE: This is a French company whose reported financial statements are denominated in Euros and whose current financial
statements are reported under International Financial Reporting Standards.
http://www.crmz.com/Report/PrintableReport.asp?BusinessId=5491891&PrintReport=Y&... 6/4/2009
16. CreditRiskMonitor Report for Rhodia SA Page 16 of 26
Financial Statements - Sequential Quarters
Performance Ratios - Sequential Quarters
(Thousands of Euros)
3 mos 3 mos 3 mos 3 mos 3 mos
Period Ended
3/31/2009 12/31/2008 9/30/2008 6/30/2008 3/31/2008
Net Sales € €920,000 €1,126,000 €1,224,000 €1,227,000 €1,186,000
% change -18.29% -8.01% -0.24% 3.46% 0.00%
Gross Margin € (€71,000) €30,000 €100,000 €147,000 €104,000
% change -336.67% -70.00% -31.97% 41.35% -12.61%
% of sales -7.72% 2.66% 8.17% 11.98% 8.77%
change as % of incremental sales n/m n/m n/m 104.88% n/m
SG&A € €122,000 €108,000 €118,000 €119,000 €137,000
% change 12.96% -8.47% -0.84% -13.14% 12.30%
% of sales 13.26% 9.59% 9.64% 9.70% 11.55%
change as % of incremental sales n/m n/m n/m -43.90% n/m
Operating margin € (€91,000) €14,000 €87,000 €115,000 €93,000
% change -750.00% -83.91% -24.35% 23.66% 20.78%
% of sales -9.89% 1.24% 7.11% 9.37% 7.84%
change as % of incremental sales n/m n/m n/m 53.66% n/m
EBITDA € (€66,000) €62,000 €120,000 €127,000 €124,000
% change -206.45% -48.33% -5.51% 2.42% 16.98%
% of sales -7.17% 5.51% 9.80% 10.35% 10.46%
change as % of incremental sales n/m n/m n/m 7.32% n/m
Pre-tax income € (€136,000) (€24,000) €43,000 €60,000 €51,000
% change -466.67% -155.81% -28.33% 17.65% 64.52%
% of sales -14.78% -2.13% 3.51% 4.89% 4.30%
change as % of incremental sales n/m n/m n/m 21.95% n/m
Net income (loss) € (€134,000) (€28,000) €56,000 €35,000 €42,000
% change -378.57% -150.00% 60.00% -16.67% 90.91%
% of sales -14.57% -2.49% 4.58% 2.85% 3.54%
change as % of incremental sales n/m n/m n/m -17.07% n/m
Tax expense € (€8,000) (€3,000) €21,000 €26,000 €11,000
Effective tax rate 5.88% 12.50% 48.84% 43.33% 21.57%
Depreciation expense € €75,000 €77,000 €79,000 €69,000 €74,000
% of sales 8.15% 6.84% 6.45% 5.62% 6.24%
% of capital expenses 144.23% 105.48% 111.27% 106.15% 101.37%
% of PP&E, net (annualized) 19.95% 20.22% 20.59% 18.19% 18.51%
Capital expenditures € €52,000 €73,000 €71,000 €65,000 €73,000
% change -28.77% 2.82% 9.23% -10.96% -12.05%
% of PP&E, net (annualized) 13.83% 19.17% 18.51% 17.13% 18.26%
% of working capital (annualized) 39.32% 47.87% 48.88% 43.88% 51.91%
Interest coverage ratio n/a 6.89 n/a n/a n/a
Free cash flow € €80,000 €161,000 (€62,000) (€15,000) (€47,000)
% change -50.31% 359.68% -313.33% 68.09% -139.17%
Interim Report ARS Interim Report Interim Report Interim Report
Source:
5/6/2009 3/25/2009 11/6/2008 7/30/2008 5/7/2008
NOTE: This is a French company whose reported financial statements are denominated in Euros and whose current financial
statements are reported under International Financial Reporting Standards.
http://www.crmz.com/Report/PrintableReport.asp?BusinessId=5491891&PrintReport=Y&... 6/4/2009
17. CreditRiskMonitor Report for Rhodia SA Page 17 of 26
Liquidity Ratios - Sequential Quarters
(Thousands of Euros)
3 mos 3 mos 3 mos 3 mos 3 mos
Period Ended
3/31/2009 12/31/2008 9/30/2008 6/30/2008 3/31/2008
Current assets € €1,949,000 €2,169,000 €2,401,000 €2,374,000 €2,374,000
% change -10.14% -9.66% 1.14% 0.00% 12.25%
% of short-term debt 482.43% 634.21% 546.92% 525.22% 562.56%
Current liabilities € €1,497,000 €1,563,000 €1,787,000 €1,826,000 €1,737,000
% change -4.22% -12.54% -2.14% 5.12% 6.76%
Working capital € €452,000 €606,000 €614,000 €548,000 €637,000
% change -25.41% -1.30% 12.04% -13.97% 30.53%
% of sales (annualized) 12.28% 13.45% 12.54% 11.17% 13.43%
Cash € €703,000 €668,000 €600,000 €515,000 €589,000
% change 5.24% 11.33% 16.50% -12.56% 11.13%
% of short-term debt 174.01% 195.32% 136.67% 113.94% 139.57%
Cash ratio 0.47 0.43 0.34 0.28 0.34
% change 9.87% 27.28% 19.08% -16.84% 4.08%
Quick assets € €1,440,000 €1,489,000 €1,661,000 €1,568,000 €1,611,000
% change -3.29% -10.36% 5.93% -2.67% 7.76%
% of short-term debt 356.44% 435.38% 378.36% 346.90% 381.75%
Quick ratio 0.96 0.95 0.93 0.86 0.93
% change 0.97% 2.50% 8.25% -7.42% 0.94%
Current ratio 1.30 1.39 1.34 1.30 1.37
% change -6.18% 3.28% 3.35% -4.87% 5.14%
Interim Report ARS Interim Report Interim Report Interim Report
Source:
5/6/2009 3/25/2009 11/6/2008 7/30/2008 5/7/2008
NOTE: This is a French company whose reported financial statements are denominated in Euros and whose current financial
statements are reported under International Financial Reporting Standards.
http://www.crmz.com/Report/PrintableReport.asp?BusinessId=5491891&PrintReport=Y&... 6/4/2009
18. CreditRiskMonitor Report for Rhodia SA Page 18 of 26
Efficiency Ratios - Sequential Quarters
(Thousands of Euros)
3 mos 3 mos 3 mos 3 mos 3 mos
Period Ended
3/31/2009 12/31/2008 9/30/2008 6/30/2008 3/31/2008
Accounts receivable € €737,000 €821,000 €1,061,000 €1,053,000 €1,022,000
% change -10.23% -22.62% 0.76% 3.03% 5.91%
% of sales 80.11% 72.91% 86.68% 85.82% 86.17%
change as % of incremental sales n/m n/m n/m 75.61% n/m
Accounts receivable turnover
4.72 4.79 4.63 4.73 4.78
(annualized)
% change -1.30% 3.33% -2.08% -0.93% 0.45%
Days sales outstanding 77.26 76.26 78.80 77.16 76.44
% change 1.32% -3.23% 2.13% 0.94% -0.45%
Inventory € €499,000 €666,000 €729,000 €634,000 €599,000
% change -25.08% -8.64% 14.98% 5.84% 2.74%
% of sales 54.24% 59.15% 59.56% 51.67% 50.51%
change as % of incremental sales n/m n/m n/m 85.37% n/m
% inventory financed by vendors 166.13% 145.95% 149.66% 170.66% 178.96%
% change 13.83% -2.48% -12.31% -4.64% -2.58%
Inventory turnover (annualized) 6.81 6.29 6.60 7.01 7.32
% change 8.27% -4.73% -5.85% -4.31% 1.15%
No. of days sales in inventory 53.64 58.07 55.33 52.09 49.84
% change -7.64% 4.96% 6.22% 4.51% -1.14%
Inventory to working capital ratio 1.10 1.10 1.19 1.16 0.94
% change 0.46% -7.44% 2.63% 23.04% -21.29%
Accounts payable € €829,000 €972,000 €1,091,000 €1,082,000 €1,072,000
% change -14.71% -10.91% 0.83% 0.93% 0.09%
% of sales 90.11% 86.32% 89.13% 88.18% 90.39%
change as % of incremental sales n/m n/m n/m 24.39% n/m
Accounts payable turnover
4.40 4.25 4.14 4.01 4.04
(annualized)
% change 3.57% 2.71% 3.17% -0.70% -1.20%
Interim Interim Interim Interim
ARS
Source: Report Report Report Report
3/25/2009
5/6/2009 11/6/2008 7/30/2008 5/7/2008
NOTE: This is a French company whose reported financial statements are denominated in Euros and whose current financial
statements are reported under International Financial Reporting Standards.
http://www.crmz.com/Report/PrintableReport.asp?BusinessId=5491891&PrintReport=Y&... 6/4/2009
19. CreditRiskMonitor Report for Rhodia SA Page 19 of 26
Leverage Ratios - Sequential Quarters
(Thousands of Euros)
3 mos 3 mos 3 mos 3 mos 3 mos
Period Ended
3/31/2009 12/31/2008 9/30/2008 6/30/2008 3/31/2008
Total debt € €2,024,000 €1,954,000 €2,082,000 €2,103,000 €2,074,000
% change 3.58% -6.15% -1.00% 1.40% 4.43%
Stockholders' equity € (€525,000) (€375,000) (€264,000) (€339,000) (€304,000)
% change -40.00% -42.05% 22.12% -11.51% 21.85%
Tangible net worth € (€987,000) (€753,000) (€673,000) (€741,000) (€713,000)
% change -31.08% -11.89% 9.18% -3.93% 8.47%
Total assets € €4,206,000 €4,324,000 €4,626,000 €4,584,000 €4,569,000
% change -2.73% -6.53% 0.92% 0.33% 2.03%
Total debt to assets ratio 0.48 0.45 0.45 0.46 0.45
% change 6.48% 0.40% -1.90% 1.08% 2.35%
Net tangible assets € €3,744,000 €3,946,000 €4,217,000 €4,182,000 €4,160,000
% change -5.12% -6.43% 0.84% 0.53% 1.76%
Short-term debt € €404,000 €342,000 €439,000 €452,000 €422,000
% change 18.13% -22.10% -2.88% 7.11% 35.69%
Short-term debt % of total debt 19.96% 17.50% 21.09% 21.49% 20.35%
% change 14.04% -16.99% -1.90% 5.63% 29.93%
Short-term debt % of working
89.38% 56.44% 71.50% 82.48% 66.25%
capital
% change 58.38% -21.07% -13.32% 24.50% 3.95%
Total liabilities € €4,731,000 €4,699,000 €4,890,000 €4,923,000 €4,873,000
% change 0.68% -3.91% -0.67% 1.03% 0.12%
Interim Interim Interim Interim
ARS
Source: Report Report Report Report
3/25/2009
5/6/2009 11/6/2008 7/30/2008 5/7/2008
NOTE: This is a French company whose reported financial statements are denominated in Euros and whose current financial
statements are reported under International Financial Reporting Standards.
http://www.crmz.com/Report/PrintableReport.asp?BusinessId=5491891&PrintReport=Y&... 6/4/2009
20. CreditRiskMonitor Report for Rhodia SA Page 20 of 26
Rates of Return - Sequential Quarters
(Thousands of Euros)
3 mos 3 mos 3 mos 3 mos 3 mos
Period Ended
3/31/2009 12/31/2008 9/30/2008 6/30/2008 3/31/2008
Return on total assets -3.14% -0.63% 1.22% 0.76% 0.93%
% change -402.14% -151.45% 59.01% -17.63% 89.14%
Return on net tangible assets -3.49% -0.69% 1.33% 0.84% 1.02%
% change -408.02% -151.44% 58.92% -17.61% 89.43%
Interim Report ARS Interim Report Interim Report Interim Report
Source:
5/6/2009 3/25/2009 11/6/2008 7/30/2008 5/7/2008
NOTE: This is a French company whose reported financial statements are denominated in Euros and whose current financial
statements are reported under International Financial Reporting Standards.
http://www.crmz.com/Report/PrintableReport.asp?BusinessId=5491891&PrintReport=Y&... 6/4/2009
21. CreditRiskMonitor Report for Rhodia SA Page 21 of 26
Balance Sheet - Sequential Quarters - Standardized
(Thousands of Euros)
As of 3/31/2009 12/31/2008 9/30/2008 6/30/2008 3/31/2008
Current Assets:
Cash and short term investments €703,000 €668,000 €600,000 €515,000 €589,000
Accounts receivable (trade), net 737,000 821,000 1,061,000 1,053,000 1,022,000
Total inventory 499,000 666,000 729,000 634,000 599,000
Other current assets, total 10,000 14,000 11,000 172,000 164,000
Total current assets 1,949,000 2,169,000 2,401,000 2,374,000 2,374,000
Non-Current Assets:
Property/plant/equip., net 1,506,000 1,501,000 1,546,000 1,523,000 1,512,000
Goodwill, net 260,000 197,000 203,000 194,000 193,000
Intangibles, net 202,000 181,000 206,000 208,000 216,000
Long term investments 104,000 105,000 112,000 118,000 117,000
Other long term assets, total 185,000 171,000 158,000 167,000 157,000
Total assets €4,206,000 €4,324,000 €4,626,000 €4,584,000 €4,569,000
Current Liabilities:
Accounts payable €829,000 €972,000 €1,091,000 €1,082,000 €1,072,000
Notes payable/short term debt 146,000 123,000 106,000 125,000 76,000
Current port. LT debt/capital leases 258,000 219,000 333,000 327,000 346,000
Other current liabilities, total 264,000 249,000 257,000 292,000 243,000
Total current liabilities 1,497,000 1,563,000 1,787,000 1,826,000 1,737,000
Non-Current Liabilities:
Long term debt 1,620,000 1,612,000 1,643,000 1,651,000 1,652,000
Deferred income tax 33,000 38,000 44,000 44,000 46,000
Minority interest 18,000 19,000 21,000 19,000 20,000
Other liabilities, total 1,563,000 1,467,000 1,395,000 1,383,000 1,418,000
Total liabilities 4,731,000 4,699,000 4,890,000 4,923,000 4,873,000
Shareholders' Equity:
Common stock 1,213,000 1,213,000 1,213,000 1,213,000 1,213,000
Additional paid-in capital 138,000 138,000 138,000 138,000 138,000
Retained earnings/accum. deficit (1,876,000) (1,726,000) (1,615,000) (1,690,000) (1,655,000)
Total equity (525,000) (375,000) (264,000) (339,000) (304,000)
Total liabilities & shareholders'
€4,206,000 €4,324,000 €4,626,000 €4,584,000 €4,569,000
equity
Supplemental Information:
Total common shares outstanding 101,087 99,295 100,368 100,368 100,368
Interim Interim Interim Interim
ARS
Source: Report Report Report Report
3/25/2009
5/6/2009 11/6/2008 7/30/2008 5/7/2008
NOTE: This is a French company whose reported financial statements are denominated in Euros and whose current financial
statements are reported under International Financial Reporting Standards.
http://www.crmz.com/Report/PrintableReport.asp?BusinessId=5491891&PrintReport=Y&... 6/4/2009
22. CreditRiskMonitor Report for Rhodia SA Page 22 of 26
Income Statement - Sequential Quarters - Standardized
(Thousands of Euros)
3 mos 3 mos 3 mos 3 mos 3 mos
Period Ended
3/31/2009 12/31/2008 9/30/2008 6/30/2008 3/31/2008
Revenue:
Revenue €920,000 €1,126,000 €1,224,000 €1,227,000 €1,186,000
Other revenue, total 146,000 170,000 122,000 107,000 151,000
Total revenue 1,066,000 1,296,000 1,346,000 1,334,000 1,337,000
Operating Expense:
Cost of revenue, total 991,000 1,096,000 1,124,000 1,080,000 1,082,000
SG&A expenses, total 122,000 108,000 118,000 119,000 137,000
Research & development 18,000 21,000 15,000 17,000 20,000
Unusual income/expense 20,000 34,000 0 4,000 2,000
Other operating expenses, total 6,000 23,000 2,000 (1,000) 3,000
Total expense 1,157,000 1,282,000 1,259,000 1,219,000 1,244,000
Operating income (91,000) 14,000 87,000 115,000 93,000
Non-Operating Expense/Income:
Interest/investment income, non-
5,000 (9,000) 2,000 2,000 1,000
operating
Other, net (50,000) (29,000) (46,000) (57,000) (43,000)
Income before tax (136,000) (24,000) 43,000 60,000 51,000
Income tax - total (8,000) (3,000) 21,000 26,000 11,000
Income after tax (128,000) (21,000) 22,000 34,000 40,000
Minority interest 1,000 (1,000) 0 (1,000) 0
Extraordinary Items:
Total extraordinary items (7,000) (6,000) 34,000 2,000 2,000
Net income (€134,000) (€28,000) €56,000 €35,000 €42,000
Supplemental and Per Share Items:
Basic/primary EPS incl. extra. items (€1.35) (€0.28) €0.55 €0.35 €0.42
Diluted EPS incl. extra. items (€1.35) (€0.28) €0.55 €0.34 €0.41
Depreciation/amortization,
€75,000 €77,000 €79,000 €69,000 €74,000
supplemental
Interim Interim Interim Interim
ARS
Source: Report Report Report Report
3/25/2009
5/6/2009 11/6/2008 7/30/2008 5/7/2008
NOTE: This is a French company whose reported financial statements are denominated in Euros and whose current financial
statements are reported under International Financial Reporting Standards.
http://www.crmz.com/Report/PrintableReport.asp?BusinessId=5491891&PrintReport=Y&... 6/4/2009