Downloaded 59 times
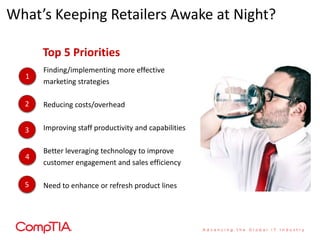
![Covering the IT Basics [Before the Fun Stuff]
Micro Small Medium Large
Technologies in Place at Retailers Overall Retailers Retailers Retailers Retailers
Desktop or laptop PC 93% 92% 92% 95% 92%
Multi-function Printer 82% 83% 81% 80% 85%
Broadband (aka high speed Internet) 72% 70% 77% 71% 67%
Data back-up (on-site or online) 67% 56% 73% 66% 78%
Network (LAN, WAN) 59% 40% 62% 66% 85%
WiFi 57% 57% 54% 54% 66%
Smartphone 56% 51% 55% 57% 64%
Inventory management system or application 53% 31% 59% 62% 74%
Customer relationship management (CRM) system or
34% 17% 35% 45% 59%
application
Tablet (e.g. iPad, Playbook, etc.) 32% 23% 30% 45% 46%
Micro retailers = 1-9 staff
Small retailers= 10-99 staff Source: CompTIA’s Retailer Technology Adoption Trends study
Medium retailers = 100-499 staff Base: 500 U.S. retailers
Large retailers = 500+ staff](https://image.slidesharecdn.com/comptiaretailsectortechadoptionv1-120913163743-phpapp01/85/Retail-Tech-Adoption-7-320.jpg)
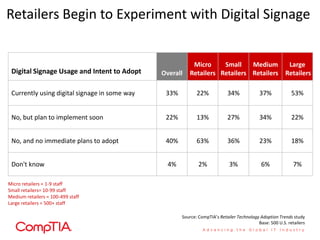
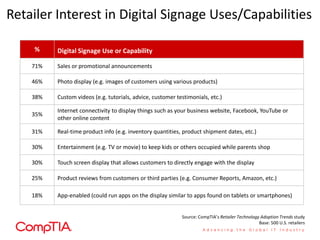
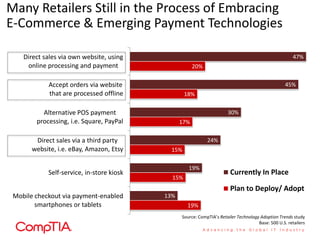
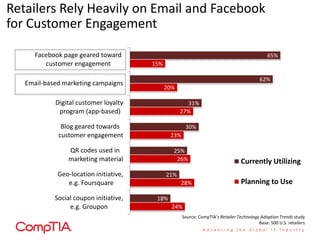

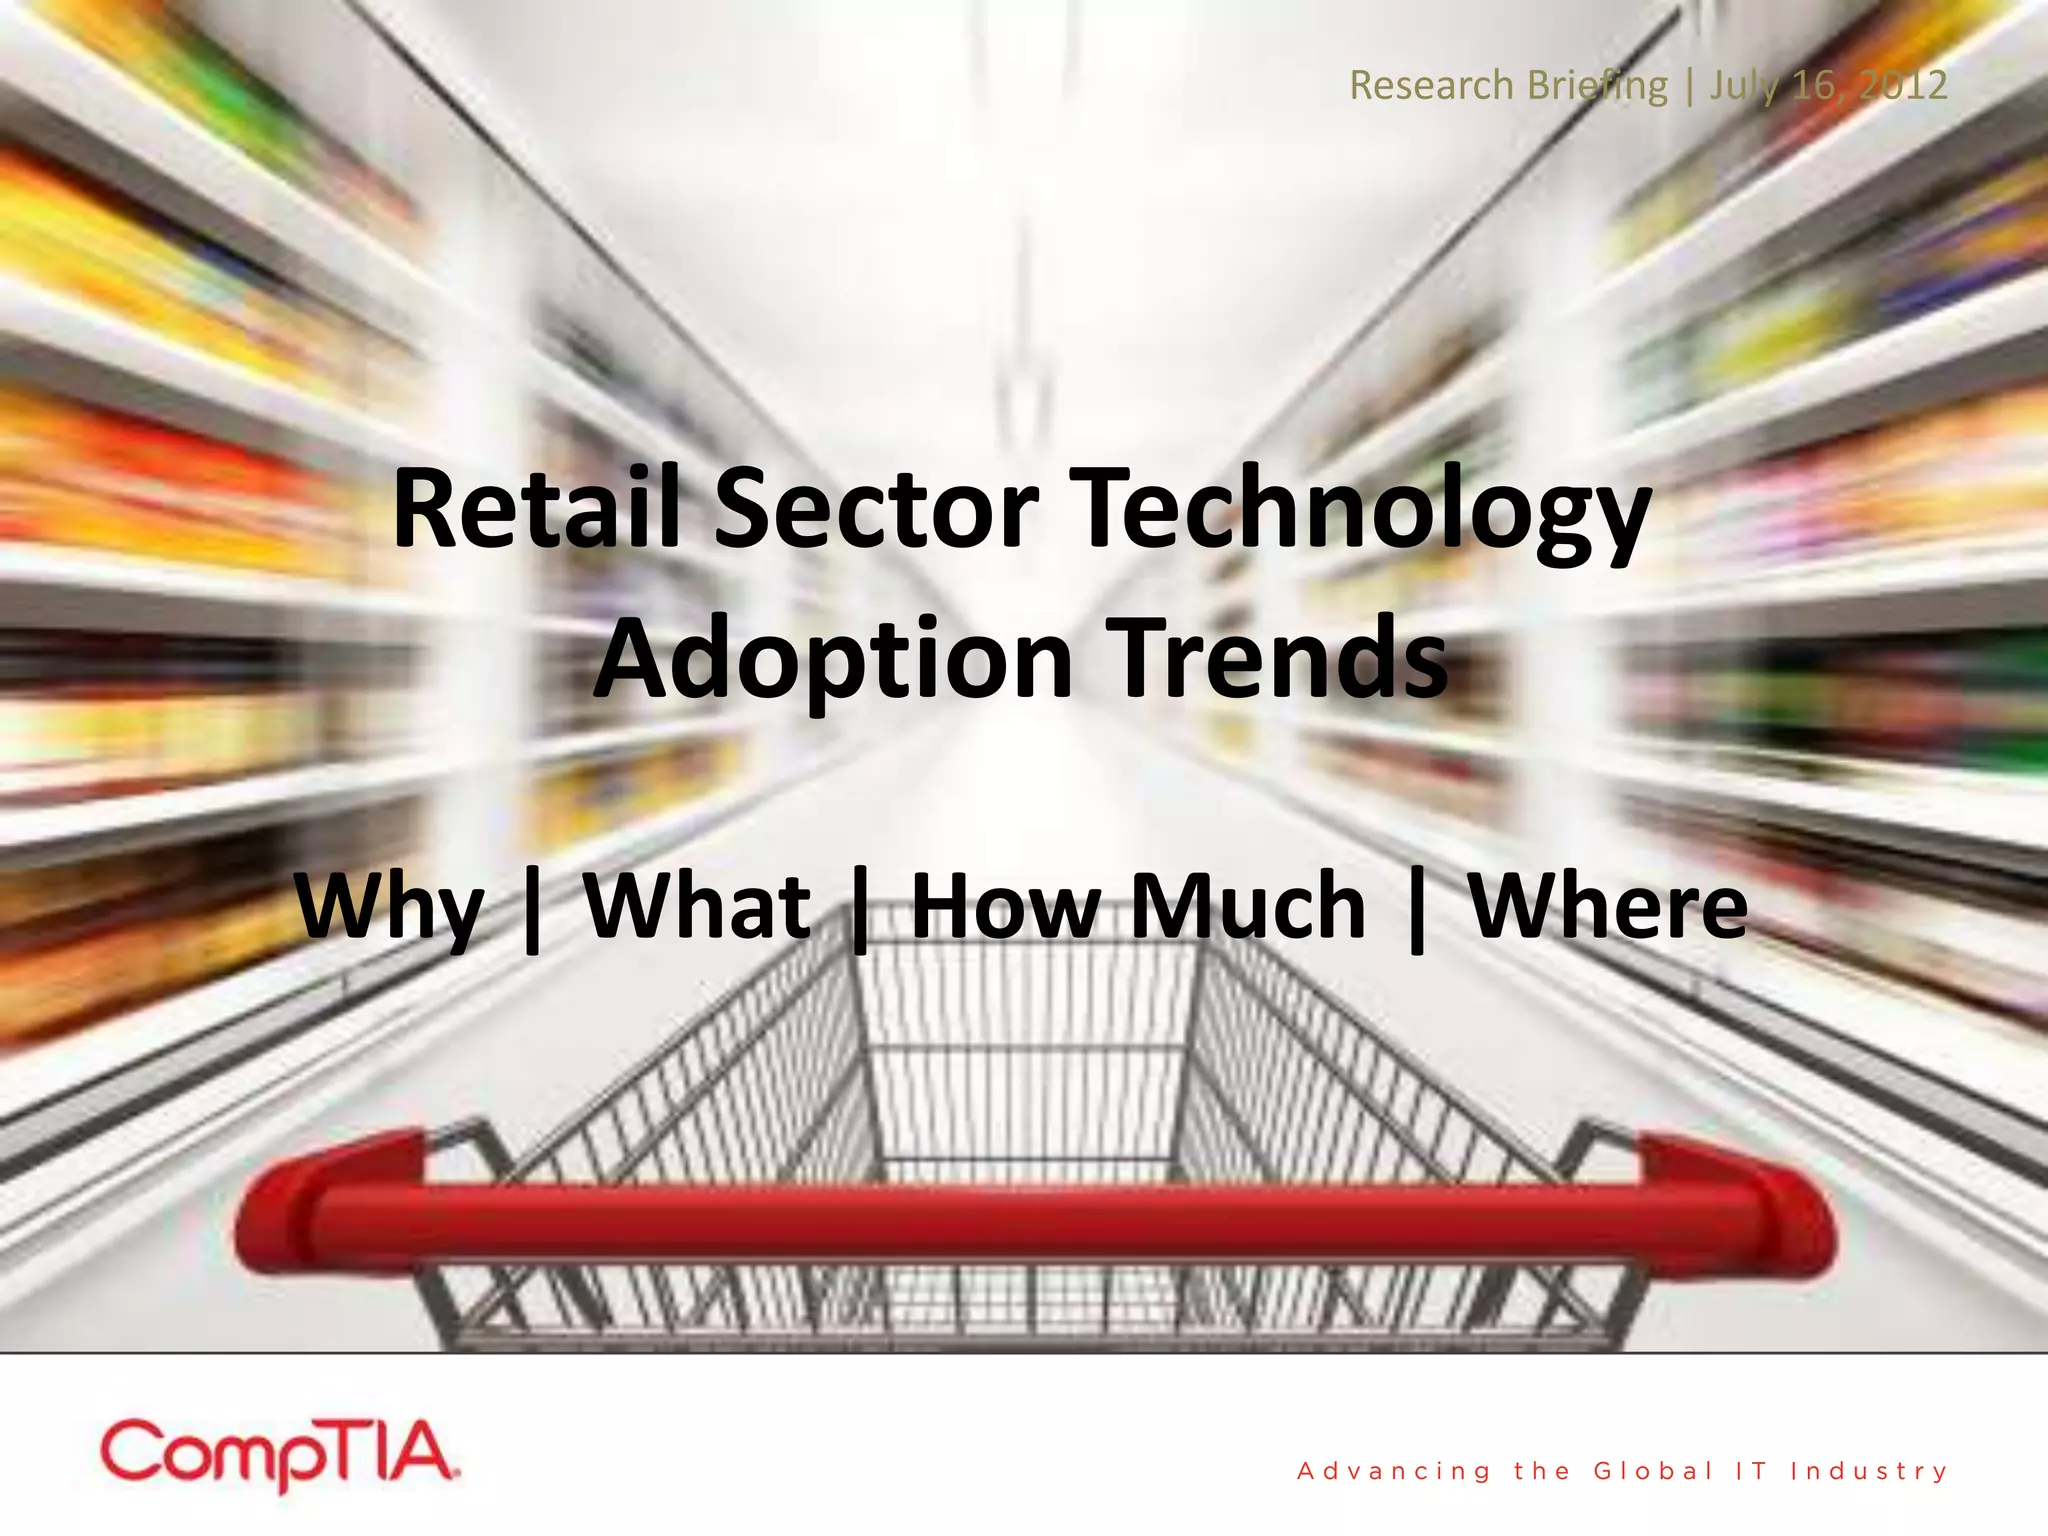
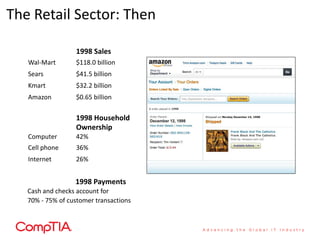
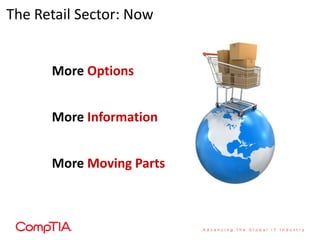
This document provides an overview of technology adoption trends in the retail sector from 1998 to 2012. It summarizes that in 1998, Walmart and Sears were the top retailers by sales, most households owned computers and cell phones but internet adoption was still low, and cash and checks accounted for most retail transactions. By 2012, retailers had more options for sales channels, customer data collection, and payment methods due to advancing technologies. However, many retailers still lagged in fully utilizing technologies and data analytics to improve customer engagement and operations. The document examines specific technologies retailers have adopted, as well as challenges around showrooming, spending priorities, and the role of IT providers and managed services.


